Article

Improving the Sustainability of Transportation: Environmental and Functional Benefits of Right Turn By-Pass Lanes at Roundabouts

Polytechnic School, University of Palermo, Viale delle Scienze, Ed. 9, 90128 Palermo, Italy
*
Author to whom correspondence should be addressed.
Sustainability 2015, 7(5), 5838-5856; https://0-doi-org.brum.beds.ac.uk/10.3390/su7055838
Submission received: 16 April 2015 / Revised: 5 May 2015 / Accepted: 7 May 2015 / Published: 12 May 2015
(This article belongs to the Section Sustainable Urban and Rural Development)

Abstract

:
The functional performances of conventional roundabouts (single-lane and multi-lane) and innovative roundabouts (spiral, flower, C and turbo) can be improved through right-turn bypass lanes controlled by stop, yield or free-flow signs. The article presents evaluations of the emissions of air pollutants (carbon dioxide, nitrogen oxides, particle pollution (PM10 and PM2.5)), fuel consumption and construction, management, energetic and environmental costs in roundabouts without or with bypass lanes (controlled by stop, yield or free-flow). The suggested methodology has a general character and can be applied as a multi-parametric criterion for choosing road intersections, although, in the present paper, it has been employed only for a case study. For the aims of this research, we employed recent closed-form formulations to determine roundabout performances; moreover, we used the COPERT IV® software to estimate air emissions in nine different types of vehicles. Numerous traffic simulations were carried out. The variation in the maximum hourly traffic Qmax and annual traffic QTOT provided the appropriate domains of the examined geometric layouts, both in functional and environmental terms and with regard to generalized costs, estimated for a 10-year period. It resulted that the introduction of right-turn bypasses in all arms of conventional roundabouts with a one ring lane and one lane at the entries (single-lane roundabouts) is the most cost-effective when the flows entering the roundabout are higher than Qmax = 2000 veh/h. Moreover, free-flow bypass lanes always provide greater capacity and lower delays than stop- or yield-signaled bypasses. However, with extremely high Qmax values, stop-controlled bypasses guarantee lower fuel consumption, while those with a yield sign lower total costs.

1. Introduction

Sustainability is an essential research area in transportation, because of the correlation between transportation, economic and environmental systems [1]. Sustainable mobility in an urban context requires a set of coordinated interventions aimed at improving the energy efficiency of the transport network [2]. Transport demand and supply are always affected, and reflected, by the extent of urbanization and the activity of development of cities [3].
In recent years, a very important topic for the sustainability of transportation has concerned how to increase the performances of at-grade road intersections, above all in the urban context.
The capacity of intersections can be increased by implementing right-turn bypass lanes [4] (cf. Figure 1). These additional lanes can also be installed at conventional roundabouts and at more recently designed roundabouts, such as turbo-roundabouts [5,6,7,8], C-roundabouts [9], target-roundabouts [10] and flower-roundabouts (the layout of the latter is just characterized by bypass lanes at each arm [11]).
Figure 1. Bypass lane at a conventional roundabout.
Sustainability 07 05838 g001
Right-turn bypasses increase conflict points between vehicles and between vehicles and pedestrians/cyclists [12,13,14,15] and, to a modest extent, the number of accidents [16]. Thus, their use is appropriate whenever cycle/pedestrian flows appear to be much reduced [17]. Of particular interest for designing bypass lanes are the Polish guidelines [18] and the National Cooperative Highway Research Program (NCHRP) Report 672, “Roundabouts: An Informational Guide” [19]. In addition, a critical review of the Australasian, EU and U.S. roundabout standards and guidelines is performed by Montella et al. [20]. Estimations of right-turn bypass capacity were carried out through closed-form models by Tracz [21,22] and by Mauro and Guerrieri [15].
Other authors evaluated MOE (measures of effectiveness) in bypasses through traffic simulations by means of specific software, such as Kreisel, Vissim, Sidra and others [23].
The implementation of bypass lanes can bring environmental and energetic benefits, in that they reduce vehicle delays and, hence, pollutant emissions to the air [24,25,26].
In light of all of this, this research develops a new multi-parametric approach for the generalized cost analysis [27] of bypasses at roundabouts; such an approach can also serve as a criterion for choosing the appropriate type of bypass that may respond to the specific traffic demand.
More specifically, the following parameters were examined: construction costs, costs due to vehicle delays, environmental costs imputable to pollutant emissions from vehicular traffic and energetic costs (i.e., vehicle fuel consumption). For the aims of this research, we paid attention to bypasses controlled by stop or yield signs or with an acceleration lane. The comparison was made between conventional single-lane roundabouts with or without bypasses in numerous traffic conditions.
The estimation of roundabout entry capacity was conducted through the model described in the Highway Capacity Manual (HCM, 2010) [28]; bypass capacity was obtained with the formulations of Tracz [21,22] and Mauro [15]; the lane-by-lane approach was used [29]. Finally, emissions and consumption were measured with the aid of the COPERT IV® software [26,30].
The suggested methodology, here only referring to a case study regarding roundabouts with a one ring lane, with or without bypasses (four layouts examined in total), has a general character and can therefore be applied to innovative roundabouts, but also to conventional multilane roundabouts.
The paper is organized as follows: Section 2 presents the capacity of roundabouts with right-turn bypass lanes; Section 3 presents the bypass capacity; Section 4 presents the determination of the consumption and emissions in a roundabout; Section 5 presents the analysis of the bypass’ overall costs; and Section 6 presents the conclusions.

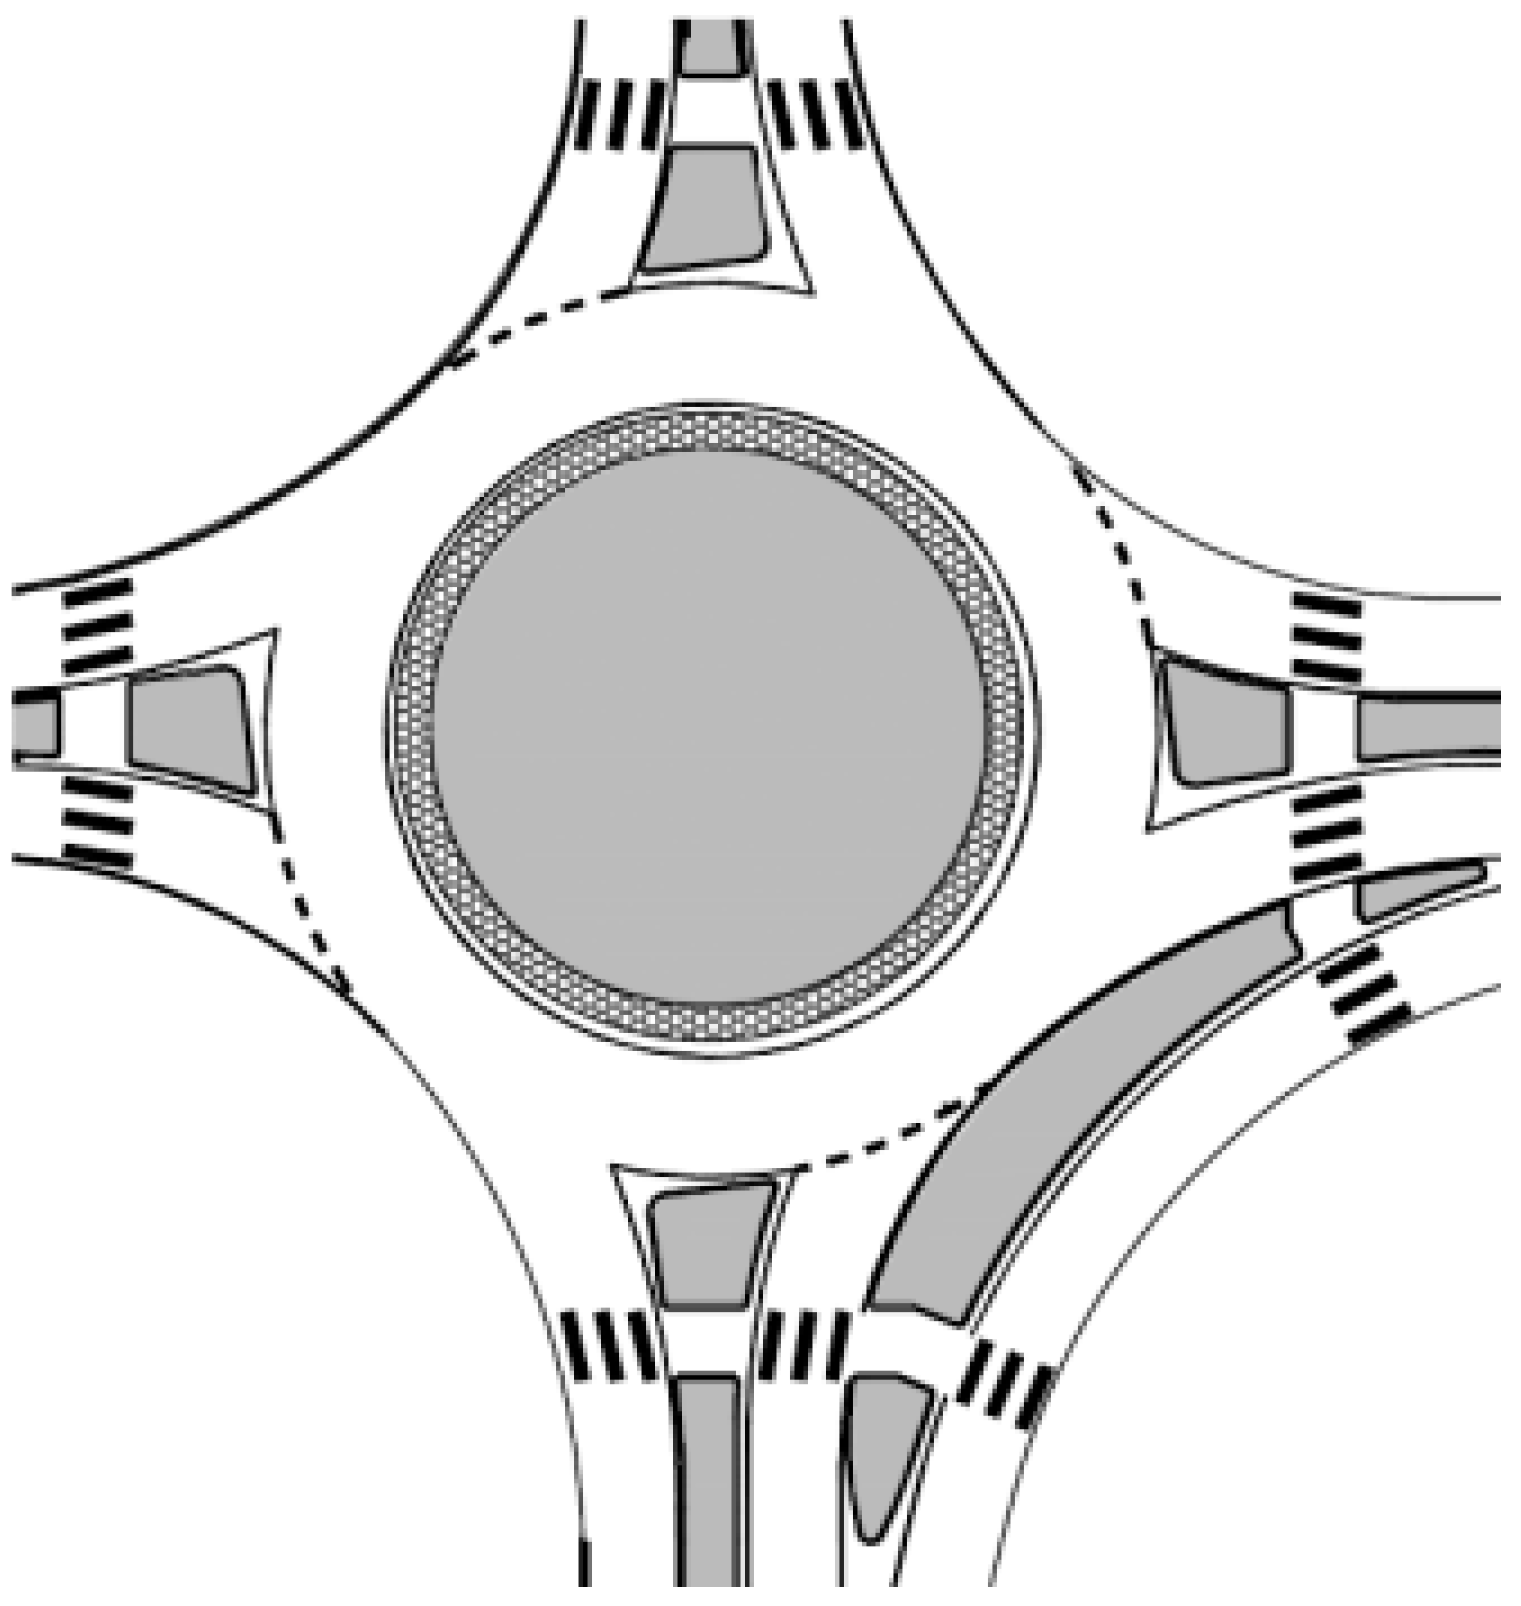
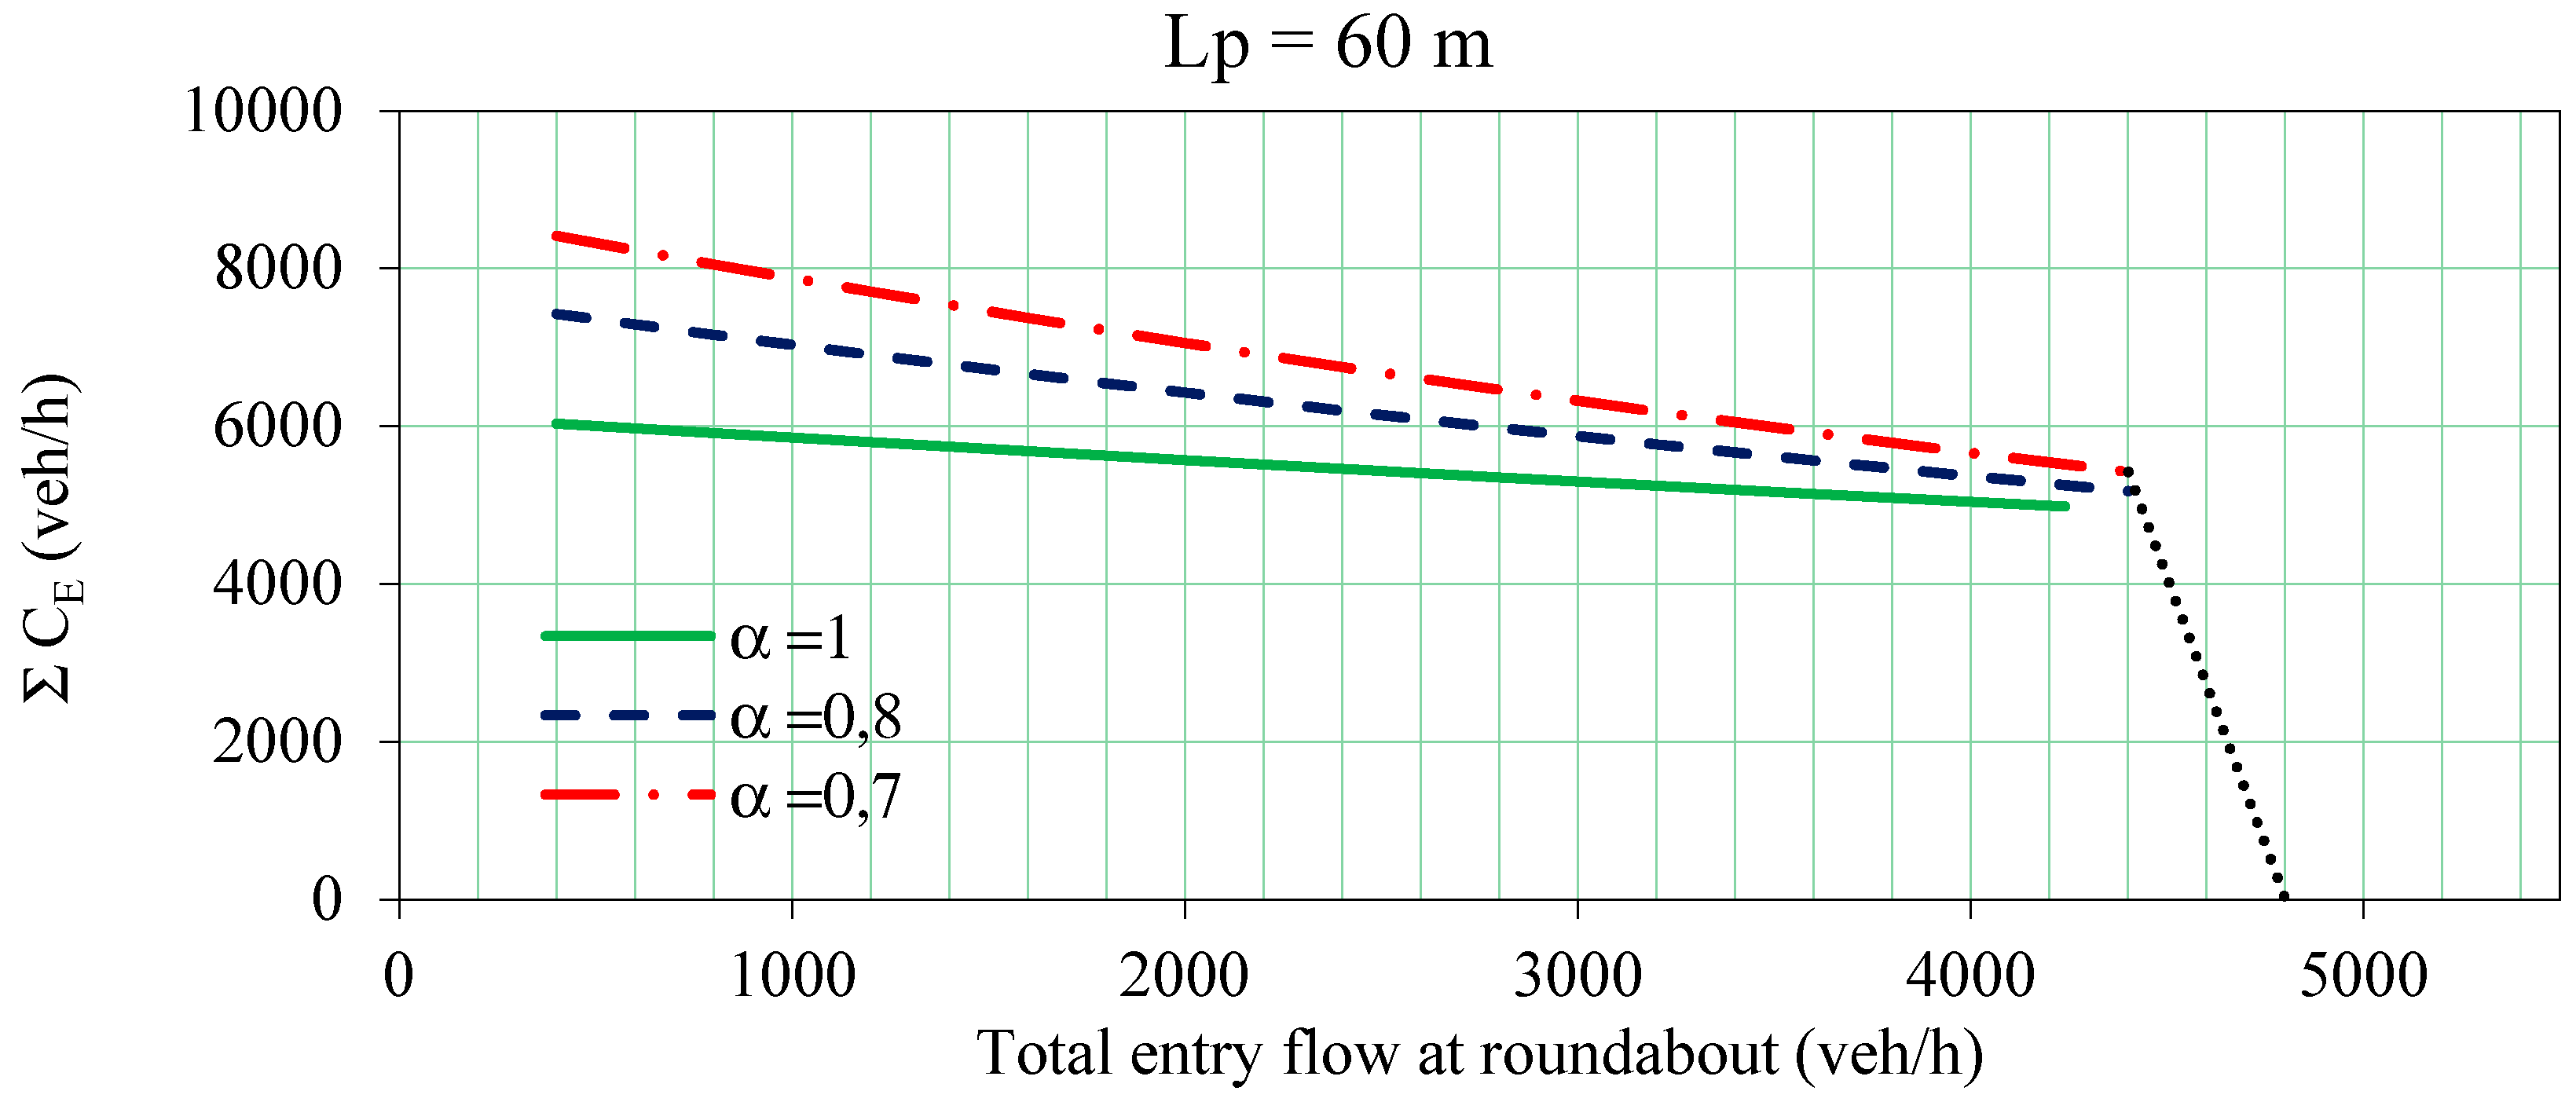
2. Capacity of Roundabouts with Right-Turn Bypass Lanes

Right-turn bypass lanes suitable for roundabouts can be classified according to the type of traffic flow regulation as follows [23]:
  • stop-controlled bypass lanes;
  • yield-controlled bypass lanes;
  • free-flow bypass lanes (i.e., with an acceleration lane).
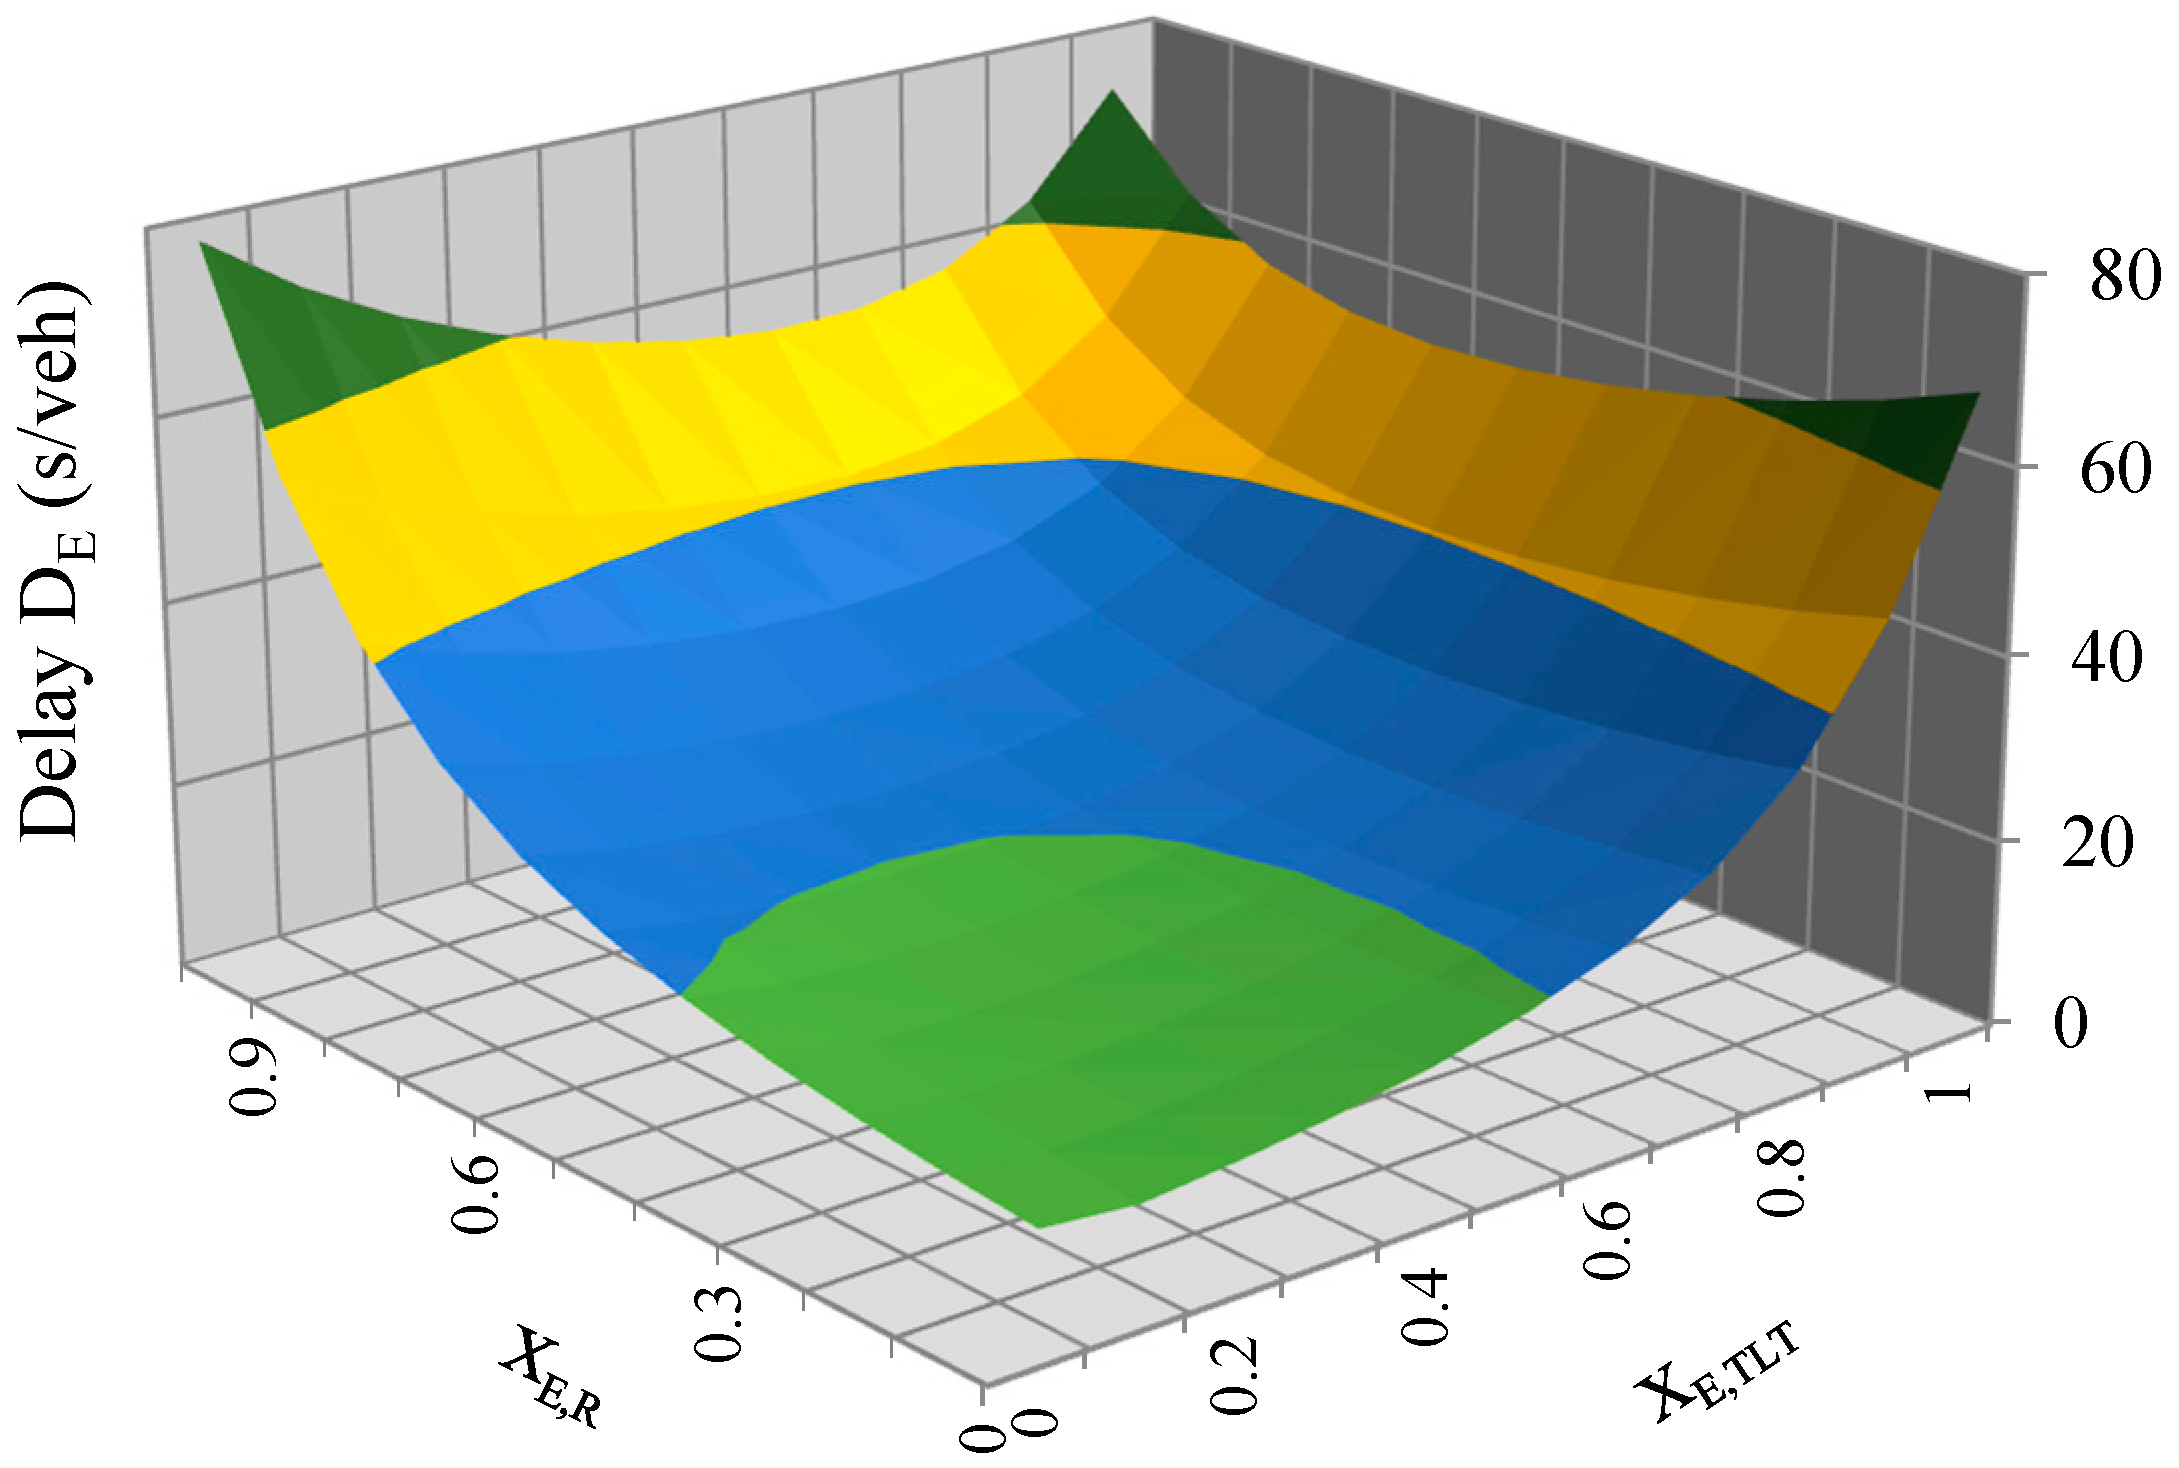
It was shown that entry capacities at roundabouts equipped with right-turn bypasses can be determined through the following relations [15]:
C E = ( Q E , R + Q E , T L T ) max [ α Q E , R C E , R , Q E , T L T + β Q E , R C E , T L T ]
{ Q E,R bypass =    α Q E,R Q E,R no-bypass   =    β Q E,R 0 α 1 0 β 1 α + β = 1
where: QE,R = total right-turn flow (veh/h); QE,Rbypass = right-turn flow involving the bypass (veh/h); QE,Rno-bypass = right-turn flow non-involving the bypass (but the ring) (veh/h); CE,TLT = entry capacity at a roundabout (veh/h); CE,R = capacity of the right-turn bypass lane (veh/h); α and β = distribution coefficients of the right-turn flow.
The bypass capacity CE,R firstly depends on the type of entry regulation (entry control type). Indeed, for the purpose of this research, the entry capacity to the ring carriageway was obtained with the relevant formulation described in the HCM 2010 Manual [28].
In any case, we observed that the total capacity CE of the arm (see Equation (1)) cannot be determined as a simple sum of the entry lane capacities to the ring carriageway (CE,TLT) and the bypass capacity (CE,R) [31]. In fact, Equation (1) shows that it depends on the combination of entry flows (through coefficients α and β) and the saturation degrees of both lanes (flow/capacity ratio: xE,R = QE,R/CE,R e xE,TLT = QE,TLT/CE,TLT).

3. Bypass Capacity

Right-turn bypasses can have three different types of regulation of traffic flows entering the roundabout exit arm (with stop, yield and free-flow signs). The capacity can be obtained with the following formulations.

3.1. Bypass with a Stop Sign

In the typical hypothesis of Poissonian vehicle arrivals at the bypass, with any service time s and vehicle headway τ (on the lane exiting from the roundabout) distributed like a Gamma random variable with parameter K (K = 1 if 100 ≤ Q ≤ 300 veh/h; K = 2 if 400 ≤ Q ≤ 800 veh/h; K = 3 if 800 ≤ Q ≤ 1,500 veh/h K = 4 if 1500 < Q ≤ 1,800 veh/h), the bypass lane capacity estimated just at the stop line is equivalent to:
C E , R = 1 T + e K Q T i = 0 K ( K Q T ) i i ! Q i = 0 K 1 ( K Q T ) i i !
T = V 2 a + 2 δ
where: T = critical gap (s); Q = QuTot = exiting flow from the roundabout (veh/h). Furthermore, V is the vehicle speed on QuTot, and a the acceleration by which QE,Rbypass vehicles enter the flow QuTot. δ is the safety time interval between the vehicles of this flow, equal to the perception-reaction time δ = 1 s.
V can be calculated through the procedure shown in the NCHRP Report 672, “Roundabouts: An Informational Guide” [19], as a function of the deflection radius of the vehicle trajectories.
For T = 5.5 s from Equations (3) and (4), we can obtain the stop-controlled bypass lane capacity CE,R as follows:
C E , R = 1231.4 e 0.0012 Q u T o t
In the previous hypothesis, it is also possible to obtain the average number of queuing vehicles E[q] (cf. Equation (6) ÷ Equation (9)) and, thus, to properly measure the length of the storage section Ls of the bypass (see Equation (10) and Figure 2):
b = 1 C bypass
V ( s ) = ( K + 1 ) [ e KQT i = 0 K + 1 ( KQT ) i i ! ] K Q 2 i = 0 K 1 ( KQT ) i i !
E [ w ] = Q E , R bypass b + Q E , R bypass 2 ( b 2 + V [ s ] ) 2 ( 1 Q E , R bypass b )
E[q] = QE;Rbypass · E[w]
Ls = c · E[q]
in which: Q = QuTot; V[s] = service time variance; E[w] = average queuing time; c = average headway between two subsequent vehicles.
Figure 2. Bypass layout (with a stop or yield sign).
Sustainability 07 05838 g002
Figure 3 shows, for example, the expected number of queued vehicles when the capacity varies at the stop-controlled bypass lane and at the roundabout exit lane (Qu = QuTot) according to exit flow speed V1 = 30 km/h. It is worth pointing out that when the exit flow speed increases, the queue length increases more than proportionally. Since vehicles in the flow QuTot, exiting from the roundabout, tend to increase their speed to reach the desired speed, it is thus necessary to verify the entry (stop or yield line) just at the outer circumference of the ring.
Figure 3. Values of queue (V1 = 30 km/h).
Sustainability 07 05838 g003

3.2. Right-Turn Bypass Lane with a Yield Sign

Should a bypass be controlled by a yield sign, the capacity can be obtained by the following relation [19]:
C E , R = 1130 e 0.001 Q u T o t

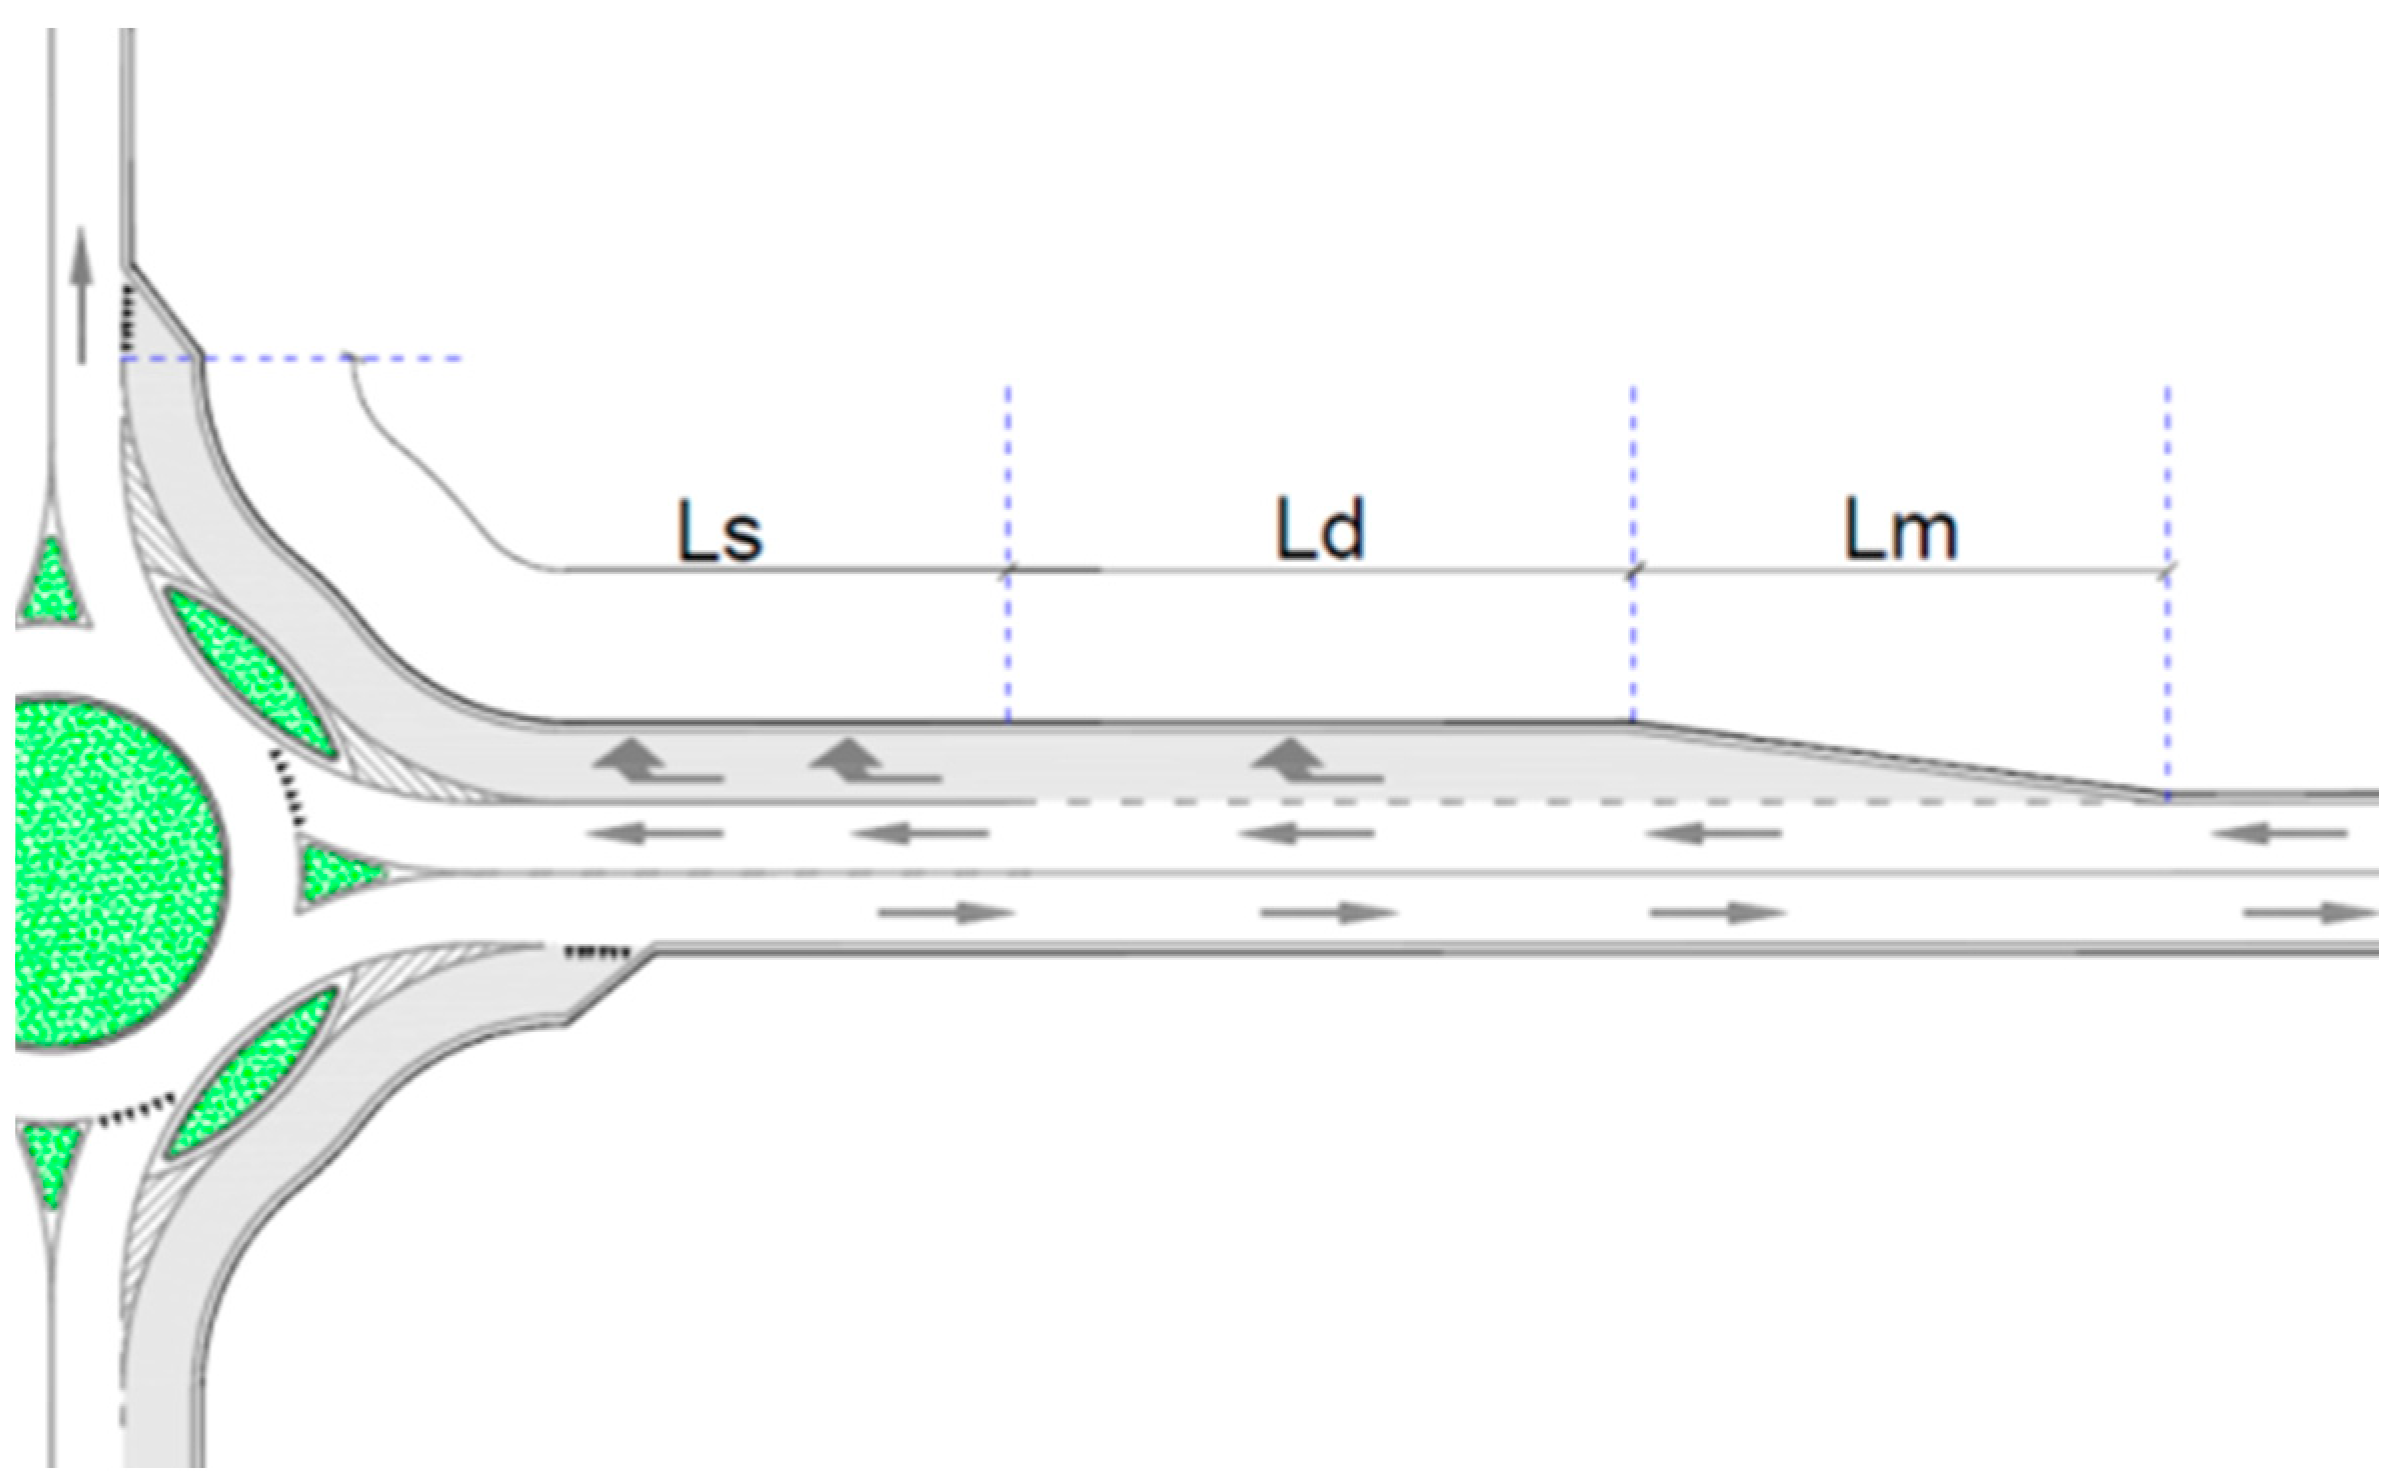
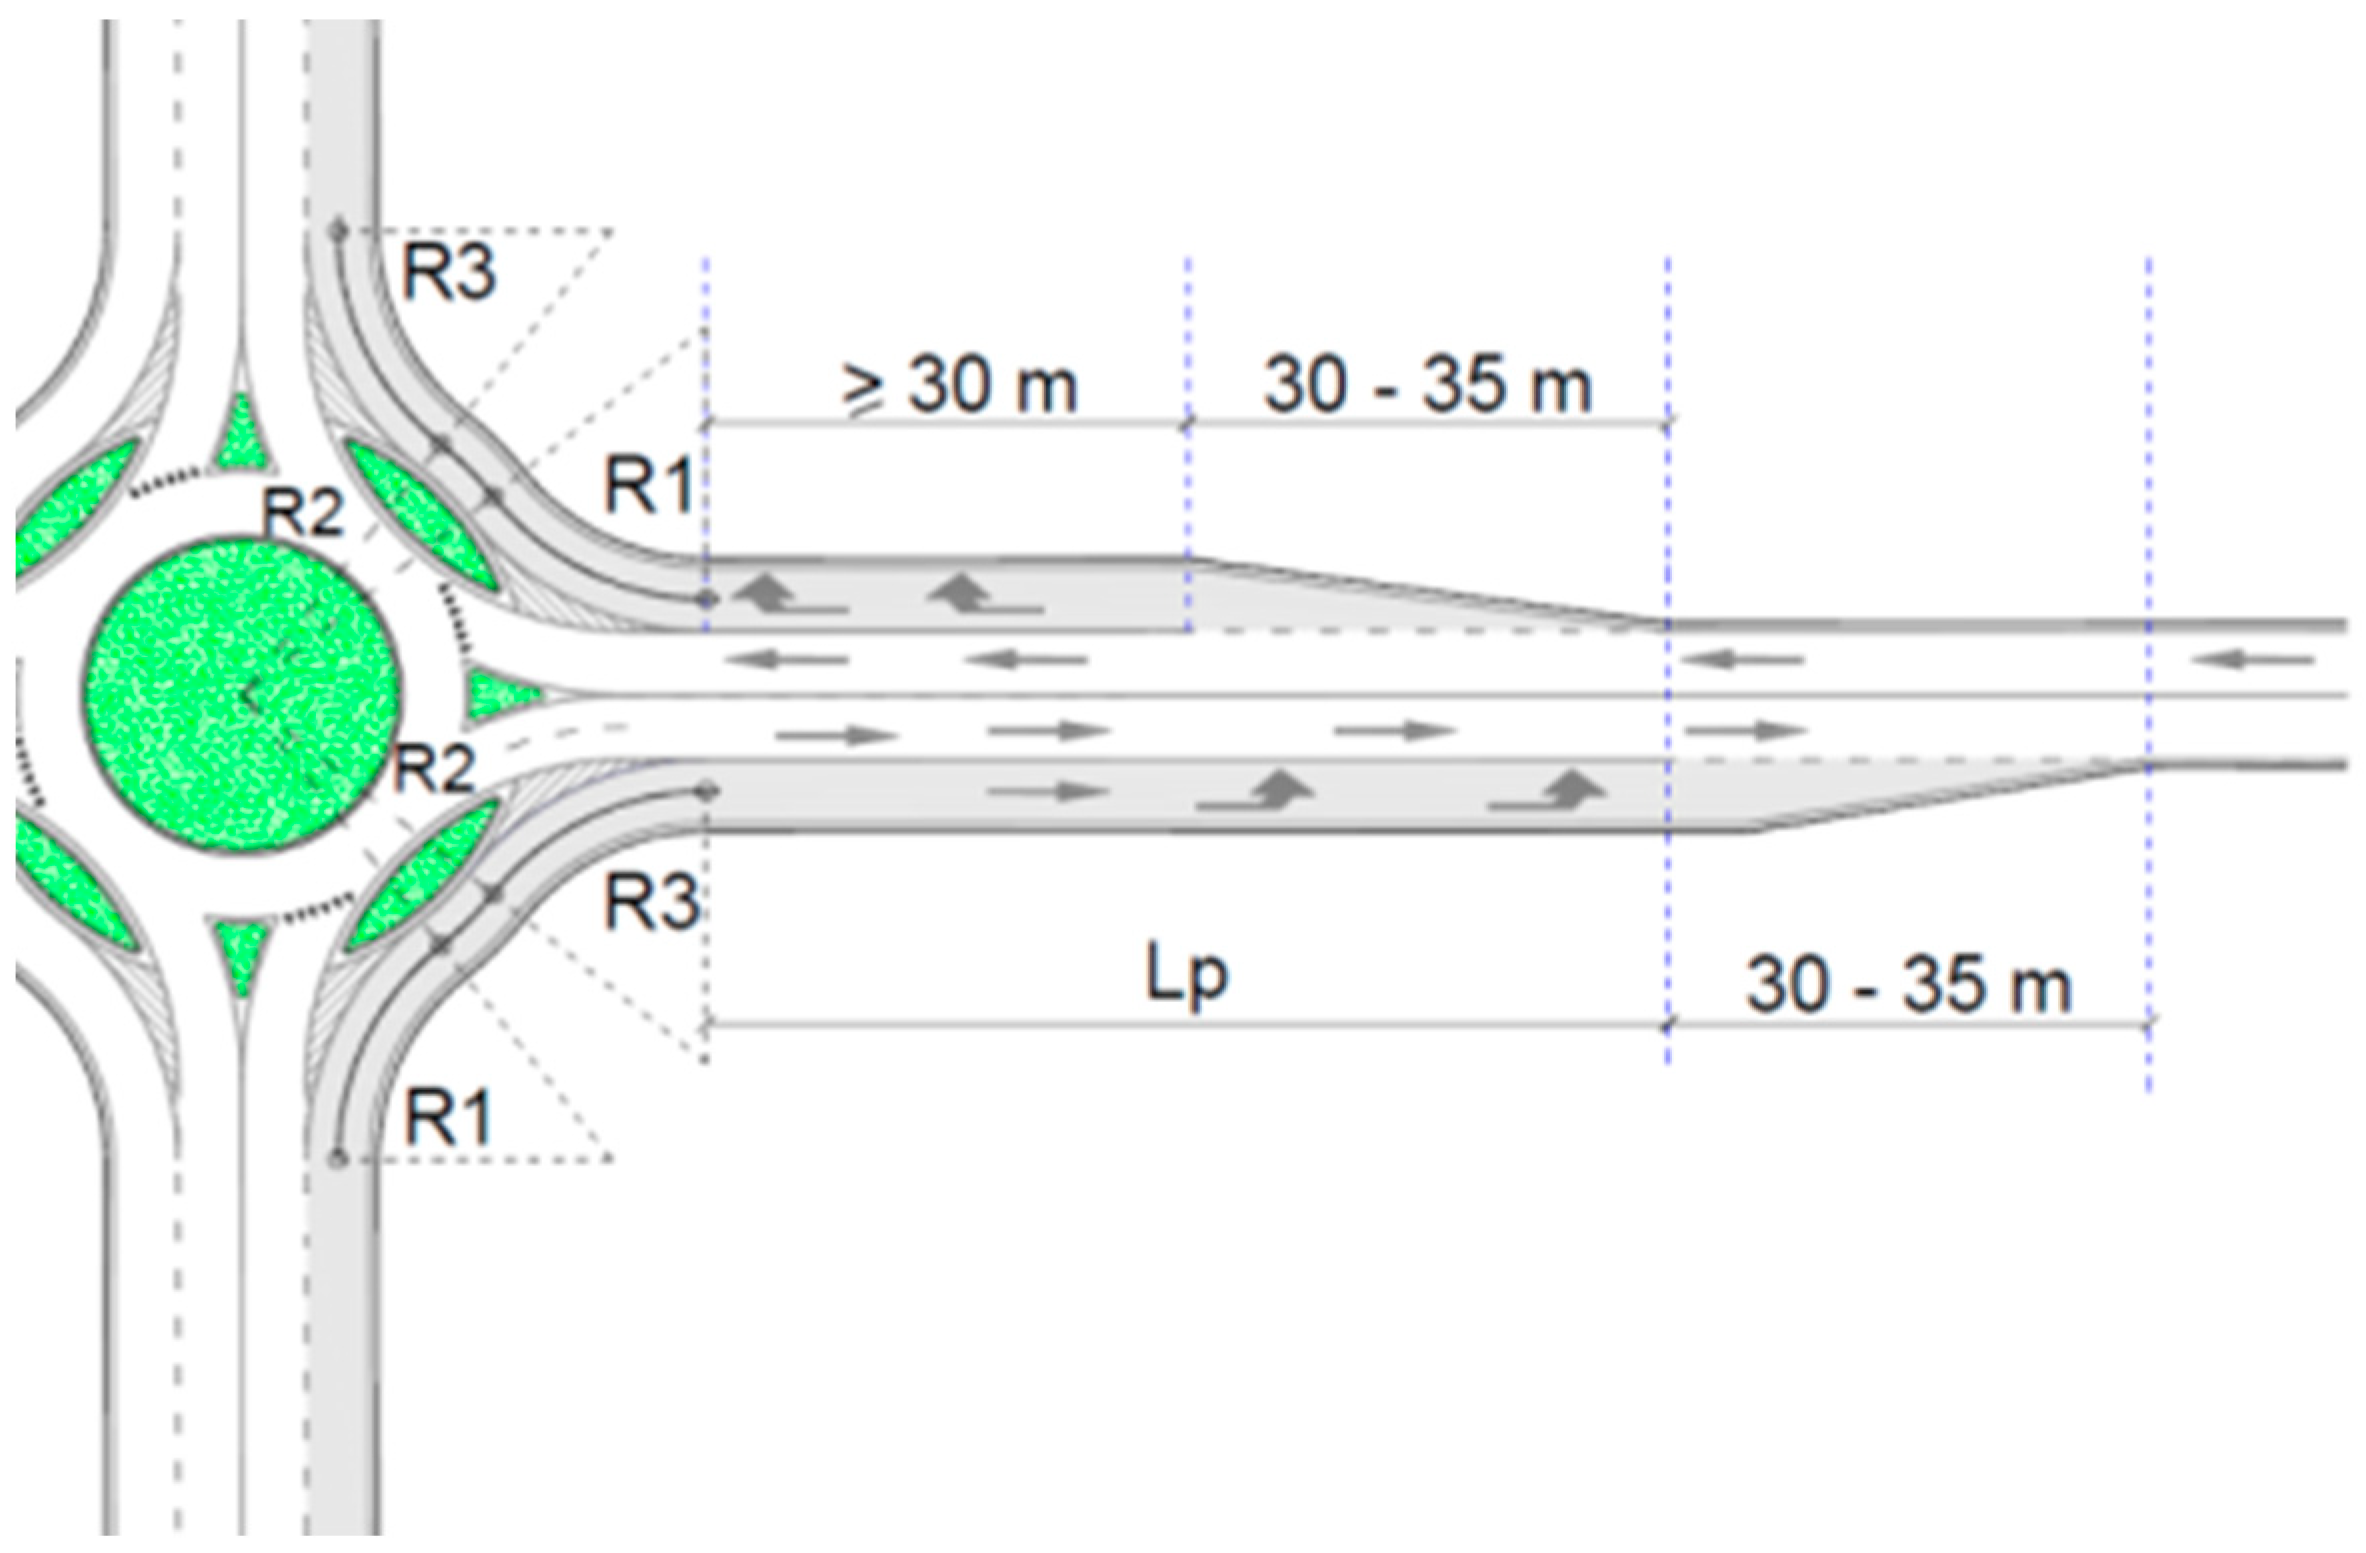
3.3. Free-Flow Bypass Lane

The following capacity relationship (Equation (12)) was obtained from Tracz [21,22] for free-flow bypass lanes (cf. Figure 4) at single-lane roundabouts:
C E , R = 1250 e 0.0007 Q u T o t
Figure 4. Layout of a free-flow bypass lane (Polish guidelines).
Sustainability 07 05838 g004
Figure 5 shows the capacity laws for the three types of bypass lanes under analysis.
Figure 5. Bypass capacity laws (source: [15]).
Sustainability 07 05838 g005
Finally, the entry capacity at a single-lane roundabout (one lane at entries and one at the ring carriageway) can be determined with numerous models [32]. This research used the following Equation (13) [28], in which Qc stands for the circulating flow in front of the entry in question:
CE,TLT = 1130·e−0.0001·Qc
Figure 6 shows the variation in the sum of the entry simple capacities (CE) of four-arm roundabouts with right-turn bypass lanes (with a total length of 60 m) at each intersection arm under varying total entry flow and distribution coefficient for the right-turn flow α.
The sum of the entry simple capacities clearly tends to increase when the right-turn flow partly does not use the bypass lane (α ≠ 1).
Figure 6. Sum of the entry simple capacities of a roundabout with bypass lanes (source: [15]).
Sustainability 07 05838 g006
If the roundabout is located in an urban area and it is necessary to estimate the effect of pedestrian flows on entry lane capacities and right-turn bypasses, we can use the model described by Brilon [33] and by Mauro and Guerrieri [15].
The presence of heavy-duty vehicles can reduce capacity at entries. If such an effect needs to be assessed, the flow rate for each movement may be adjusted to account for vehicle stream characteristics using factors and equations given in HCM 2010 [28] and in NCHRP Report 672 [19].
As regards vehicle delays at a roundabout, for the aims of this research, we properly adjusted and used the relevant formulations in the HCM 2010 Manual for the cases under analysis. Therefore, with Equations (14) and (15), it is possible to estimate respectively the average control delay for the right-turn lanes and for the left-turn lanes.
D E , TLT = 3600 C E , TLT + 900 T [ Q E , TLT C E , TLT 1 + ( Q E , TLT C E , TLT 1 ) 2 + ( 3600 C E , TLT ) ( Q E , TLT C E , TLT ) 450 T ] + 5 min [ Q E , TLT C E , TLT , 1 ]
D E , R = 3600 C E , R + 900 T [ Q E , R C E , R 1 + ( Q E , R C E , R 1 ) 2 + ( 3600 C E , R ) ( Q E , R C E , R ) 450 T ] + 5 min [ Q E , R C E , R , 1 ]
where: DE,R = average control delay for the right-turn lane (s/vehicle); DE,TLT = average control delay for through and left-turn lanes (s/vehicle); T = reference time (h) (T = 1 for a 1-h analysis, T = 0.25 for a 15-min analysis).
Generally speaking, since delays differ at the two-arm lanes, the level of service of the right-turn lane needs to be differentiated from the corresponding levels of service at the through and left-turn lanes. The total average delay at entries is expressed by the following equation:
D E = D E , R Q E , R + D E , TLT Q E , TLT Q E , R + Q E , TLT
By way of an example, Figure 7 shows the trend of the control delay DE of an entry into a roundabout with a stop-controlled bypass, obtained as a function of the saturation degrees xE,R = QE,R/CE,R and xE,TLT = QE,TLT/CE,TLT, (for CE,R = 400 veh/h and CE,TLT = 500 veh/h).
Levels of service for every lane and entry can be deduced from the HCM 2010 method [28].
Figure 7. Example of delay at entry (roundabout with a stop controlled right-turn bypass lanes).
Sustainability 07 05838 g007

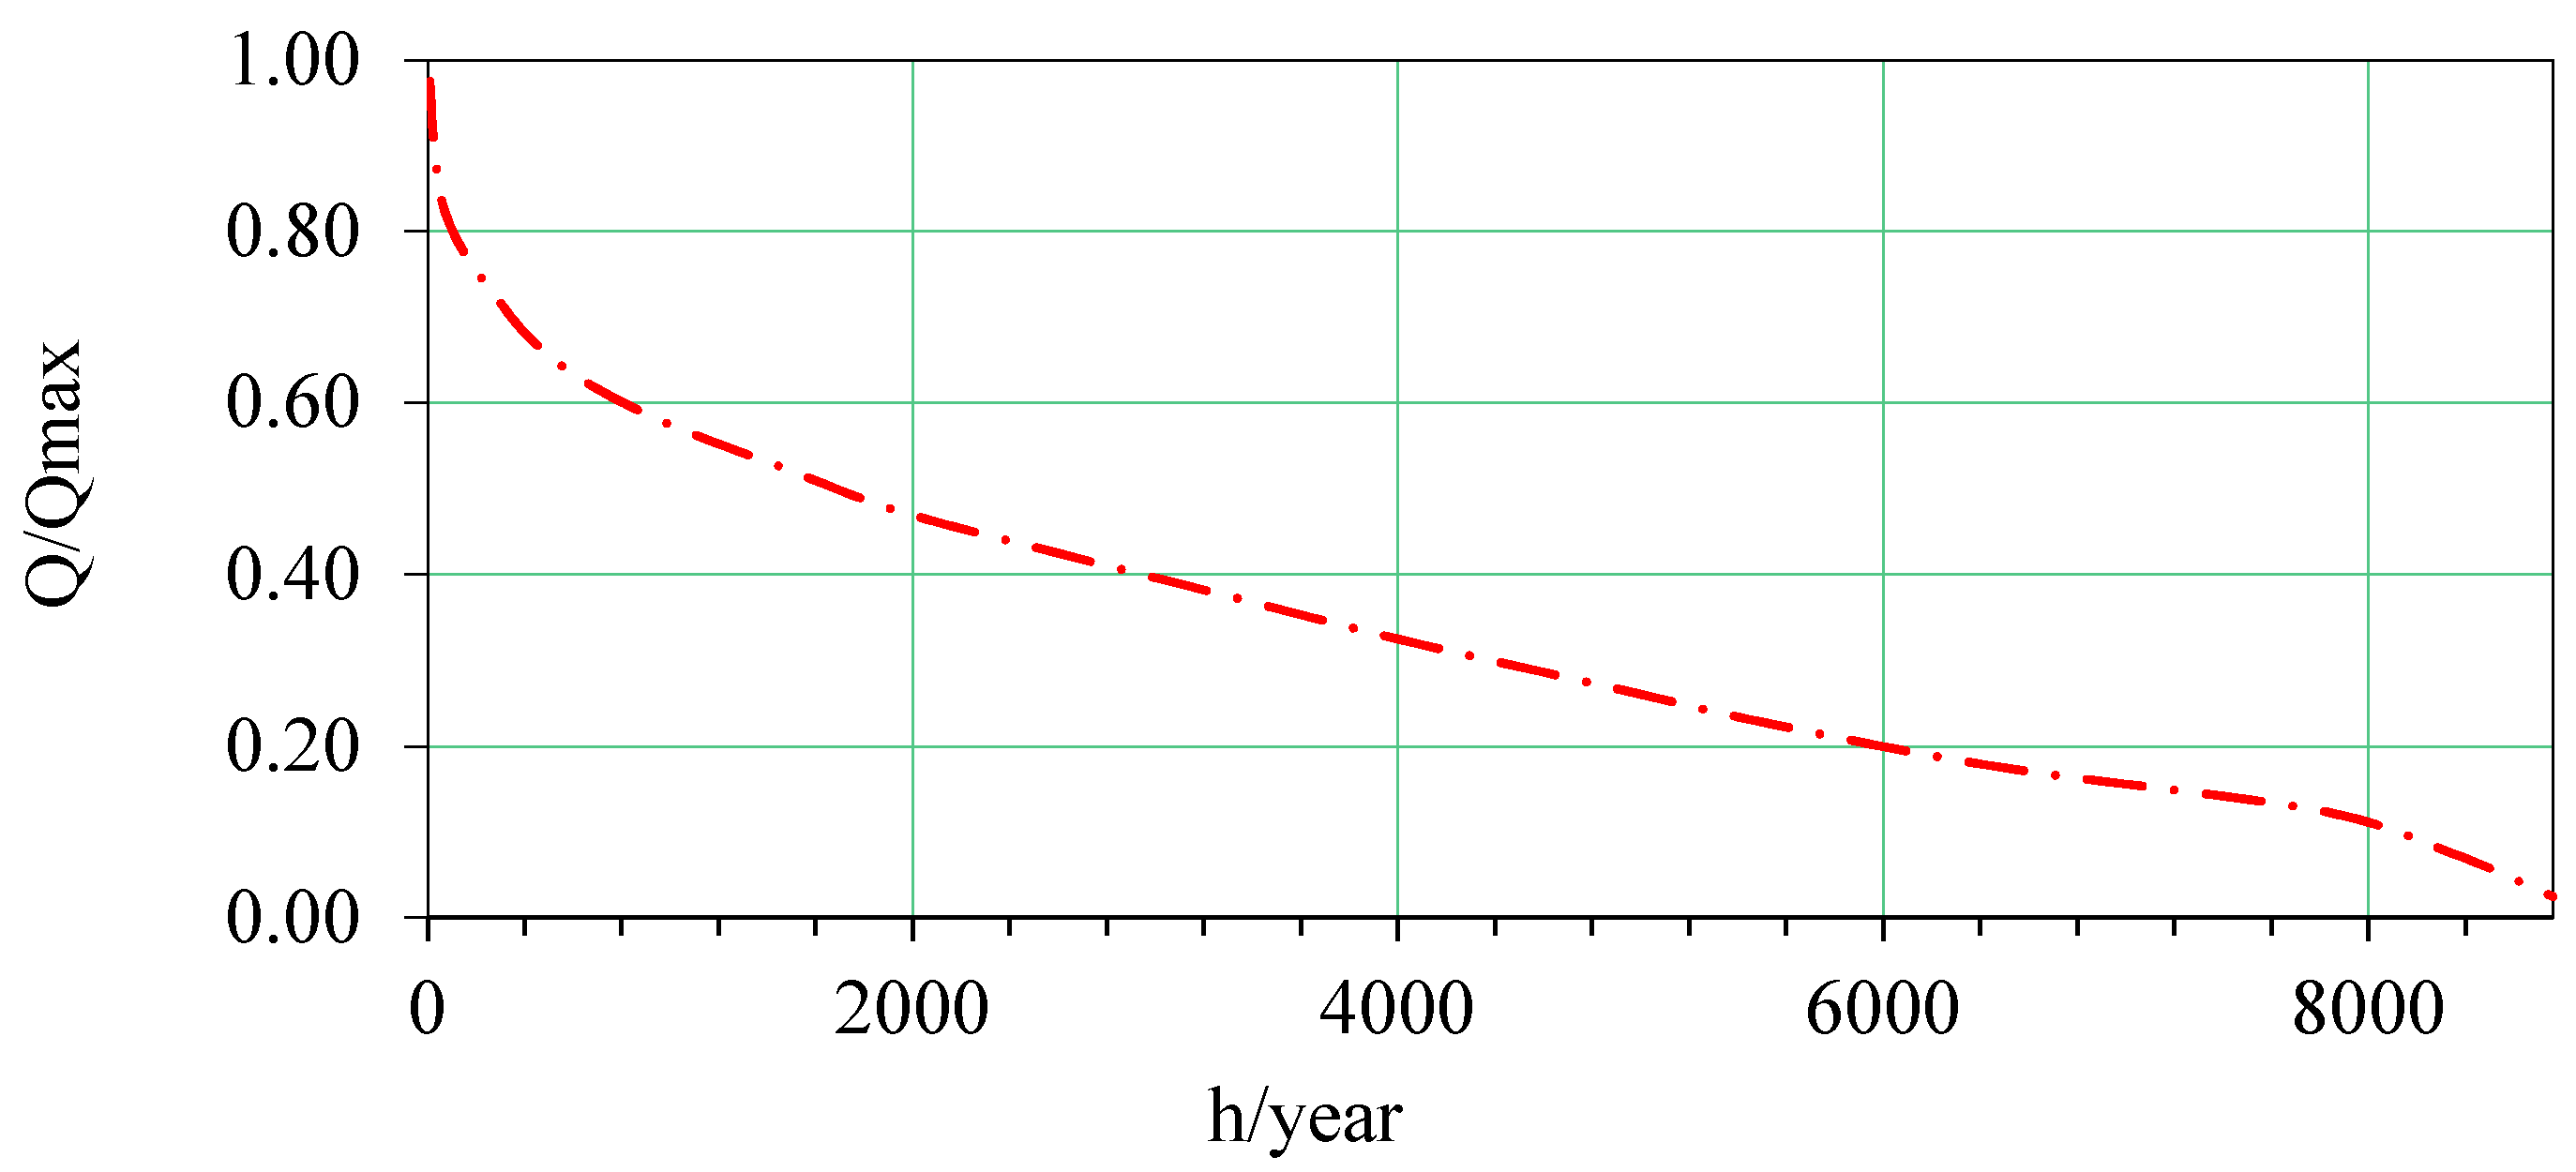
4. Determination of Consumption and Emissions in a Roundabout

Road traffic emissions depend on numerous factors, among which are: flow conditions (average annual daily traffic (AADT), vehicle fleet composition, vehicle age and average speed) [34], acceleration and deceleration phases, infrastructures (geometry, intersection type and traffic regulation) and environmental conditions (temperature, humidity, etc.) [35,36,37,38,39].
Just at road intersections, vehicle movement can be divided into the following elementary steps: cruise, acceleration, deceleration, idling (stopped) time, acceleration and cruise. According to this subdivision, Akҫelick [40] developed the relations implemented in the SIDRA traffic simulation software, which allow one to estimate the fuel consumption rate ft:
{ f t = α + β 1 P T + [ β 2 a P I ] a > 0 for   P T > 0 f t = α for   P T 0 P T = min ( P max ; P C + P G + P I ) P C = b 1 v + b 2 v 3 α = f 1 / 3600
where: ft = instantaneous consumption fuel rate (mL/s); PT = total practice power (kW); Pmax = maximum engine power (kW); Pc = cruise component of total power (kW); PI = inertia component of total power (kW); PG= grade component of total power (kW); G = road grade (percent); MV = vehicle mass (kg); v = instantaneous speed; a = instantaneous acceleration rate (m/s2); α = constant of idle fuel consumption rate (mL/s); fi = constant of idle consumption fuel rate (mL/s); b1 = drag fuel consumption parameter related to rolling resistance (kN); b2 = drag fuel consumption parameter related to aerodynamic drag (kN); β1 and β2 = efficiency parameters.
Of particular interest to estimate road traffic pollutant emissions are the two models: MOVES—MOtor Vehicle Emissions Simulator (official tool recommended by the United States Environmental Protection Agency (U.S. EPA)) [41] and CORINAIR—CORe INventory AIR emissions, implemented in the COPERT IV© software [42,43].
The CORINAIR model takes into account many traffic and vehicle parameters, such as vehicle types, categories and population, yearly mileage (km/year), mean fleet mileage (km).
The methodology allows calculating the exhaust emissions of carbon monoxide (CO), nitrogen oxides (NOX), non-methane volatile organic compounds (NMVOC), methane (CH4), particulate matter (PM), carbon dioxide (CO2), and many others emissions.
The emission factor (EF) for each exhaust emission and for each transport modality m is calculated by means of the following Equations (18) and (19):
E F λjk m = RF K ( g/km )
E F λjk m = R F { a λ j k m + b λjk m v + d λjk m v 2 f = 1 a λjk m v b ij m f = 2 a λ j k m e b ijk m v f = 3 a λjk m + b λjk m ln ( v ) f = 4
where: λ is the fuel type; j is the vehicle age; k is the engine displacement (volume); m is the modality of transportation; a, b, d are three parameters related to single pollution emissions; f depends on the emission type.
RF stands for a reduction factor, whose value is a function of vehicles emission classes (Euro I ÷ Euro VI) and type of pollutant.
The total emissions Eγ for the pollutant i can thus be calculated as:
E γ = E F i N i p i ¯ ( g/year )
where: p i ¯ is the mean length of the annual trip (km); and Ni is the number of annual vehicles belonging to the same emission group.
The method also allows one to consider the effect of hot and cold emissions, as well as some specific infrastructure characteristics (i.e., longitudinal slope) and road context (urban, rural, headway), etc.

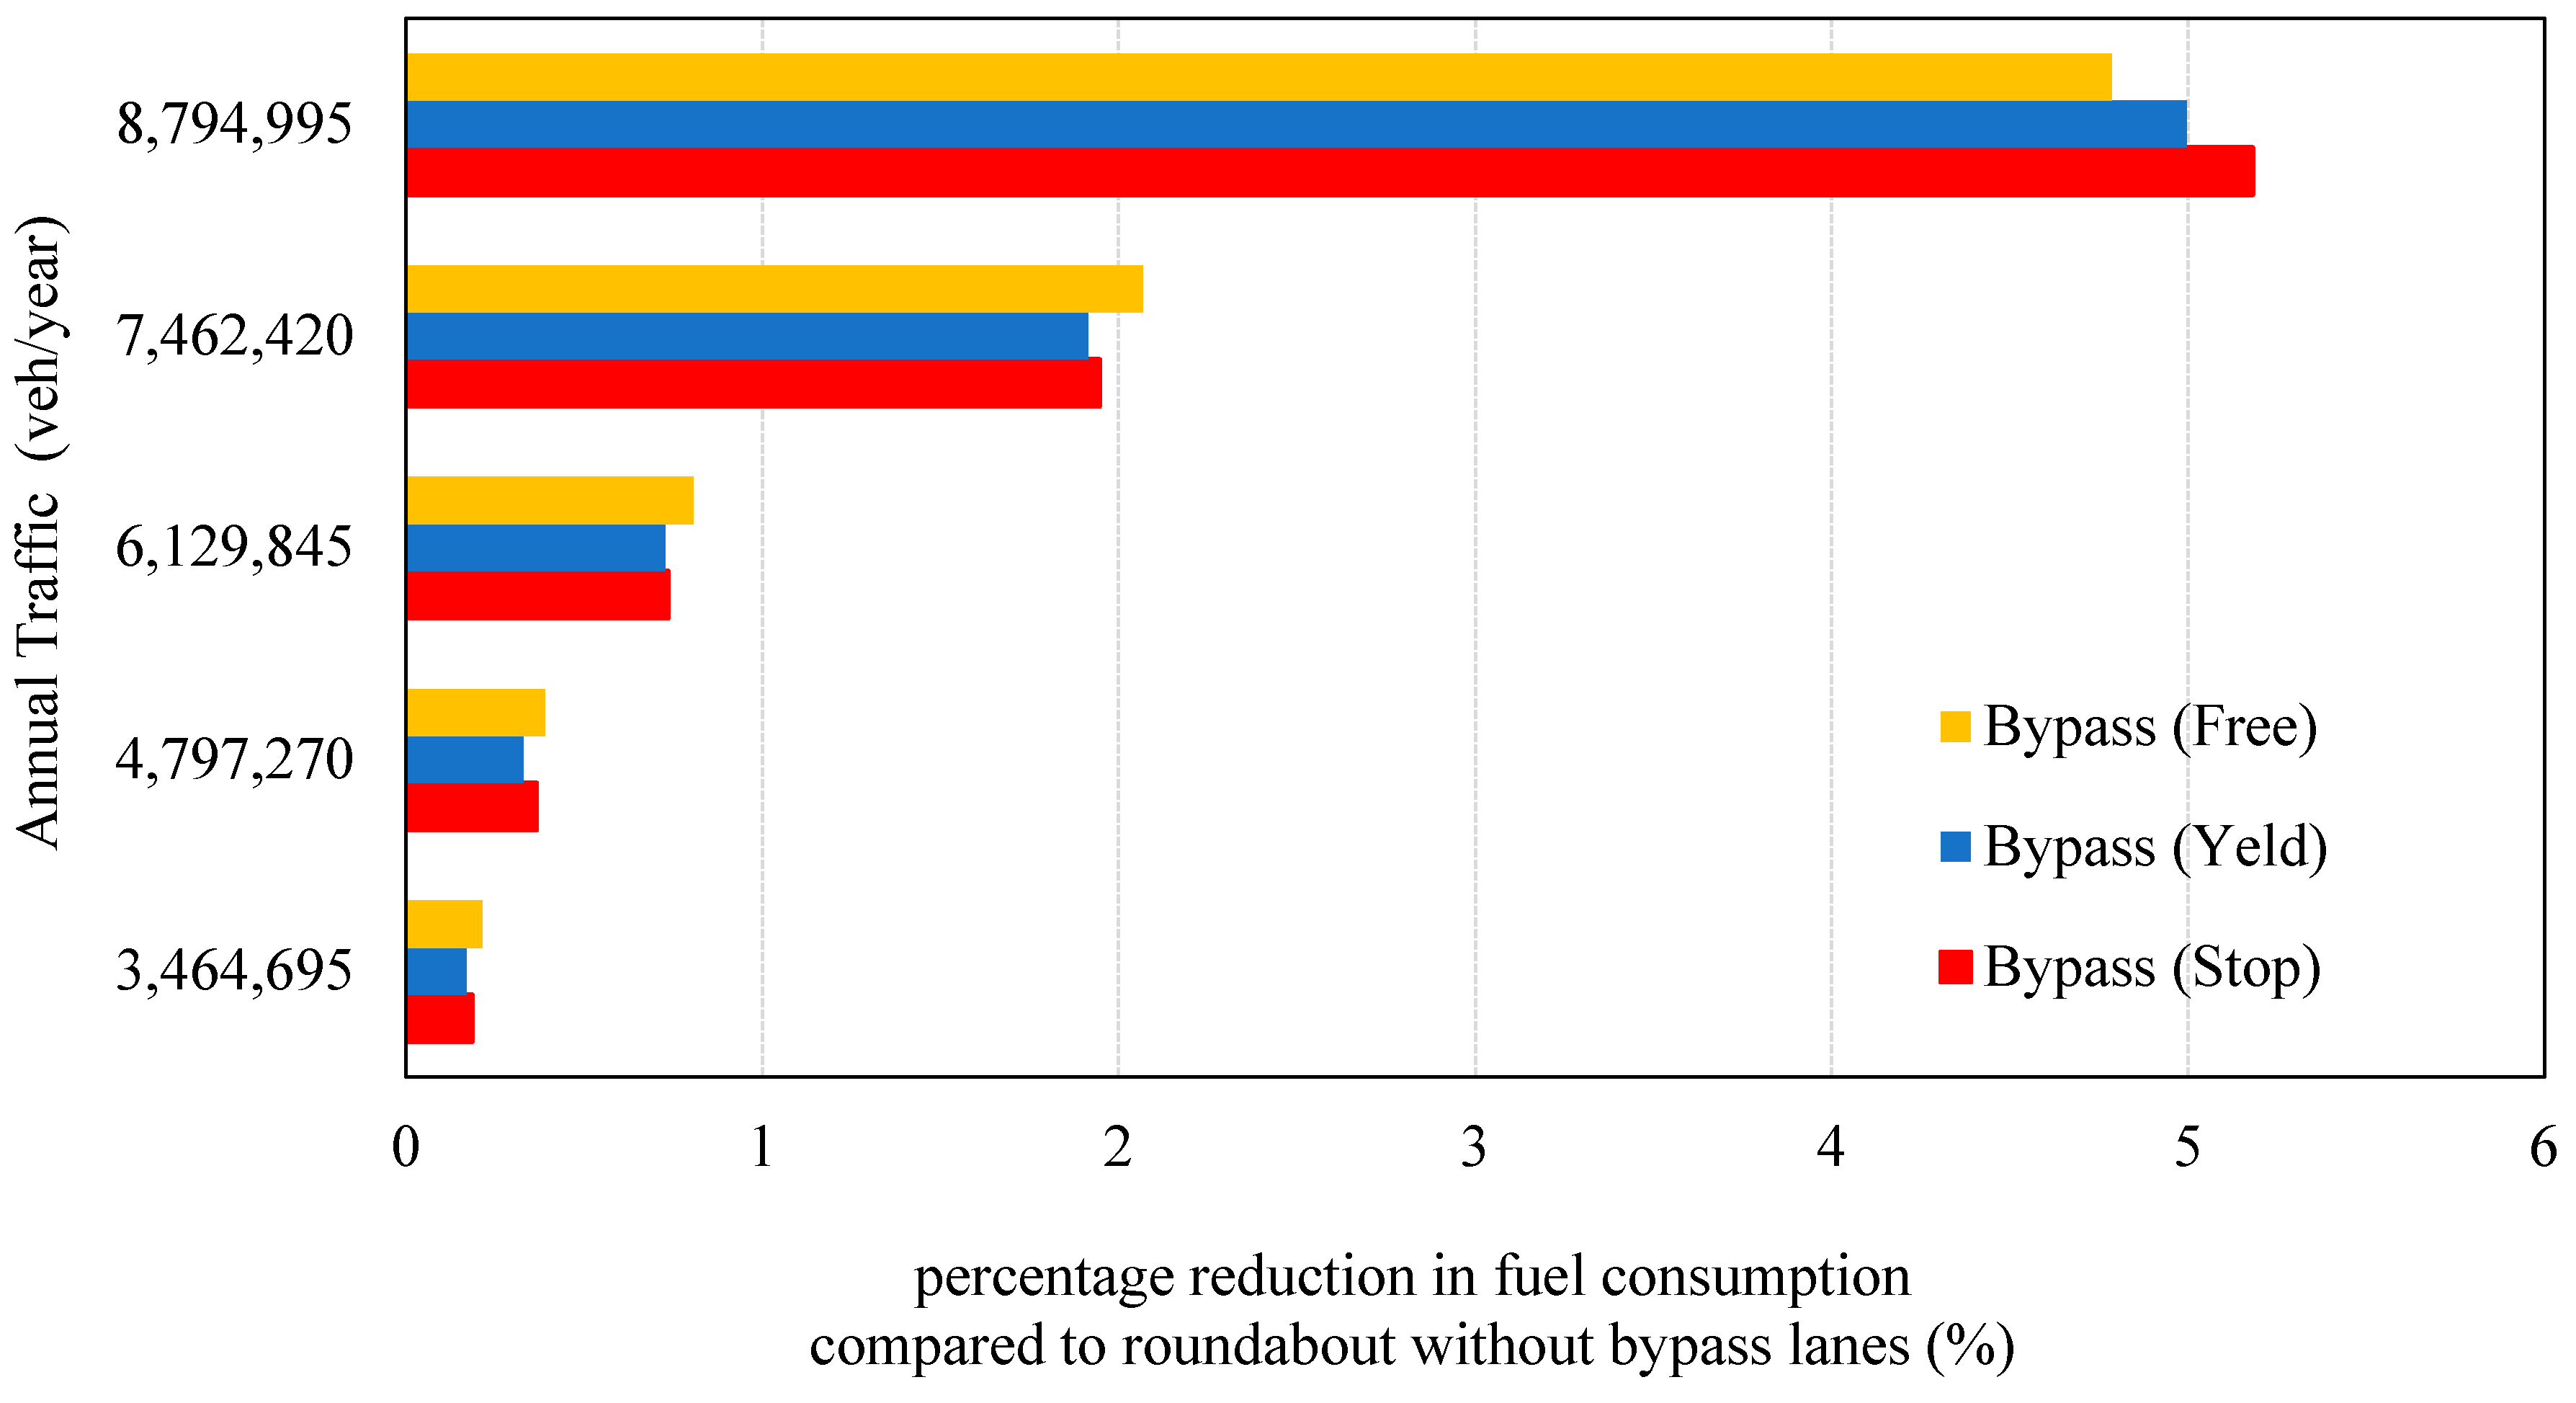
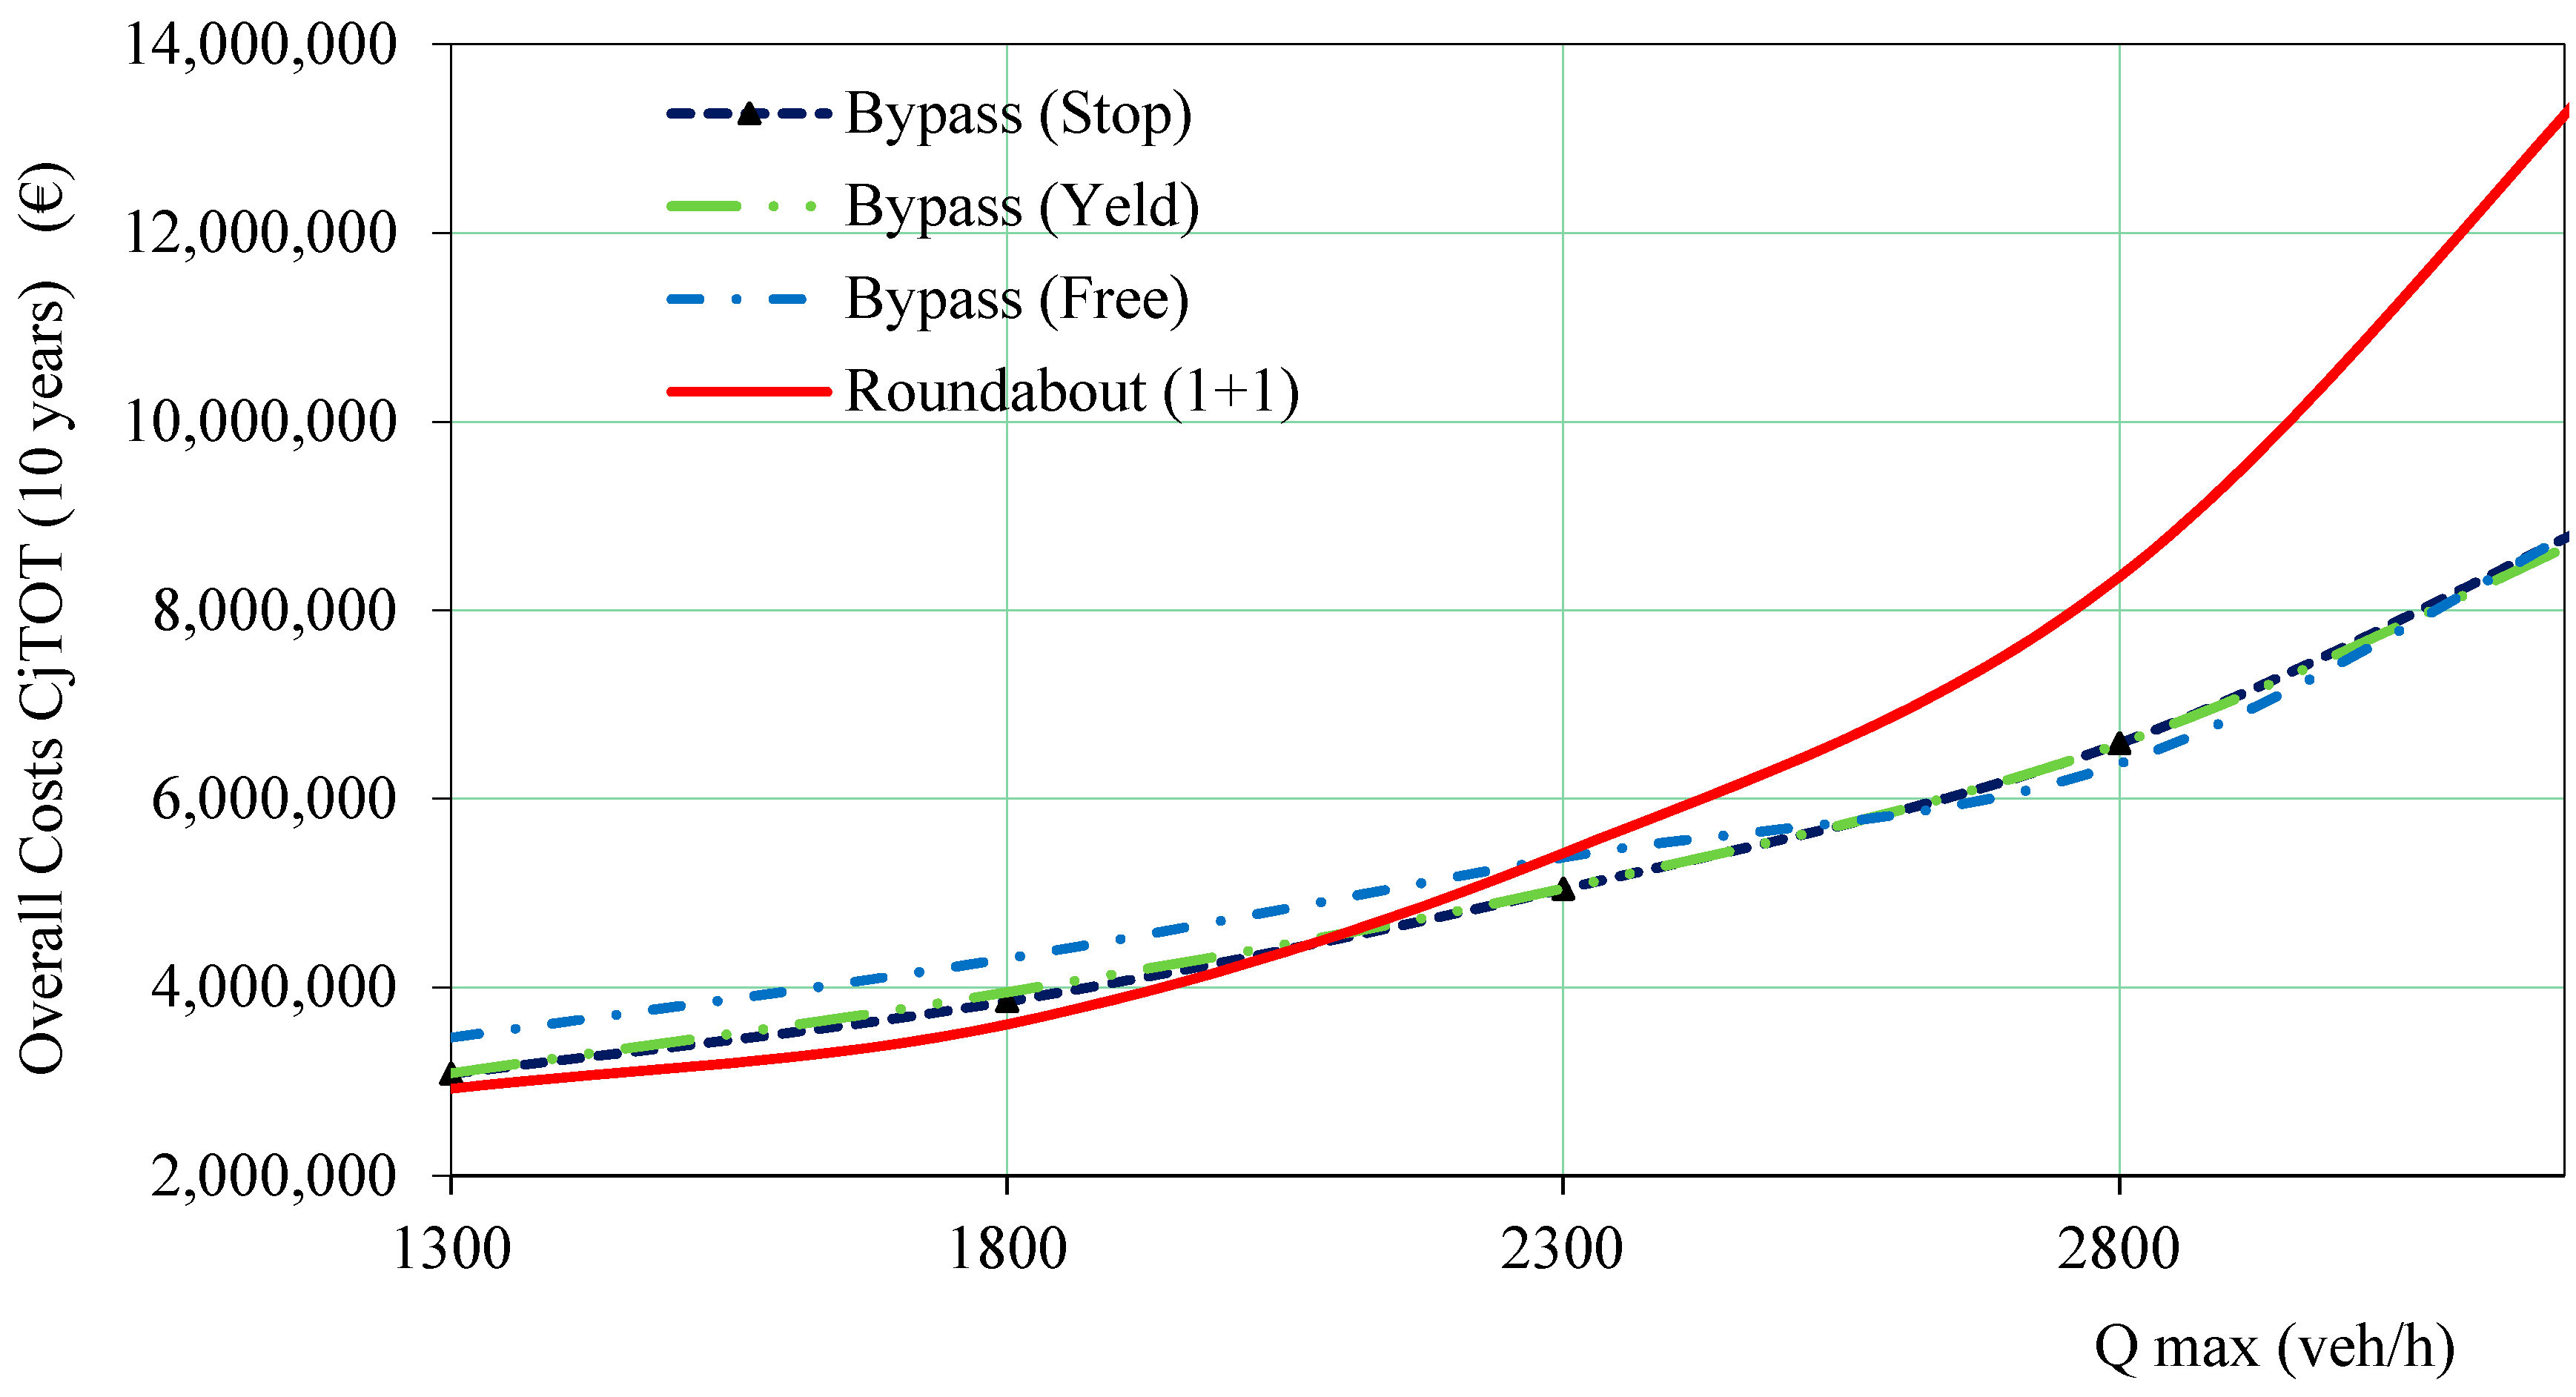
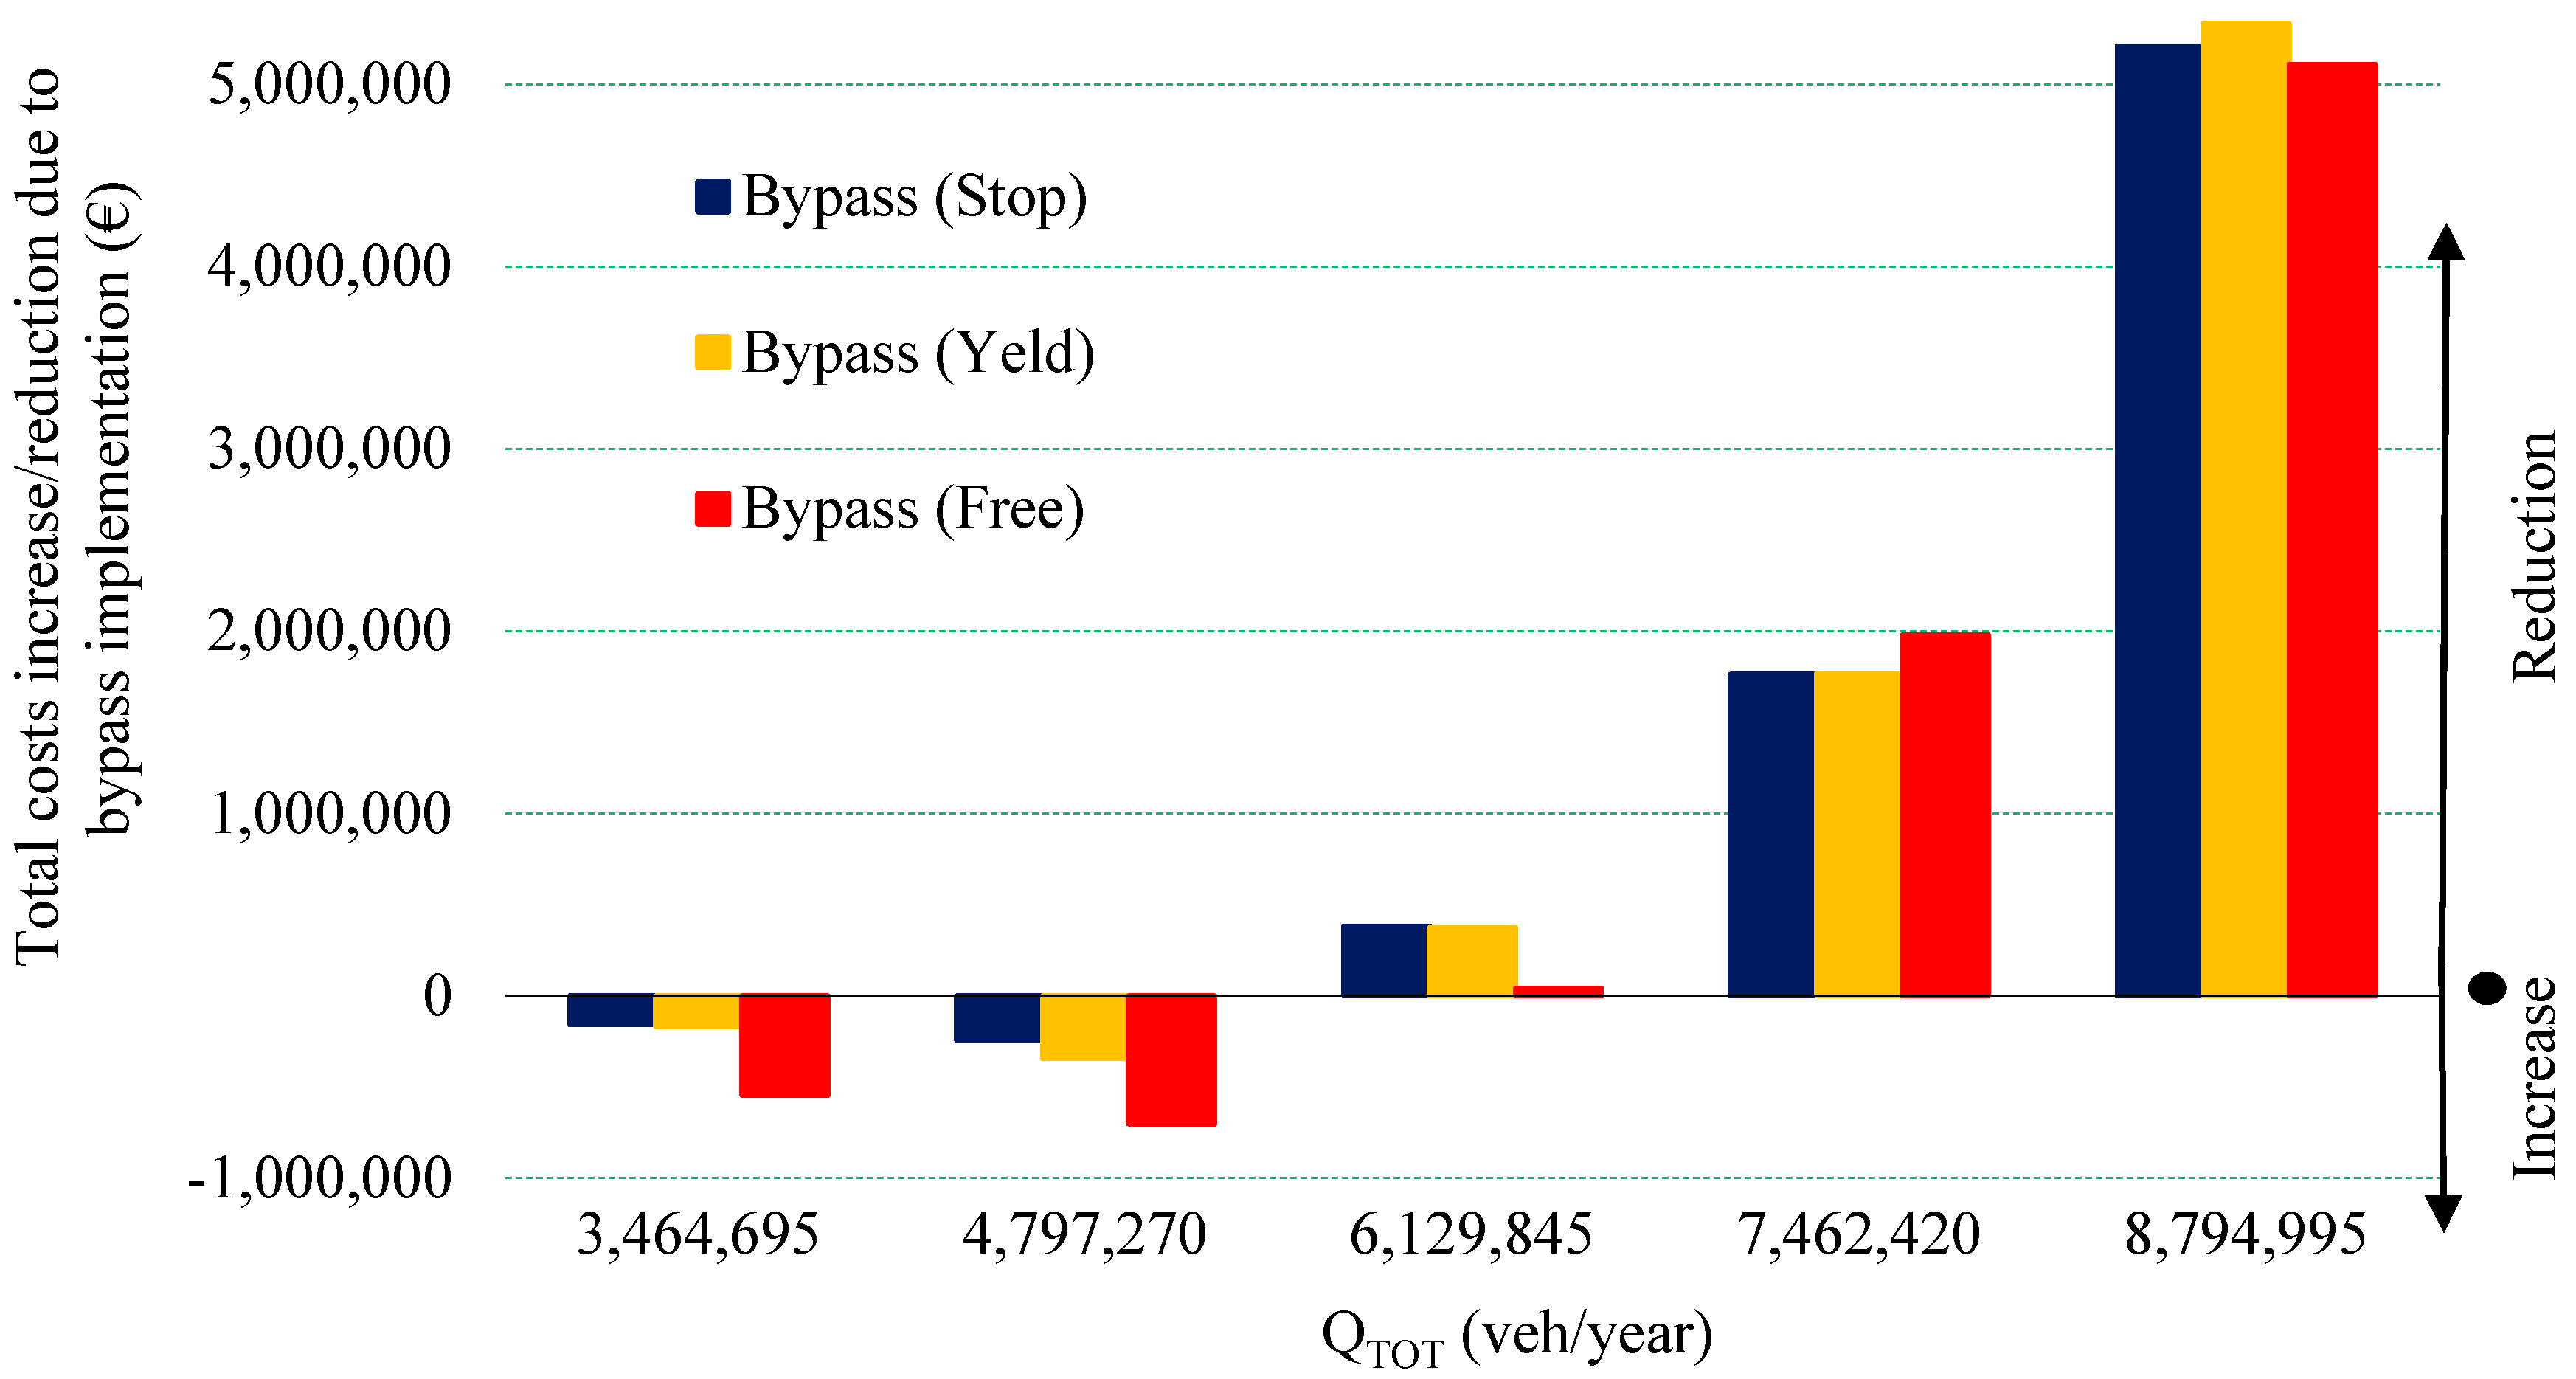
5. Analysis of Bypass Overall Costs

The implementation of right-turn bypasses in roundabout intersections increases the capacity at entries (see Equation (1)). In order to identify the traffic conditions that may account for their implementation in conventional four-arm roundabouts, with one lane at the ring and another at entries (henceforth Roundabout (1 + 1)), plenty of traffic simulations were carried out by comparing the following geometric layouts:
Roundabout with one ring lane and one lane at entries: “Roundabout (1 + 1)”;
Roundabout (1 + 1) with bypass lanes controlled by a stop signal at all arms;
Roundabout (1 + 1) with bypass lanes controlled by a yield signal at all arms;
Roundabout (1 + 1) with bypass lanes provided with an acceleration lane at all arms.
We examined a typical demand curve in suburban areas (see Figure 8) and a test matrix of traffic distribution ρ (for each entry, 20% of the entering flow performs the maneuvers to cross the intersection, 20% to turn right and 60% to turn left).
Figure 8. Traffic demand curve (suburban context).
Sustainability 07 05838 g008
We considered five hourly traffic levels: Qmax = 1300 veh/h; Qmax = 1800 veh/h; Qmax = 2300 veh/h; Qmax = 2800 veh/h; Qmax = 3300 veh/h. Through the demand curve in Figure 8, such Qmax values correspond to the following annual flows: QTOT = 3,464,695 veh/year; QTOT = 4,797,270 veh/year; QTOT = 6,129,845 veh/year; QTOT = 7,462,420 veh/year; QTOT = 8,794,995 veh/year.
We determined entry and bypass capacities by means of Equations (1), (5), (11) and (12), and vehicle delays through Equations (14)–(16). Pollutant emissions and fuel consumption were estimated on a neighborhood, 0.5 km away from the intersection, by assuming a free-flow speed (FFS) of 50 km/h.
Entry speeds on the ring and intersection exits were determined as a function of the path radius R and superelevation e by applying the criteria reported in the American Association of State Highway and Transportation Officials (AASHTO) “Green Book” [44]. Vehicle fleet has a direct effect on road traffic emissions [45,46,47].
In this research, the park was subdivided into nine distinct vehicle categories, depending on Qmax and QTOT values, as reported in Table 1.
Table 1. Vehicle types considered in the study.
Passenger Cars (veh/year)Heavy Duty Trucks (veh/year)QTOT (veh/year)Qmax (veh/h)
PetrolDieselDiesel
EURO 2EURO 3EURO 4EURO 2EURO 3EURO 4EURO 2EURO 3EURO 4
582,865349,509752,385196,691430,048806,72786,61786,617173,2353,464,6951300
807,044483,9351,041,764272,342595,4511,117,007119,932119,932239,8644,797,2701800
1,031,223618,3621,331,143347,992760,8541,427,287153,246153,246306,4926,129,8452300
1,255,402752,7881,620,522423,643926,2561,737,567186,561186,561373,1217,462,4202800
1,479,581887,2141,909,901499,2931,091,6592,047,847219,875219,875439,7508,794,9953300
Pollutant emissions (CO2, NOx, PM2.5, PM10) and fuel consumption (petrol and diesel) were assessed by means of the COPERT IV® software (see Equations (18)–(20)), by taking speed variations near the intersection and on the ring carriageway into consideration (see Table 2) [48].
The analyzed minimum and maximum monthly temperatures and average relative humidity refer to the Italian territory, i.e., Central Italy (source: Military Aviation, Weather Forecast Service).
Total delays accumulated by users in the year “n” (Dn) were obtained through the expression [27]:
D n = i [ d ( Q i ) T ( Q i ) Q i ]
where: Qi (veh/h) is every traffic flow reference value; d(Qi) (s) is the average delay associated with total flow Qi; T(Qi) (s) is the yearly amount of hours with the observed flow equal to Qi.
The traffic demand curve in Figure 8 was taken into consideration to apply Equation (21). On the basis of the annual peak flow, 20 Qi intervals (0.025 Qmax ≤ Qi ≤ 0.975 Qmax) were examined; for each Qi value, the hour number per year was determined every time it occurred T(Qi), and the average delay was estimated at intersections.
As illustrated in Figure 9, up to hourly flows of about 1500 veh/h entering a roundabout, the examined layouts give rise to nearly the same delays. As the flow increases, delays at the intersection without bypasses increase much more significantly than those at right-turn bypass roundabouts (for an entering flow of 2730 veh/h, such a difference is around 100 s/veh).
Among those under consideration, the layout that gives rise to less vehicle delays is the roundabout with a bypass with an acceleration lane; however, as explained later, it is not the most cost-effective in terms of total costs.
Table 2. CO2, NOx, PM2.5, PM10 emissions and fuel consumption at roundabout intersections.
CO2 EMISSION (ton/year)
Annual trafficQmax (veh/h)Roundabout with bypass (stop)Roundabout with bypass (yield)Round. with bypass (free-flow)Roundabout (1 + 1)
3,464,6951300735735734736
4,797,2701800947947947950
6,129,84523001215121512141224
7,462,42028001474147414721503
8,794,99533001780177917771862
NOx EMISSION (ton/year)
Annual TrafficQmax (veh/h)Roundabout with bypass (stop)Roundabout with bypass (yield)Round. with bypass (free-flow)Roundabout (1 + 1)
3,464,69513002004200420032006
4,797,27018002681268026802688
6,129,84523003437343734353457
7,462,42028004122412241184187
8,794,99533005016501350075207
PM2.5 EMISSION (ton/year)
Annual trafficQmax (veh/h)Roundabout with bypass (stop)Roundabout with bypass (yield)Round. with bypass (free-flow)Roundabout (1 + 1)
3,464,69513000.1380.1380.1380.139
4,797,27018000.1870.1870.1870.188
6,129,84523000.2410.2410.2400.243
7,462,42028000.2920.2920.2910.298
8,794,99533000.3540.3540.3530.365
PM10 EMISSION (ton/year)
Annual trafficQmax (veh/h)Roundabout with bypass (stop)Roundabout with bypass (yield)Round. with bypass (free-flow)Roundabout (1 + 1)
3,464,69513000.1830.1830.1830.183
4,797,27018000.2460.2460.2460.247
6,129,84523000.3160.3160.3160.319
7,462,42028000.3830.3830.3830.393
8,794,99533000.4660.4650.4650.478
FUEL CONSUMPTION (ton/year)
Annual trafficQmax (veh/h)Roundabout with bypass (stop)Roundabout with bypass (yield)Round. with bypass (free-flow)Roundabout (1 + 1)
3,464,6951300217,934217,966217,870218,338
4,797,2701800302,655302,769302,586303,764
6,129,8452300388,443388,474388,173391,301
7,462,4202800476,350476,500475,785485,620
8,794,9953300566,000567,000568,136595,330
Figure 9. Average delay at roundabout intersection (with and without bypass lanes).
Sustainability 07 05838 g009
After vehicle delays and emissions were obtained, we evaluated the total costs attributable to the layouts in question.
To this end, we considered the following construction costs (BCk) [10,27]:
Roundabout (1 + 1) = €950,000;
Roundabout (1 + 1) with bypass lanes controlled by a stop signal at all arms = €1,200,000;
Roundabout (1 + 1) with bypass lanes controlled by a yield signal at all arms = €1,200,000;
Roundabout (1 + 1) with bypass lanes with an acceleration lane at all arms = €1,600,000.
We assumed annual management costs as equal to €10,000 per year. For vehicle delays, we considered a unit cost Cd = 20.00 €/h [49]. As regards unit costs due to pollutant emissions, we attributed the following values (C): CO2 = 0.04 €/g; NOx = 0.0044 €/g; PM2.5 = 0.087 €/g; and PM10 = 0.087 €/g; in accordance with the EU Directive 2009/33/EC [50]. Finally, we estimated the unit cost of the fuel CFu by considering its average cost in Europe updated in May, 2014, (1.461 €/L for petrol and 1.386 €/L for diesel).
Should the increase in annual road traffic be negligible and the unit costs of vehicle delays, fuel and pollutant emissions appear constant, the actualized total cost referring to N = 10 operational years for each examined intersection “j” was obtained with the following relation:
C j TOT = B C K + [ T = 1 N     ( i [ d ( Q i ) T ( Q i ) Q i ] C d + E γ C E γ + FC C F u ) T ] / ( 1 + r ) T
By considering a discount rate r = 2% in Relation (22), we obtained the values illustrated in Figure 11.
Figure 12 shows the differentials of actualized total costs between bypass layouts and Roundabout (1 + 1) as a function of the annual total traffic QTOT: Δ C j TOT = f(Q TOT ) .
By examining Figure 10, Figure 11 and Figure 12, we can observe that for very reduced roundabout entry flows and up to 2100 veh/h, the construction of bypasses in roundabouts is not justified from the functional point of view and also generates higher total costs than Roundabout (1 + 1) (without bypass).
Over 2100 veh/h, the utility is reversed, in that economic benefits are more and more significant as the flow increases. In fact, in spite of higher construction costs, roundabouts with bypass lanes generate lower total costs than those without them.
Figure 10. Percentage reduction in fuel consumption at bypass roundabouts compared to Roundabouts (1 + 1).
Sustainability 07 05838 g010
In view of the fact that the three bypass types in question give rise to total costs that are very similar to one another, the type of regulation (stop, yield, free-flow) should be chosen by paying much more attention to their functionality (capacity, delays) and safety conditions provided (speed, potential conflict points, etc.).
Figure 11. Roundabout total costs.
Sustainability 07 05838 g011
Figure 12. Increase/reduction in total costs correlated to bypass implementation in roundabouts.
Sustainability 07 05838 g012

6. Conclusions

Right-turn bypass lanes allow improvement of the performances (in terms of capacity, delays and levels of service) of traditional and innovative roundabouts.
Considering that bypass capacity is correlated to the type of flow regulation, the choice is usually made as a function of the traffic demand/volume (maximum hourly capacity Qmax) and the flow distribution matrix ρ.
Moreover, bypasses provide energetic and environmental benefits consequent to the potential reduction in fuel consumption and pollutant emissions from vehicles.
In light of this, the article suggests a multi-parameter selection and comparison criterion, in order to estimate the generalized costs (construction, management, energetic and environmental) of roundabout layouts with or without bypass lanes.
To this end, for a case study, numerous traffic simulations were made for four different geometric roundabout layouts: (1) single-lane roundabouts without bypasses; (2) single-lane roundabouts with bypass lanes controlled by a stop signal at all arms; (3) single-lane roundabouts with bypass lanes controlled by a yield signal at all arms; and (4) single-lane roundabouts with bypass with acceleration lanes at all arms.
The capacity and delay estimations were made with closed-form relations, while pollutant emissions and fuel consumption were obtained with the aid of the COPERT IV® software, starting from a pre-set distribution of vehicle types (light-duty, heavy-duty, petrol- or diesel-fuelled, with emission classes Euro II, III and IV).
Vehicle flows were obtained starting from a typical traffic demand curve in suburban areas, by varying the maximum hourly flow in the interval Qmax = 1300–3300 veh/h. As a precaution, an origin/destination (O/D) matrix ρ was considered with modest right-turn flows (20% out of the total).
The results of the analyses show that:
(1)
for total hourly flows entering a roundabout up to Qmax = 1500 veh/h, the layouts in question give rise to nearly the same delays;
(2)
when a flow increases, delays at a single-lane roundabout without bypasses increase much more significantly than roundabouts with right-turn bypass lanes (for an entry flow of 2730 veh/h, such a difference is around 100 s/veh);
(3)
the bypass providing higher capacity and less delays is that with an acceleration lane;
(4)
for heavy annual traffic (QTOT = 8,794,995 veh/year), the presence of bypasses determines considerable energetic benefits. In fact, compared to roundabouts without bypasses, their presence determines a reduction of over 5% in fuel consumption.
Then, we also estimated the costs related to fuel consumption and environmental costs (in accordance with a specific EC directive), as well as actualized total costs in a 10-year operational period.
We observed that for roundabout entry flows up to 2100 veh/h, the construction of bypasses cannot be justified from the functional point of view, and moreover, it generates higher total costs than single-lane roundabouts (1 + 1) without bypass lanes.
Above this flow value (Qmax = 2100 veh/h), bypasses become more and more cost efficient as the flow tends to increase. By way of an example, for Qmax = 2800 veh/h (corresponding to an annual flow QTOT = 7,462,420 veh/year), the presence of bypass lanes determines a maximum economic benefit of €1,980,235, while for Qmax = 3300 veh/h (corresponding to an annual flow QTOT = 8,794,995 veh/year), the maximum economic benefit in 10 years totals €5,335,291.
It is worth pointing out that when the demand curve and especially the flow distribution ρ vary, results can change considerably. As a matter of fact, as the percentage of users turning right increases, the limit flow differentiating bypass utility gets lower (Qmax < 2100 veh/h).
In any case, the method suggested for functional, energetic, environmental and economic analyses has a general character, and thus, it can be applied to any traffic condition and type of roundabout intersection.

Acknowledgments

This work was carried out within the research project RE.S.E.T. (A grid of material and immaterial laboratories for a sustainable transportation system), which is funded by the PO-FESR (Regional Operative Plans of the EU Community) Sicilia 2007–2013-Asse IV, Obiettivo operativo 4.1.2, Linea d’intervento 4.1.2.A.

Author Contributions

Marco Guerrieri conceived of and designed the research. Gianfranco Rizzo generally supervised the research group. Marco Guerrieri drafted the article. Ferdinando Corriere collected and processed the data. Gianluca Scaccianoce, Barbara Lo Casto and Gianfranco Rizzo interpreted and analyzed the data. All authors have revised the article critically and approved the final manuscript.

Conflicts of Interest

The authors declare no conflict of interest.

References

  1. Maheshwari, P.; Khaddar, R.; Kachroo, P.; Paz, A. Dynamic Modeling of Performance Indices for the Planning of Sustainable Transportation Systems. Netw. Spat. Econ. 2014. [Google Scholar] [CrossRef]
  2. Ambrosino, G.; Aassoli, P.; Bielli, M.; Romanazzo, M. A Modeling Framework for Impact Assessment of Urban Transport Systems. Transp. Res. Part D 1999, 4, 73–79. [Google Scholar] [CrossRef]
  3. Huzayyin, S.; Salem, H. Analysis of thirty years evolution of urban growth, transport demand and supply, energy consumption, greenhouse and pollutants emissions in Greater Cairo. Res. Transp. Econ. 2013, 40, 104–115. [Google Scholar] [CrossRef]
  4. Klibavičius, A.; Paliulis, G.M. Increasing the capacity of intersections by short traffic lanes. Transport 2012, 27, 67–72. [Google Scholar] [CrossRef]
  5. Fortuijn, L.G.H. Pedestrian and Bicycle-Friendly Roundabouts; Dilemma of Comfort and Safety; Annual Meeting of the Institute of Transportation Engineers (ITE): Seattle, Washington, DC, USA, 2003. [Google Scholar]
  6. Fortuijn, L.G.H. Turbo Roundabouts Design Principles and Safety Performance. CD-ROM. In Proceedings of the 88th TRB Annual Meeting, Washington, DC, USA, 11–15 January 2009.
  7. Vasconcelos, L.; Silva, A.; Seco, A.; Fernandes, P.; Coelho, M. Turborounda-bouts. Transp. Res. Rec. 2014, 2402, 28–37. [Google Scholar] [CrossRef]
  8. Turborotondes. Available online: http://www.crow.nl/publicaties/turborotondes (accessed on 11 May 2015).
  9. Guerrieri, M.; Corriere, F. Estimation of measures of effectiveness (MOE) for the C-Roundabouts. Appl. Mech. Mater. 2014, 459, 569–574. [Google Scholar] [CrossRef]
  10. Tollazzi, T.; Tesoriere, G.; Guerrieri, M.; Campisi, T. Environmental, functional and economic criteria for comparing “target roundabouts” with one- or two level roundabout intersections. Transp. Res. Part D 2015, 34, 330–344. [Google Scholar] [CrossRef]
  11. Tollazzi, T.; Ovanović, G.; Renčelj, M. New type of roundabout: Dual one-lane roundabouts on two levels with right-hand turning bypasses—Target roundabout. Promet Traffic Transp. 2013, 25, 475–481. [Google Scholar]
  12. Mauro, R.; Cattani, M. Model to evaluate potential accident rate at roundabouts. J. Transp. Eng. 2004, 130, 602–609. [Google Scholar] [CrossRef]
  13. Al-Ghandour, M.N.; Schroeder, B.J.; Williams, B.M.; Rasdorf, W.J. Conflict models for single-lane roundabout slip lanes from microsimulation: Development and validation. Transp. Res. Rec. 2011, 2236, 92–101. [Google Scholar] [CrossRef]
  14. De Luca, M.; Mauro, R.; Russo, F.; Dell’Acqua, G. Before-after freeway accident analysis using Cluster algorithms. Procedia Soc. Behav. Sci. 2011, 20, 723–731. [Google Scholar] [CrossRef]
  15. Mauro, R.; Guerrieri, M. Right-turn bypass lanes at roundabouts: Geometric schemes and functional analysis. Mod. Appl. Sci. 2013, 7, 1–12. [Google Scholar]
  16. Daniels, S.; Brijs, T.; Nuyts, E.; Wets, G. Extended prediction models for crashes at roundabouts. Saf. Sci. 2011, 49, 198–207. [Google Scholar] [CrossRef]
  17. Dabbour, E.; Easa, S.M. Evaluation of safety and operational impacts of bicycle bypass lanes at modern roundabouts. Can. J. Civil Eng. 2008, 35, 1025–1032. [Google Scholar] [CrossRef]
  18. Wytyczne Projektowania Skrzyzowan Drogowych, Czesc II. Available online: http://w.bibliotece.pl/books/299414d75dda449ab7a18db57e74d439/ (accessed on 11 May 2015).
  19. TRB. NCHRP Report 672, 2010. Roundabouts: An Informational Guide, 2nd ed.; TRB: Washington, DC, USA, 2010. [Google Scholar]
  20. Montella, A.; Turner, S.; Chiaradonna, S.; Aldridge, D. International overview of roundabout design practices and insights for improvement of the Italian standard. Can. J. Civil Eng. 2013, 40, 1215–1226. [Google Scholar] [CrossRef]
  21. Tracz, M. Analysis of Small Roundabouts’ Capacity. In Proceedings of the National Roundabout Conference, Kansas City, MO, USA, 18–21 May 2008.
  22. Tracz, M.; Chodur, J.; Ostrowsk, K. Roundabouts Country report—Poland. In Proceedings of the 6th International Symposium on Highway Capacity and Quality of Service, Stockholm, Sweden, 28 June–3 July 2011.
  23. Al-Ghandour, M.; Schroeder, B.; Rasdorf, W.; Williams, B. Delay Analysis of single-lane roundabout with a slip lane under varying exit types, experimental balanced traffic volumes, and pedestrians, using microsimulation. Transp. Res. Rec. 2012. [Google Scholar] [CrossRef]
  24. Kinderyte-Poškiene, J.; Sokolovskij, E. Traffic control elements influence on accidents, mobility and the environment. Transport 2008, 23, 55–58. [Google Scholar] [CrossRef]
  25. Al-Ghandour, M. Experimental analysis of single-lane roundabout slip lanes: Fuel consumption and emissions. In Proceedings of the 2nd Green Streets, Highways, and Development Conference, Austin, TX, USA, 3–6 November 2013; pp. 240–250.
  26. Corriere, F.; Guerrieri, M.; Ticali, D.; Messineo, A. Estimation of air pollutant emissions in Flower roundabouts and in conventional roundabouts. Arch. Civil Eng. 2013, 59, 229–246. [Google Scholar]
  27. Mauro, R.; Cattani, M. Functional and Economic Evaluations for Choosing Road Intersection Layout. Promet Traffic Transp. 2012, 24, 441–448. [Google Scholar]
  28. Highway Capacity Manual 2010 (HCM 2010). Transportation Research Board; Highway Capacity Manual: Washington, DC, USA, 2010. [Google Scholar]
  29. Corriere, F.; Guerrieri, M. Performance analysis of basic turbo-roundabout in urban context. Proc. Soc. Behav. Sci. 2012, 53, 622–632. [Google Scholar] [CrossRef]
  30. Gkatzoflias, D.; Kouridis, C.; Ntziachristos, L. Description of new elements in COPERT 4 v 9.0, EMI-SIA SA Report, No: 11.RE.005.V1. Available online: http://emisia.com/sites/default/files/COPERT4_v9_0.pdf (accessed on 11 May 2015).
  31. Akҫelik, R. Roundabout model calibration issue and a case study. In Proceedings of the TRB National Roundabout Conference, Vail, CO, USA, 22–25 May 2005.
  32. Yap, Y.H.; Gibson, H.M.; Waterson, B.J. An International Review of Roundabout Capacity Modelling. Transp. Rev. 2013, 33, 593–616. [Google Scholar] [CrossRef]
  33. Brilon, W.; Stuwe, B.; Drews, O. Sicherheit und Leistungsfähigkeit von Kreisverkehrsplätzen. Institute for Traffic Engineering. Ruhr Universität, Bochum: Deutschland, Germany, 1993. [Google Scholar]
  34. Int Panis, L.; Beckx, C.; Broekx, S.; De Vlieger, I.; Schrooten, L.; Degraeuwe, B.; Pelkmans, L. PM, NOx and CO2 emission reductions from speed management policies in Europe. Transp. Policy 2011, 18, 32–37. [Google Scholar] [CrossRef]
  35. Varhelyi, A. The effect of small roundabouts on emissions and fuel consumption: A case study. Transp. Res. Part D 2002, 7, 65–71. [Google Scholar] [CrossRef]
  36. Gokhale, S. Impacts of traffic-flows on vehicular-exhaust emissions at traffic junctions. Transp. Res. Part D 2012, 17, 21–27. [Google Scholar] [CrossRef]
  37. Mandavilli, S.; Rys, M.J.; Russell, E.R. Environmental impact of modern roundabouts. Int. J. Ind. Ergon. 2008, 38, 135–142. [Google Scholar] [CrossRef]
  38. Wilkinson, K.E.; Lundkvist, J.; Netrval, J.; Eriksson, M.; Gulaim, A.; Kessler, G. Space and time resolved monitoring of airborne particulate matter in proximity of a traffic roundabout in Sweden. Environ. Pollut. 2013, 182, 364–370. [Google Scholar] [CrossRef] [PubMed]
  39. Schmale, J.; von Schneidemesser, E.; Dörrie, A. An integrated assessment method for sustainable transport system planning in a middle sized German city. Sustainability 2015, 7, 1329–1354. [Google Scholar] [CrossRef]
  40. Akҫelik, R.; Smit, R.; Besley, M. Recalibration of a Vehicle Power Model for Fuel and Emission Estimation and its Effect on Assessment of Alternative Intersection Treatments. In Proceedings of the TRB 4th International Conference on Roundabouts, Seattle, DC, USA, 16–18 April 2014.
  41. Kota, S.H.; Zhang, H.; Chen, G.; Schade, G.W.; Ying, Q. Evaluation of on-road vehicle CO and NOx national emission inventories using an urban-scale source-oriented air quality model. Atmos. Environ. 2014, 85, 99–108. [Google Scholar] [CrossRef]
  42. Ntziachristos, L.; Gkatzoflias, D.; Kouridis, C.; Samaras, Z. COPERT: A European road transport emission inventory model. In Information Technologies in Environmental Engineering; Springer: Berlin, Germany, 2009; pp. 491–504. [Google Scholar]
  43. Toşa, C.; Antov, D.; Köllo, G.; Rõuk, H.; Rannala, M. A methodology for modelling traffic related emissions in suburban areas. Transport 2015, 30. [Google Scholar] [CrossRef]
  44. AASHTO (“Green Book”). A Policy on Geometric Design of Highways and Streets, 6th ed.; AASHTO (“Green Book”): Washington, DC, USA, 2011. [Google Scholar]
  45. Hernández-Moreno, A.; Mugica-Álvarez, V. Vehicular fleets forecasting to project pollutant emissions: Mexico city metropolitan area case. Transp. Policy 2013, 27, 189–199. [Google Scholar] [CrossRef]
  46. Yedla, S.; Shrestha, R.M.; Anandarajah, G. Environmentally sustainable urban transportation—Comparative analysis of local emission mitigation strategies vis-à vis GHG mitigation strategies. Transp. Policy 2005, 12, 245–254. [Google Scholar] [CrossRef]
  47. Onat, N.C.; Kucukvar, M.; Tatari, O. Towards life cycle sustainability assessment of alternative passenger vehicles. Sustainability 2014, 6, 9305–9342. [Google Scholar] [CrossRef] [Green Version]
  48. Corriere, F.; Rizzo, G.; Guerrieri, M. Estimation of air pollutant emissions in “turbo” and in conventional roundabouts. Appl. Mech. Mater. 2013, 394, 597–604. [Google Scholar] [CrossRef]
  49. Directive 2009/33/EC of the European Parliament and of the Council of 23 April 2009 on the promotion of clean and energy-efficient road transport vehicles. Available online: http://ec.europa.eu/transport/themes/urban/studies/doc/2012-monitoring-report.pdf (accessed on 8 May 2015).
  50. Wang, J.; Chi, L.; Hu, X.; Zhou, H. Urban traffic congestion pricing model with the consideration of carbon emissions cost. Sustainability 2014, 6, 676–691. [Google Scholar] [CrossRef]

