
First Catch Your Fish: Designing a “Low Energy Fish” Label

Abstract
:1. Introduction
- To collect data from fishing boats and subsequent processing and transport activities, and to use that data in the production of an energy life cycle assessment (LCA).
- To generate energy information from the LCA to be included either on the label of the packaged fish, or as additional information available elsewhere, such as a website for example.
- To produce a selection of appropriate label designs.
- To test those designs with consumers.
- In consultation with producers and retailers, to recommend which type, form and content of label is most appropriate to achieving the above aim.
2. Research Approach
2.1. Information Design Literature Review
Its purpose is the systematic arrangement and use of communication carriers, channels, and tokens to increase the understanding of those participating in a specific conversation or discourse.[4] (p. 3)
- Information design is defined as the art and science of preparing information so that it can be used by human beings with efficiency and effectiveness [5] (p. 15).
- …the organization of information to achieve preconceived goals [6] (p. 224).
- The discipline addresses the organization and presentation of data and its transformation into meaningful information [7] (p. 268).
Information design comprises analysis, planning, presentation and understanding of a message—its content, language and form. Regardless of the selected medium, well designed information set, with its message, will satisfy aesthetic, economic, ergonomic, as well as receiver and subject matter requirements.[10]
2.2. Label Design Literature Review
2.3. Consumer Behaviour Literature Review
- Give consumers options, not just information. Make sure that communication isn’t just for communication’s sake: Make sure that it is designed to change consumer behaviour.
- Do put climate change impacts of products into context. But the product or category you compare to is critical—Don’t necessarily compare apples with apples.
- Be selective and limit information to what is really needed, so that the message does get “noticed”.
- Tackle the ‘how does it fit with other sustainability labels’ question.
2.4. Environmental and Labelling Standards
2.4.1. ISO 14024:1999 Type I Environmental Labelling
2.4.2. ISO 14021:1999+A1:2011 Self-Declared Environmental Claims (Type II Environmental Labelling)
- Accurate and verifiable claims that are not misleading.
- An increase in the potential for market forces to stimulate environmental improvements.
- Increased opportunity for more informed choices to be made.
2.4.3. ISO 14025:2006 Type III Environmental Declarations
- To provide LCA-based information and additional information on the environmental aspects of products.
- To assist purchasers and users to make informed comparisons between products; these declarations are not comparative assertions.
- To encourage improvement of environmental performance.
- To provide information for assessing the environmental impacts of products over their life cycle.
2.4.4. Social Responsibility Labels
3. Results and Discussion
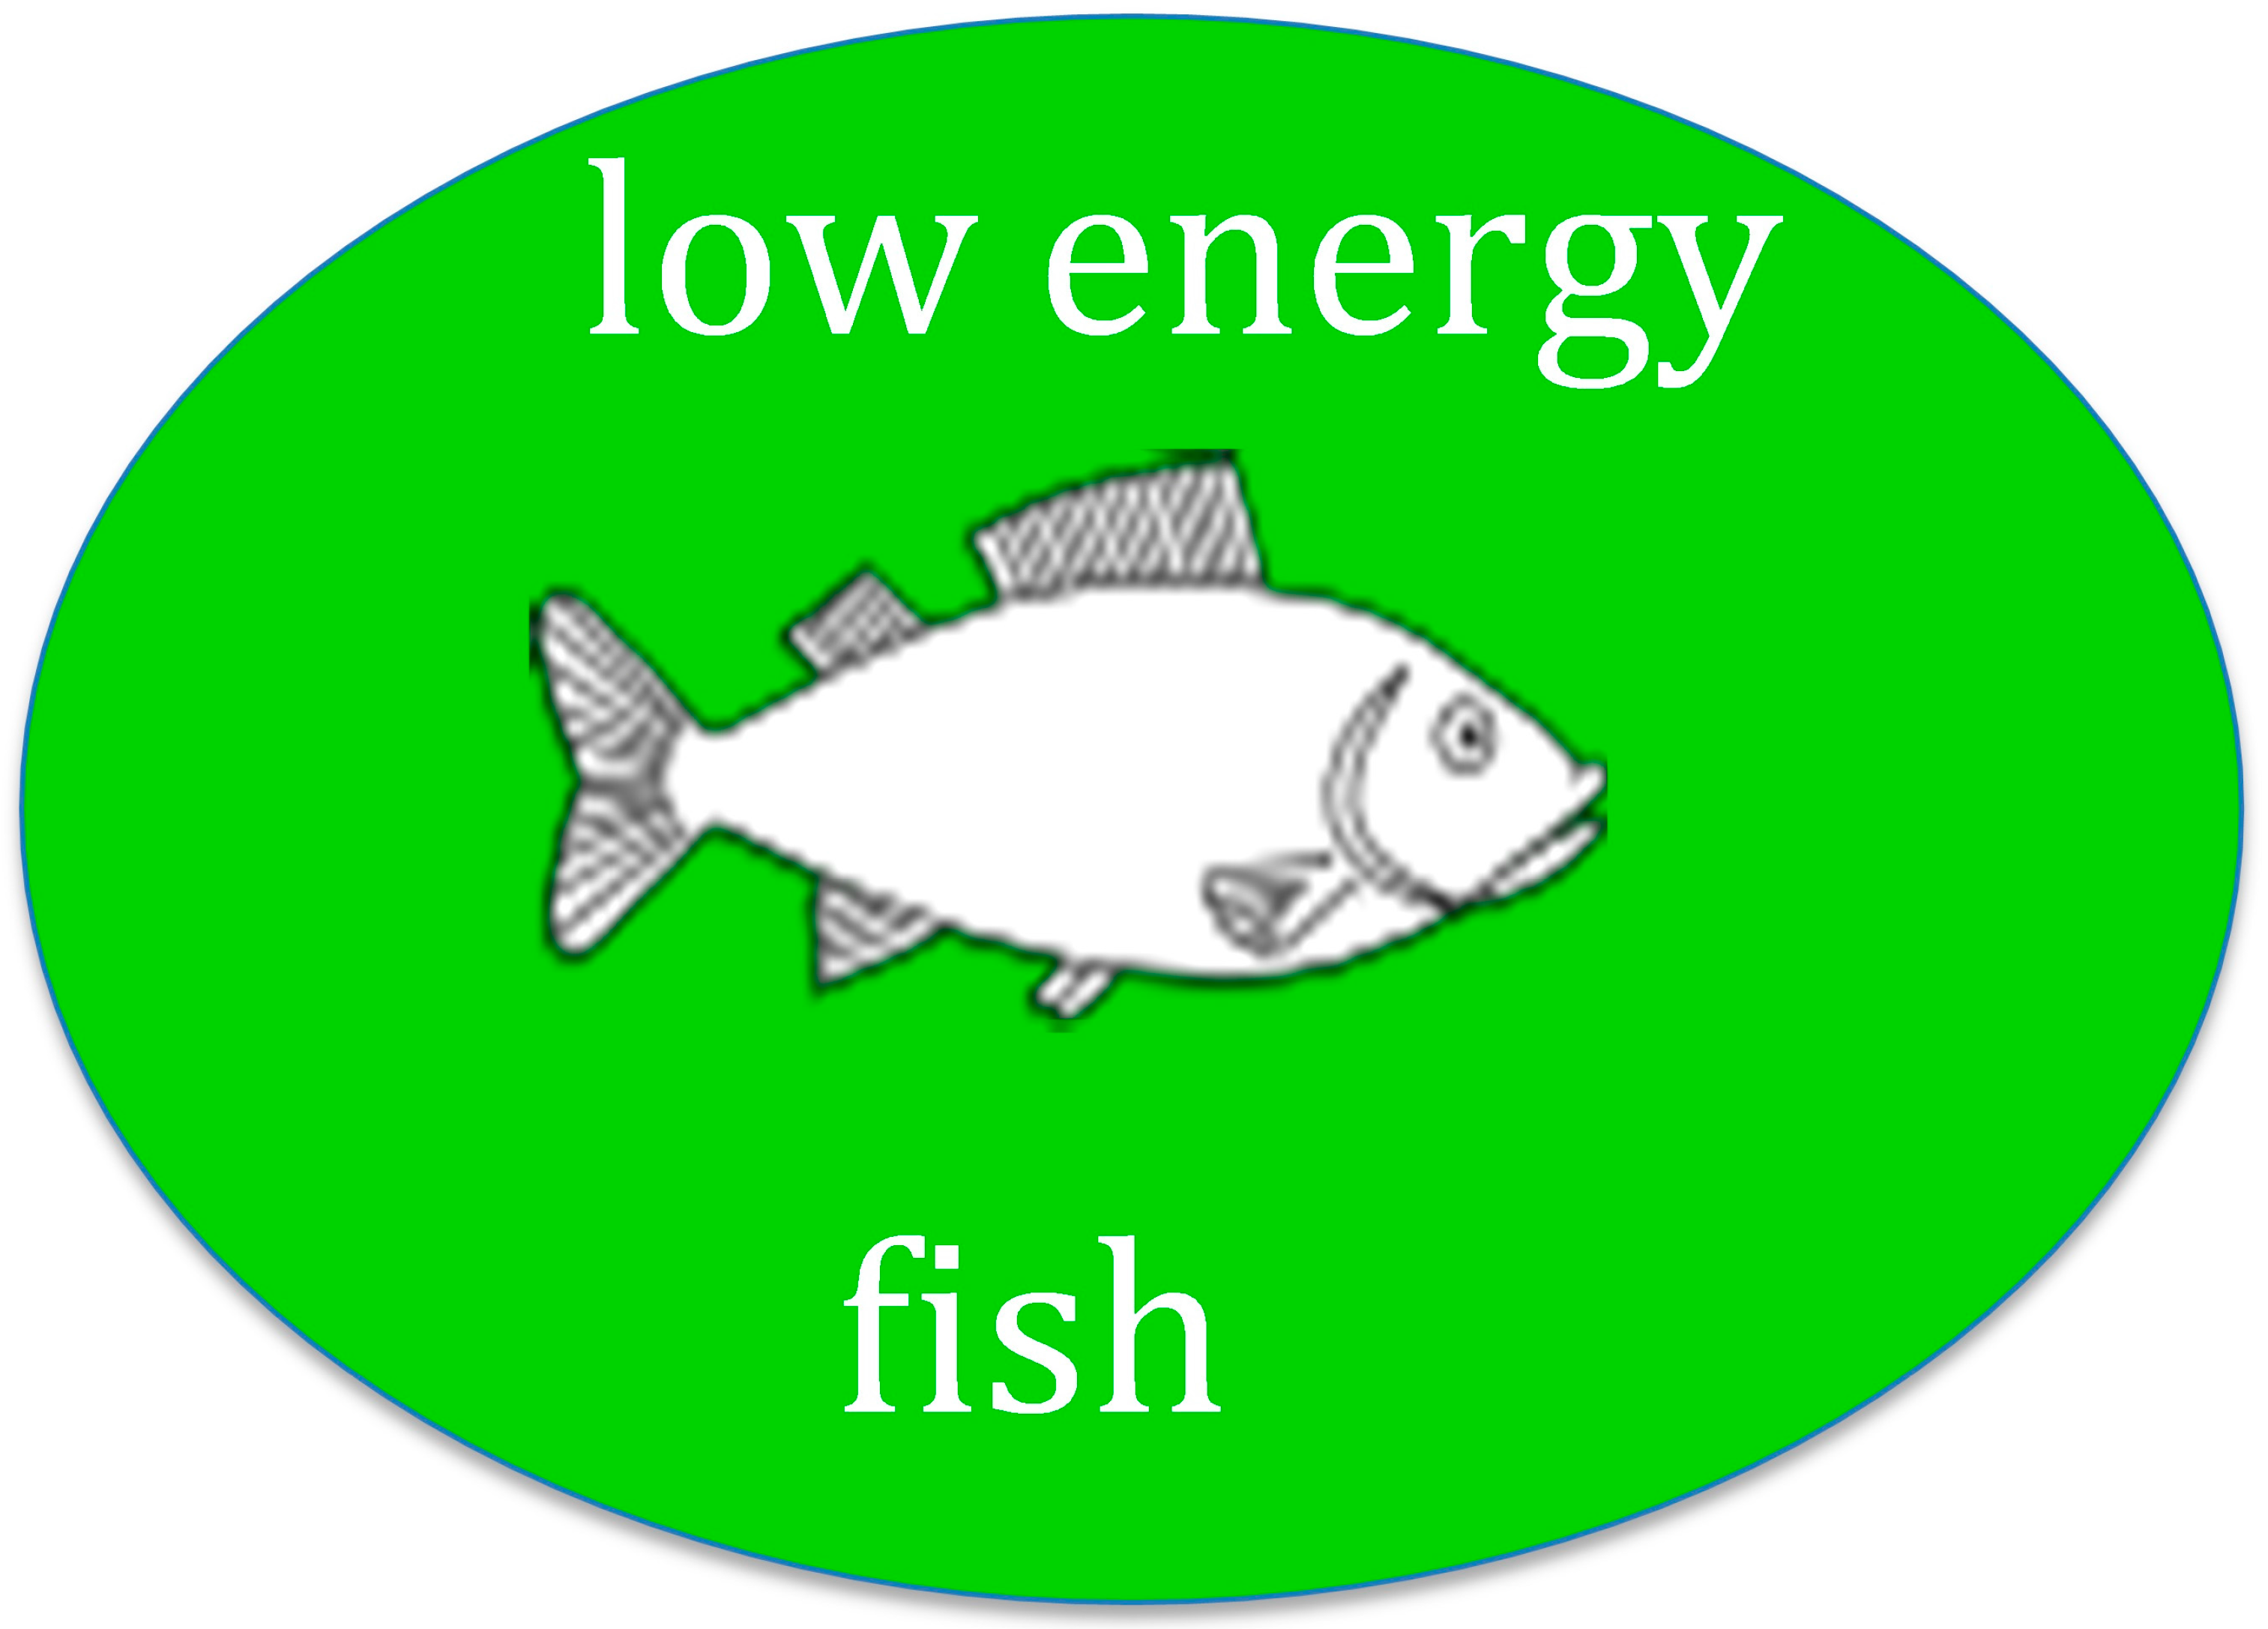
3.1. Stamp of Approval

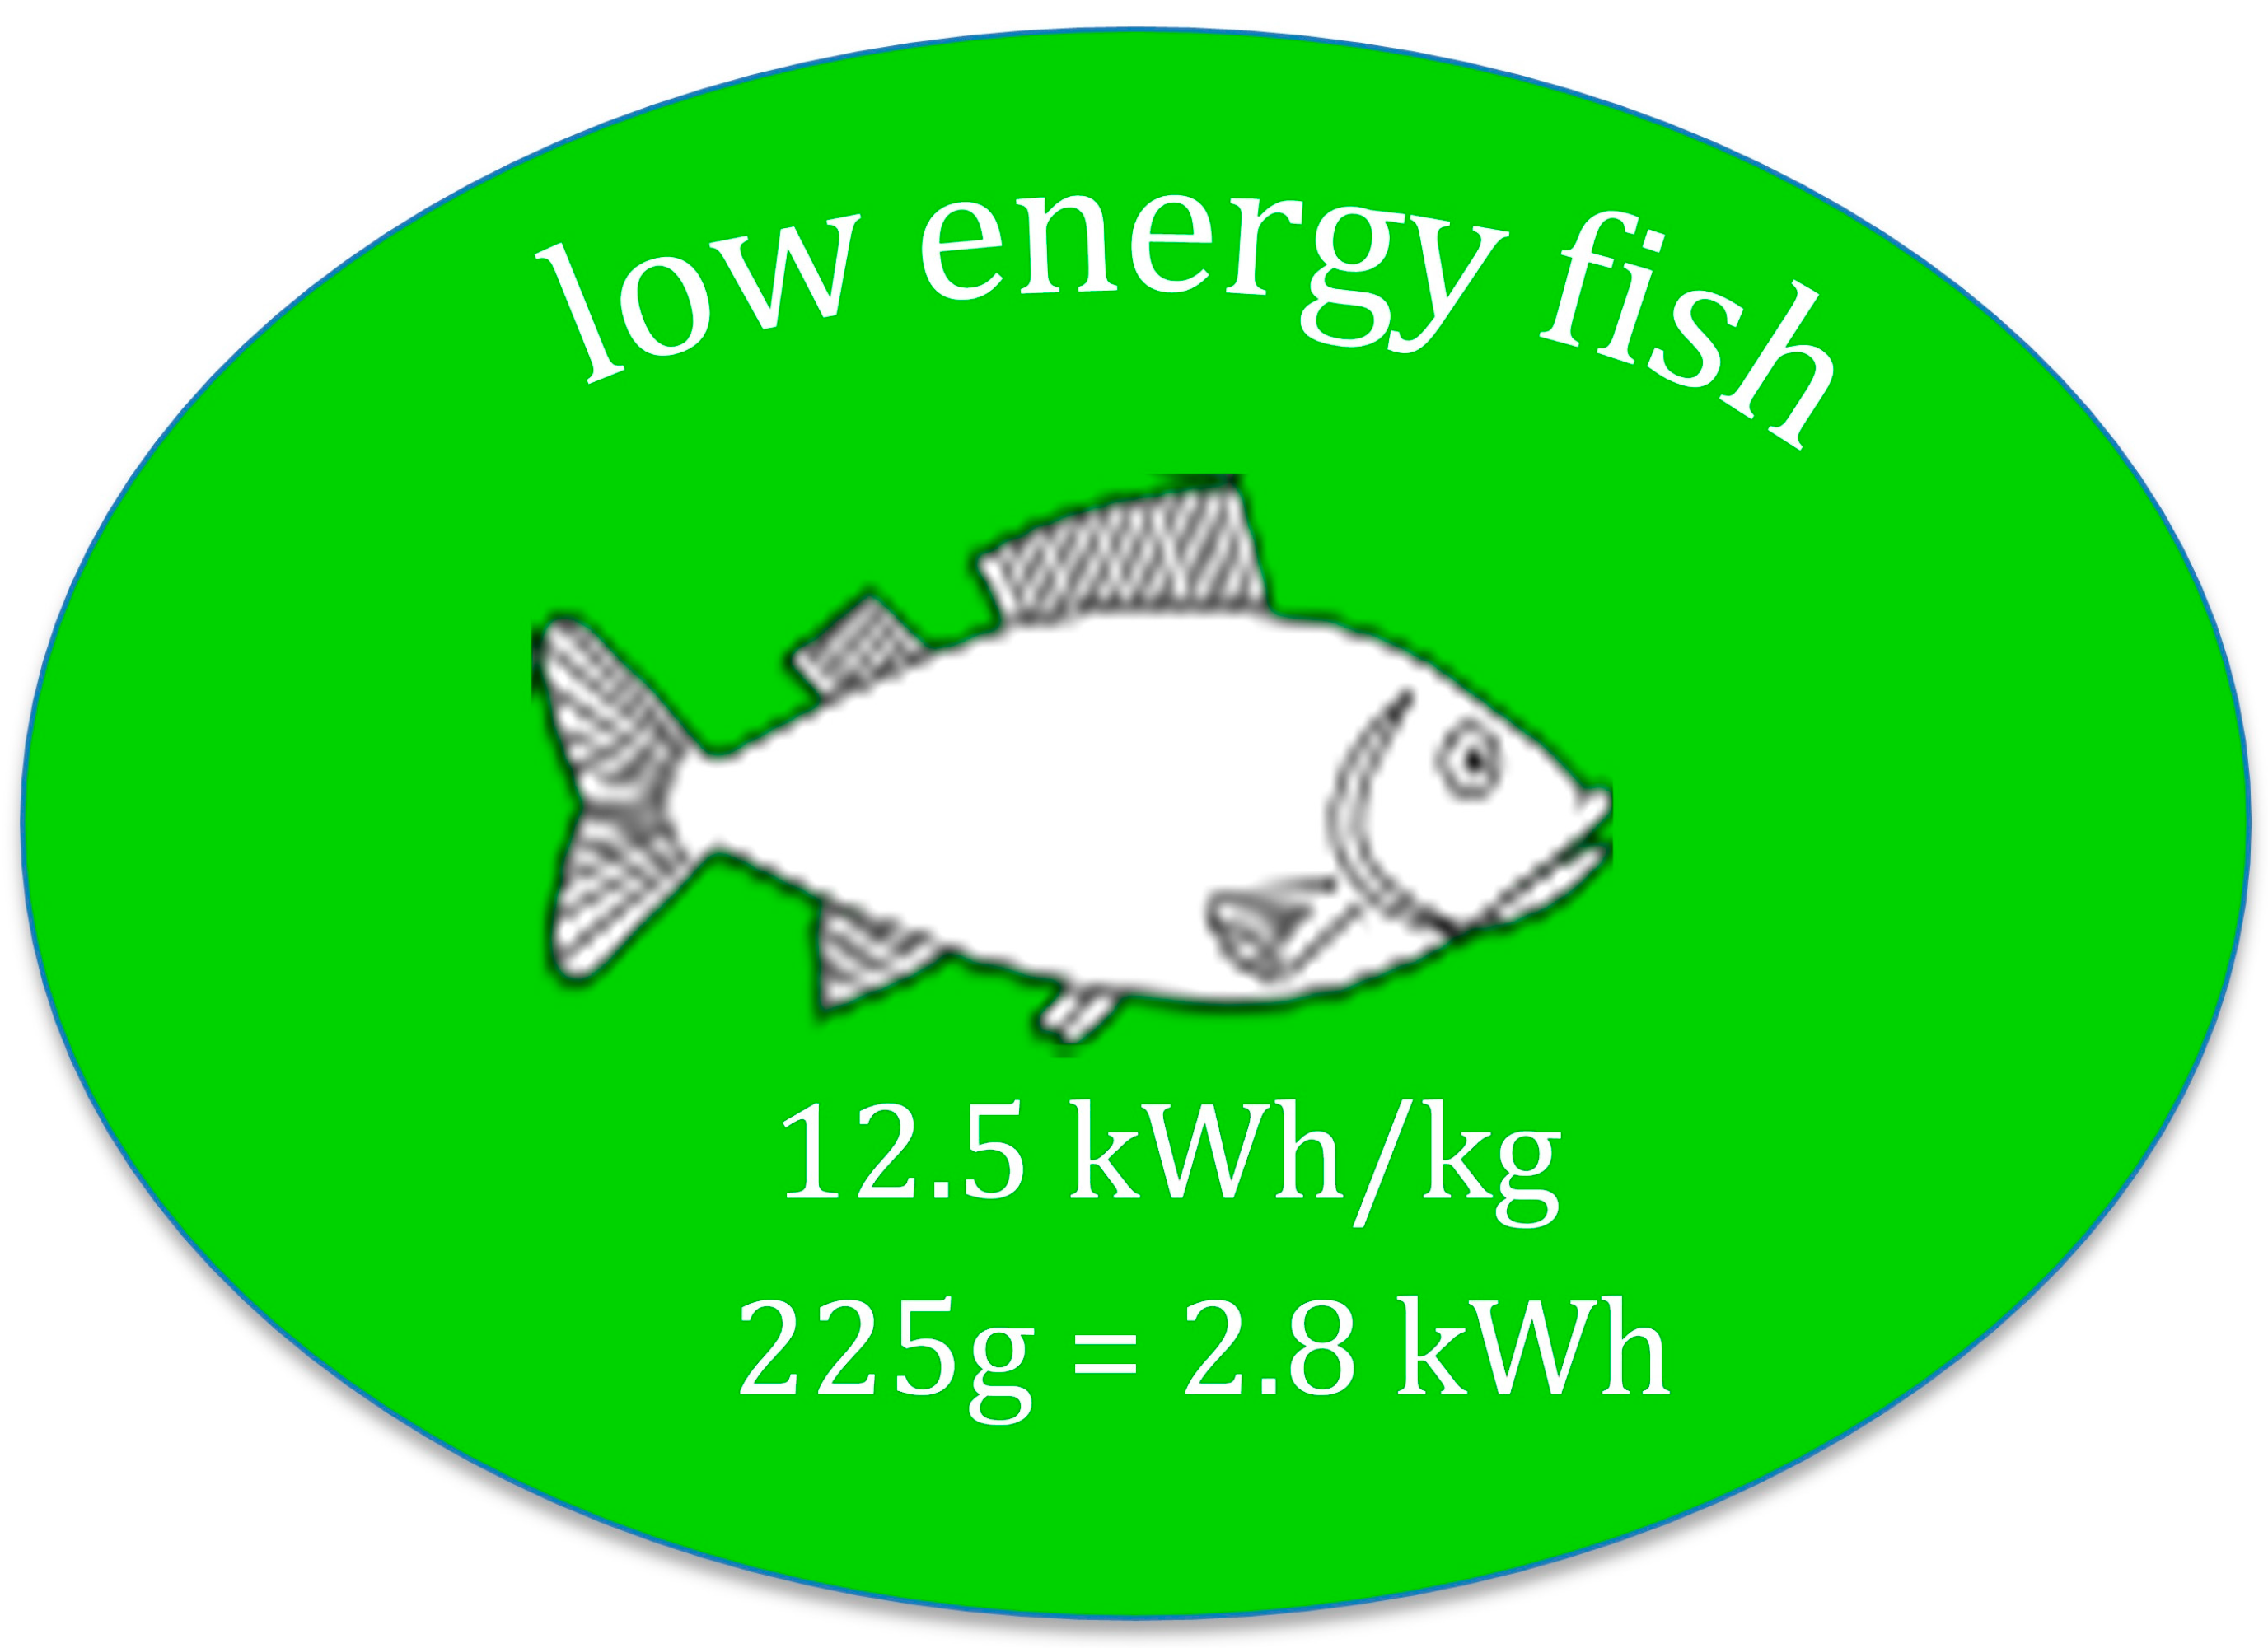
3.2. Absolute Numbers

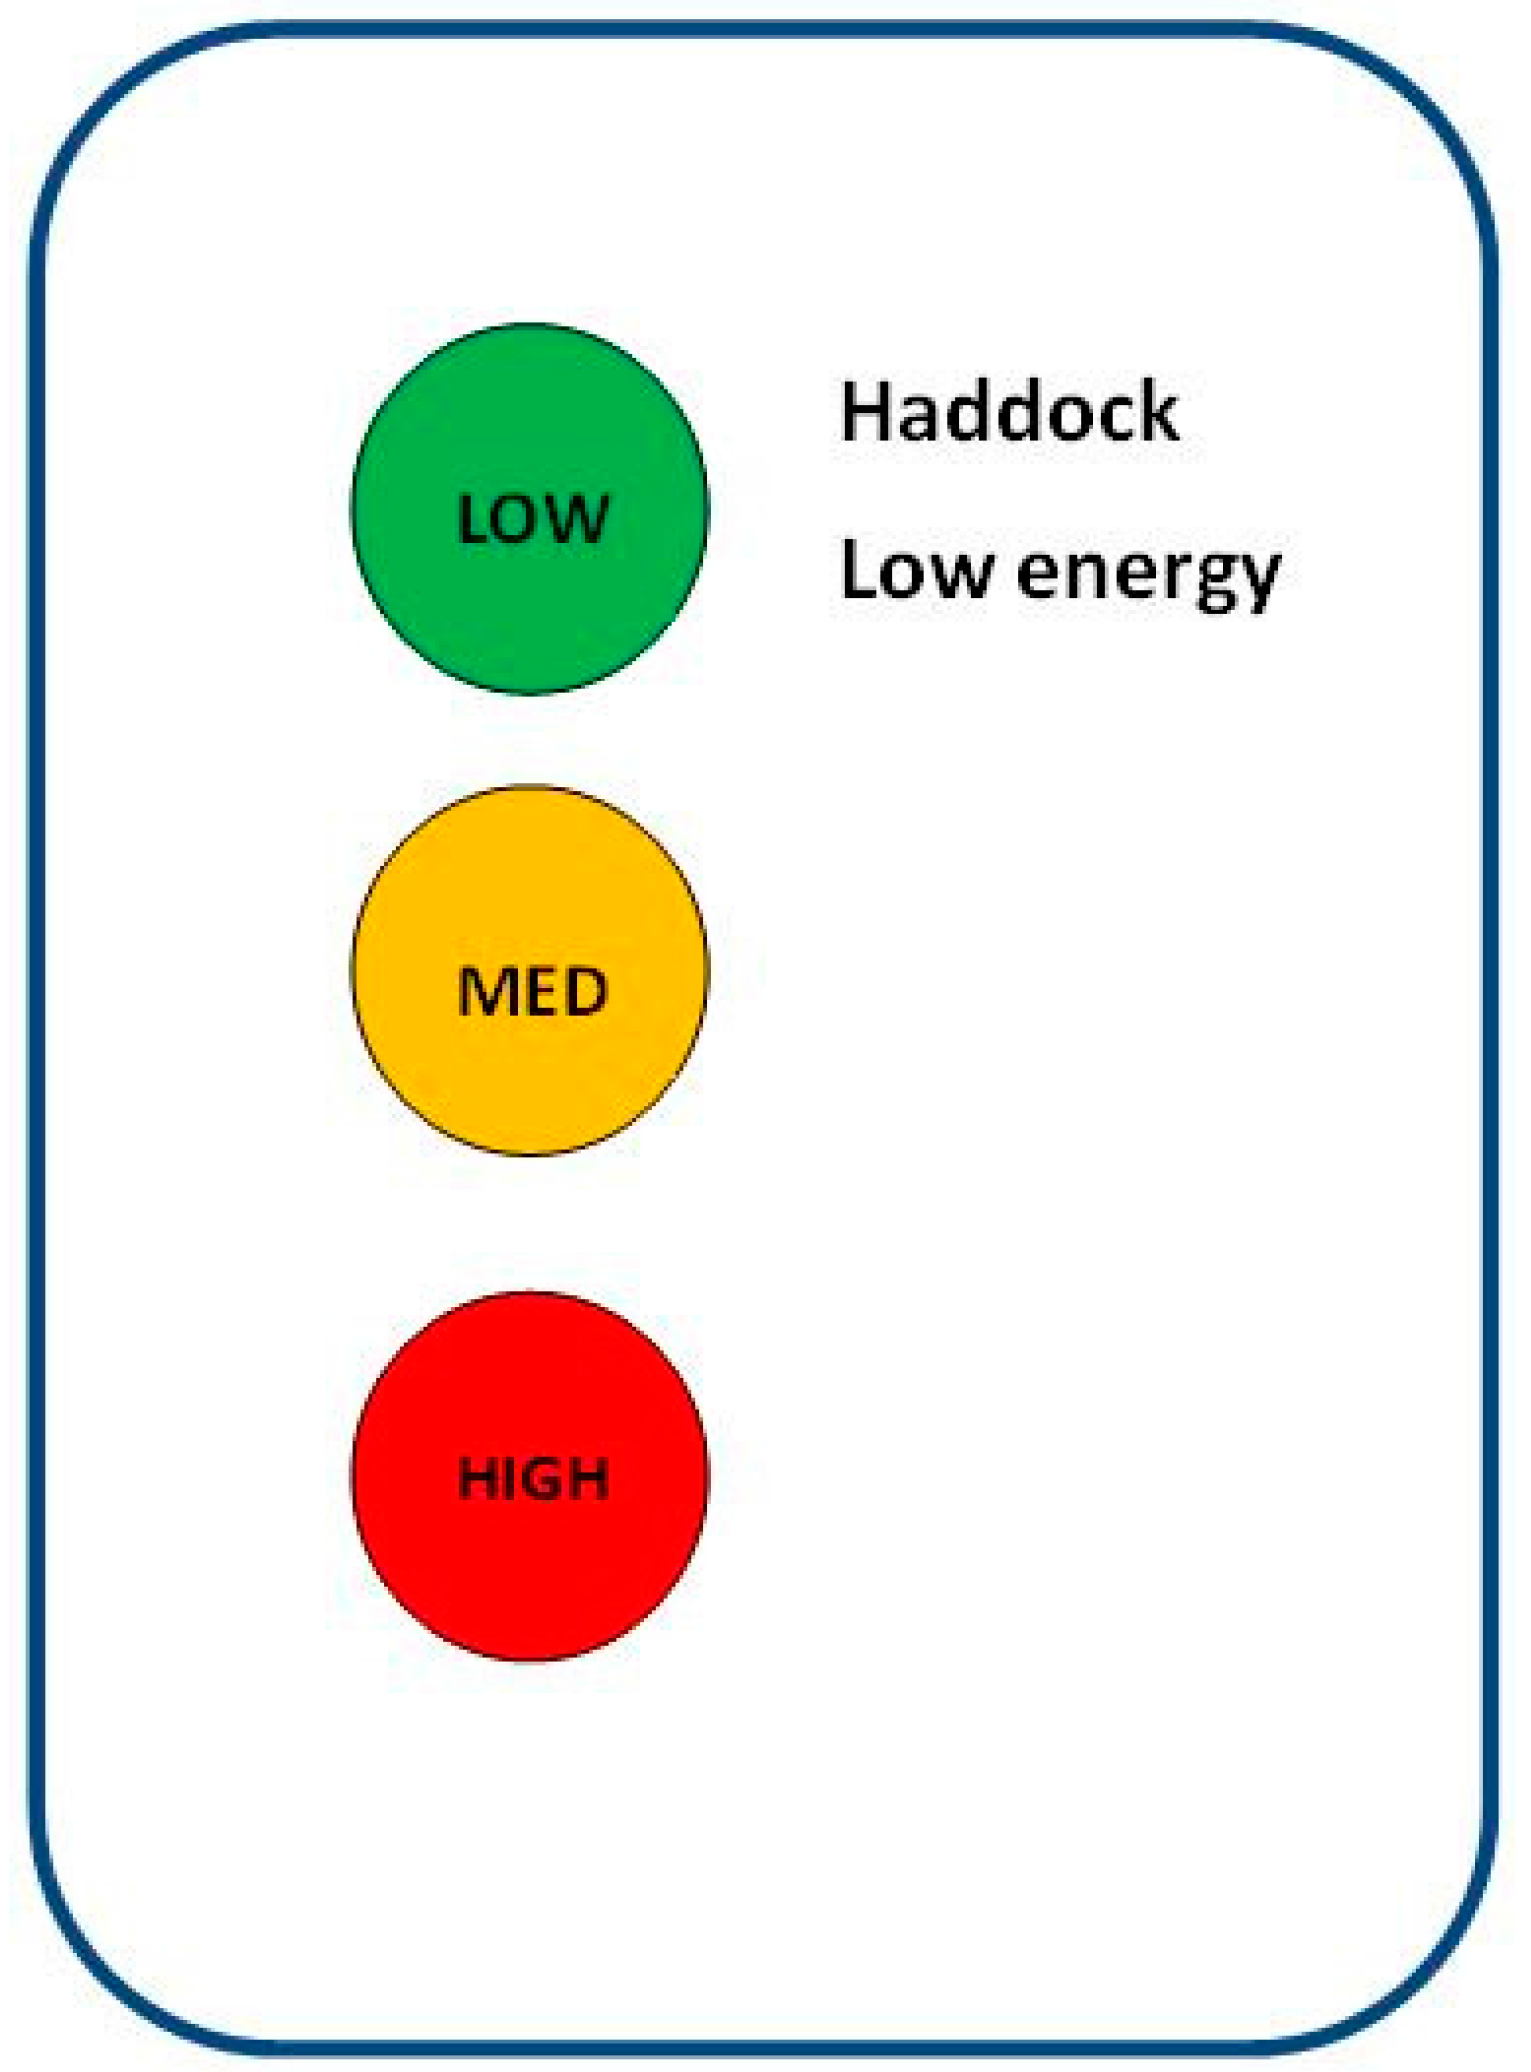
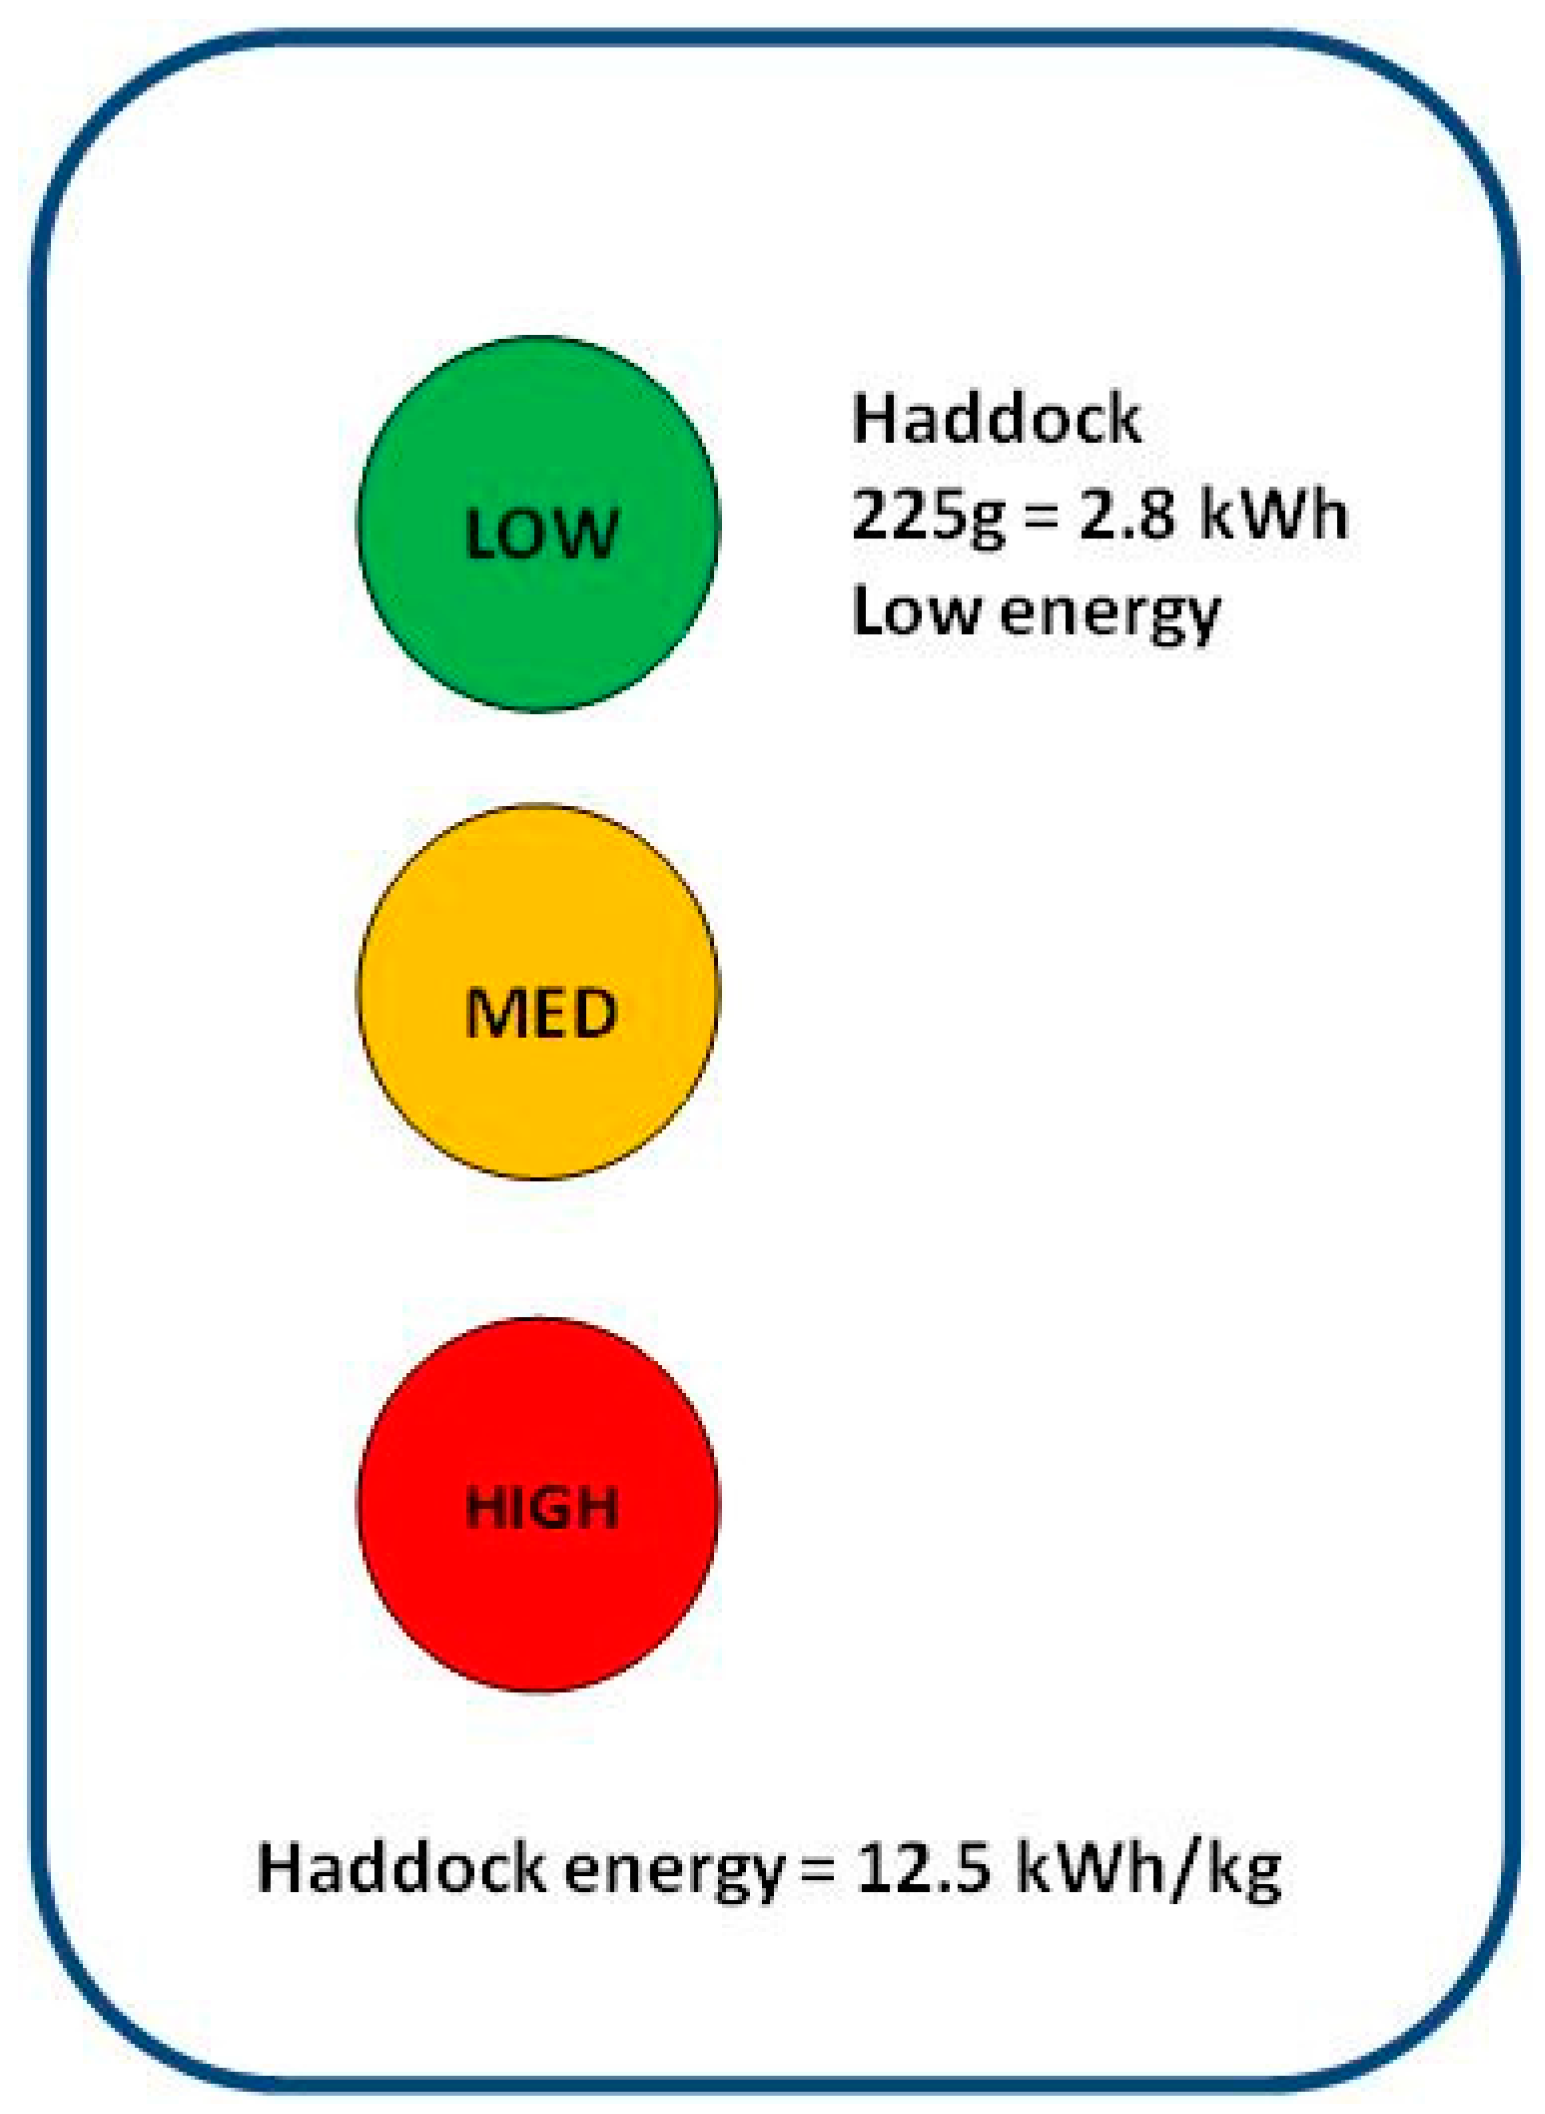
3.3. Traffic Lights


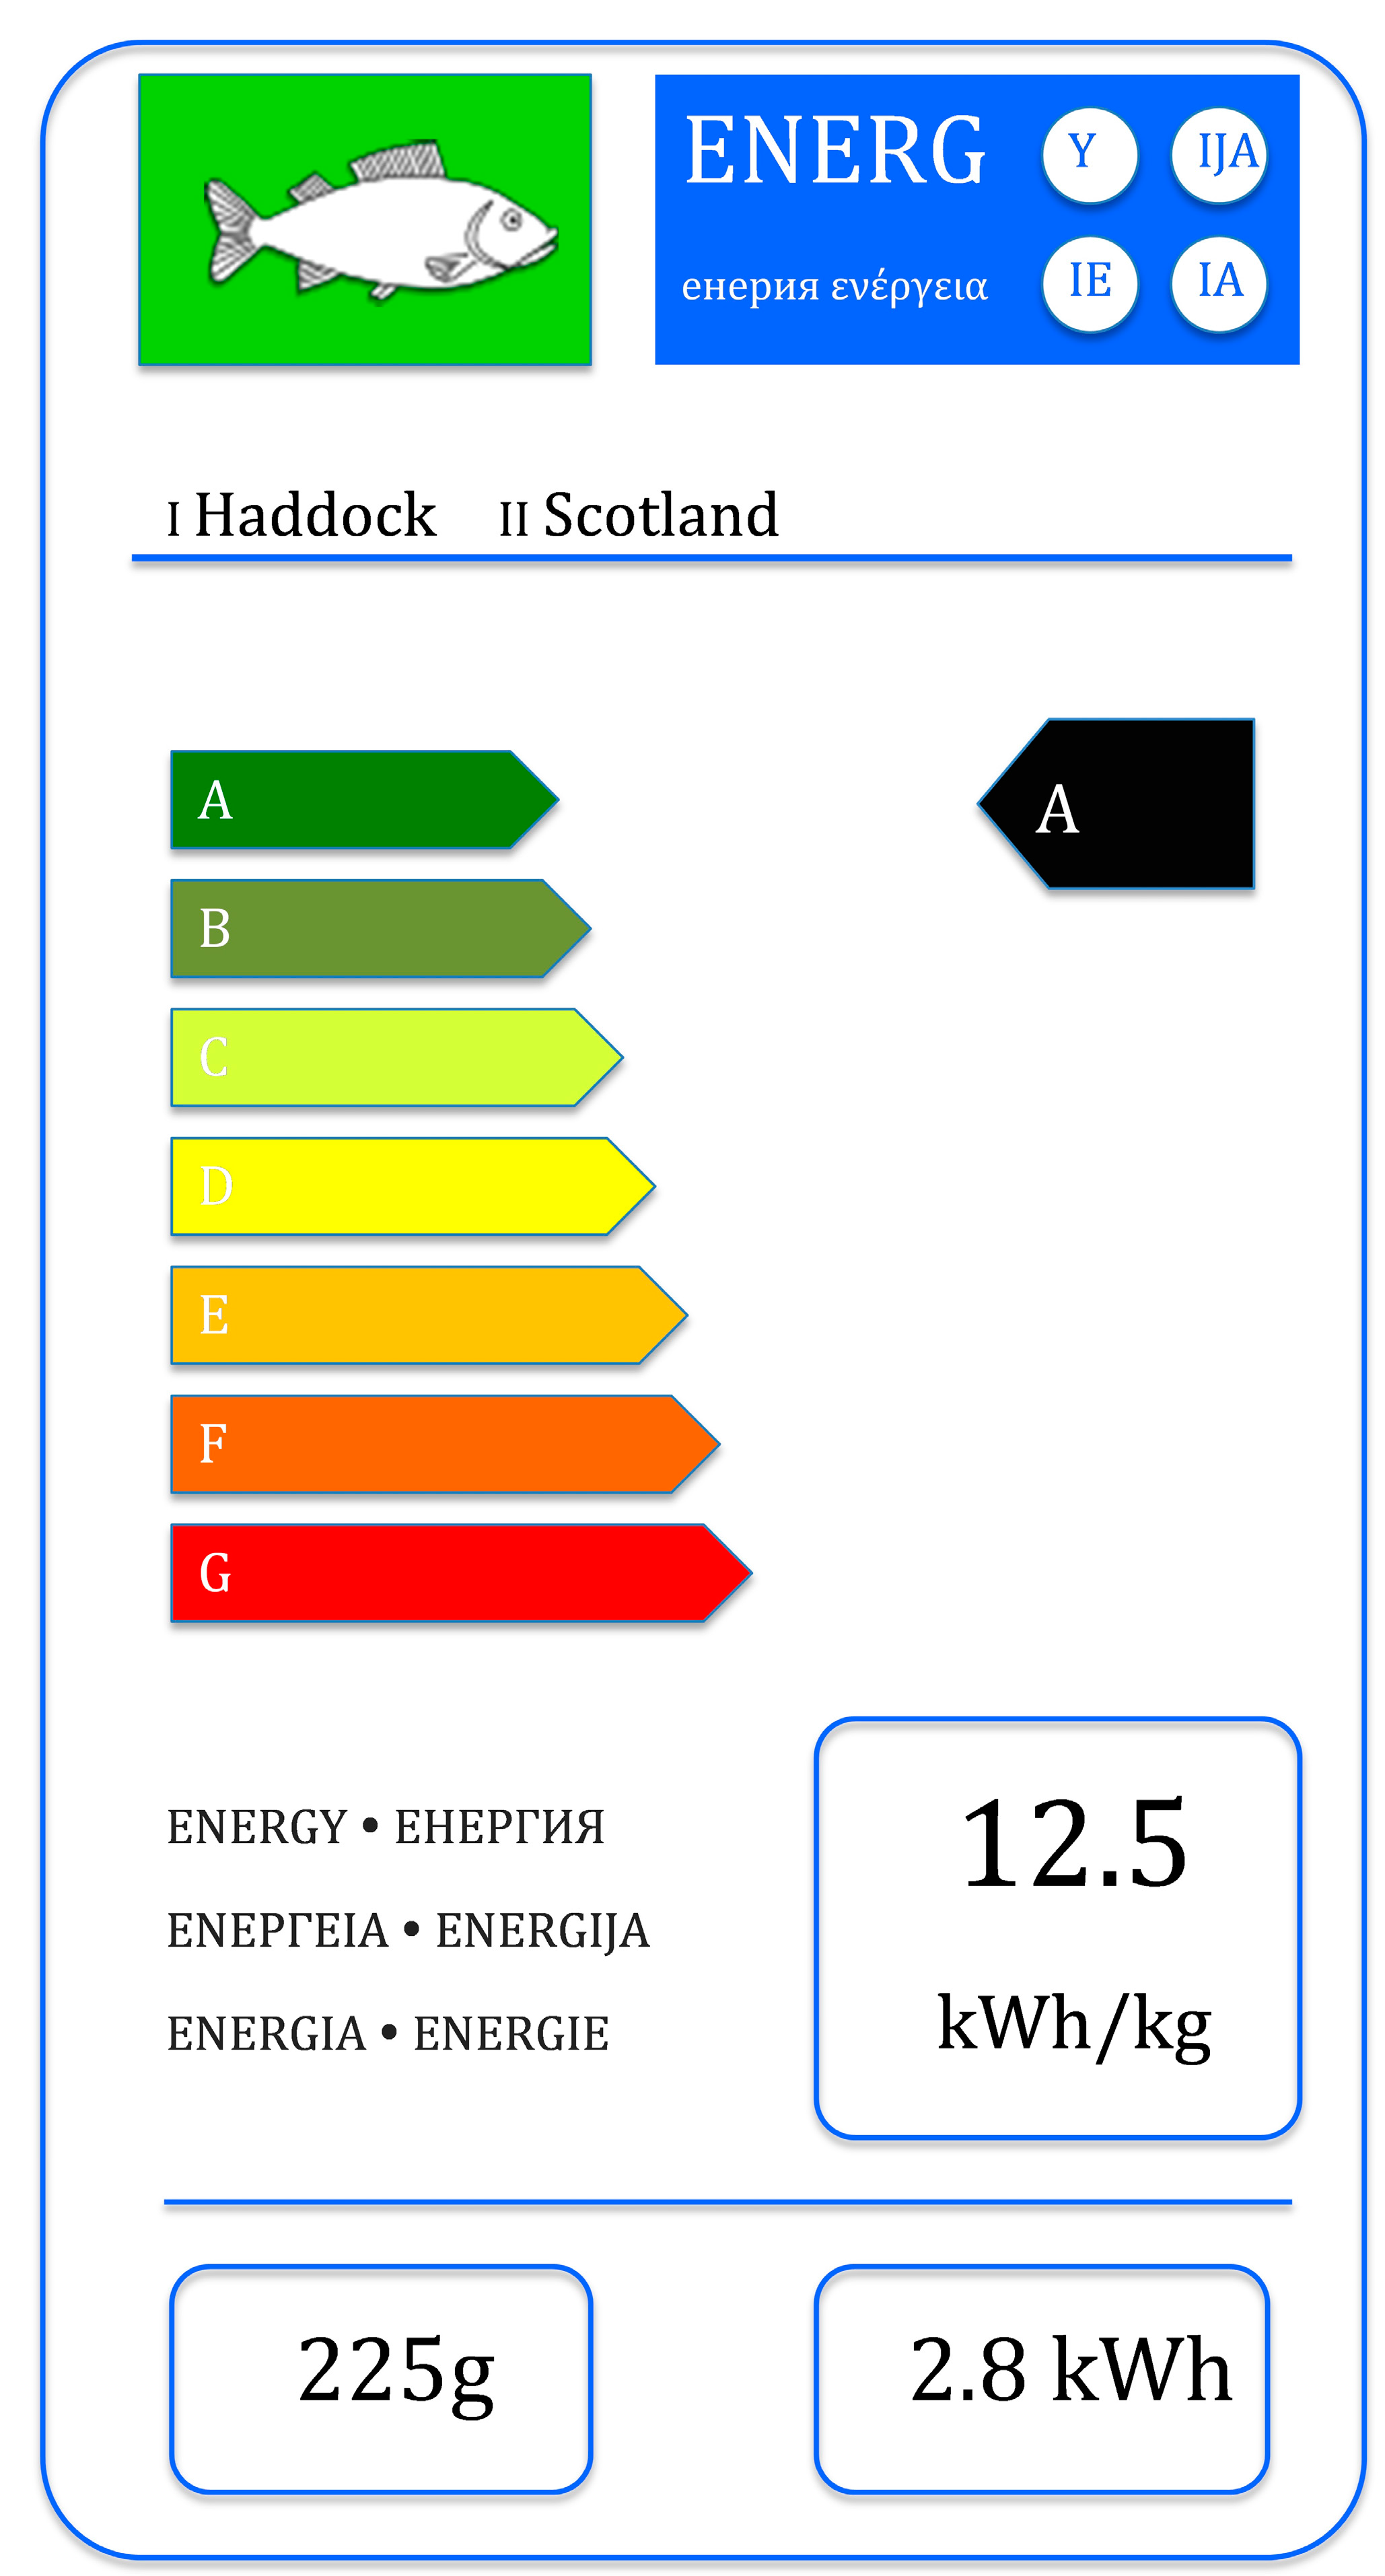
3.4. Sliding Scale

3.5. Supporting Information
4. Conclusions
Acknowledgments
Author Contributions
Conflicts of Interest
References
- The Objectives of E-Harbours. Available online: http://eharbours.eu/about (accessed on 6 December 2012).
- Raskin, J. Rationalizing information representation. In Information Design; Jacobsen, R., Ed.; MIT Press: Cambridge, MA, USA, 1999; pp. 341–348. [Google Scholar]
- Jacobsen, R. Preface. In Information Design; Jacobsen, R., Ed.; MIT Press: Cambridge, MA, USA, 1999; pp. xv–xvi. [Google Scholar]
- Jacobsen, R. Introduction: Why information design matters. In Information Design; Jacobsen, R., Ed.; MIT Press: Cambridge, MA, USA, 1999; pp. 1–10. [Google Scholar]
- Horne, R. Information design: The emergence of a new profession. In Information Design; Jacobsen, R., Ed.; MIT Press: Cambridge, MA, USA, 1999; pp. 15–34. [Google Scholar]
- Thwaites, H. Visual design in three dimensions. In Information Design; Jacobsen, R., Ed.; MIT Press: Cambridge, MA, USA, 1999; pp. 221–246. [Google Scholar]
- Shedroff, N. Information interaction design: A unified field theory of design. In Information Design; Jacobsen, R., Ed.; MIT Press: Cambridge, MA, USA, 1999; pp. 267–292. [Google Scholar]
- Redish, J.C. What is information design? Tech. Commun. 2000, 47, 163–166. [Google Scholar]
- Sless, D. Measuring information design. Inf. Des. J. 2008, 16, 250–258. [Google Scholar]
- Basic ID-concepts. Available online: http://www.iiid.net/PDFs/Basic%20ID-concepts.pdf (accessed on 10 December 2012).
- Bertins, J. Semiology of Graphics: Diagrams Networks Maps; University of Wisconsin Press: Madison, WI, USA, 1983. [Google Scholar]
- Petterson, R. Information Design: An Introduction; John Benjamins: Amsterdam, The Netherlands, 2002. [Google Scholar]
- Lipton, R. The Practical Guide to Information Design; John Wiley: Hoboken, NJ, USA, 2007. [Google Scholar]
- Tufte, E.R. Envisioning Information; Graphics Press: Cheshire, CT, USA, 1990. [Google Scholar]
- Marsh, E.E.; White, M.D. A taxonomy of relationships between images and text. J. Doc. 2003, 59, 647–672. [Google Scholar] [CrossRef]
- Leonidas, G. Information design: The missing link in information management? Int. J. Inf. Manag. 2000, 20, 73–76. [Google Scholar] [CrossRef]
- About QRcode.com. Available online: http://www.qrcode.com/en/index.html (accessed on 10 December 2012).
- Boström, M. Regulatory credibility and authority through inclusiveness: Standardization organizations in cases of eco-labelling. Organization 2006, 13, 345–367. [Google Scholar] [CrossRef]
- Development of a Framework for Practical and Effective Eco-Labelling of Food Products. Available online: http://randd.defra.gov.uk/Document.aspx?Document=FO0419_10000_FRA.pdf (accessed on 5 March 2013).
- Berry, T.; Crossley, D.; Jewell, J. Check-out Carbon: The Role of Carbon Labelling in Delivering a Low-Carbon Shopping Basket; Forum for the Future: London, UK, 2008. [Google Scholar]
- Héroux, L.; Laroche, M.; McGown, K.L. Consumer product label information processing: An experiment involving time pressure and distraction. J. Econ. Psychol. 1988, 9, 195–214. [Google Scholar] [CrossRef]
- Fuenekes, G.I.J.; Gortemaker, I.A.; Willems, A.A.; Lion, R.; van den Kommer, M. Front-of-pack nutrition labelling: Testing effectiveness of different nutrition labelling formats front-of-pack in four European countries. Appetite 2008, 50, 57–70. [Google Scholar] [CrossRef] [PubMed]
- Kimura, A.; Wada, Y.; Kamada, A.; Masuda, T.; Okamoto, M.; Goto, S.; Tsuzuki, D.; Cai, D.; Oka, T.; Dan, I. Interactive effects of carbon footprint information and its accessibility on value and subjective qualities of food products. Appetite 2010, 55, 271–278. [Google Scholar] [CrossRef] [PubMed]
- Teisl, M.; Rubin, J.; Noblet, C.L. Non-dirty dancing? Interactions between eco-labels and consumers. J. Econ. Psychol. 2008, 29, 140–159. [Google Scholar] [CrossRef]
- Dimara, E.; Skuras, D. Consumer demand for informative labeling of quality food and drink products: A European Union case study. J. Consum. Market. 2005, 22, 90–100. [Google Scholar] [CrossRef]
- Pieniak, Z.; Kolodziejczyk, M.; Kowrygo, M.; Verbeke, W. Consumption patterns and labelling of fish and fishery products in Poland after the EU accession. Food Control 2011, 22, 843–850. [Google Scholar] [CrossRef]
- Van Amstel, M.; Driessen, P.; Glasbergen, P. Eco-labeling and information asymmetry: A comparison of five eco-labels in the Netherlands. J. Clean. Product. 2008, 16, 263–276. [Google Scholar] [CrossRef]
- Gadema, Z.; Oglethorpe, D. The use and usefulness of carbon labelling food: A policy perspective from a survey of UK supermarket shoppers. Food Policy 2011, 36, 815–822. [Google Scholar] [CrossRef]
- Grunert, K.G.; Wills, J.M. A review of European research on consumer response to nutrition information on food labels. J. Public Health 2007, 15, 385–399. [Google Scholar] [CrossRef]
- Bitgood, S. The ABCs of label design. In Visitor Studies: Theory, Research, and Practice, Volume 3; Bitgood, S., Benefield, A., Patterson, D., Eds.; Center for Social Design: Jacksonville, AL, USA, 1990. [Google Scholar]
- Braun, C.C.; Kline, P.B.; Silver, N.C. The influence of color on warning label perceptions. Int. J. Ind. Ergon. 1995, 15, 179–187. [Google Scholar] [CrossRef]
- Balcombe, K.; Fraser, I.; Di Falco, S. Traffic lights and food choice: A choice experiment examining the relationship between nutritional food labels and price. Food Policy 2010, 35, 211–220. [Google Scholar] [CrossRef]
- Carbon Labelling: Public Perceptions of the Debate. Available online: http://www.sci.manchester.ac.uk/uploads/carbonlabellingpublicperceptionsofthedebate.pdf (accessed on 7 March 2013).
- Boström, M.; Klintman, M. Eco-Standards, Product Labelling and Green Consumerism; Palgrave Macmillan: Basingstoke, UK, 2008. [Google Scholar]
- Upham, P.; Dendler, L.; Bleda, M. Carbon labeling of grocery products: Public perceptions and potential emissions reductions. J. Clean. Product. 2011, 19, 348–355. [Google Scholar] [CrossRef]
- Röös, E.; Tjärnemo, H. Challenges of carbon labeling of food products: A consumer research perspective. Br. Food J. 2011, 113, 982–996. [Google Scholar] [CrossRef]
- Pieniak, Z.; Verbeke, W.; Vermeir, I.; Brunsø, K.; Olsen, S.O. Consumer interest in fish information and labeling: Exploratory insights. J. Int. Food Agribus. Market. 2007, 19, 117–141. [Google Scholar] [CrossRef]
- Caswell, J.A.; Mojduszka, E.M. Using informational labeling to influence the market for quality in food products. Am. J. Agric. Econ. 1996, 78, 1248–1253. [Google Scholar] [CrossRef]
- Porritt, J.; Goodman, J. Fishing for Good; Forum for the Future: London, UK, 2005. [Google Scholar]
- Dendler, L. The role of product labelling schemes in shaping more sustainable production and consumption systems. In Social Dimensions of Environmental Change and Governance, Proceedings of the 10th Conference on the Human Dimensions of Global Environmental Change, Berlin, Germany, 8–9 October 2010; Freie Universität: Berlin, Germany, 2010. [Google Scholar]
- D’Souza, C.; Taghian, M.; Lamb, P. An empirical study on the influence of environmental labels on consumers. Corp. Commun.: Int. J. 2006, 11, 162–173. [Google Scholar] [CrossRef]
- Vanclay, J.K.; Shortiss, J.; Aulsebrook, S.; Gillespie, A.M.; Howell, B.C.; Johanni, R.; Adams, R.A.; Maher, M.J.; Mitchell, K.M.; Stewart, M.D.; et al. Customer response to carbon labeling of groceries. J. Consum. Policy 2011, 34, 153–160. [Google Scholar] [CrossRef]
- Grankvist, G.; Biel, A. The importance of beliefs and purchase criteria in the choice of eco-labeled foods. J. Environ. Psychol. 2001, 21, 405–410. [Google Scholar] [CrossRef]
- Bougherara, D.; Combris, P. Eco-labelled food products: What are consumers paying for? Eur. Rev. Agric. Econ. 2009, 36, 321–341. [Google Scholar] [CrossRef]
- Leire, C.; Thidell, Å. Product-related environmental information to guide consumer purchases—A review and analysis of research on perceptions, understanding and use among Nordic consumers. J. Clean. Product. 2005, 13, 1061–1070. [Google Scholar] [CrossRef]
- Verbeke, W.; Vanhonacker, F.; Sioen, I.; Van Camp, J.; de Henauw, S. Perceived importance of sustainability and ethics related to fish: A consumer behavior perspective. AMBIO: J. Human Environ. 2007, 36, 580–585. [Google Scholar] [CrossRef]
- Kole, A.P.W.; Altintzoglou, T.; Schelvis-Smit, R.A.A.M.; Luten, J.B. The effect of different types of product information on the consumer product evaluation for fresh cod in real life settings. Food Qual. Prefer. 2009, 20, 187–194. [Google Scholar] [CrossRef]
- Brécard, D.; Hlaimi, B.; Lucas, S.; Perraudeau, Y.; Salladarré, F. Determinants of demand for green products: An application to eco-label demand for fish in Europe. Ecol. Econ. 2009, 69, 115–125. [Google Scholar] [CrossRef]
- Rex, E.; Baumann, H. Beyond ecolabels: What green marketing can learn from conventional marketing. J. Clean. Product. 2007, 15, 567–576. [Google Scholar] [CrossRef]
- Borin, N.; Cerf, D.C.; Krishnan, R. Consumer effects of environmental impact in product labelling. J. Consum. Market. 2011, 28, 76–86. [Google Scholar] [CrossRef]
- Caswell, J.A.; Padberg, D.I. Toward a more comprehensive theory of food labels. Am. J. Agric. Econ. 1992, 74, 460–468. [Google Scholar] [CrossRef]
- Sonderskøv, K.M.; Daugbjerg, C. The state and consumer confidence in eco-labeling: Organic labeling in Denmark, Sweden, The United Kingdom and The United States. Agric. Human Value 2011, 28, 507–517. [Google Scholar] [CrossRef]
- Onozaka, Y.; Thilmany McFadden, D. Does local labeling complement or compete with other sustainable labels? A conjoint analysis of direct and joint values for fresh produce claim. Am. J. Agric. Econ. 2011, 93, 689–702. [Google Scholar] [CrossRef]
- EU Organic Logo. Available online: http://ec.europa.eu/news/agriculture/120704_en.htm (accessed on 29 January 2013).
- Fairtrade—We Are Committed to Making a World of Difference. Available online: http://www.co-operativefood.co.uk/ethics/Ethical-trading/Fairtrade-2013/ (accessed on 8 March 2013).
- British Standards Institution. BIP3073:2006 Environment Labelling and Lifecycle Assessment CD-ROM; [CD-ROM]; British Standards Institution: London, UK, 2006. [Google Scholar]
- Labeling: 2degrees Sustainability Essentials. Available online: http://www.2degreesnetwork.com/groups/supply-chain/resources/2degrees-essentials-guide-labeling/ (accessed on 29 January 2013).
- The FAIRTRADE Mark. Available online: http://www.fairtrade.org.uk/what_is_fairtrade/fairtrade_certification_and_the_fairtrade_mark/the_fairtrade_mark.aspx (accessed on 29 January 2013).
- The EU Ecolabel. Available online: http://ec.europa.eu/environment/ecolabel/index_en.htm (accessed on 31 January 2013).
- Importance of Forest Stewardship. Available online: http://ic.fsc.org/importance-of-forest-stewardship.349.htm (accessed on 31 January 2013).
- Household Appliances—Labeling. Available online: http://ec.europa.eu/energy/efficiency/labelling/labelling_en.htm (accessed on 5 February 2013).
- Fernandes, P.G.; Cook, R.M. Reversal of fish stock decline in the Northeast Atlantic. Curr. Biol. 2013, 15, 1432–1437. [Google Scholar] [CrossRef]
© 2015 by the authors; licensee MDPI, Basel, Switzerland. This article is an open access article distributed under the terms and conditions of the Creative Commons Attribution license (http://creativecommons.org/licenses/by/4.0/).
Share and Cite
Grinnall, A.; Burnett, S. First Catch Your Fish: Designing a “Low Energy Fish” Label. Sustainability 2015, 7, 6086-6101. https://0-doi-org.brum.beds.ac.uk/10.3390/su7056086
Grinnall A, Burnett S. First Catch Your Fish: Designing a “Low Energy Fish” Label. Sustainability. 2015; 7(5):6086-6101. https://0-doi-org.brum.beds.ac.uk/10.3390/su7056086
Chicago/Turabian StyleGrinnall, Andy, and Simon Burnett. 2015. "First Catch Your Fish: Designing a “Low Energy Fish” Label" Sustainability 7, no. 5: 6086-6101. https://0-doi-org.brum.beds.ac.uk/10.3390/su7056086