Article

Structural Decomposition Analysis of Carbon Emissions and Policy Recommendations for Energy Sustainability in Xinjiang

1
Guangzhou Institute of Geography, Guangzhou 510070, China
2
Xinjiang Institute of Ecology and Geography, Chinese Academy of Sciences, Urumqi 830011, China
3
College of Resources and Environment, University of Chinese Academy of Sciences, Beijing 100049, China
*
Author to whom correspondence should be addressed.
Sustainability 2015, 7(6), 7548-7567; https://0-doi-org.brum.beds.ac.uk/10.3390/su7067548
Submission received: 12 May 2015 / Revised: 1 June 2015 / Accepted: 8 June 2015 / Published: 12 June 2015

Abstract

:
Regional carbon dioxide emissions study is necessary for China to realize the emissions mitigation. An environmental input–output structural decomposition analysis (IO-SDA) has been conducted in order to uncover the driving forces for the increment in energy-related carbon dioxide emissions in Xinjiang from both production and final demands perspectives from 1997 to 2007. According to our research outcomes, emissions increase can be illustrated as a competition between consumption growth (per capita GDP) and efficiency improvement (carbon emission intensity). Consumption growth have caused an increase of 109.98 Mt carbon dioxide emissions during 1997 to 2007, and efficiency improvement have caused a 97.03 Mt decrease during the same period. Per capita GDP is the most important driver for the rapid emission growth, while carbon emission intensity is the significant contributor to offset these increments. In addition, production structure changes performed as a new major driver for the steep rise in carbon dioxide emissions in recent years (2002–2007), indicating that the rapid emission growth in Xinjiang is the result of structural changes in the economy making it more carbon-intensive. From the viewpoint of final demands, fixed capital formation contributed the highest carbon dioxide emission, followed by inter-provincial export and urban residential consumption; while inter-provincial imports had the biggest contributions to offset emission increments. Based on our analysis results, Xinjiang may face great challenges to curb carbon dioxide emissions in the near future. However, several concrete mitigation measures have been further discussed and then raised by considering the regional realities, aiming to harmonize regional development and carbon dioxide emissions reduction.

1. Introduction

Carbon emissions from fossil fuel combustion for promoting economic development are regarded as the important drivers for global climate changes [1,2,3,4,5,6]. China, the biggest emerging and developing country, has become the world’s top energy consumer and CO2 emitter after decades of rapid economic growth and rapid-pace urbanization and industrialization [7,8,9,10,11]. Under such a circumstance, Chinese government released a binding reduction target, namely to decrease carbon dioxide emissions per unit gross domestic product (GDP) in 2020 by 40%–45% compared to the 2005 level [12,13], as well as slash the intensity of carbon emissions per unit GDP by 17% in 2015 compared to the 2010 level during the 12th Five-Year Plan [14]. Meanwhile, China was also aiming for a national cap on total energy use of below four billion tons of coal equivalent by 2015.
Recently, an increasing number of studies have been conducted by global and national researchers to uncover the main driving forces for the increasing carbon emissions in China. Peters et al. conducted a structural decomposition analysis (SDA) to analyze how changes in technology, economic structure, urbanization, and lifestyles affected China’s growing carbon emissions from 1992 to 2002 [15], and found that infrastructure construction and urban household consumption had played big effects on total emissions, while technology and efficiency improvements have only partially offset emissions growth. Using the IO-SDA (input–output structural decomposition analysis), Zhang examined the supply-side structure effect on the production-related carbon emissions in China from 1992 to 2005 [16], and Liu et al. evaluated the energy embodied in the international trade of China during the same period [17]; results show that increasing exports of energy-intensive goods enlarged energy embodied in trade, mainly due to the rapid growth of manufacturing sectors. Zhu et al. adopted IO-SDA method to investigate the indirect carbon emissions from residential consumption in China from 1992 to 2005 [18], results show that the rising residential consumption level accelerated the growth of residential indirect carbon emissions. By combining structural decomposition and input–output analysis framework, Guan et al. found that efficiency gains in production sectors could not cope with the increasing emissions in China from 2002 to 2005 [19]; they then forecasted that household consumption, capital investment and exports growth would largely increase the carbon emissions up to 2030, while efficiency gains would partially offset the projected increases [20]. Minx et al. used structural decomposition analysis to update Peters’ previous analysis of China’s carbon emissions and found that efficiency improvements have largely offset additional CO2 emissions from increased final consumption with special focus on the period 2002 to 2007 [21]. Xie investigated the driving forces of China’s energy use from 1992 to 2010; results show that three-quarters of energy consumption changes came from investment activity between 2007 and 2010 [22]. All of these studies highlighted the efforts of efficiency gains for curbing carbon emissions, and found that the rapid economic development and increasing exports growth had great positive effects on carbon emissions in China.
In particular, there are pronounced differences in development model, economic structure, consumption levels, available technology, residential lifestyles, and resource endowment across the different provinces within China [13,23,24]. Zhang et al. investigated China’s energy consumption change from 1987 to 2007 based on multi regional structural decomposition analysis, and found that the change of final demand outpaced efficiency improvements to stimulate energy use in all regions during 1987–2007 [25]. Su et al. investigated carbon emissions embodied in trade using the data for China and then dividing the country into eight regions, and found that it was meaningful to look into the spatial aggregation effect for a large country like China [26]. Therefore, there is an urgent need to have a deeper understanding on the national experience-based learning as well as provincial case-based empirical studies to inform itself of the best route to low-carbon sustainability.
Xinjiang province, an important energy base in northwest China, has an area of 1.66 million km2, accounting for 1/6 of the national total land area (Figure 1). According to the second national oil and gas resources evaluation, the energy resources reserves are abundant. The predictive reserves of oil in Xinjiang are 20.92 billion tons, accounting for 30% of China’s continental oil resources volume. The predictive reserves of gas in Xinjiang are 10.4 trillion cubic meters, accounting for 34% of the national onshore natural gas resources. The predictive coal reserves are 2.19 trillion tons, accounting for 40% of the national total predictive reserves. In addition, another important thing is that we cannot ignore the abundant renewable energy in Xinjiang, especially wind and solar photovoltaic power. Since the reform and opening after 1978, the utilization of energy resources has made great contribution to Xinjiang’s social economic development. Meanwhile, such economic development mode has brought serious environmental challenges to the arid ecosystem, especially the energy-related carbon emissions. From 2001 to 2010, rapid economic growth in Xinjiang accelerated the carbon emissions increase with an annual growth rate reaching 10.16% during the period of Western Development [27]. Therefore, Xinjiang local government explicitly pointed out that carbon dioxide emissions intensity would be strictly controlled in the newly published provincial 12th Five-Year Plan. Hence, there is an urgent need to uncover the driving forces of carbon emission increases in Xinjiang in the background of “energy conservation and emissions reduction”.
We present the case study applying the IO-SDA analytical framework on the regional scale, in order to analyze the energy related carbon emissions and recommend environmental mitigation policy. In the next section, following the Introduction, we present the research methodology, including a brief research methods introduction and the detailed calculation process. Then, Section 3 addresses the data collection and treatment. Section 4 presents the case analysis of Xinjiang province. The main results and discussion are drawn in Section 5. Finally, we conclude our case study and provide some effective and efficient mitigation policy implications.
Figure 1. Location of Xinjiang province in China.
Sustainability 07 07548 g001

2. Methodology

2.1. Structural Decomposition Analysis (SDA)

Two major decomposition techniques, the index decomposition analysis (IDA) and the structural decomposition analysis (SDA), have been widely performed to study the driving forces of the energy-related carbon emissions during the past decades. Su et al. comprehensively compared IDA and SDA based on the latest available information, and illustrated that research scope, data requirements and method formulation were the main reasons for the similarities as well as differences between IDA and SDA [28,29].
The IDA model derived from the IPAT framework, which can be readily applied to any available data sources at any aggregation level in a period-wise or time-series manner [30,31,32,33]. That is to say, data sources used for IDA are highly aggregated at the sector level, and this aggregation limits policy implications to the particular sectorial scale. In addition, the IDA model can only deal with direct effects while the indirect effects from final demands are often neglected.
Theses technological gaps mentioned above can be fully filled by applying the SDA framework. The SDA model is based on the economic input–output (IO) tables, which analyzes economic change by means of a set of comparative static changes in key parameters on the sector scale [34,35,36,37]. The introduction of the extended IO table (i.e., the Hybrid Input–Output Table) allowed application of SDA framework to be extended to study changes in energy consumption (e.g., energy use [22,25], energy intensity [38], etc.) and environmental issues (e.g., carbon emissions [15,21,39,40], water resources [35,41,42], mercury emissions [43], PM2.5 emissions [44], environmental pressure [45], etc.). The SDA model has been widely used already, thanks to its important feature and ability, namely, to distinguish the direct and indirect socio-economic effects from both intermediate production and final consumption perspectives [35,46].
Therefore, SDA method based on hybrid input–output table was applied in our study to uncover the driving forces of carbon emissions in Xinjiang province. The brief method introduction and detailed calculation process are presented as below:
C = E ( I A ) 1 y
where, C is the total carbon dioxide emissions; the 1×n row vector E represents the carbon intensity of GDP on sectoral scale; the n×1 column vector y represents the final demands volume, including final consumption (i.e., Government consumption, Urban household consumption, Rural household consumption), gross capital formation (i.e., Fixed capital formation, Inventory increase), and total import and export volume (i.e., Inter-provincial import, International import, Inter-provincial export, International export); I represents the n×n identify matrix; and A represents the n×n direct consumption coefficient matrix; L = ( I A ) 1 is the n×n Leontief inverse matrix, as shown in Equation (2).
C = E L y
The n×1 column vector y can be further decomposed into final demand structure y s and final demand volume. The final demand volume can be further decomposed into population size P and per capita final demand volume y v (per capita final demand volume equals per capita GDP), as shown in Equation (3).
y = P y s y v
Therefore, the total carbon dioxide emissions C can be calculated by the following Equation (4):
C = E × L × y s × y v × P
Furthermore, the carbon dioxide emissions changes Δ C can be decomposed into five influencing factors: carbon emission intensity E, production structure L, consumption structure y s , per capita GDP y v , and population size P, as shown in Equations (5) and (6).
Δ C = Δ E L y s y v P + E Δ L y s y v P + E L Δ y s y v P + E L y s Δ y v P + E s E i L y s y v Δ P
Δ C = f ( Δ E ) + f ( Δ L ) + f ( Δ y s ) + f ( Δ y v ) + f ( Δ P )
where, Δ E , Δ L , Δ y s , Δ y v , and Δ P represent the changes of each independent variable, respectively; and f ( Δ E ) , f ( Δ L ) , f ( Δ y s ) , f ( Δ y v ) , and f ( Δ P ) , represent carbon dioxide emission changes induced by each independent variable, respectively. As usual, the non-uniqueness issue is the main problem when conducting the SDA method, that is, the number of possible decomposition paths is n! [47,48], and the n! possible forms are equally valid. It is common to deal with this issue using the average of all n! possible equivalent exact decomposition forms to achieve the final ideal decomposition [14,15,20,49,50].
Subsequently, changes of carbon dioxide emissions induced by each category of final demands consumption have been widely performed [14,21,51,52]. Therefore, carbon dioxide emissions changes can be allocated by final demands by economic sectors according to final demand categories, if the n×1 column vector y t can be diagonalized into a n×1 matrix, as shown in Equation (7):
C k = E ( I A ) 1 y k
where, y k represents the. t category of final demands, C k represents the. k final demand’s carbon dioxide emissions.

2.2. Estimation of Carbon Dioxide Emissions

Carbon dioxide emissions of energy consumption were calculated according to the following method given by the IPCC Guidelines for National Greenhouse Gas Inventories [14,51], carbon emissions factors and the conversion factor are as follows:
C t = i E t i × L C V i × C F t i × O i × 44 / 12
where the subscript i is the various fuels in this study, t means the time in years, C t represents total carbon dioxide emissions in year t; (in million tons, Mt), E t i represents the total energy consumption of fuel type i in year t (million tons of standard coal equivalent, Mtce), and L C V i is the lower calorific value of fuel i. C F t i is the carbon emissions factors of the fuel type i; O i is the oxidation rate of fuel i; and 44 / 12 is the molecular weight ratio of carbon dioxide to carbon. The conversion factors, lower calorific value, fraction of carbon oxidized and carbon emission factors of the various fuels are listed in Table 1.
Table 1. Conversion factors, lower calorific value (LCV), oxidation rate and carbon emission factors of energy sources.
Energy SourcesConversion Factors aLCV (MJ/t or MJ/Mm3) bCarbon Emission Factors (t C/TJ) cOxidation Rate c
Raw coal0.714 t ce/t20.90825.8000.918
Cleaned coal0.900 t ce/t26.34427.6800.918
Other washed coal0.286 t ce/t8.36325.8000.918
Coke0.971 t ce/t28.43529.4100.928
Crude oil1.429 t ce/t41.81620.0800.979
Gasoline1.471 t ce/t43.07018.9000.986
Kerosene1.471 t ce/t43.07019.6000.980
Diesel oil1.457 t ce/t42.65220.1700.982
Fuel oil1.429 t ce/t41.81621.0900.985
Other petroleum products1.429 t ce/t41.81620.0000.980
Nature gas1.330 t ce/103 m338.93117.2000.990
LPG1.714 t ce/t50.17917.2000.989
Refinery gas1.571 t ce/t46.05518.2000.989
a Data resources:[14,53]; b Data resources:[51,54]; c Data resources:[51].

3. Data Management

In our case study in Xinjiang, three time-series monetary input–output tables (MIOTs) from 1997, 2002, and 2007 were constructed. Then, we aggregated all the sectors into 28 integrated economic sectors (e.g., 40 in 1997, and 42 in 2002 and 2007), in order to keep the data set consistent with the energy consumption data of industrial sectors (Table 2). The energy consumption and population data were collected from the regional energy balance table in the Xinjiang Statistical Yearbook, which are compiled by the National Bureau of Statistics of Xinjiang Statistical Bureau every five years. In addition, we converted the current prices in 2002 and 2007 into the 1997 constant prices by using the double deflation method [15], according to each sector’s producer price indices, in order to eliminate the deflation effect [14,50,51]. However, the impacts of sector and temporal aggregation issues should be kept in mind in empirical SDA studies [55,56]. Based on the comparative study of China and Singapore, Su et al. found that almost 40 sectors appeared to be sufficient to capture overall share of carbon emissions embodied in trade in terms of the sector aggregation issue [55]. As well as the temporal aggregation issue, if the extended IO tables (like 2000, 2005 and 2010) are available, the impacts of temporal aggregation can be reduced.
Table 2. Input–output table of 28 industries in Xinjiang province.
CodeSectorCodeSector
1Agriculture15Manufacture of electrical machinery and equipment
2Excavation16Manufacture of communication equipment, computers and other electronic equipment
3Processing of foods and tobacco17Manufacture of measuring instruments and machinery for cultural activity and office work
4Manufacture of textile18Other manufacturing
5Manufacture of textile wearing apparel, footwear, caps, leather, feather and related products19Recycling and disposal of waste
6Processing of timber and manufacture of furniture20Production and distribution of electric and heat power
7Manufacture of paper, printing and articles for culture, education and sport activity21Production and distribution of gas
8Processing of petroleum, coking and nuclear fuel22Production and distribution of water
9Chemistry23Construction
10Manufacture of non-metallic mineral products24Transport, storage, postal and telecommunications services
11Smelting and pressing of metals25Wholesale, retail trades, hotels and catering services
12Manufacture of metal products26Other services
13Manufacture of general and special purpose machinery27Manufacture of electrical machinery and equipment
14Manufacture of transport equipment28Manufacture of communication equipment, computers and other electronic equipment
Monetary input–output tables (MIOTs) of Xinjiang province comprise nine categories of final demands, which are: final consumption (e.g., urban residential consumption, rural residential consumption, and government consumption), gross capital formation (e.g., fixed capital investment, and inventory increases), and trades (inter-provincial exports, international exports, inter-provincial imports, and international imports). As for the input–output analysis of carbon emissions embodied in trade, “processing and normal” exports [57] and “competitive versus non-competitive” imports [58] are the two key issues in recent trade-related carbon emission research. In our case study, exports were assumed with the uniform input structures for processing and normal exports and imports were assumed with competitive import assumption. For the regional SDA studies in the future, efforts should be made to differentiate the different input structure for manufacturing processing and normal exports, as well as both interregional and international imports assumptions should be considered seriously.

4. Results of Case Analysis in Xinjiang

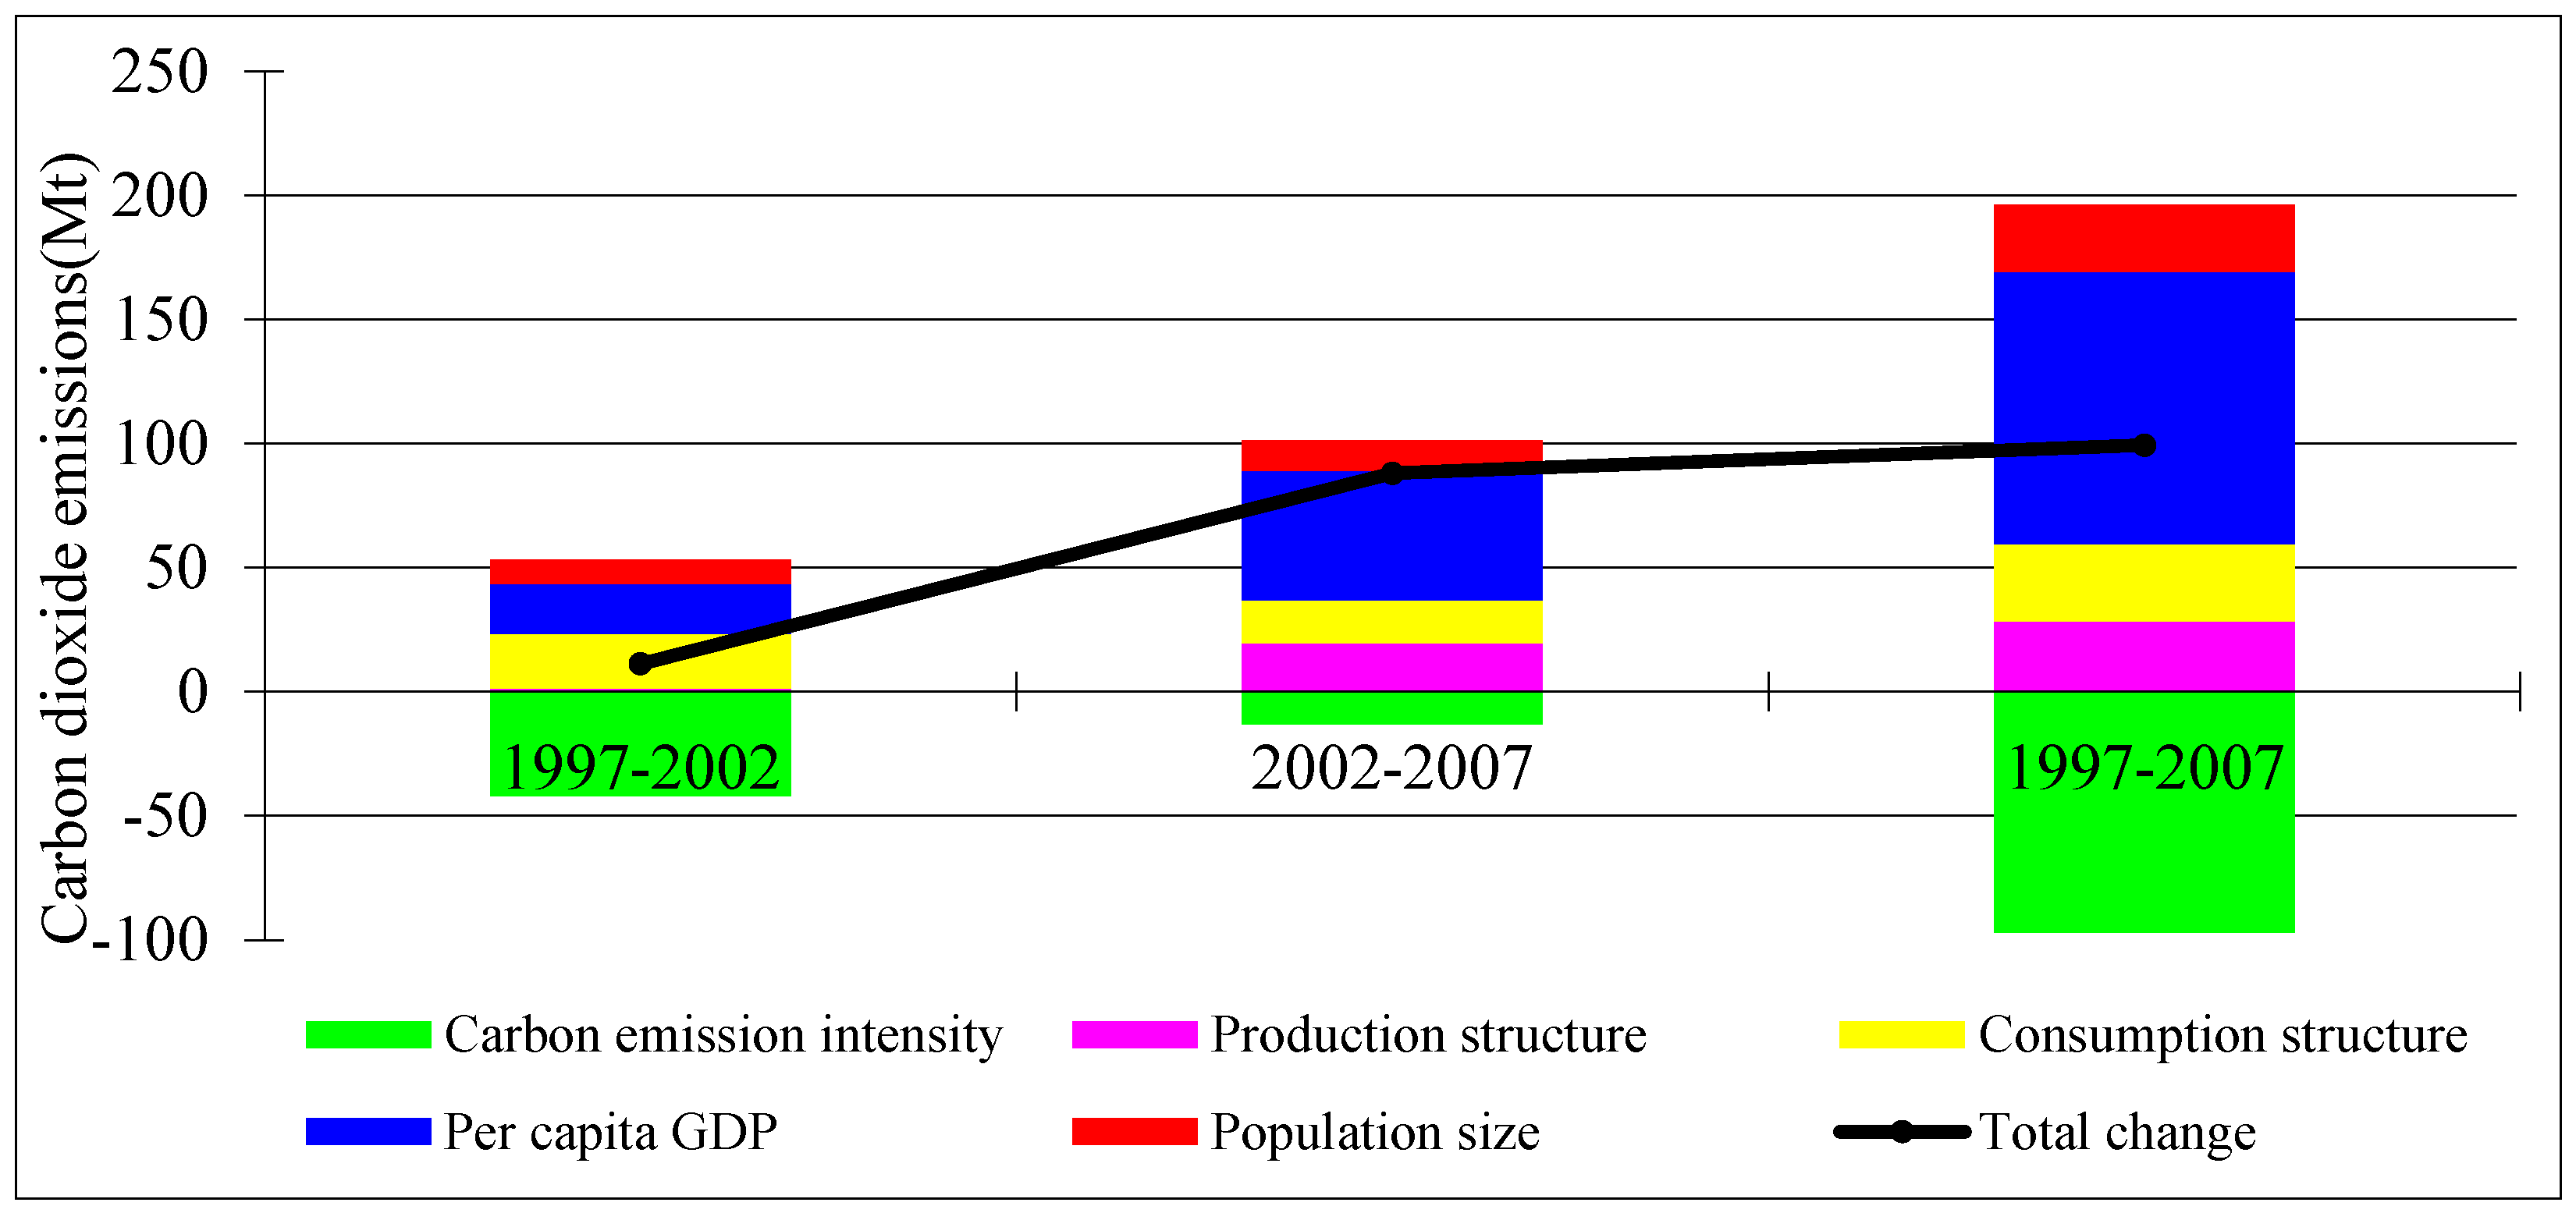
4.1. Contributions to Carbon Dioxide Emissions of Five Main Driving Forces

In the ten years from 1997 to 2007, Xinjiang’s energy-related carbon dioxide emissions from production activities increased by 122.13%, from 81.36 Mt to 180.73 Mt. Especially, there was a significant increase from 2002 to 2007; 88.67% of the total emissions increase occurred in this rapid growth period. Structural decomposition analysis for the contributions to Xinjiang’s emissions changes during 1997 to 2007 is shown in Figure 2 and Table 3.
Figure 2. Structure decomposition analysis of various driving factors in Xinjiang from 1997 to 2007.
Sustainability 07 07548 g002
Table 3. Structure decomposition analysis of contributions of various driving factors in Xinjiang (%).
Factors1997–20022002–20071997–2007
Carbon emission intensity−374.12−15.02−97.64
Production structure12.2022.1128.65
Consumption structure194.7119.6931.08
Per capita GDP180.5059.36110.68
Population size86.7213.8727.23
Total change100100100
Furthermore, emissions increase can be illustrated as a competition between consumption growth (per capita GDP) and efficiency improvement (carbon emission intensity) during 1997 to 2007. If Xinjiang’s other driving forces (population size, consumption structure, and production structure) had remained constant, consumption growth (per capita GDP) would have caused an increase of 109.98 Mt (110.68%) during 1997 to 2007, and efficiency improvement (carbon emission intensity) would have caused a 97.03 Mt (−97.64%) decrease during the same period. In addition, the carbon emission intensity effect solely played the most important role in curbing carbon dioxide emissions growth during the whole research period.
Compared with the first stage (1997–2002), production structure changes resulted as a new major driver for the steep rise in carbon dioxide emissions in Xinjiang between 2002 and 2007, indicating that the rapid emission growth in Xinjiang is the result of structural changes in Xinjiang’s economy becoming more carbon-intensive in recent years. Rapid economic growth and increasing population size, combined with ineffective production and consumption structures optimization, made Xinjiang’s carbon dioxide emissions increase rapidly.

4.2. Contributions to Carbon Dioxide Emissions of Different Final Demands in Xinjiang

The allocation and contribution ratios of carbon dioxide emissions caused by final demands are represented in Figure 3 and Table 4, respectively. The distribution of carbon dioxide emissions caused by final demands across different final demand categories is listed in Table 5.
Figure 3. Increment of carbon dioxide emissions from different final demands in Xinjiang (1997–2007).
Sustainability 07 07548 g003
From the perspective of final demands, fixed capital investment and trade (inter-provincial exports and inter-provincial imports) had great effects on the total carbon dioxide emissions. Table 4 illustrates that rural residential consumption, urban residential consumption, government consumption, fixed capital formation, inventory increase, inter-provincial exports, international exports, inter-provincial imports, and international imports contributed 8.23%, 22.60%, 12.39%, 97.90%, 0.32%, 78.85%, 8.33%, –125.44% and –3.18%, respectively, to Xinjiang’s emission increments from 1997 to 2007.
Table 4. Contribution to carbon emissions of different final demands in Xinjiang (%).
Categories1997–20022002–20071997–2007
Rural household consumption8.078.258.23
Urban household consumption−26.7528.9022.60
Government consumption−6.2614.7712.39
Fixed capital formation61.08102.6097.90
Inventory increase−61.238.180.32
Inter-provincial export14.3287.0978.85
International export21.766.618.33
Inter-provincial import139.86−159.33−125.44
International import−50.852.91−3.18
Total emissions change100100100
Table 5. Emission changes caused by different final demands from different sectors in Xinjiang (units: million tons of carbon dioxide emissions).
SectorRural Household ConsumptionUrban Household ConsumptionGovernment ConsumptionFixed Capital FormationInventory IncreaseInter-Provincial ExportInternational ExportInter-Provincial Import International Import
Agriculture1.058−0.3570.176−0.484−4.53210.2104.9620.8670.178
Coal mining and washing0.328−0.1080.0000.000−0.1790.033−0.0011.621−0.005
Petroleum and natural gas extraction−0.0070.0650.0000.000−0.8172.8750.1500.231−0.959
Metals mining and dressing0.0000.0000.0000.0000.1261.435–0.004−0.005−0.578
Nonmetal and other minerals mining and dressing0.0000.0000.0000.000−0.005−0.2020.0310.7510.002
Food production and tobacco processing0.0031.9720.0000.000−0.472−0.9070.7780.693−0.006
Textile0.1560.0650.0000.0000.392−2.509−0.690−0.0690.012
Manufacture of leather, fur, feather and related products0.2330.6580.0000.0000.022−0.618−0.168−0.336−0.219
Wood products0.0980.0900.0000.5730.157−0.0250.547−1.727−0.154
Papermaking, printing, cultural, educational and sports articles0.009−0.2750.0000.0000.030−0.151−0.057−1.9650.168
Petroleum refinery and coal products0.416−0.0690.0000.0000.58838.236−0.2640.966−0.022
Chemical industry0.3781.7870.0000.0001.00610.215−0.052−10.251−0.353
Nonmetal mineral products1.1340.7440.0000.0000.280−0.1390.223−4.993−0.022
Smelting and pressing of metals0.000−0.6080.0000.0000.18811.8861.433−22.9482.266
Metal products0.0130.0970.0009.5961.5660.114−0.122−14.014−1.165
Ordinary and special equipment−0.0040.3400.00011.6171.610−0.922−0.065−19.326−0.742
Transportation equipment0.4040.4100.000−0.984−0.037−1.7680.3345.4740.057
Electric equipment and machinery0.0450.1430.0003.1820.4022.8400.052−3.176−0.279
Electronic and telecommunications equipment0.6933.4210.00011.6920.3441.7710.232−21.931−0.751
Instruments, meters cultural and office machinery0.016−0.0960.000−0.0760.280−0.005−0.008−0.432−0.296
Other industrial activities0.0080.3100.0000.000−0.070−0.5190.019−0.5880.210
Production and distribution of electric and heat power1.1035.9920.0000.000−0.012−0.4600.0000.8880.000
Production and distribution of gas0.0070.1230.0000.000−0.022−0.2540.0000.0130.000
Production and distribution of water0.0710.1350.0000.0000.0000.0000.0000.0200.000
Construction0.4430.0000.00060.4240.0000.0080.000−14.7900.000
Transport, storage, postal and telecommunications services1.0083.8511.507−1.624−0.3269.7770.119−5.198−0.249
Wholesale, retail trades, hotels, catering service−0.780−1.1830.0030.158−0.207−2.6150.825−4.972−0.250
Other service activities1.3494.94710.6223.2060.0030.0430.000−9.4490.000
Total8.18122.45612.30797.2800.31878.3518.276−124.645−3.156
Fixed capital formation has been responsible for 97.90% of carbon dioxide emission increments caused by final demands in Xinjiang during 1997 to 2007. The capital investment of four sectors, namely Construction, Electronic and telecommunications equipment, Ordinary and special equipment, and Metal products contributed to 62.11%, 12.02%, 11.94% and 9.86% of the total carbon dioxide emission increments caused by fixed capital formation, respectively (Table 5). Inventory increase has been only responsible for 0.32% of carbon dioxide emission increments during 1997 to 2007.
Carbon dioxide emissions embodied in inter-provincial exports and international exports increased by 78.35 Mt and 8.28 Mt during 1997 to 2007, accounting for 78.85% and 8.33% of the total changes in absolute value, respectively. The inter-provincial exports of products from four sectors, namely Petroleum refinery and coal products, Smelting and pressing of metals, Chemical industry, and Agriculture contributed to 48.80%, 15.17%, 13.04% and 13.03% of the total carbon dioxide emission increments, respectively (Table 5). Moreover, the international exports of products from four sectors, namely Agriculture (59.96%), Smelting and pressing of metals (17.31%), Wholesale, retail trades, hotels, catering service (9.97%), and Food production and tobacco processing (9.40%) contributes more to carbon dioxide emission increments than any other sectors (Table 5).
Urban residential consumption also had a positive effect on carbon dioxide emissions, bringing in a 22.46 Mt increase, accounting for 22.60% of the total changes in absolute value. Moreover, 26.68% of such an increase was due to Production and distribution of electric and heat power, 22.03% was due to Other service activities, and 17.15% was due to Transport, storage, postal and telecommunications services, significantly higher than other sectors (Table 5). Rural residential consumption was only responsible for 8.23% of carbon dioxide emission increments caused by final demands in Xinjiang during 1997 to 2007.
Carbon dioxide emissions embodied in inter-provincial imports decreased by 124.64 Mt during 1997 to 2007, accounting for 125.44% of the total changes in absolute value. The imports of Smelting and pressing of metals, Electronic and telecommunications equipment, and Ordinary and special equipment contributed to 18.41%, 17.59% and 15.50% of the total carbon dioxide emission decrements, respectively (Table 5). In addition, international imports has contributed to only 3.18% of carbon dioxide emission decrements caused by final demands in Xinjiang, mainly caused by the import of Metal products (36.92%) and Petroleum and natural gas extraction (30.38%).

5. Concluding Remarks and Further Discussion

5.1. Concluding Remarks

China has become the world’s top energy consumer and CO2 emitter after decades of rapid urbanization and industrialization. China’s mitigation targets would be mainly achieved by its regional efforts. Such a reality requires detailed case-based empirical studies on its regional carbon dioxide emissions. SDA model based on an environmental input–output table was employed to uncover the causes of carbon dioxide emission changes in Xinjiang province during 1997 to 2007. Relative contributions of five factors are calculated: carbon emission intensity, production structure, consumption structure, per capita GDP, and population size. Emissions increase can be illustrated as a competition between consumption growth (per capita GDP) and efficiency improvement (carbon emission intensity) during 1997 to 2007. Per capita GDP is the most important driver for the rapid emission growth, while carbon emission intensity is the significant contributor to offset these increments. In addition, production structure changes performed as a new major driver for the steep rise in carbon dioxide emissions in recent years. Our results indicate that carbon emission intensity is the sole important factor contributing to offset carbon increments in Xinjiang. Hence, Xinjiang will be better off improving energy efficiency through energy-related technology development (e.g., technology innovation and technology transfer) and developing high-tech industries. Furthermore, how to encourage and stimulate local governments, enterprises, and residents to actively reduce their carbon emission intensity will be a key issue.
Furthermore, carbon dioxide emission changes caused by final demands are analyzed by different final demand categories and 28 aggregated economic sectors. From the viewpoint of final demands, fixed capital formation contributed the highest carbon dioxide emission, followed by inter-provincial export and urban residential consumption; while inter-provincial imports had the biggest contributions to offset emission increments, followed by international imports. From the perspective of economic sectors, four sectors, namely petroleum refinery and coal products, production and distribution of electric and heat power, smelting and pressing of metals, and nonmetal mineral products increased by 44.20 Mt, 41.46 Mt, 12.83 Mt, and 5.27 Mt, respectively during 1997 to 2007, accounting for 44.48%, 41.72%, 12.91%, and 5.30% of the total changes in absolute value, respectively. The inter-provincial exports of products from Petroleum refinery and coal products and Smelting and pressing of metals contributed the highest carbon dioxide emission, while Production and distribution of electric and heat power was mainly associated with urban residential consumption. All these sectors are energy related economic activities, indicating that future consumption-based mitigation policies should mainly focus on these four sectors.

5.2. Further Discussion

We compare our results in Xinjiang with the previous studies carried out at the national levels [15,21] and provincial levels in Liaoning [51] and Jiangsu [14]. The comparison further highlights the previous conclusions that economic growth (per capita GDP) is the most important driver for the rapid emission growth, while efficiency improvement (carbon emission intensity) is the significant contributor to decreasing carbon dioxide emissions, both at the national level and the regional level from the production perspective. In addition, production structure changes performed as a new major driver for the steep rise in carbon dioxide emissions in Xinjiang during 2002 to 2007. In order to achieve carbon mitigation, Xinjiang should not only rely on efficiency improvement, but also rely on production structure optimization.
However, results carried out from the perspective of final demands are different. China’s export-driven economy made export-related carbon dioxide emissions contribute most to the total emission changes during 2002 to 2007 [21]. A comparison of different regional studies within China shows several differences. In terms of export, international imports contributed the highest carbon dioxide emissions in Jiangsu, a typical manufacturing center in Southeast China [14]; while inter-provincial exports contributed the highest in Liaoning, an old industrial base in Northeast China [51]. As for Xinjiang, inter-provincial exports contributed the second highest carbon dioxide emissions during the same period, after fixed capital formation. This illustrates that Xinjiang is still an undeveloped region in Northwest China. There is an urgent need for Xinjiang to absorb intensive investment in infrastructure construction (e.g., buildings, highway, railway and so on) to promote economic growth and the process of urbanization and industrialization in order to narrow the development gap between Xinjiang and other inland provinces, especially after the “Western Development Strategy” was implemented in 2000. This indicates that investment-related carbon dioxide emissions will further increase in Xinjiang. Along with the process of new industrialization and the newly issued “great-leap-forward development” strategy, a large amount of capital investment will be allocated to Xinjiang. In consideration of Xinjiang’s abundant energy resources and significant technological gap, mitigation efforts should aim to upgrade the production technology and eliminate backward production capacity at enterprise levels, especially those energy intensive manufacturing companies in the national industrial parks and emerging industrial parks in Xinjiang.
Although inter-provincial exports contributed the second highest emissions in Xinjiang, we predict that emissions embodied in inter-provincial exports will increase significantly. Actually, trading between provinces within China is more flexible, as there are less political and economic barriers across the provincial borders [23,50,59]. This will be one main reason for the rapid export-related emissions growth in the near future.
In addition, Xinjiang will strive to form an outstanding delivery capacity for other provinces within China during the “Twelfth Five Year Plan” period, including 50 million tons of crude oil, 100 billion cubic meters of natural gas and coal gas, and 30 million kilowatts of electricity. Xinjiang will become one of the five-big comprehensive energy base in China, consisting of national large oil and gas production and processing base, large coal power and coal chemical industry base, large wind power base, and national energy resources onshore passage (Figure 4). As shown in the Figure 4, Xinjiang base is far away from China’s main energy consumption markets compared to the other four big energy bases. The long distance will further increase emissions from the transport of Xinjiang’s exported goods, especially energy resources, energy-related materials and products, electricity, etc. Then, how to reduce regional transport sector carbon emissions will be a key issue for Xinjiang’s exported goods in the near future.
In the next decades, Xinjiang is likely to further accelerate the process of urbanization to realize the great-leap-forward development. Carbon dioxide emissions from urban residential consumption will be increased by a combination of increasing urban residents and their increased expenditure. The urbanization will promote a large demand for new residential apartments, infrastructure construction, and energy intensive products such as heating and electric power. Under such a circumstance, mitigation policies should pay more attention to upgrade the local electricity and heating infrastructure and apply innovative building energy saving technology. Energy structure in Xinjiang should also be optimized, in view of Xinjiang’s mainly coal fuel based electricity and heating systems. The application of low carbon wind power and solar energy should be promoted by the local government and local industrial companies.
Figure 4. Five-big energy base in China.
Sustainability 07 07548 g004

6. Policy Recommendations

Based upon our analysis results, Xinjiang may face great challenges to curb carbon emissions in the near future. However, several concrete mitigation measures have been further discussed and then raised by considering the regional realities, aiming to harmonize regional development and carbon dioxide emissions reduction.
(1)
Carbon emission intensity is the sole important factor contributing to offset carbon increments in Xinjiang. Energy efficiency improvement and fundamental structure changes were the main contributing factors reducing China’s energy intensity at the provincial level [11,13,53,60]. There is still much potential for carbon emission intensity to decline further compared to the national average level. Industrial policies will need to upgrade the production process and enhance energy efficiency of Xinjiang’s energy-intensive sectors, especially the petroleum refinery, coal chemical industry, smelting and pressing of metals, power generation, transport sector, and heating in winter.
(2)
Considering the abundant renewable energy—especially wind power and solar PV energy in Xinjiang—shares of renewable energy in the total energy consumption should be increased obviously and effectively to optimize the energy consumption structure. The utilization clean and renewable energy, such as wind power, solar energy, and hydro power, should be further promoted by the central and local government so that the total fossil energy consumption can be reduced. Renewable energy technological change should be introduced by the local government with additional encouragement and reward.
(3)
New energy technology should be introduced and accelerated aiming at the low carbon direction. New energy technology (e.g., coal based synthetic natural gas (SNG) and shale gas) will be powerful tool in meeting energy demands in the future, and will be good solution to both energy savings and emissions reduction. Xinjiang is listed by the central government as one of the main coal based SNG industry bases owing to the rich coal resources, and nearly 70% of the national coal based SNG projects are being conducted in Xinjiang [61]. There are 30 ongoing and planned coal-based SNG projects in China, and 22 are located in Xinjiang, which will have a total capacity of 92.2 billion cubic meters per year, accounting for 76.57% of the national total capacity [61]. However, Sinopec plans to build gas pipelines with an annual capacity of transporting 30 billion cubic meters of coal based SNG from Xinjiang to large natural gas markets in southeast China; in addition, other investors are also want Xinjiang’s SNG [61]. The Tarim Basin has 216 trillion cubic feet of risked, technically recoverable shale gas resources, accounting for 19.27% of China’s total shale-gas reserves. The gas-rich Tarim basin in southern Xinjiang was selected as one of the China’s shale gas basins [62]. Natural gas is a relatively clean energy source once extracted. Coal based SNG and natural gas from shale formation would be better opportunities for China’s purpose of fossil fuel substitution and “energy saving and emission reduction” in the future, even in Xinjiang. It might be an effective way to increase the shares of natural gas in the total energy consumption and decrease the coal share in the energy mix. However, they are both restricted by technology and operational expertise. Eco-environmental risks and water resources are the main challenges for Xinjiang, an extreme arid zone [9,10]. Importantly, we cannot pay for energy demands at the expense of our limited fresh water resources and other undesired environmental effects. At least, coal-based SNG and shale gas are not good solution to both energy savings and carbon emissions reduction, unless cleaner production and carbon capture and storage (CCS) technology are promoted in Xinjiang.
(4)
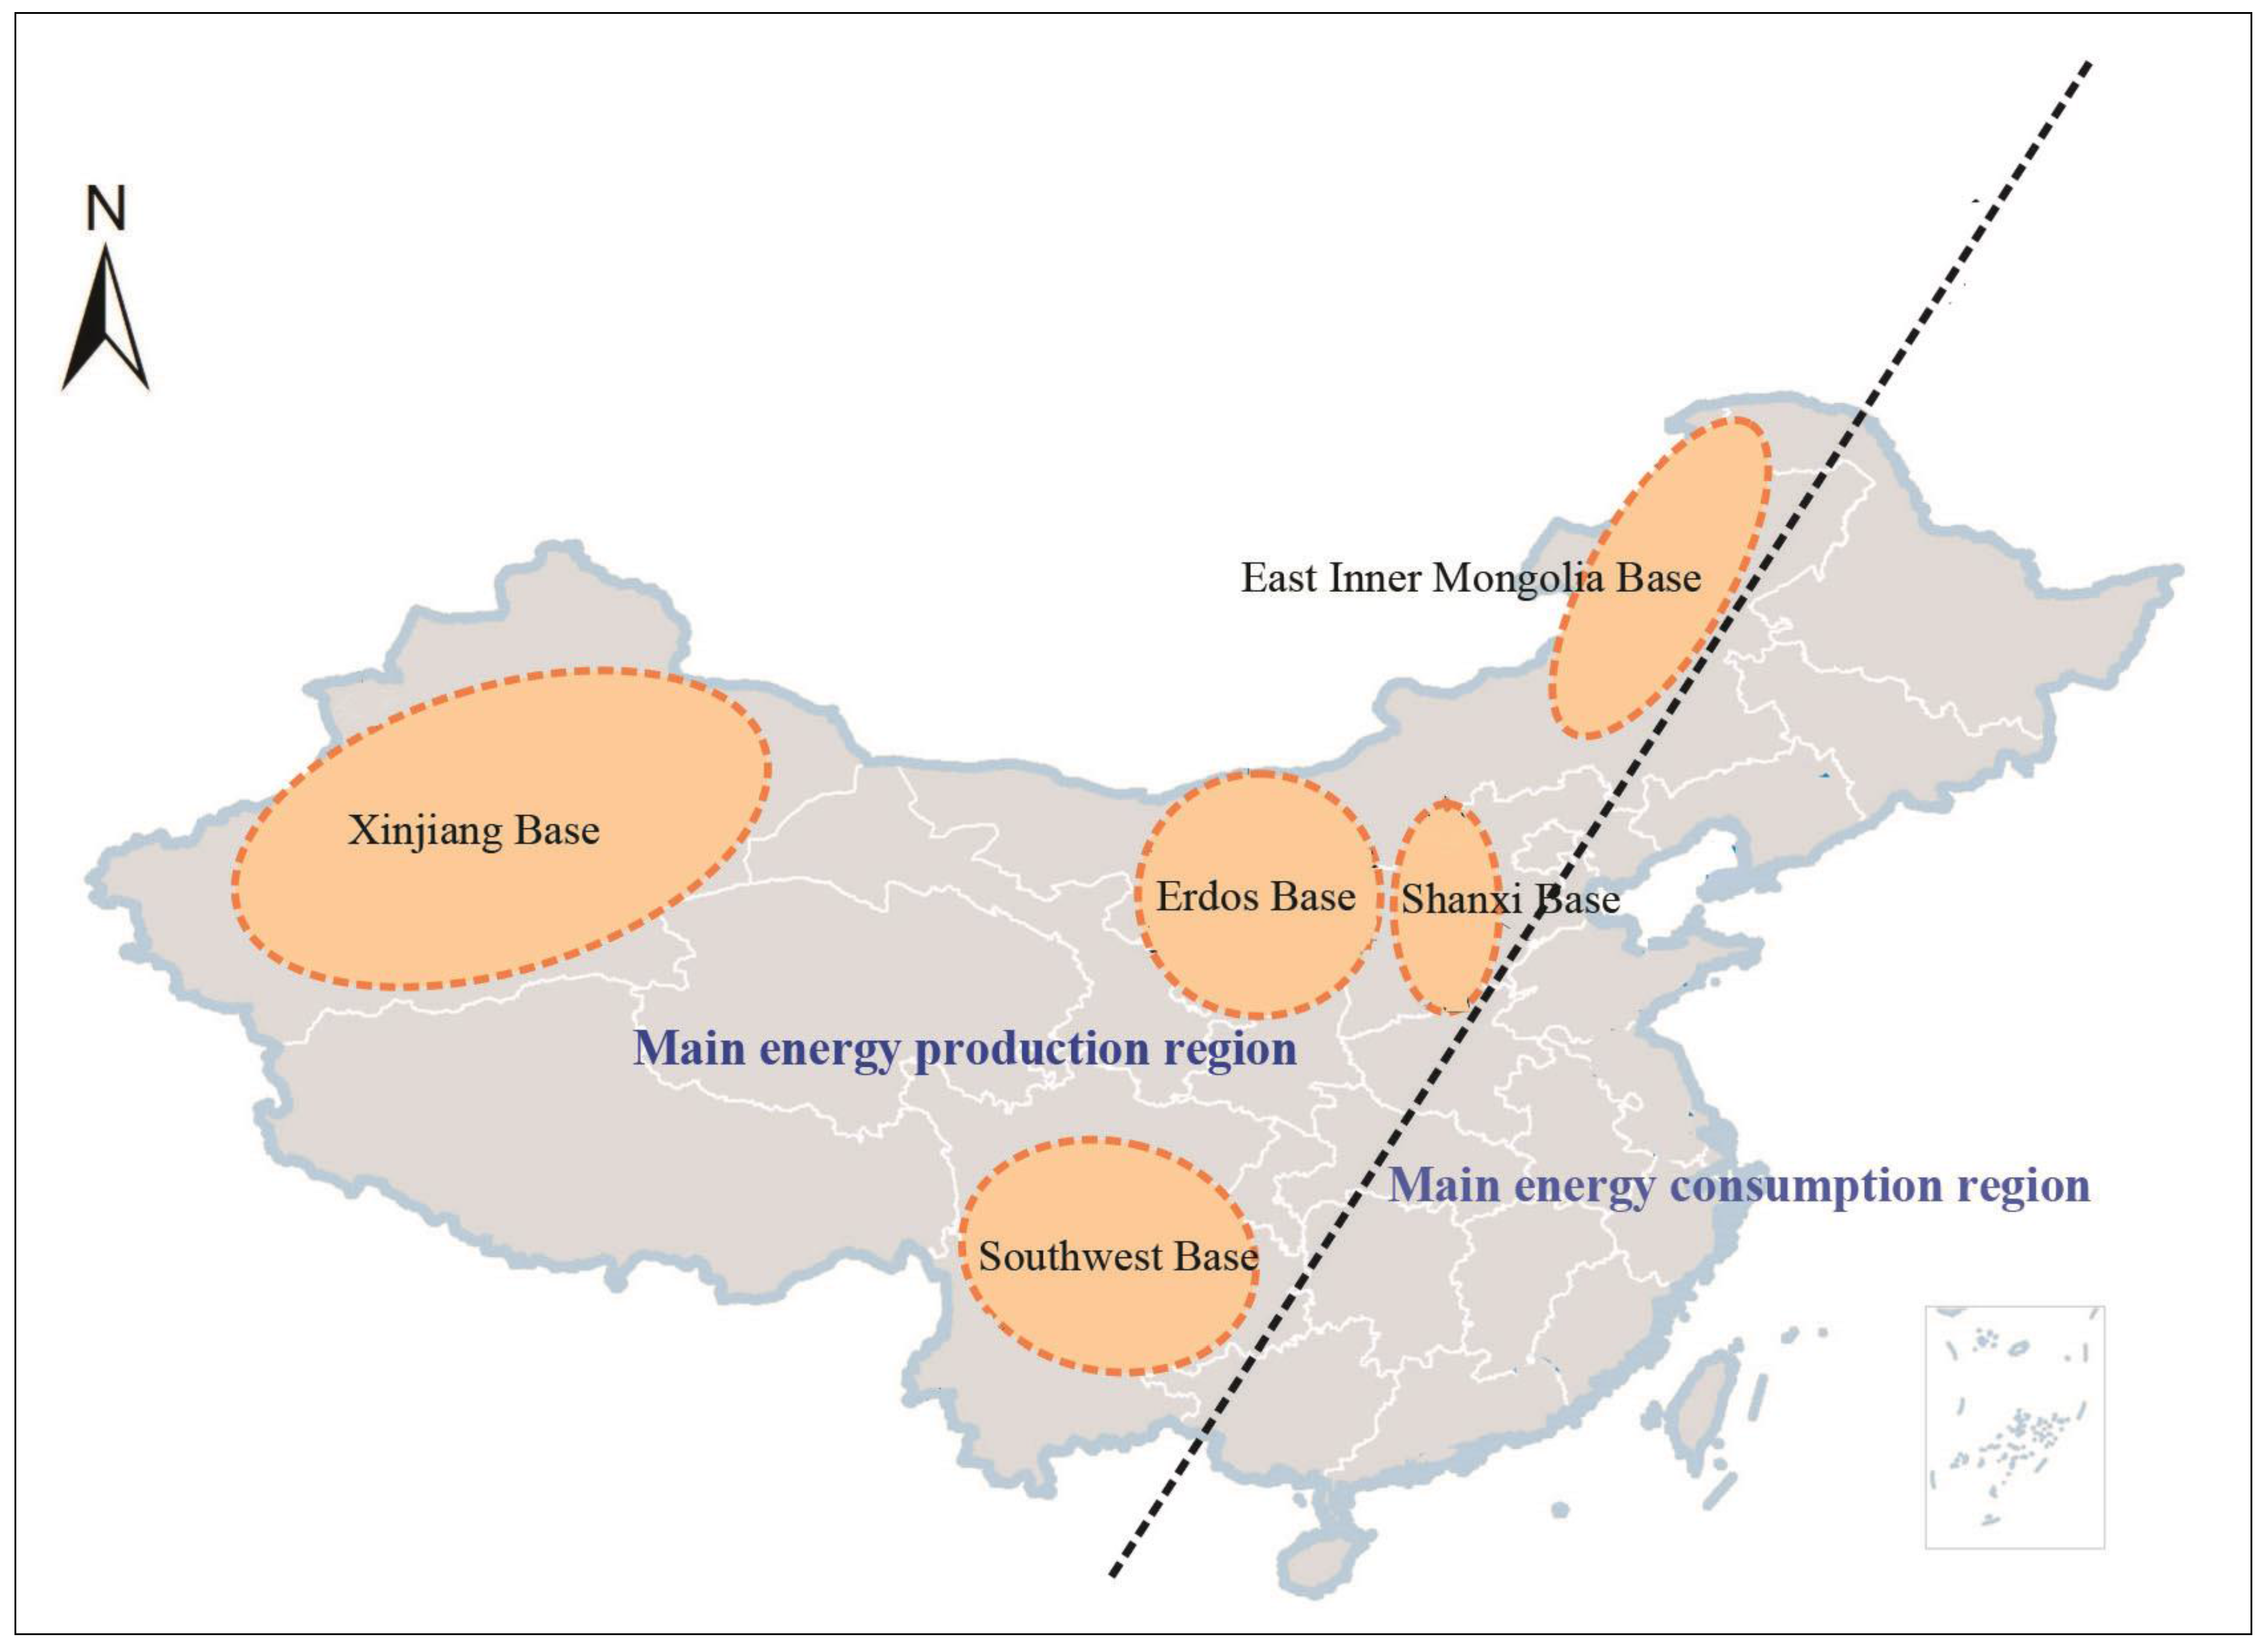
Furthermore, how to slow down carbon emissions but not at the expense of ecological environmental protection and social-economic development is a big dilemma faced by the local government during the process of the big comprehensive energy base consturction for energy exploration and exploitation in Xinjiang. Recently, the local government has further stated that Xinjiang would be served as an energy conservation and energy-products processing center and a western energy and equipment manufacturing industrial center to improve its energy role at the national level. Government should pay attention to nurture the emerging low-carbon industries, especially focus on renewable energy industry, new material industry, energy saving and environmental protection industry, etc. during the process of energy base consturction.
(5)
Now, Xinjiang is in its best period of construction and development, with rapid expansion of city size and industrial output to meet the fast increase in living standards of the local residents, during the process of its new urbanization and industrialization. In order to accelerate industrialization and control emission, efforts should be made to upgrade the production technology and eliminate backward production capacity at enterprise levels, especially those energy-intensive manufacturing companies in the national industrial parks and emerging industrial parks in Xinjiang. Low carbon city, low carbon transportation, low carbon buildings, etc. should be effectively promoted during the process of new urbanization. In addition, residents’ low carbon awareness should be promoted to support energy saving behaviours, especially public transportation.

Acknowledgments

This work was supported by the Guangdong Academy of Sciences Youth Science Foundation (qnjj201501), Major Project of Chinese Academy of Sciences (2013zdccyd) and the Foundation of Director of Guangzhou Institute of Geography (030).

Author Contributions

Changjian Wang designed the research; Changjian Wang and Fei Wang performed research and contributed new analytic tools; and all authors wrote the paper. All authors have read and approved the final manuscript.

Conflicts of Interest

The authors declare no conflict of interest.

References

  1. Jiang, B.; Sun, Z.; Liu, M. China’s energy development strategy under the low-carbon economy. Energy 2010, 35, 4257–4264. [Google Scholar] [CrossRef]
  2. Wang, N.; Chang, Y.-C. The evolution of low-carbon development strategies in China. Energy 2014, 68, 61–70. [Google Scholar] [CrossRef]
  3. Salahuddin, M.; Gow, J. Economic growth, energy consumption and CO2 emissions in Gulf Cooperation Council countries. Energy 2014, 73, 44–58. [Google Scholar] [CrossRef]
  4. Saboori, B.; Sapri, M.; Bin Baba, M. Economic growth, energy consumption and CO2 emissions in OECD (Organization for Economic Co-operation and Development)’s transport sector: A fully modified bi-directional relationship approach. Energy 2014, 66, 150–161. [Google Scholar] [CrossRef]
  5. Wang, C.; Wang, F.; Wang, Q.; Yang, D.; Li, L.; Zhang, X. Preparing for Myanmar’s environment-friendly reform. Environ. Sci. Policy 2013, 25, 229–233. [Google Scholar] [CrossRef]
  6. Wang, C.; Wang, Q.; Wang, F. Is Vietnam Ready for Nuclear Power? Environ. Sci. Technol. 2012, 46, 5269–5270. [Google Scholar] [CrossRef] [PubMed]
  7. Liu, Z.; Guan, D.; Crawford-Brown, D.; Zhang, Q.; He, K.; Liu, J. A low-carbon road map for China. Nature 2013, 500, 143–145. [Google Scholar] [CrossRef] [PubMed]
  8. Guan, D.; Liu, Z.; Geng, Y.; Lindner, S.; Hubacek, K. The gigatonne gap in China’s carbon dioxide inventories. Nat. Clim. Chang. 2012, 2, 672–675. [Google Scholar] [CrossRef]
  9. Wang, C.; Wang, F.; Du, H.; Zhang, X. Is China really ready for shale gas revolution—Re-evaluating shale gas challenges. Environ. Sci. Policy 2014, 39, 49–55. [Google Scholar] [CrossRef]
  10. Wang, C.; Wang, F.; Li, L.; Zhang, X. Wake-up Call for China to Re-Evaluate Its Shale-Gas Ambition. Environ. Sci. Technol. 2013, 47, 11920–11921. [Google Scholar] [CrossRef] [PubMed]
  11. Liu, Z.; Liang, S.; Geng, Y.; Xue, B.; Xi, F.; Pan, Y.; Zhang, T.; Fujita, T. Features, trajectories and driving forces for energy-related GHG emissions from Chinese mega cites: The case of Beijing, Tianjin, Shanghai and Chongqing. Energy 2012, 37, 245–254. [Google Scholar] [CrossRef]
  12. Geng, Y. Eco-indicators: Improve China’s sustainability targets. Nature 2011, 477, 162. [Google Scholar]
  13. Liu, Z.; Geng, Y.; Lindner, S.; Guan, D. Uncovering China’s greenhouse gas emission from regional and sectoral perspectives. Energy 2012, 45, 1059–1068. [Google Scholar] [CrossRef]
  14. Liang, S.; Zhang, T. What is driving CO2 emissions in a typical manufacturing center of South China? The case of Jiangsu Province. Energy Policy 2011, 39, 7078–7083. [Google Scholar] [CrossRef]
  15. Peters, G.P.; Weber, C.L.; Guan, D.; Hubacek, K. China’s Growing CO2 Emissions A Race between Increasing Consumption and Efficiency Gains. Environ. Sci. Technol. 2007, 41, 5939–5944. [Google Scholar] [CrossRef] [PubMed]
  16. Zhang, Y. Supply-side structural effect on carbon emissions in China. Energy Econ. 2010, 32, 186–193. [Google Scholar] [CrossRef]
  17. Liu, H.; Xi, Y.; Guo, J.E.; Li, X. Energy embodied in the international trade of China: An energy input-output analysis. Energy Policy 2010, 38, 3957–3964. [Google Scholar] [CrossRef]
  18. Zhu, Q.; Peng, X.Z.; Wu, K.Y. Calculation and decomposition of indirect carbon emissions from residential consumption in China based on the input-output model. Energy Policy 2012, 48, 618–626. [Google Scholar] [CrossRef]
  19. Guan, D.; Peters, G.P.; Weber, C.L.; Hubacek, K. Journey to world top emitter: An analysis of the driving forces of China’s recent CO2 emissions surge. Geophys. Res. Lett. 2009, 36, L04709. [Google Scholar] [CrossRef]
  20. Guan, D.; Hubacek, K.; Weber, C.L.; Peters, G.P.; Reiner, D.M. The drivers of Chinese CO2 emissions from 1980 to 2030. Glob. Environ. Chang. 2008, 18, 626–634. [Google Scholar] [CrossRef]
  21. Minx, J.C.; Baiocchi, G.; Peters, G.P.; Weber, C.L.; Guan, D.; Hubacek, K. A “Carbonizing Dragon”: China’s Fast Growing CO2 Emissions Revisited. Environ. Sci. Technol. 2011, 45, 9144–9153. [Google Scholar] [CrossRef] [PubMed]
  22. Xie, S.-C. The driving forces of China׳s energy use from 1992 to 2010: An empirical study of input-output and structural decomposition analysis. Energy Policy 2014, 73, 401–415. [Google Scholar] [CrossRef]
  23. Feng, K.; Davis, S.J.; Sun, L.; Li, X.; Guan, D.; Liu, W.; Liu, Z.; Hubacek, K. Outsourcing CO2 within China. Proc. Natl. Acad. Sci. USA 2013, 110, 11654–11659. [Google Scholar] [CrossRef] [PubMed] [Green Version]
  24. Meng, F.Y.; Zhou, D.Q.; Zhou, P.; Bai, Y. Sectoral comparison of electricity-saving potentials in China: An analysis based on provincial input-output tables. Energy 2014, 72, 772–782. [Google Scholar] [CrossRef]
  25. Zhang, H.; Lahr, M.L. China’s energy consumption change from 1987 to 2007: A multi-regional structural decomposition analysis. Energy Policy 2014, 67, 682–693. [Google Scholar] [CrossRef]
  26. Su, B.; Ang, B.W. Input–output analysis of CO2 emissions embodied in trade: The effects of spatial aggregation. Ecol. Econ. 2010, 70, 10–18. [Google Scholar] [CrossRef]
  27. Wang, C.; Zhang, X.; Wang, F.; Lei, J.; Zhang, L. Decomposition of energy-related carbon emissions in Xinjiang and relative mitigation policy recommendations. Front. Earth Sci. 2015, 9, 65–76. [Google Scholar] [CrossRef]
  28. Su, B.; Ang, B.W. Structural decomposition analysis applied to energy and emissions: Some methodological developments. Energy Econ. 2012, 34, 177–188. [Google Scholar] [CrossRef]
  29. Su, B.; Ang, B.W. Attribution of changes in the generalized Fisher index with application to embodied emission studies. Energy 2014, 69, 778–786. [Google Scholar] [CrossRef]
  30. Ang, B.W.; Xu, X.Y. Tracking industrial energy efficiency trends using index decomposition analysis. Energy Econ. 2013, 40, 1014–1021. [Google Scholar] [CrossRef]
  31. Ang, B.W.; Zhang, F.Q. A survey of index decomposition analysis in energy and environmental studies. Energy 2000, 25, 1149–1176. [Google Scholar] [CrossRef]
  32. Ang, B.W. Decomposition methodology in industrial energy demand analysis. Energy 1995, 20, 1081–1095. [Google Scholar] [CrossRef]
  33. Brizga, J.; Feng, K.; Hubacek, K. Drivers of CO2 emissions in the former Soviet Union: A country level IPAT analysis from 1990 to 2010. Energy 2013, 59, 743–753. [Google Scholar] [CrossRef]
  34. Rose, A.; Casler, S. Input–Output Structural Decomposition Analysis: A Critical Appraisal. Econ. Syst. Res. 1996, 8, 33–62. [Google Scholar] [CrossRef]
  35. Guan, D.; Hubacek, K.; Tillotson, M.; Zhao, H.; Liu, W.; Liu, Z.; Liu, Z.; Liang, S. Lifting China’s Water Spell. Environ. Sci. Technol. 2014, 48, 11048–11056. [Google Scholar] [CrossRef] [PubMed]
  36. Liu, H.; Polenske, K.R.; Guilhoto, J.J.M.; Xi, Y. Direct and indirect energy use in China and the United States. Energy 2014, 71, 414–420. [Google Scholar] [CrossRef]
  37. Huang, Y.-H.; Wu, J.-H. Analyzing the driving forces behind CO2 emissions and reduction strategies for energy-intensive sectors in Taiwan, 1996–2006. Energy 2013, 57, 402–411. [Google Scholar] [CrossRef]
  38. Zeng, L.; Xu, M.; Liang, S.; Zeng, S.; Zhang, T. Revisiting drivers of energy intensity in China during 1997–2007: A structural decomposition analysis. Energy Policy 2014, 67, 640–647. [Google Scholar] [CrossRef]
  39. Arto, I.; Dietzenbacher, E. Drivers of the Growth in Global Greenhouse Gas Emissions. Environ. Sci. Technol. 2014, 48, 5388–5394. [Google Scholar] [CrossRef] [PubMed]
  40. Casler, S.D.; Rose, A. Carbon Dioxide Emissions in the U.S. Economy: A Structural Decomposition Analysis. Environ. Resour. Econ. 1998, 11, 349–363. [Google Scholar] [CrossRef]
  41. Cazcarro, I.; Duarte, R.; Sanchez-Choliz, J. Economic growth and the evolution of water consumption in Spain: A structural decomposition analysis. Ecol. Econ. 2013, 96, 51–61. [Google Scholar] [CrossRef]
  42. Zhang, Z.; Shi, M.; Yang, H. Understanding Beijing’s Water Challenge: A Decomposition Analysis of Changes in Beijing’s Water Footprint between 1997 and 2007. Environ. Sci. Technol. 2012, 46, 12373–12380. [Google Scholar] [CrossRef] [PubMed]
  43. Liang, S.; Xu, M.; Liu, Z.; Suh, S.; Zhang, T. Socioeconomic Drivers of Mercury Emissions in China from 1992 to 2007. Environ. Sci. Technol. 2013, 47, 3234–3240. [Google Scholar] [CrossRef] [PubMed]
  44. Guan, D.; Su, X.; Zhang, Q.; Peters, G.P.; Liu, Z.; Lei, Y.; He, K. The socioeconomic drivers of China’s primary PM2.5 emissions. Environ. Res. Lett. 2014, 9, 024010. [Google Scholar] [CrossRef]
  45. Liang, S.; Liu, Z.; Crawford-Brown, D.; Wang, Y.; Xu, M. Decoupling Analysis and Socioeconomic Drivers of Environmental Pressure in China. Environ. Sci. Technol. 2014, 48, 1103–1113. [Google Scholar] [CrossRef] [PubMed]
  46. Wang, Y.; Zhao, H.; Li, L.; Liu, Z.; Liang, S. Carbon dioxide emission drivers for a typical metropolis using input–output structural decomposition analysis. Energy Policy 2013, 58, 312–318. [Google Scholar] [CrossRef]
  47. Dietzenbacher, E.; Los, B. Structural Decomposition Techniques: Sense and Sensitivity. Econ. Syst. Res. 1998, 10, 307–324. [Google Scholar] [CrossRef]
  48. Hoekstra, R.; van den Bergh, J.C.J.M. Structural Decomposition Analysis of Physical Flows in the Economy. Environ. Resour. Econ. 2002, 23, 357–378. [Google Scholar] [CrossRef]
  49. Tian, X.; Chang, M.; Lin, C.; Tanikawa, H. China’s carbon footprint: A regional perspective on the effect of transitions in consumption and production patterns. Appl. Energy 2014, 123, 19–28. [Google Scholar] [CrossRef]
  50. Tian, X.; Chang, M.; Tanikawa, H.; Shi, F.; Imura, H. Structural decomposition analysis of the carbonization process in Beijing: A regional explanation of rapid increasing carbon dioxide emission in China. Energy Policy 2013, 53, 279–286. [Google Scholar] [CrossRef]
  51. Geng, Y.; Zhao, H.; Liu, Z.; Xue, B.; Fujita, T.; Xi, F. Exploring driving factors of energy-related CO2 emissions in Chinese provinces: A case of Liaoning. Energy Policy 2013, 60, 820–826. [Google Scholar] [CrossRef]
  52. Peters, G.P. From production-based to consumption-based national emission inventories. Ecol. Econ. 2008, 65, 13–23. [Google Scholar] [CrossRef]
  53. Wang, C.; Wang, F.; Zhang, H.; Ye, Y.; Wu, Q.; Su, Y. Carbon emissions decomposition and environmental mitigation policy recommendations for sustainable development in Shandong province. Sustainability 2014, 6, 8164–8179. [Google Scholar] [CrossRef]
  54. Xi, F.; Geng, Y.; Chen, X.; Zhang, Y.; Wang, X.; Xue, B.; Dong, H.; Liu, Z.; Ren, W.; Fujita, T.; et al. Contributing to local policy making on GHG emission reduction through inventorying and attribution: A case study of Shenyang, China. Energy Policy 2011, 39, 5999–6010. [Google Scholar] [CrossRef]
  55. Su, B.; Huang, H.C.; Ang, B.W.; Zhou, P. Input-output analysis of CO2 emissions embodied in trade: The effects of sector aggregation. Energy Econ. 2010, 32, 166–175. [Google Scholar] [CrossRef]
  56. Su, B.; Ang, B.W. Structural decomposition analysis applied to energy and emissions: Aggregation issues. Econ. Syst. Res. 2012, 24, 299–317. [Google Scholar] [CrossRef]
  57. Su, B.; Ang, B.W.; Low, M. Input-output analysis of CO2 emissions embodied in trade and the driving forces: Processing and normal exports. Ecol. Econ. 2013, 88, 119–125. [Google Scholar] [CrossRef]
  58. Su, B.; Ang, B.W. Input-output analysis of CO2 emissions embodied in trade: Competitive versus non-competitive imports. Energy Policy 2013, 56, 83–87. [Google Scholar] [CrossRef]
  59. Qi, Y.; Li, H.; Wu, T. Interpreting China’s carbon flows. Proc. Natl. Acad. Sci. USA 2013, 110, 11221–11222. [Google Scholar] [CrossRef] [PubMed]
  60. Wang, C.; Zhang, X.; Wang, F.; Lei, J.; Zhang, L. Decomposition of energy-related carbon emissions in Xinjiang and relative mitigation policy recommendations. Front. Earth Sci. 2014, 9, 1–12. [Google Scholar] [CrossRef]
  61. Ding, Y.; Han, W.; Chai, Q.; Yang, S.; Shen, W. Coal-based synthetic natural gas (SNG): A solution to China’s energy security and CO2 reduction? Energy Policy 2013, 55, 445–453. [Google Scholar] [CrossRef]
  62. Tollefson, J. China slow to tap shale-gas bonanza. Nature 2013, 494, 294–294. [Google Scholar] [CrossRef] [PubMed]

