Article

Sustainable Consumption: Analysis of Consumers’ Perceptions about Using Private Brands in Food Retail

by
Dan Boboc
,
Adrian Laurentiu Ariciu
and
Raluca Andreea Ion
*,†
Department of Agro-food and Environmental Economy, The Bucharest University of Economic Studies, 6 Piata Romana, Bucharest 010374, Romania
*
Author to whom correspondence should be addressed.
These authors contributed equally to this work.
Sustainability 2015, 7(7), 9293-9309; https://0-doi-org.brum.beds.ac.uk/10.3390/su7079293
Submission received: 13 May 2015 / Revised: 29 June 2015 / Accepted: 30 June 2015 / Published: 16 July 2015

Abstract

:
Private brands are representing an important vector for retailers, helping them to build sustainable relationships with their customers. Usually, private brands are perceived as products differentiated by lower prices. The purpose of this research is to identify consumers’ trust level in private brands used in food retail and their perceptions about the quality of retailers’ own products. The research question is: What are consumers’ perceptions about using private brands in food retail? Pursuing this question, a survey based on a questionnaire was carried out. Research findings showed that the main reason why people buy private brands’ products is lower price rather than high quality. The interviews showed that the typical private brand user is male, aged between 45 and 65 years old, with middle-level income, and employees with secondary education. These results are useful for retailers in their efforts to decide strategies for their private brands and for building consumers’ trust. The findings are useful for food producers as well, because they should reconsider their marketing strategies in order to adapt themselves to the continuous growth of retailers’ private brands.

1. Introduction

This study tries to address the following question: What are the main factors explaining consumers’ choice of private brands vs. producers’ brands of foodstuffs? The ambition of this study is thus to enhance our understanding of the factors that are influencing the purchase of food private brands. This will help retailers and food producers in building marketing strategies.
Sustainable consumption is closely linked to the term sustainable development. As such, it brings into discussion the three dimensions of the latter: social, economic, and ecological. As regards the economic aspect, sustainable consumption means, among other issues, that products will have lower prices and are affordable to consumers [1]. This could be achieved in the case of products sold under retailers’ brands, which are cheaper than products sold under producers’ brands. In a sustainable approach, consumption of private brands’ products reflects one of the principles of sustainable consumption: wise use of resources, including financial ones. This paper shows the development of private brands and their growth drivers, underlying the reasons why people buy products sold under retailers’ brands.
Discount brands were introduced into American supermarkets in the late 1970s [2]. At that time, consumers’ perceptions about private brands were “a cheap and nasty generic substitute for the real thing, rolled out by retailers during recessions and discarded once the economy picked up again” [3]. Over time, consumers changed their view when high-quality private-label products were introduced in the late 1980s and early 1990s [4]. In Romania, private brands were introduced in modern trade channel in 1999, in Metro Cash & Carry and in Billa supermarkets.
The period 2005–2008 was favorable to launch entry-level brands, consistent with a European trend clearly centered around 2005. Further on, the period 2009–2010 represented the start of quality brands’ launches: volume levels corresponding to the critical threshold began to appear, there were several categories of products where price ranges were sufficiently large to justify introduction of private labels at an intermediate level, and therefore a growing number of suppliers were able to consistently provide quality controlled to the own brand of quality level. All these happened in an unfavorable economic situation [5], which increased customer interest in products offering similar quality as the leading brands, but with lower prices.
At the same time, existing international retailers on the Romanian market after 2007, when Romania joined the EU, brought new product lines under the umbrella of their private brands from Europe. This factor influenced local producers’ strategies, making them more open to developing private brands in different price tiers with retailers.
The economic crisis starting in 2009 forced consumers to change their purchasing behavior towards discount brands, usually private ones. Thus, retailers took advantage and developed their businesses in this direction. Private brands sales increased year after year and reached 12% of retailers’ turnover in 2011 [6]. Retailers’ target for the future is that private brands sales reach 25% of turnover.
Sales of private label products account for 14% of Romania’s retail market, higher by one percentage point compared to 2013 [7].
As a result of their introduction, the market responded to their lower prices and consumers started to buy private brands instead of producers’ brands. Worldwide, the phenomenon has been reported by producers arguing that “the private-label invasion was killing brand loyalty, so that they had to cut prices to compete” [3]. Some authors [8,9] observed that this reasoning was given by Philip Morris when they cut their price for Marlboro cigarettes, Procter & Gamble when they reduced the price of Pampers diapers by a quarter, and Kraft General Foods when they lowered cheese prices by 8%. Competition of private vs. producers’ brands has advantages for consumers because it triggers price battles between producers and retailers, resulting in low food prices.
The research level conducted in recent years is trying to understand how private brands’ purchasing pattern has changed [10,11,12,13,14,15]. This can mainly be explained by the fact that private brands are occupying an emerging position in the global food market and in global purchasing processes. The number and the volume of private brands are expected to grow significantly.
Many studies have also tried to find the most important motivations in purchasing private brands vs. producers’ brands. Batra (2000) [10] found that private brands purchases in a category increase when consumers perceive reduced consequences of making a mistake in brand choice in that category, and when that category has more “search” than “experience” characteristics. Garretson (2002) [16] found that both price and non-price related constructs are impacting both private label attitude and national brand promotion attitude, but the directionality and strength of several of these relationships differ. In regards to branding strategies, Choi (2006) [17] determined that when national brands are differentiated, a high-quality private label should position itself closer to a stronger national brand, and a low-quality private label should position itself closer to a weaker national brand. When the national brands are undifferentiated, the private label should differentiate itself from national brands.
The literature is mainly based on survey methods. In this article, the results of a survey conducted in Bucharest in spring 2015 are analyzed. The aim of this study is to identify and analyze the process of purchasing private brands, in order to get a better picture of the complex factors involved.
The originality of the paper consists in finding the relative importance of the variables that are influencing consumers’ behavior and motivations to buy private brands. The further significance of this study lies in retail market segmentation into private brands buyers and producers’ brands buyers.
The practical implications consist in identifying retailers’ choices for appropriate product categories as they are developing private brands. Private brand marketing strategies in food retail should be designed in changing consumers’ perception of private brands products, from low-priced products to high-quality products.

2. Experimental Section

The data used in this paper were obtained from a survey on consumer awareness and purchasing behavior with respect to private brands. The data were obtained from 292 interviews with consumers. The objective was to distinguish private brands buyers from producers’ brands buyers in food retail.
Variables. The dependent variables considered are: purchase of private brands, type of private brands purchased, awareness of private brands, reasons for buying or not buying private brands, willingness to pay a higher price for private brands, consumers’ perceptions of buying private brands, and their considerations regarding the solutions for increasing consumers’ trust in private brands. The independent variable are: gender, age, income, and occupation. These have been considered as relevant in market segmentation into private and producers’ brands buyers. This hypothesis has been tested and presented in the final part of this article.
Questionnaire. The questionnaire was developed and administered to 10 people. The feedback collected improved the quality of research by changing some of the questions, so they could be understood by all potential interviewees. The questionnaire includes information concerning consumer demographics, economic and occupation characteristics, brands purchasing, consumers’ attitudes towards private brands, the perceived importance of private brands, private brands awareness, and reasons for buying or not buying private brands. Data were collected using the Internet. Each of the questionnaires took about 10 minutes to be filled in.
Sample. The interviews were conducted in spring 2015. The final sample consisted of 292 respondents. The database has been normalized as it respects the quotas of total population. The population studied in this piece of research is the population of Bucharest, the largest city in Romania, with 1,883,425 official inhabitants. The sample has been selected respecting the quotas of the total population: 49% male and 51% female; 17% people aged between 15 and 24 years, 43% people aged between 25 and 44 years, 24% people aged between 45 and 64 years, and 13% people aged over 65 years. This method is often used in surveys and it is known as the quotas method [18,19,20]. Most participants (40%) indicated a monthly income over 1500 lei, which is comparable with the mean income in Romania: 1500 lei, about 340 Euros [21]. Most respondents (66%) list their occupational status as employee.
Research hypotheses and objectives. The survey started from the following hypotheses, which will be tested in the Discussions section:
H1: About 70% of people bought private brands in the last three months.
O1: Identify the number of private brands users. Based on this information, retailers develop marketing strategies.
H2: The most popular private brands are in the food category, specifically basic food.
O2: Identifying the types of products from private brands that are bought more often. Based on this information, retailers develop the marketing mix: product, price, promotion, and placement.
H3: The best known private brand is K-classic (55% of respondents).
O3: Private brand awareness.
H4: People prefer the brand K-classic.
O4: Identify people’s preferences for private brands.
H5: Thirty percent of people did not buy private brands and 50%of non-buyers trust producers’ famous brands.
O5: Identify the main reason why people do not buy private brands.
H6: Lower price is the reason why people buy private brands and the main characteristic that differentiates private brands from producers’ brands.
O6: Identify the reasons why people buy private brands and the main characteristics that differentiate them from producers’ brands.
H7: Eighty percent of people have the willingness to pay higher prices if the quality of private brands’ products increases. The products for which people would pay more are sweets and dairy products.
O7: Identify people’s willingness to pay more for private brands’ products with an improved level of quality and identification of these categories of products. Based on this information, retailers develop the product–price mix.
P8: Fifty percent of people would pay a price 10%higher for improved private brands products.
O8: Estimate the price level for improved private brands’ products quality.
H9: Fifteen percent of people have higher expectations as regards products’ quality compared to what they have experienced.
O9: Compare people’s expectations as regards products’ quality compared to what they have experienced after buying the private brands’ products.
H10: The most significant action needed to increase consumers trust in a private brand is communicating certification and independent tests on products’ labels.
O10: Rank the actions needed for increasing consumers’ trust in private brands.
Transversal hypothesis: Consumers of private brands are women, 45–64 years old and low income.
Transversal objective: Identify private brands consumers’ profile.

3. Results and Discussion

3.1. Data Analysis

The independent variables considered in this piece of research are gender, age, income, and occupation. We expect that consumers’ patterns of purchasing change with respect to these variables.
The sample respects the quotas of the total population, as seen in Table 1, Table 2, Table 3 and Table 4. Almost 50% of respondents are male and 50% are female, close to the statistical data for the total population in Bucharest.
Table 1. Sample structure by gender, compared to total population.
VariableGender
Total populationSample
Absolute (persons)Relative (%)Absolute (persons)Relative (%)
Male871,53046.314248.6
Female1,011,89553.715051.4
Source: own calculations based on statistical data (Statistical yearbook 2013) [22] and results of the questionnaire.
Table 2. Sample structure by age, compared to total population.
VariableAge
Total populationSample
Absolute (persons)Relative (%)Absolute (persons)Relative (%)
15–24 years225,82013.74917
25–44 years668,25340.512543
45–65 years483,04529.38027
over 65 years272,15116.53813
Source: own calculations based on statistical data (Statistical yearbook 2013) [22] and results of the questionnaire.
The sample consists of 17%young people (ages between 15 and 24 years old), 43% people aged between 25 and 44 years old, 27% people aged between 45 and 65 years old, and 13% aged over 65 years old. As seen in Table 2, the quotas of the sample are close to the quotas of the total population.
With regards to income (Table 3), the sample slightly differs compared to the total population. Statistics show that 15% of the population has an income under 160 euros, but 25% of respondents belong to this low-income category. These results have been achieved because the sample contains numerous young people, considering the sample structure by age (17% young people within the sample, compared to 13.7% of the statistical data), and young people have lower incomes.
Table 3. Sample structure by income, compared to total population.
VariableIncome
Total populationSample
Absolute (persons)Relative (%)Absolute (persons)Relative (%)
< 700 lei (under 160 euros)-157525.7
700–1500 lei (160–340 euros)-379833.6
> 1500 lei (over 340 euros)-4811940.7
Source: own calculations based on statistical data (Statistical yearbook 2013) [22] and results of the questionnaire.
Finally, the sample structure by occupation (Table 4) shows similarities between the sample and total population and small differences only for entrepreneurs (1.2% of the total population compared to 4.5% of the sample).
Table 4. Sample structure by occupation, compared to total population.
VariableOccupation
Total populationSample
Absolute (persons)Relative (%)Absolute (persons)Relative (%)
employee with secondary education-67.311266.10
employee with higher education81
unemployed, students-15.54515.4
entrepreneur-1.2134.5
other-164114.0
Source: own calculations based on statistical data (Statistical yearbook 2013) [22] and results of the questionnaire.
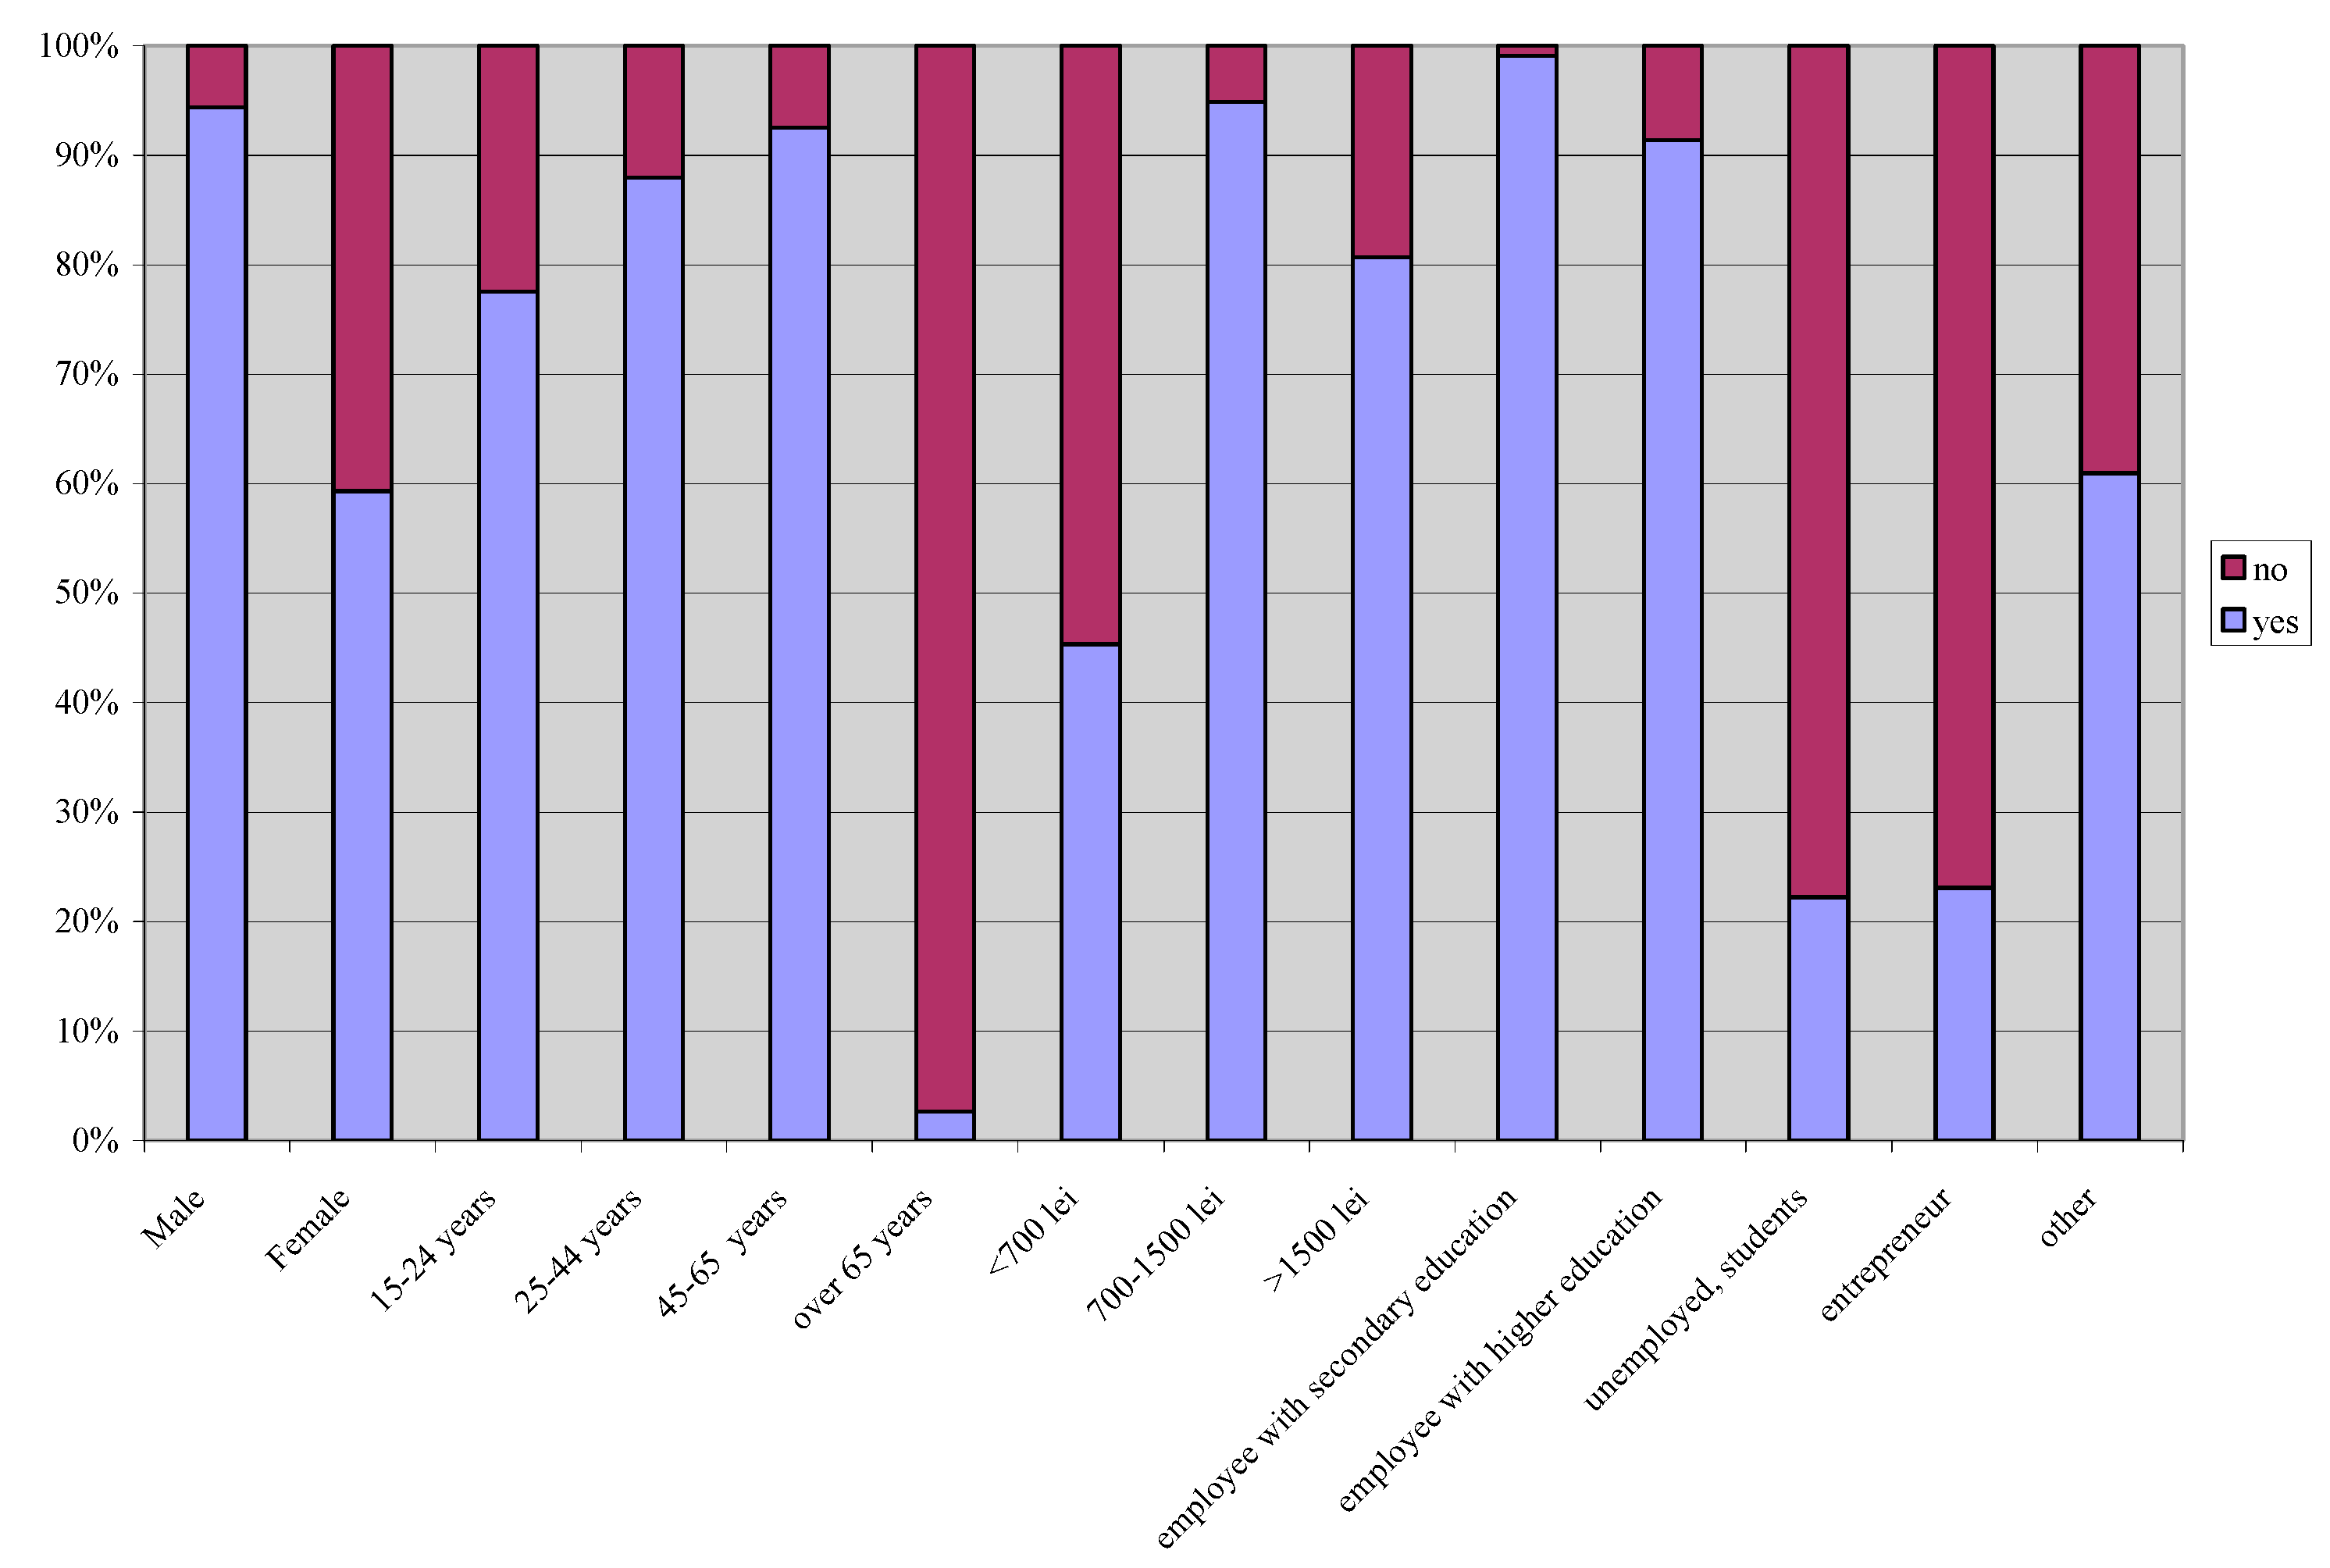
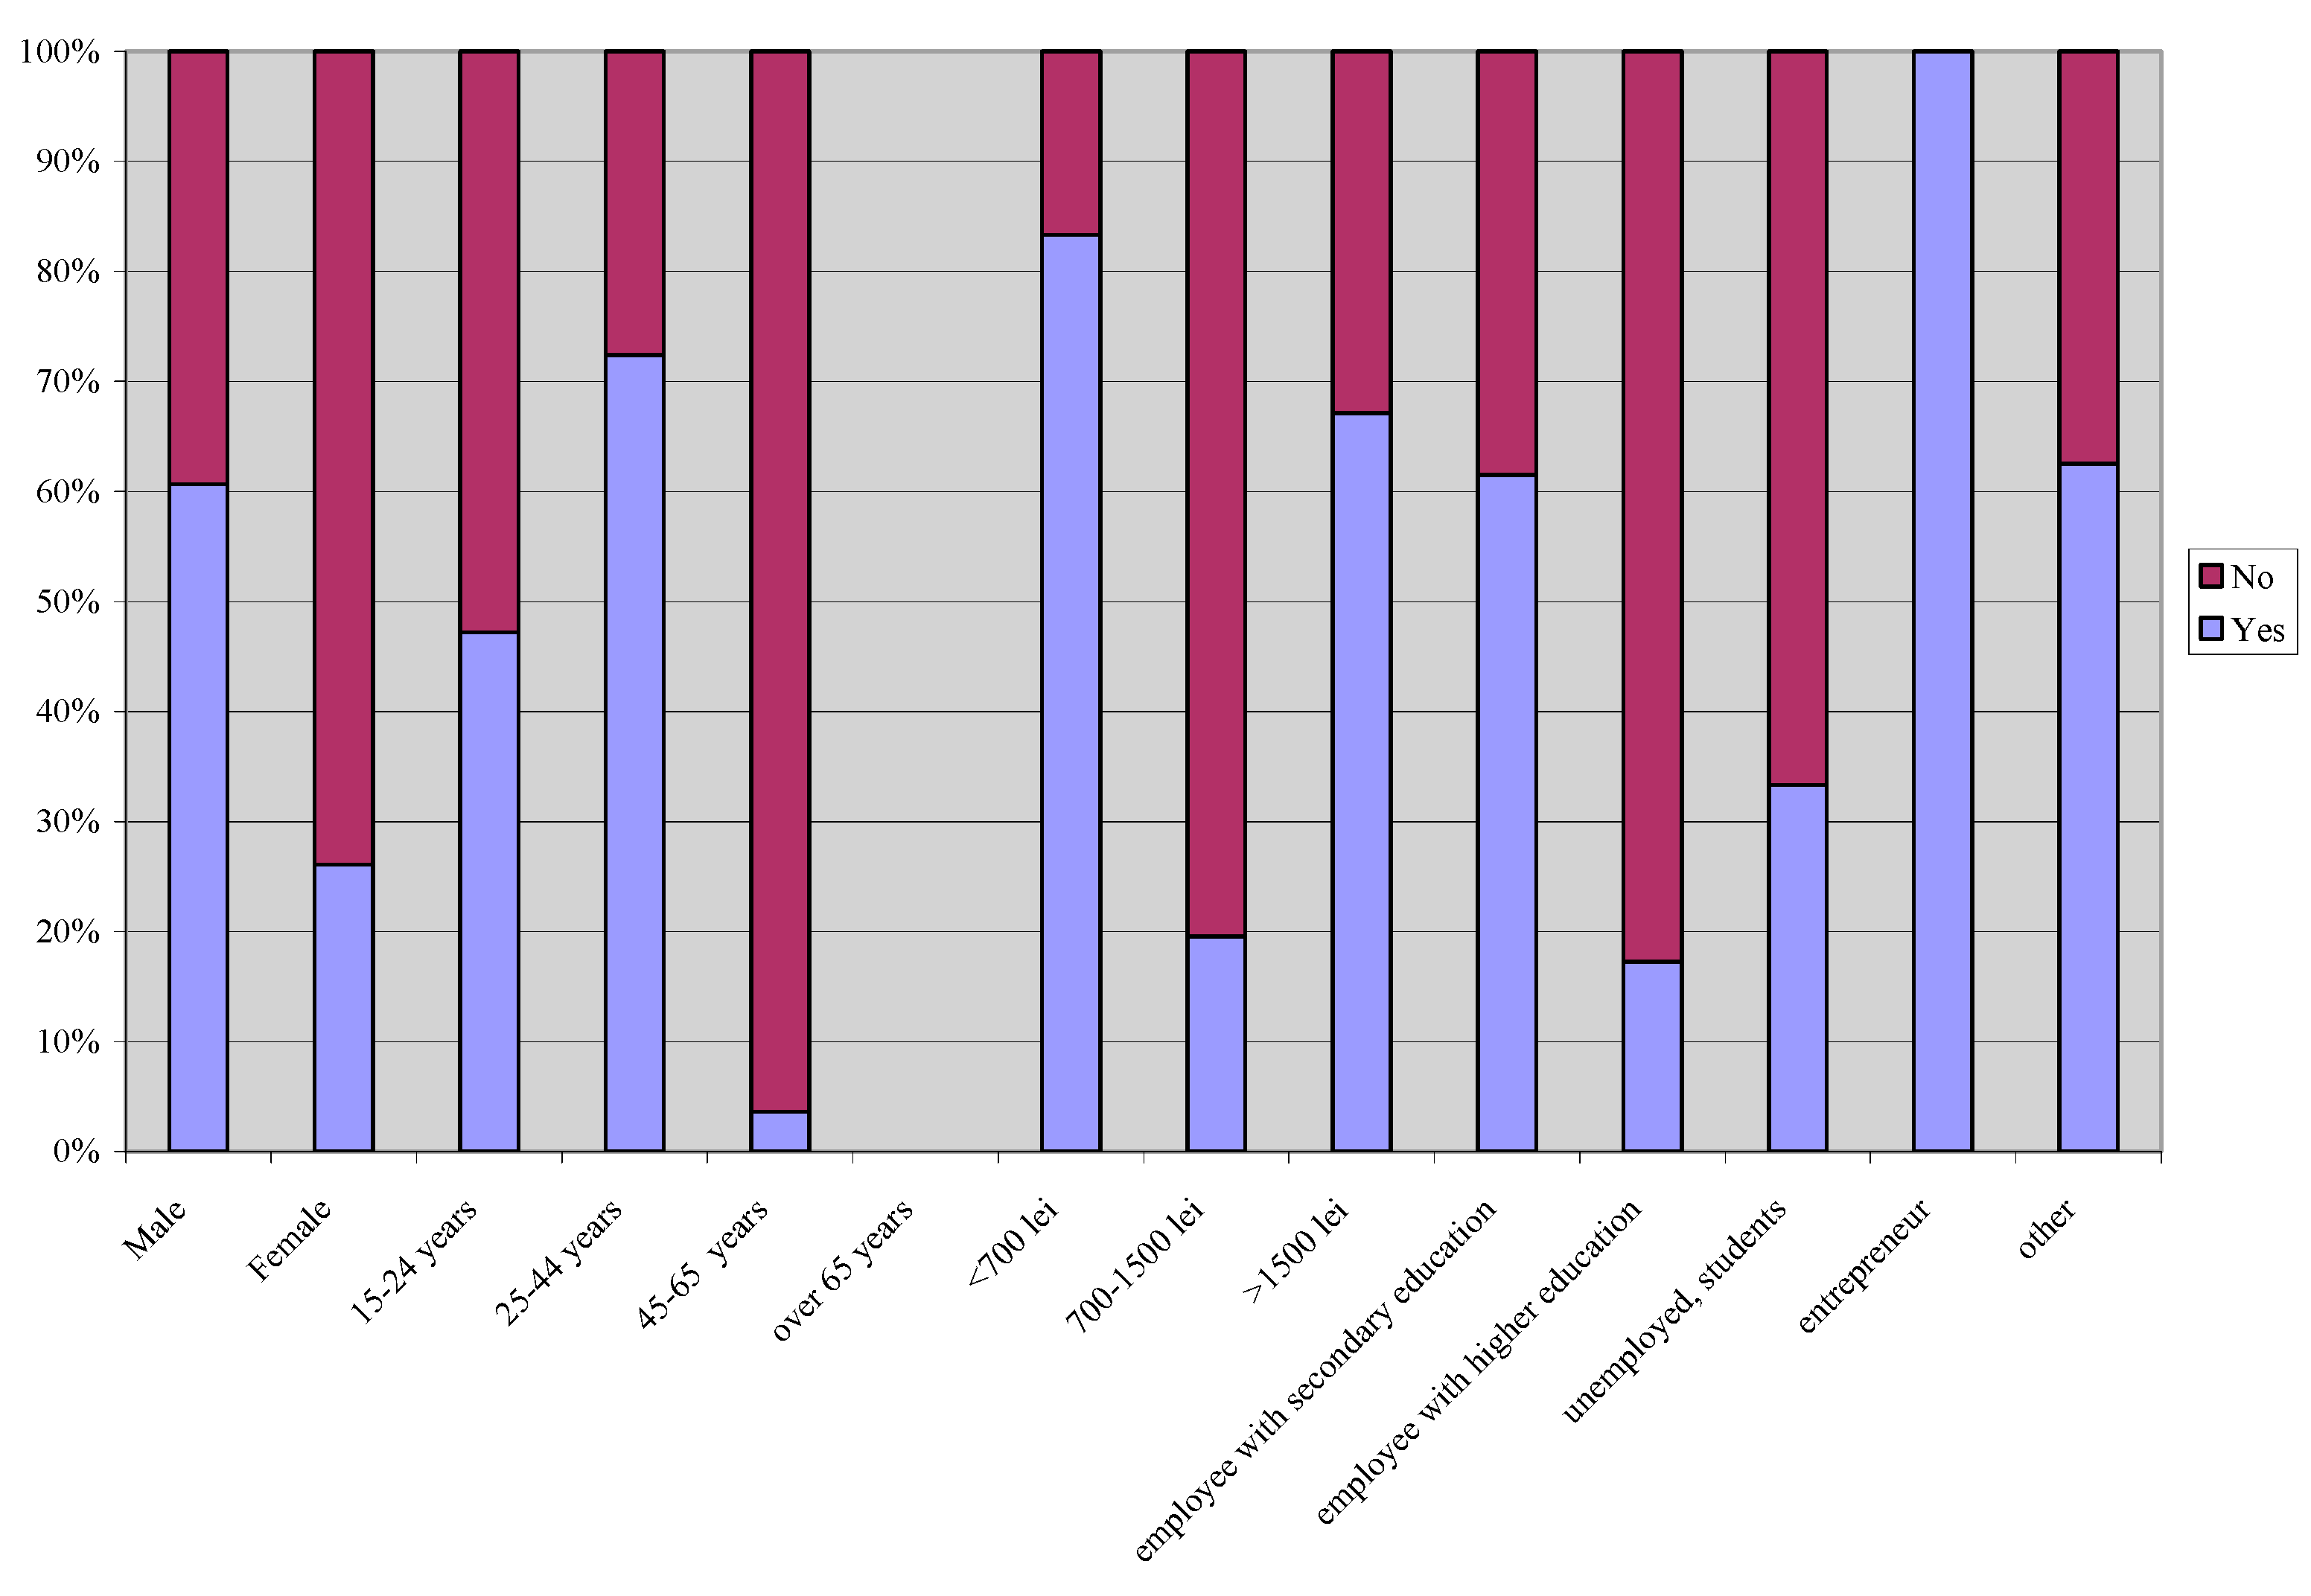
The first question aims to identify the number of private brands users and their profile. Seventy-six percent of people bought private brands in the last three months. As seen in Figure 1, men buy private brands more often than women. Their age is between 45 and 65 years old; they have middle level income and are employees with secondary education. People who do not buy private brands are over 65 years old, with no active occupation and low income. Age and occupation are the variables that divide markets into private brands users and non-users. Thus, 97% of people over 65 years old and 76% of unemployed people do not buy private brands. In return, 97% of people aged between 45 and 65 years old and 99% of employees with secondary education buy private brands. Income has a significant influence, as well: 94% of people with an income range in the middle level buy private brands, while 55% of people with low income do not buy them.
Figure 1. Have you bought private brands in the last three months?
Sustainability 07 09293 g001
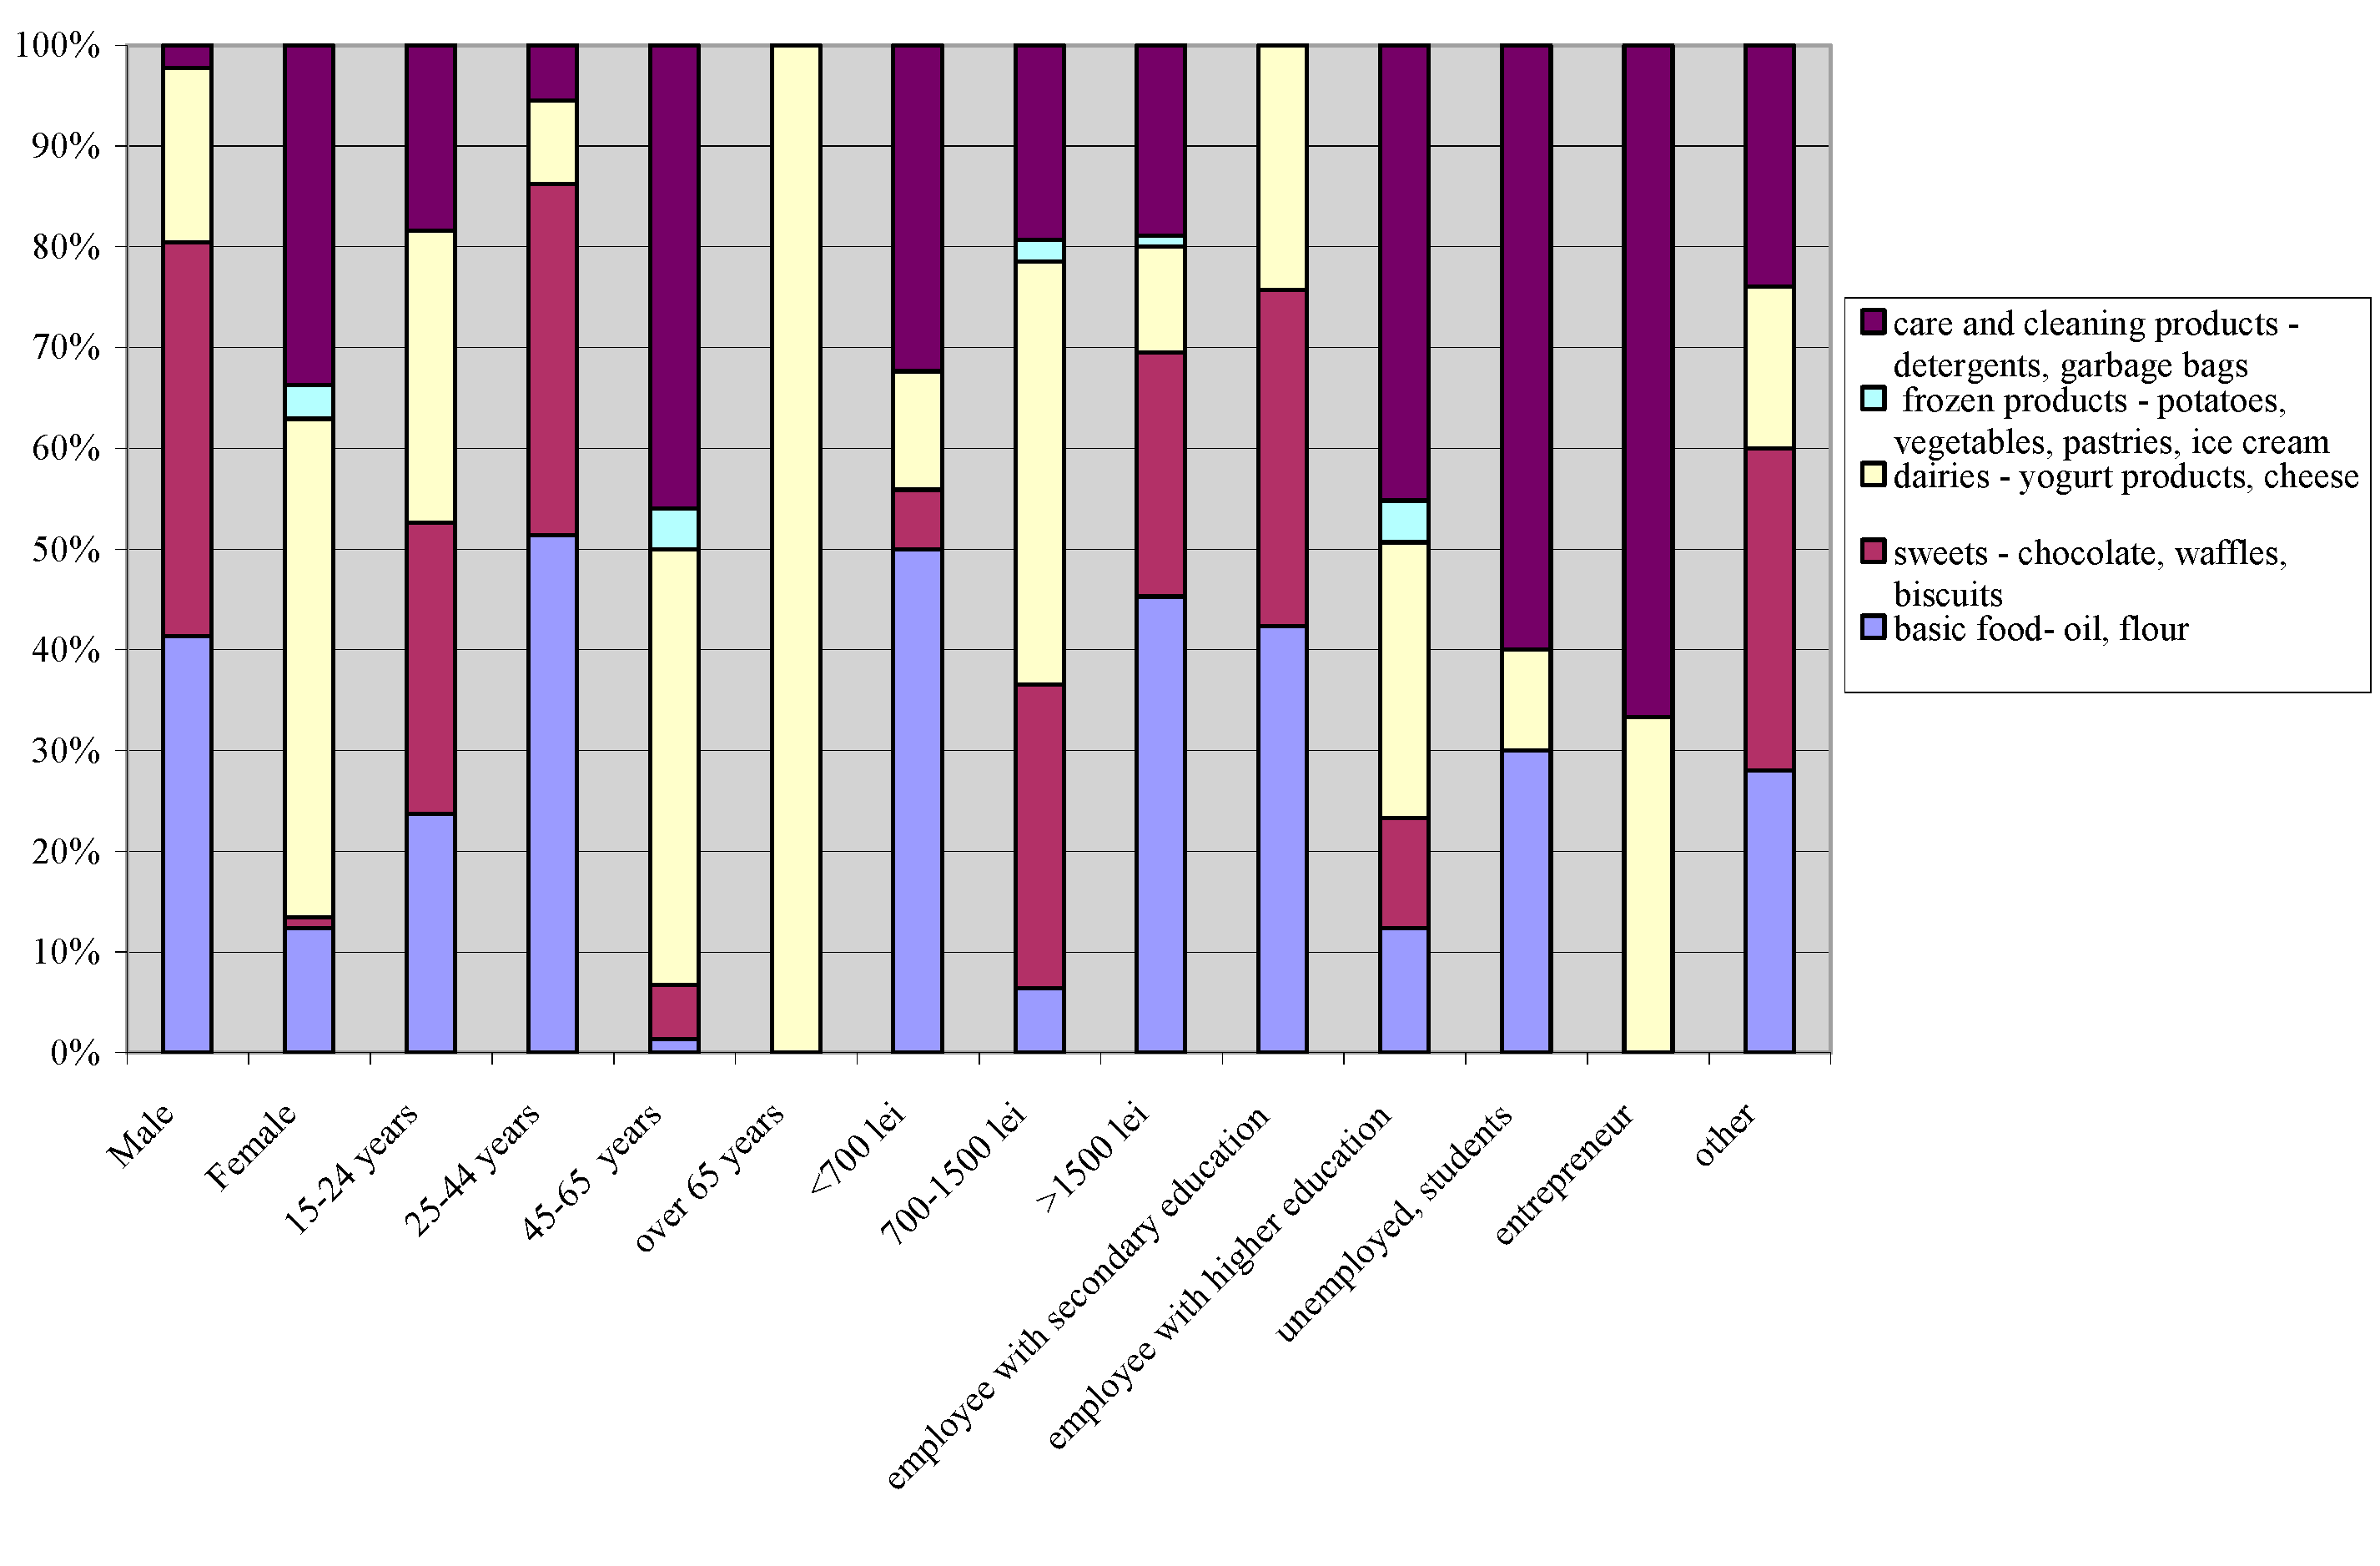
The second objective is to identify types of products within private brands that are bought more often (Figure 2). The answers are distributed almost equally between basic foods (22% of people chose this category) and dairy products (23%). With a distribution of 11%, home care and cleaning products are less often purchased. Eighteen percent of people buy sweets (chocolate, waffles, and biscuits) from private brands. The market is highly segmented by age: people aged between 15 and 24 years buy sweets and dairy products; people aged between 25 and 44 years old buy basic foods and sweets; people aged between 45 and 65 years buy dairy and care and cleaning products; and people over 65 years old buy dairy products. People also act differently depending on their gender. Men are purchasing basic foods and sweets with private brands and women are purchasing dairy products, home care and cleaning products from private brands.
Figure 2. What kind of products with private brands do you buy more often?
Sustainability 07 09293 g002
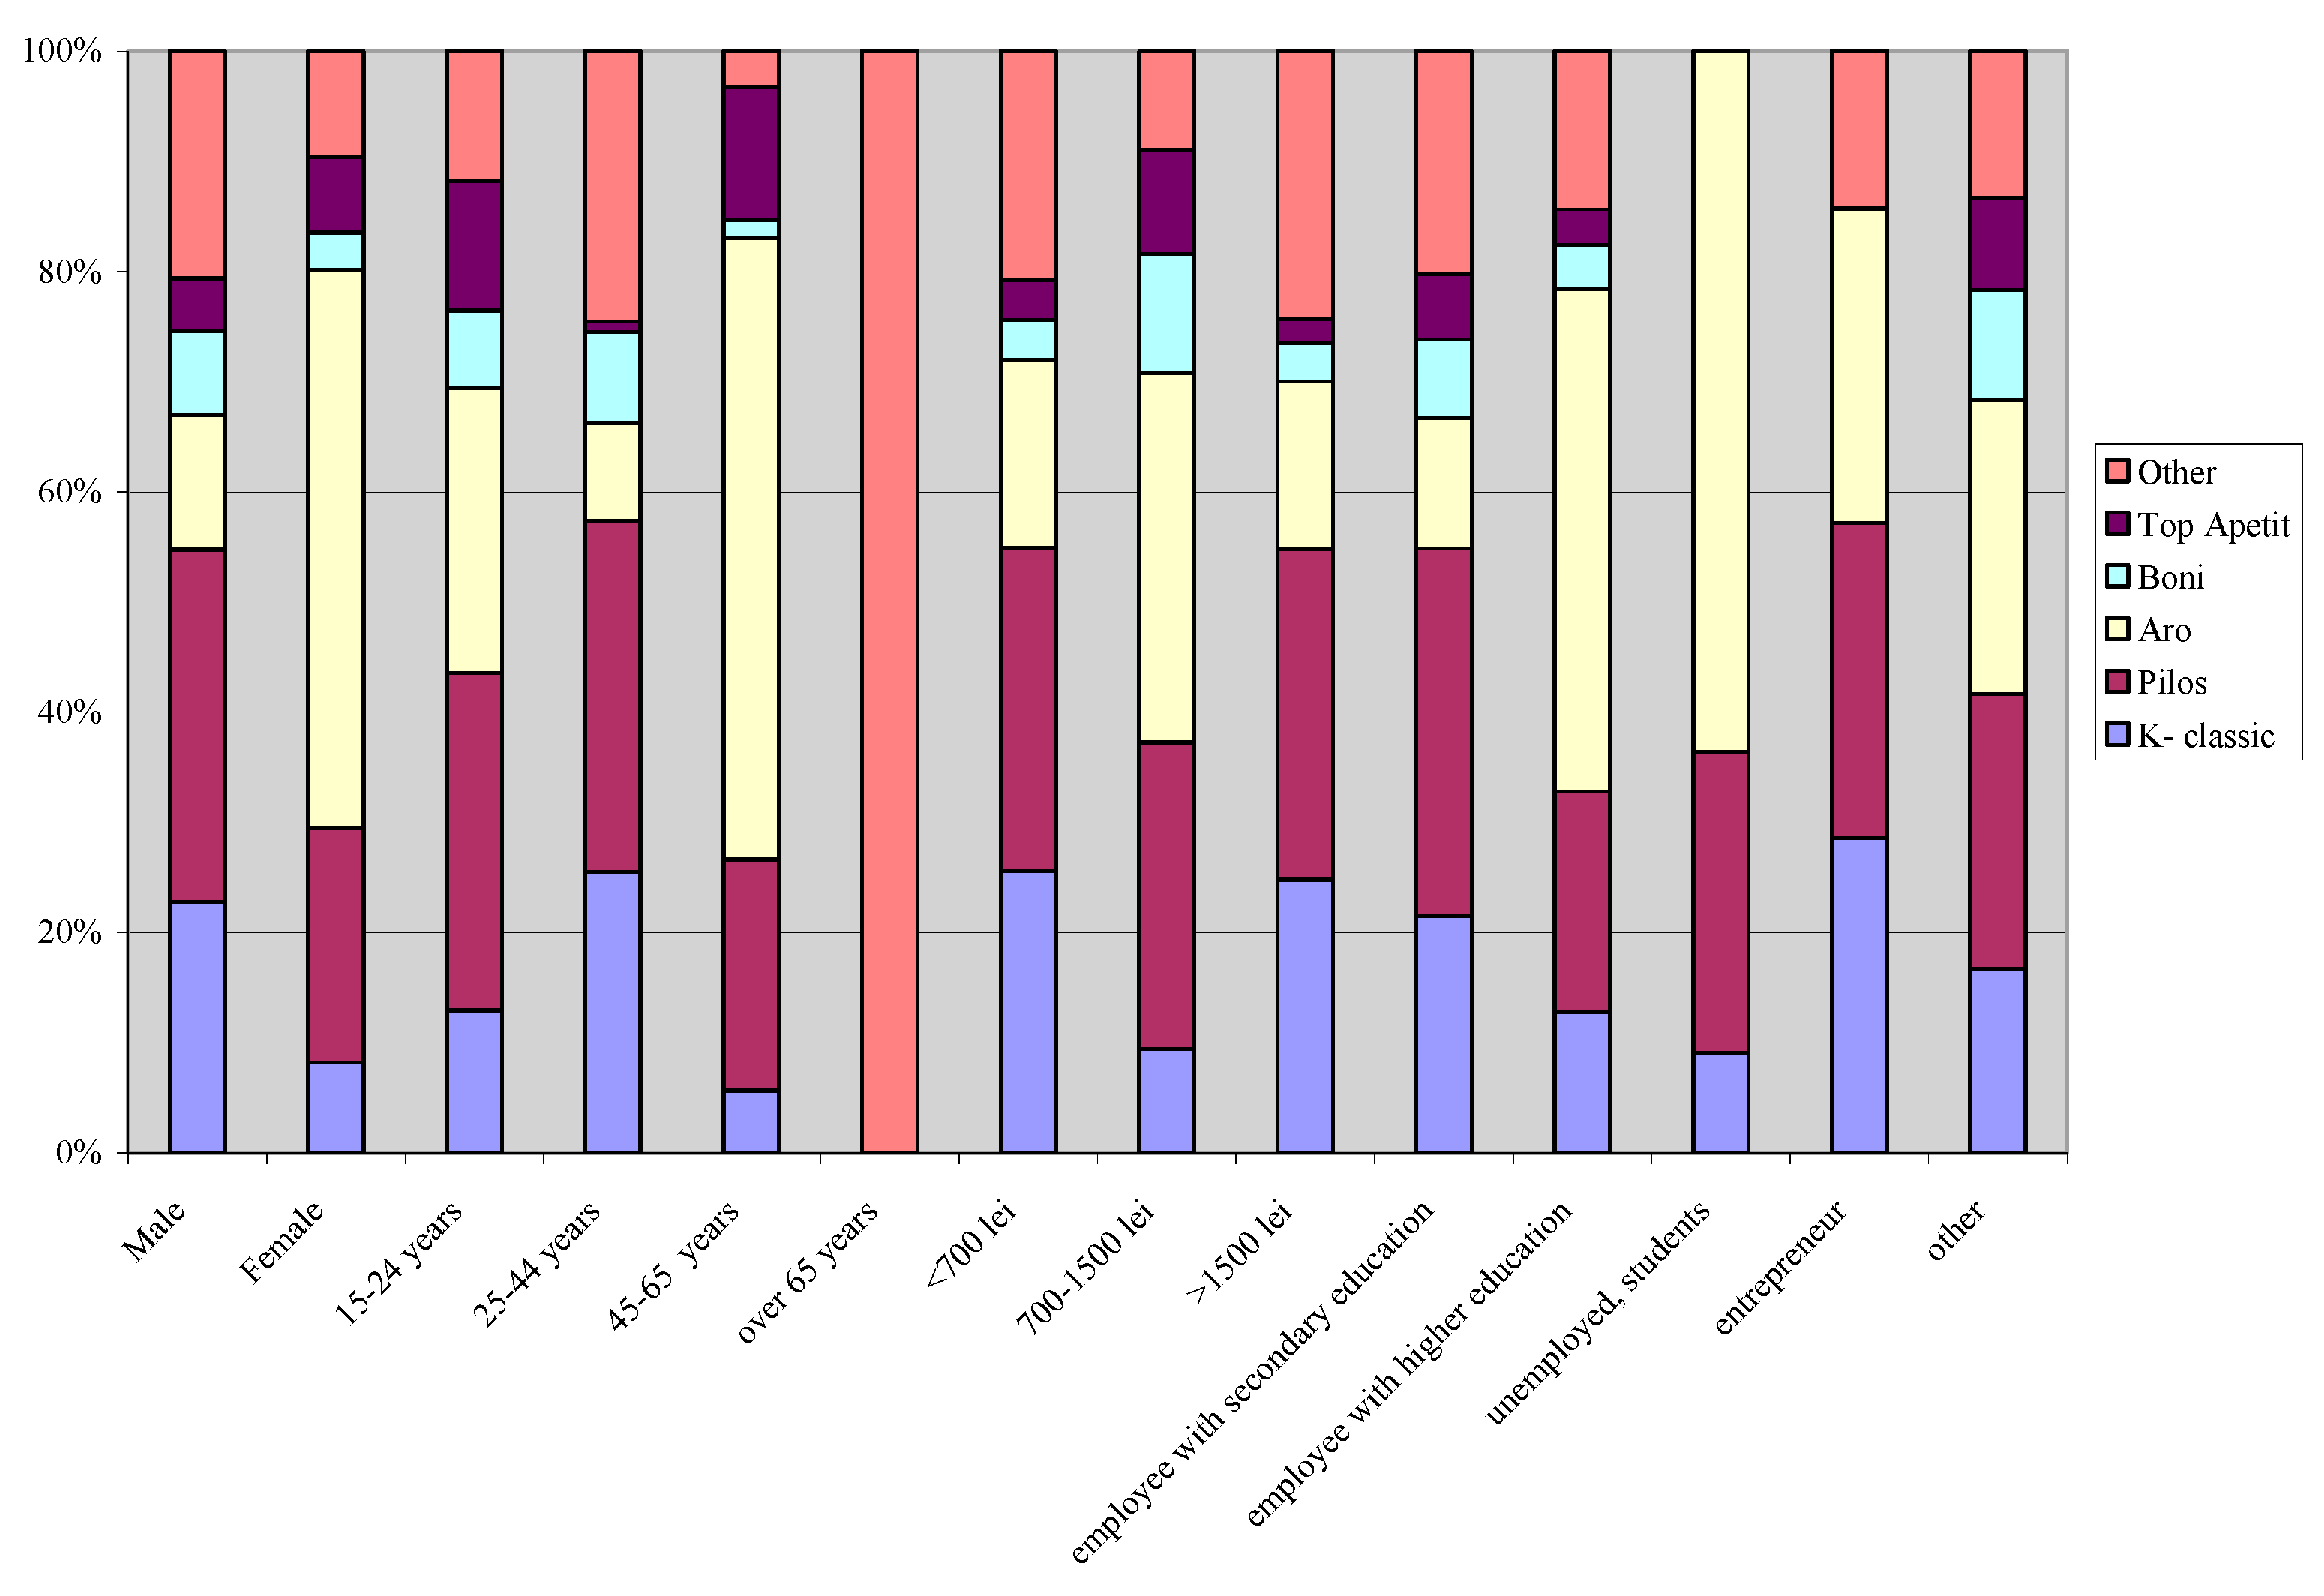
Another important objective is private brand awareness (Figure 3). The most famous brand is Pilos, the brand of German retailer Lidl, as shown by the 52% of people who chose it. The next famous brand is Aro, the brand of German retailer Metro, as shown by the 41% of people who recognized it. Less recognized brands are Boni and Top Apetit. Considering gender, male recognized Pilos and women Aro. With regards to age, young people recognized Pilos and mature people Aro. People with no occupation and employees with higher education chose Aro.
Figure 3. What private brands do you know?
Sustainability 07 09293 g003
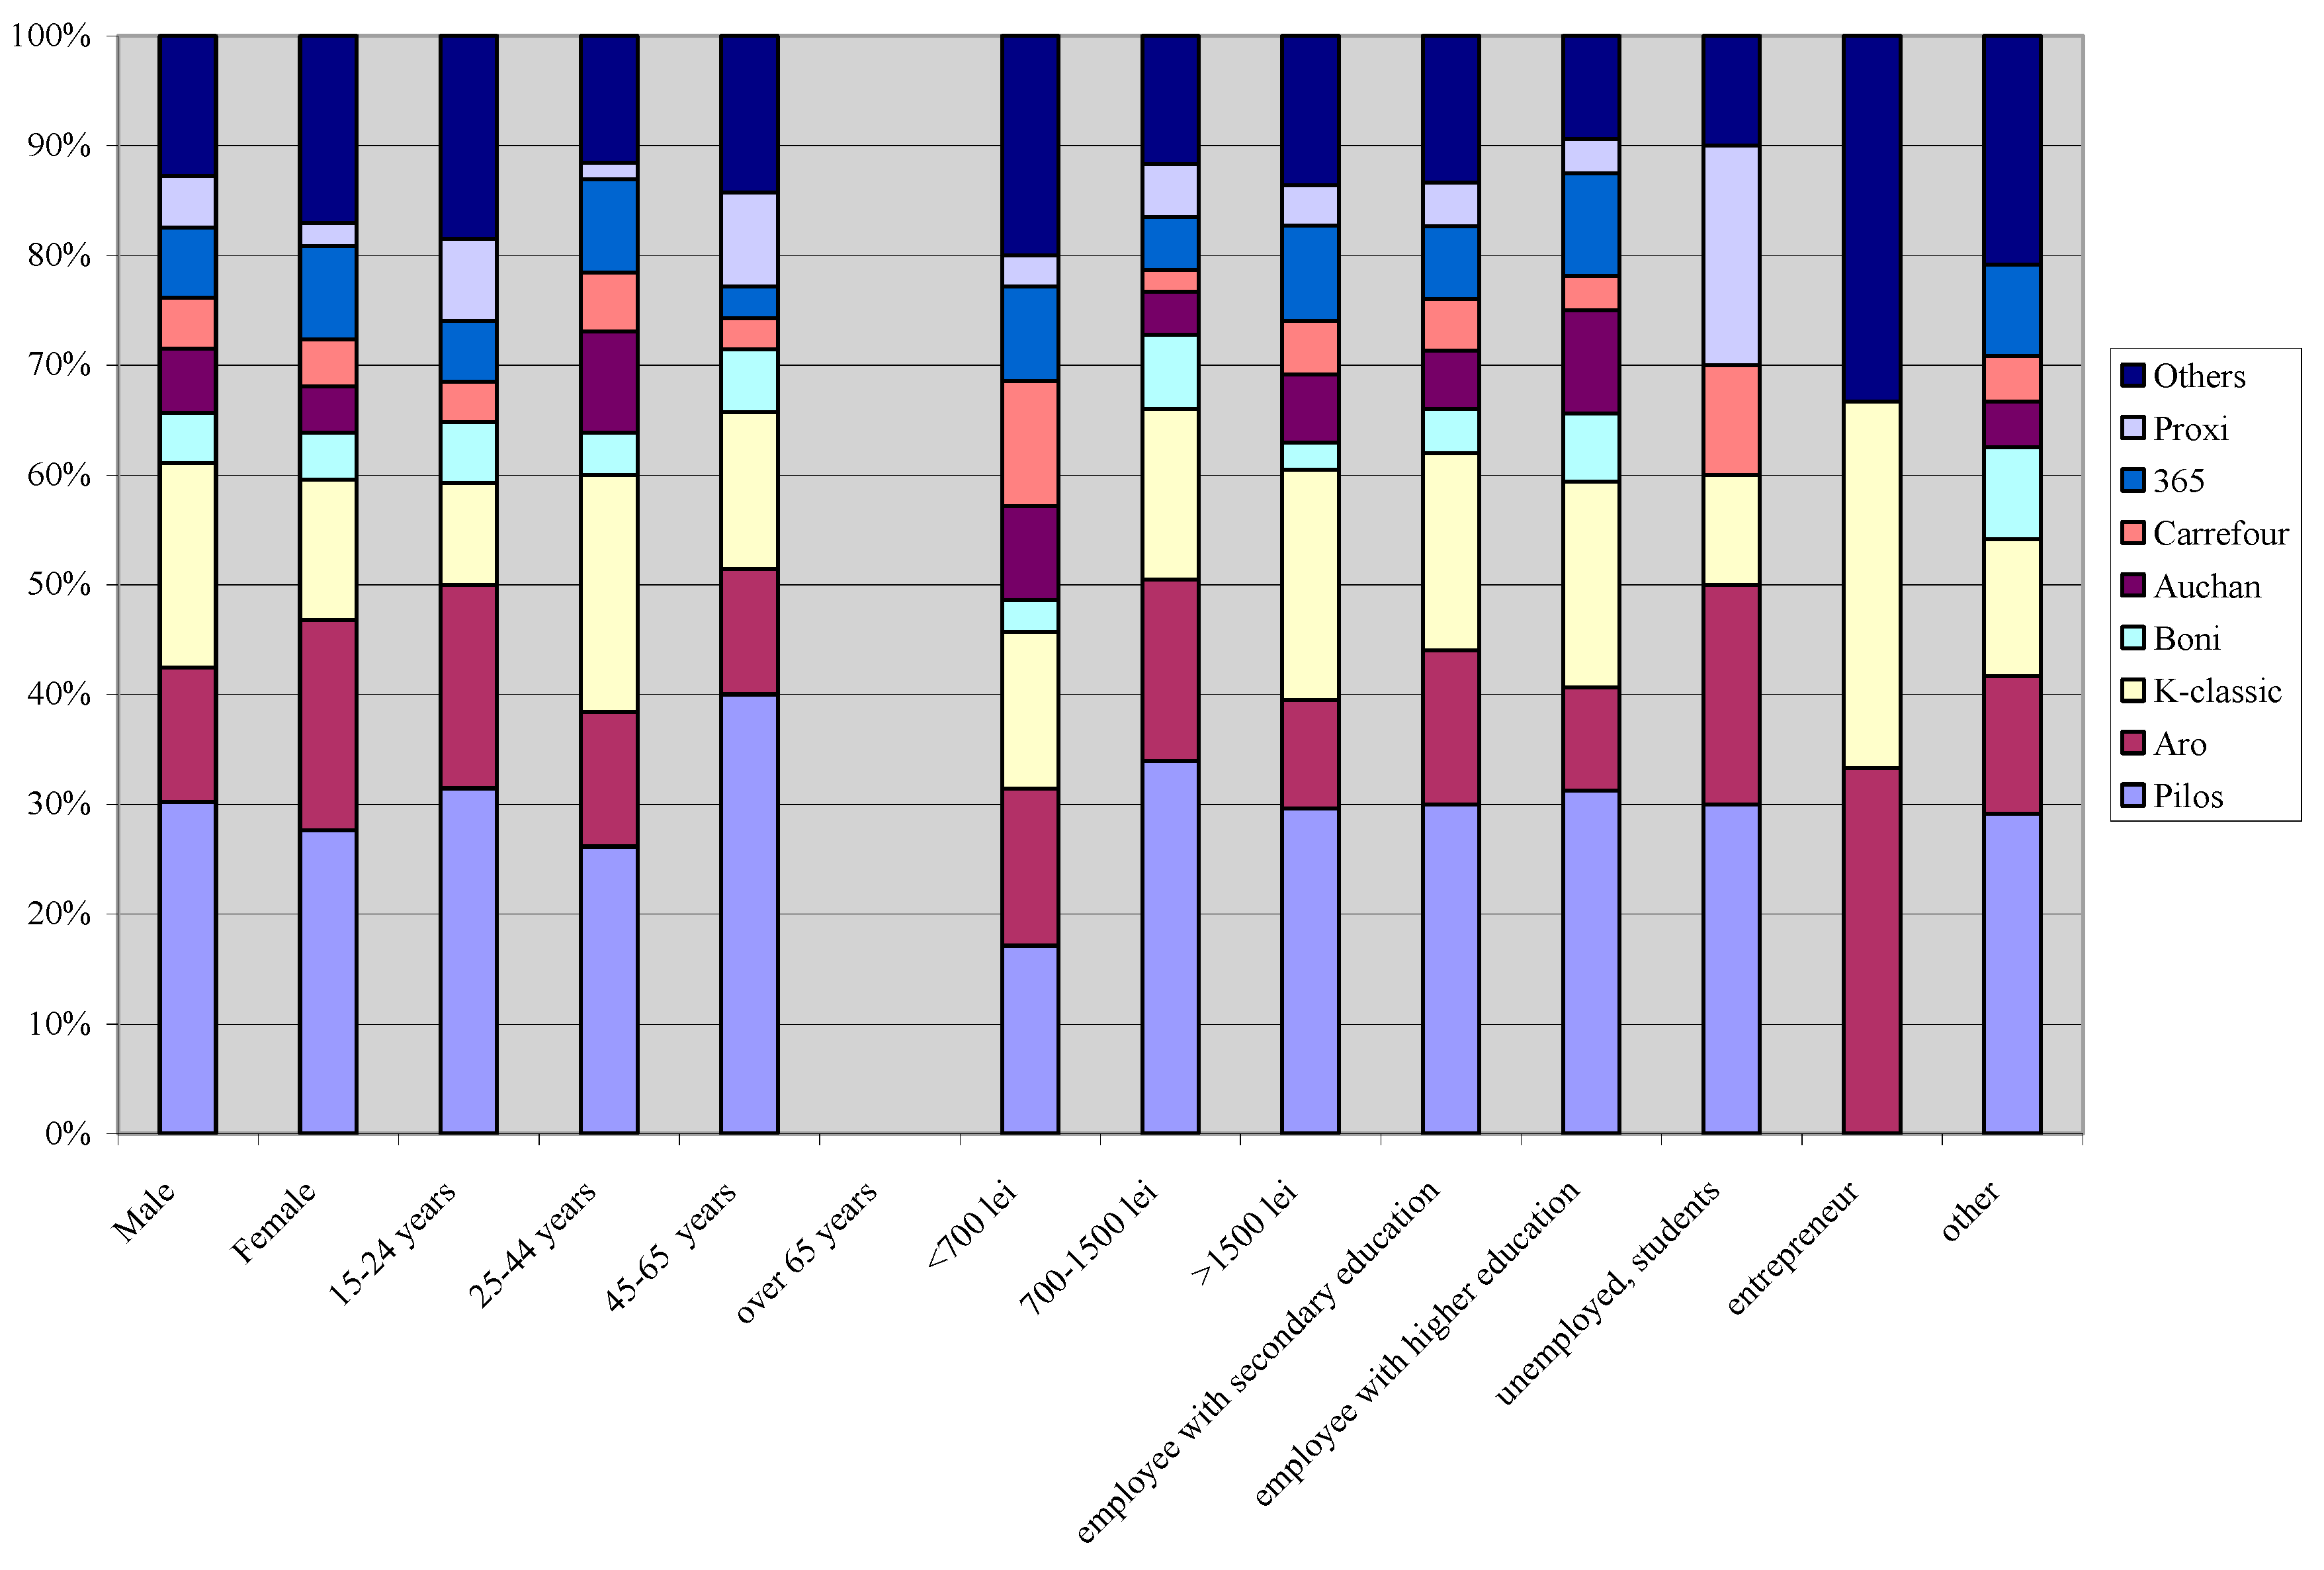
The following objective is to identify people preferences for private brands (Figure 4). Overall, Pilos is the most preferred brand (almost 30% of people chose this brand). K-classic and Aro are also among people’s preferences, with 17% and 14%, respectively. Respondents also named the brands 365, the brand of Mega Image retailer, Carrefour, Auchan, Boni, Proxi, and others. All people prefer Pilos as first choice, but the second choice is up for debate. The second choice for men is K-classic, while for women it is Aro. The second choice for young people is Aro and for mature people is K-classic. With regards to income, people with high levels of income prefer K-classic as their second choice, while low-income respondents prefer Aro. Entrepreneurs prefer Aro, unemployed people prefer Proxi, and employees prefer Pilos and then K-classic.
We may also identify the profile of consumers for each brand. The customer of brand Pilos has middle or low income and prefers to purchase food daily from a discounter in proximity to his home, such as Lidl. Other customers—employed, with high income—prefer to buy food from a supermarket in proximity to their home, such as Mega Image. Finally, occasional customers buy food on weekends (stocking up) and choose between a hypermarket, Cash & Carry (Metro with brand Aro) and hyper-hard discount (Kaufland with brand K-classic).
To reach our research objectives, for correlations between variables we used the linear regression method described below:
y = a + b x ,   b = r · S y S x ,   a = M y b · M x
where:
  • y = estimated result (age of consumers that would buy a specific brand)
  • x = known variable (income level)
  • My = average age
  • Mx = average income
  • Sy = standard age deviation
  • Sx = standard income deviation
  • a = intercept
  • b = regression slope
  • In our research, for Pilos brand consumers’ profile, the average income was 1500 lei with a standard deviation of 500 lei; and average age of 46 years with a standard deviation of 5 years.
  • b = 0.8 · 5 500 = 0.008 ; a = 46 0.008 · 1500 = 34 .
  • Thus, the regression equation that we used was y = 34 + 0.008 x for Pilos brand consumers’ profile identification.
This helps us to better understand the customer profile of Pilos private brand. Through the regression method, an extrapolation can be done to the age variable, knowing the income level of potential persons added to the panel.
Figure 4. What private brands have you bought in the last three months?
Sustainability 07 09293 g004
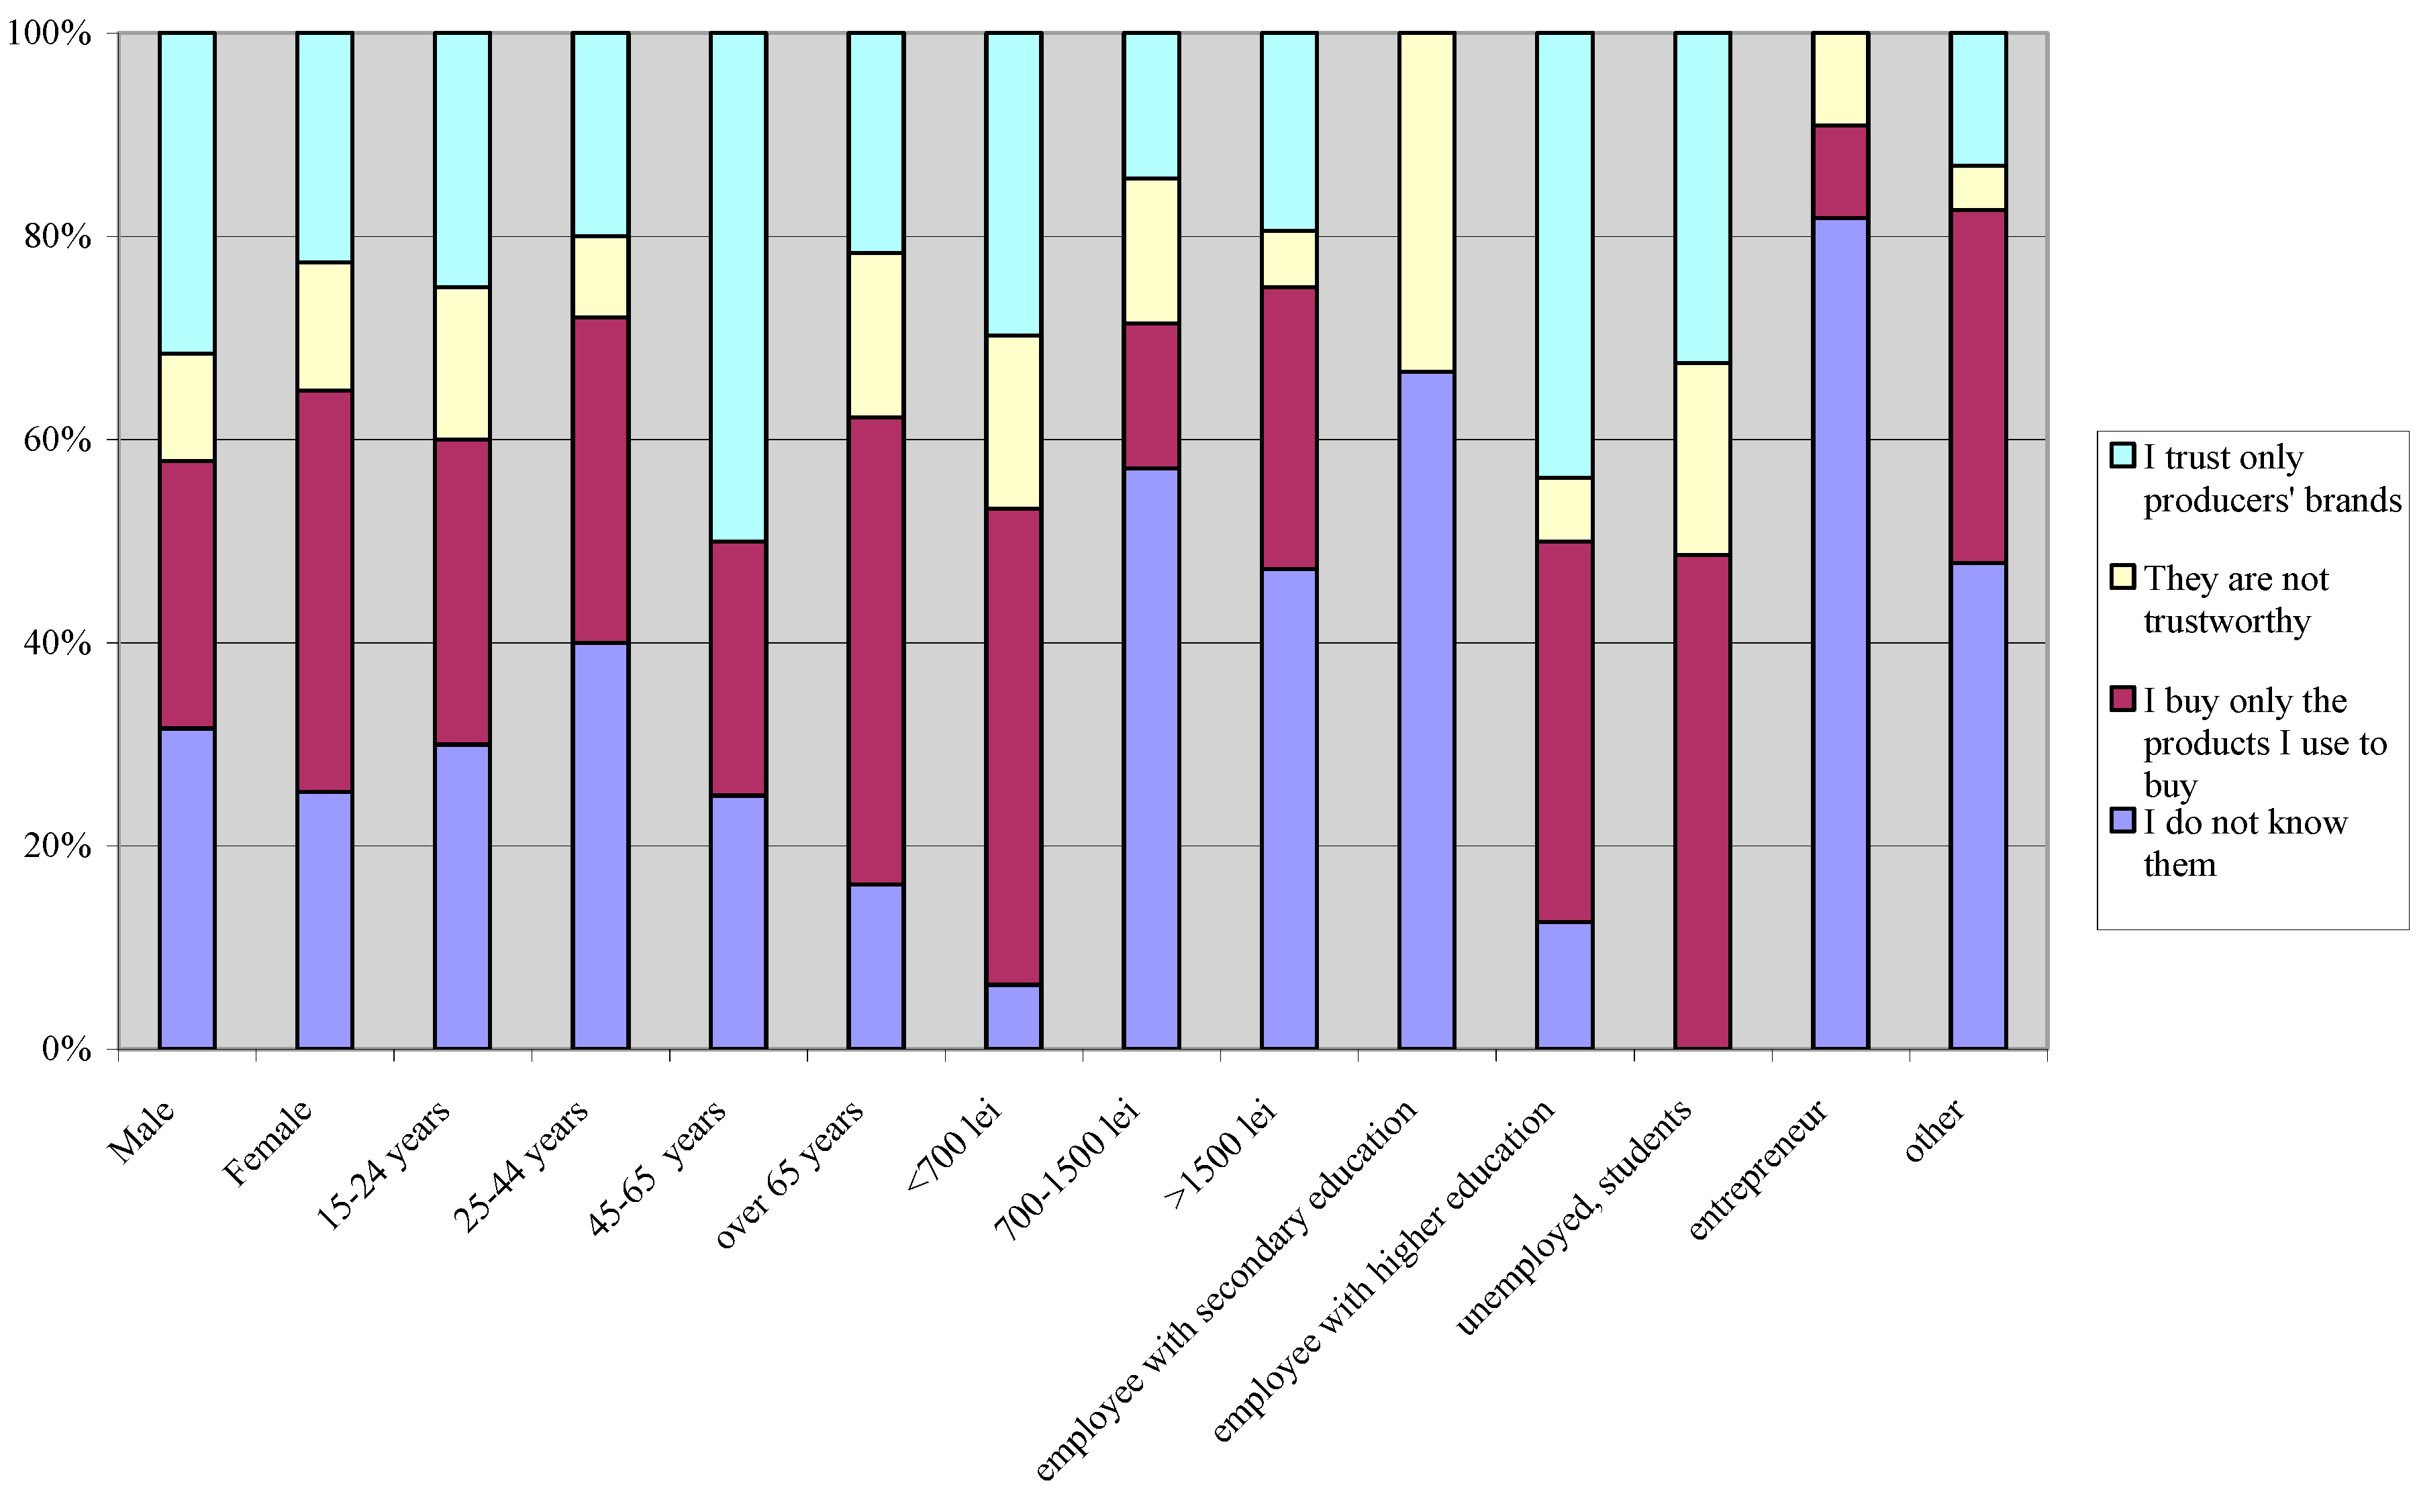
Identifying the main reason why people do not buy private brands is another aim of this piece of research (Figure 5). The reason why people do not buy private brands is that they are buying only the products they are used to buy, which shows high loyalty to products and relative stable purchasing patterns (36% of respondents have chosen this reason). Twenty-six percent of people do not know them and 24% of people trust producers’ brands. The results of this question allow us to identify the patterns of purchasing, as well. The pattern “I do not know them” corresponds to young men with middle income, employees with secondary education, or entrepreneurs. The pattern “I buy only the products I am used to buying” corresponds to women over 65 years old, with low income and no occupation. The pattern “Private brands are not trustworthy” corresponds to both men and women, young or over 65 years old with low income, the unemployed, or employees with secondary education. The pattern “I trust only producers’ brands” corresponds to middle-aged men with low income or employees with higher education.
Figure 5. Why do you not buy private brands?
Sustainability 07 09293 g005
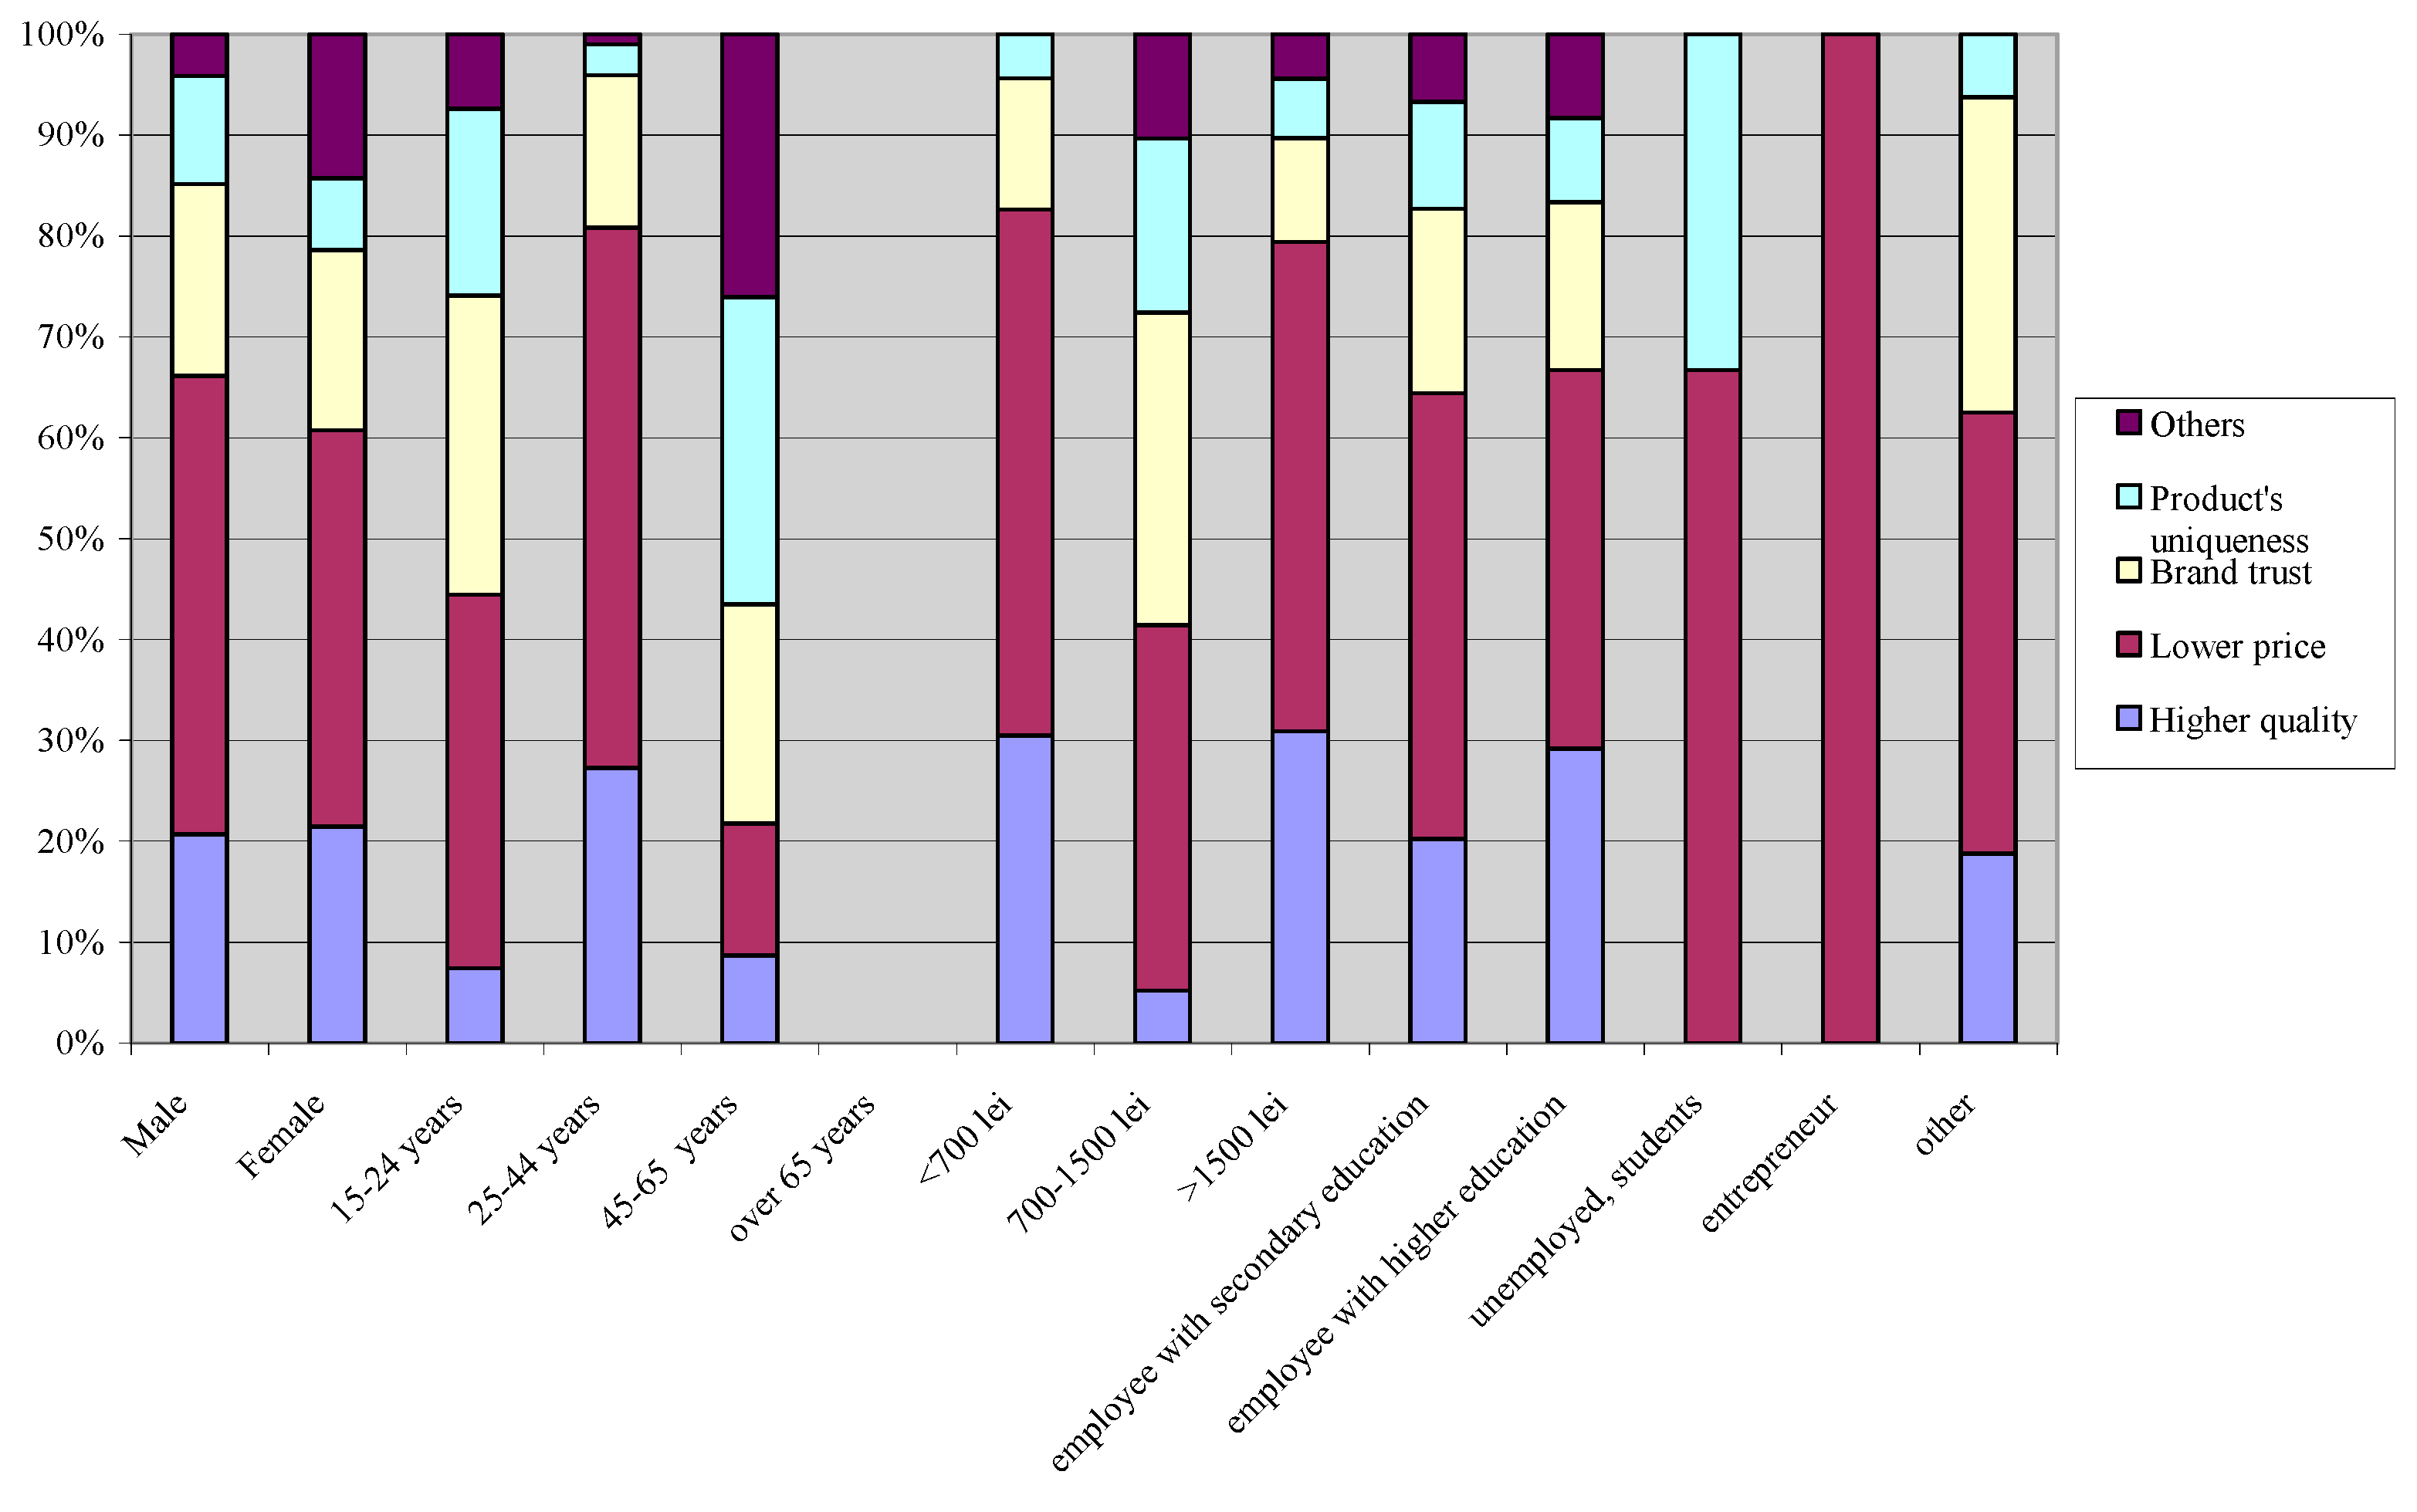
Figure 6 shows the results for identifying the reasons why people buy private brands. The main reason why people buy private brands is their lower price (44% of people chose this answer). High quality and brand trust were also mentioned by 20% or 19%, respectively. Products’ uniqueness accounts for 10% of people. High quality is important for both men and women aged between 25 and 44 years, with low or high income, and employees with higher education. Low price is significant for young men with low income, the unemployed, or entrepreneurs. Brand trust is important for both young men and women with middle-level income. Products’ uniqueness is significant for middle-aged men with middle-level income, and those with no active occupation. People aged over 65 did not answer the question.
Figure 6. What are the reasons for choosing a particular brand among others?
Sustainability 07 09293 g006
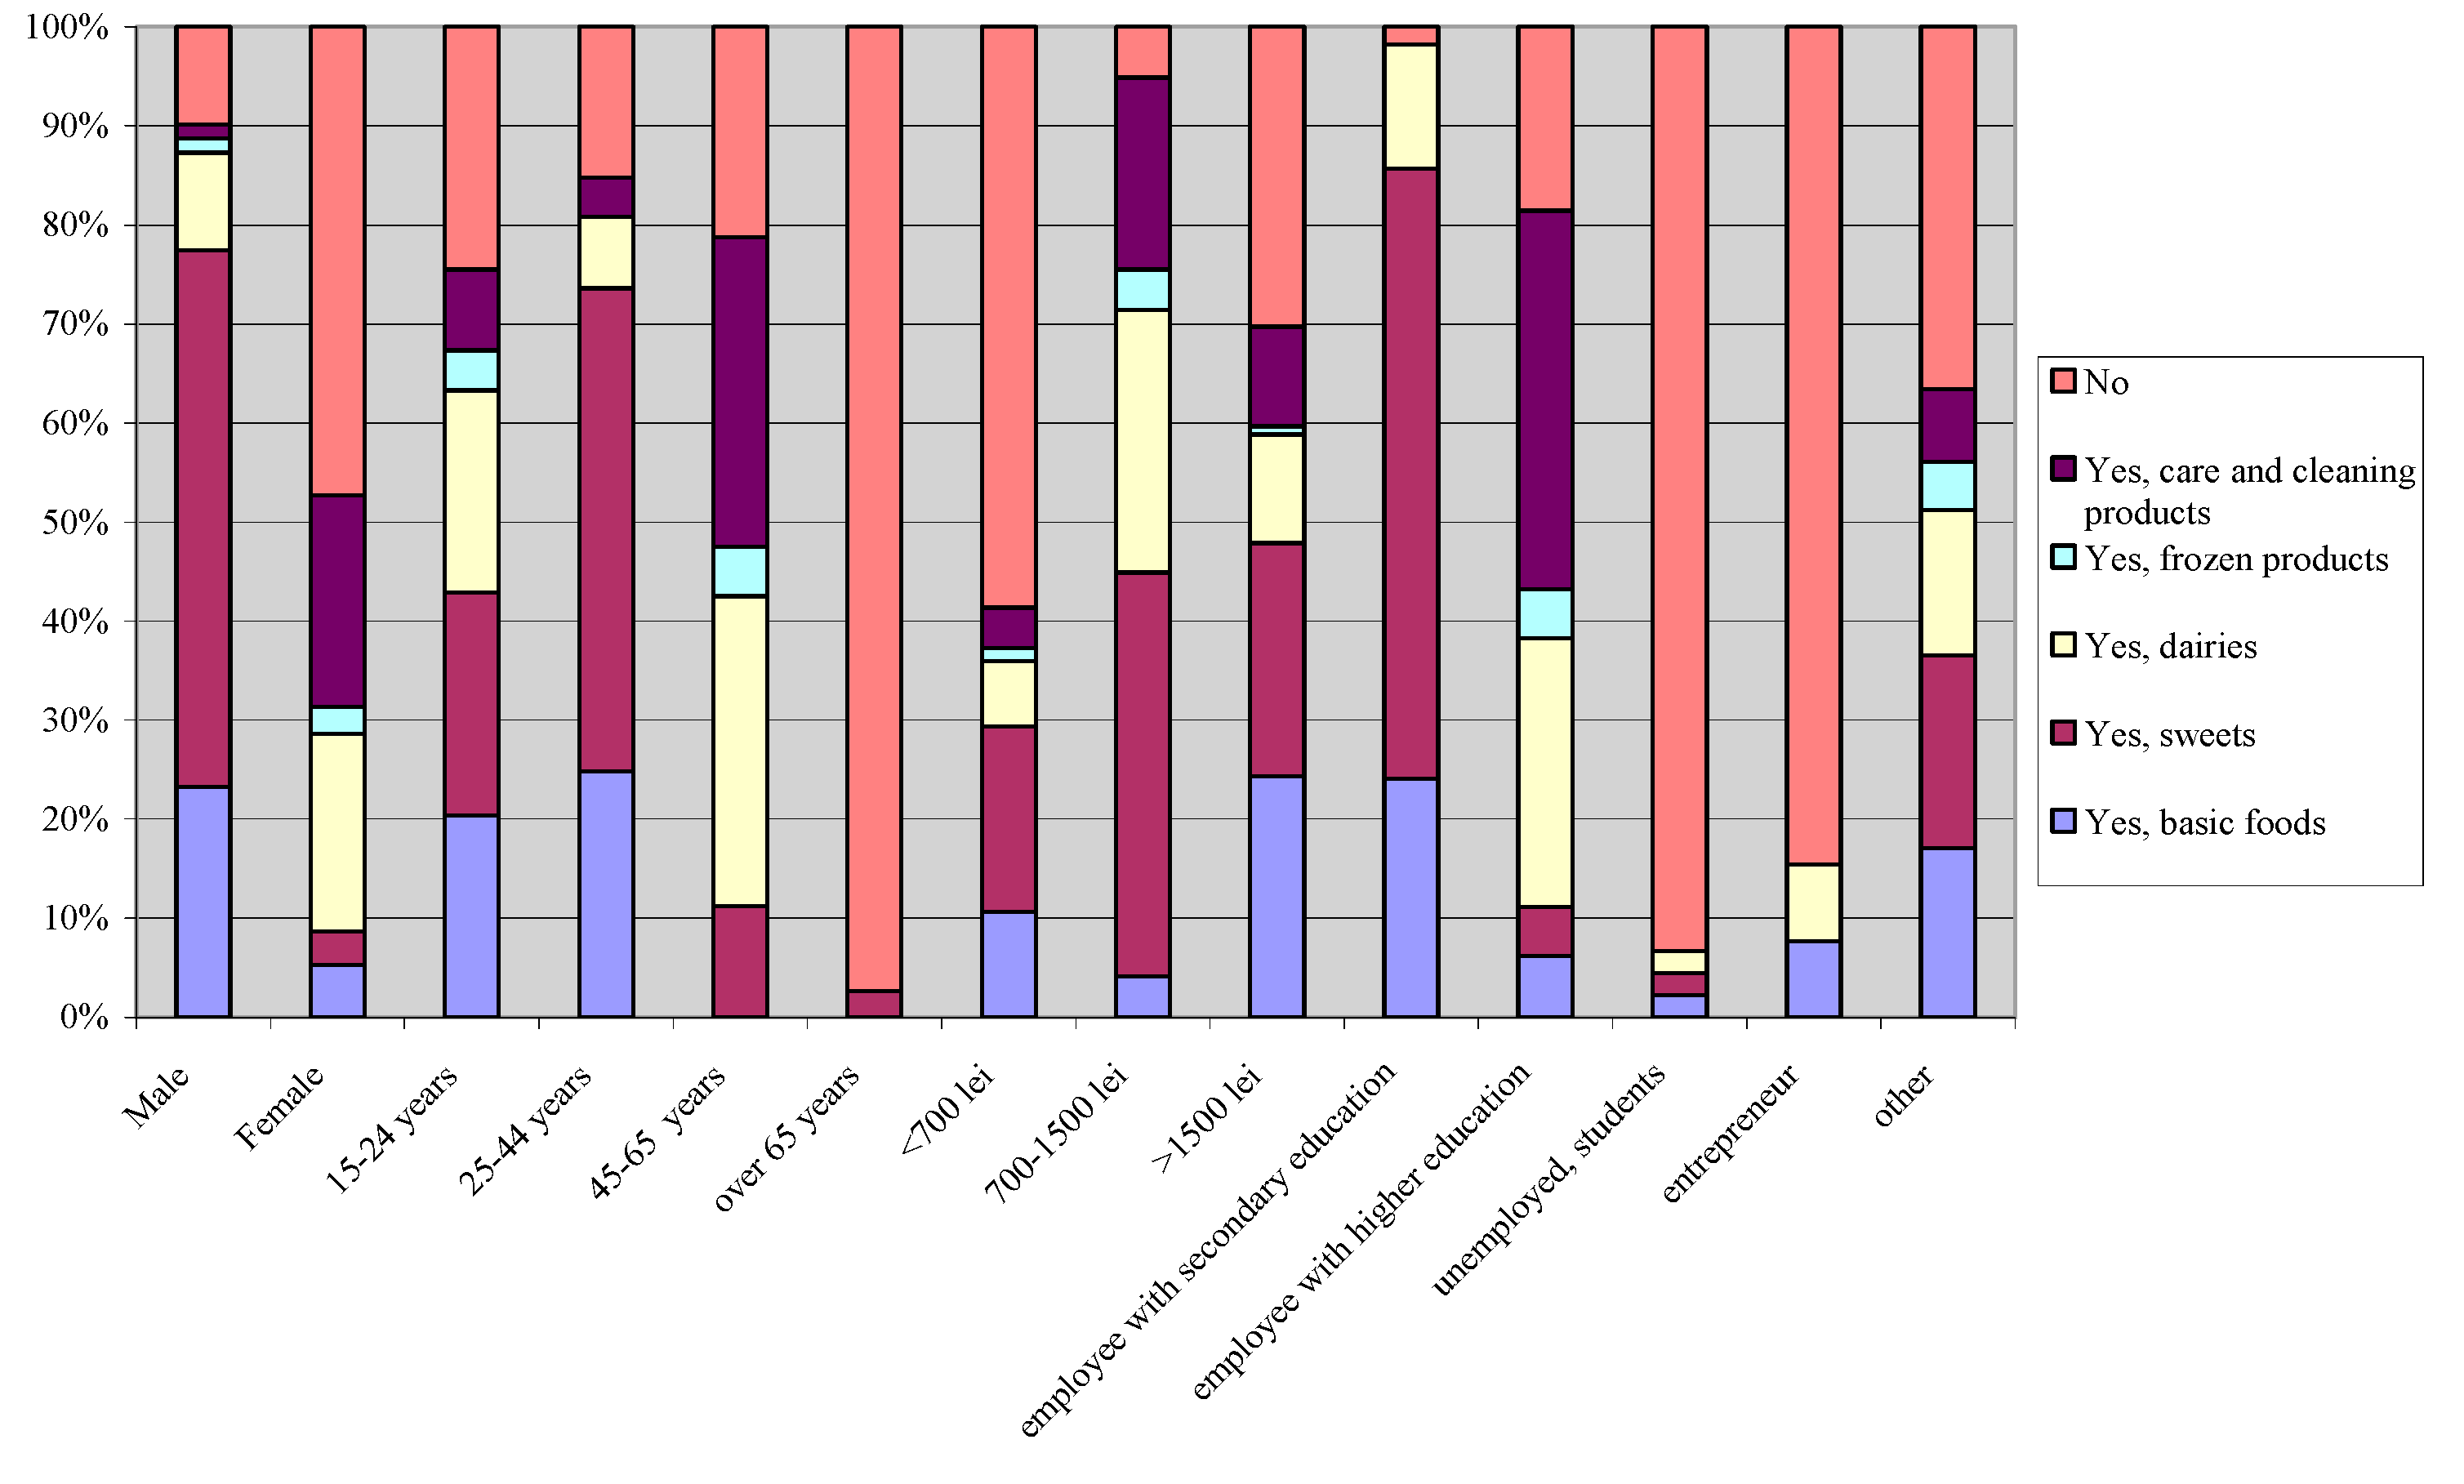
The following objective is to identify people’s willingness to pay more for private brands’ products with an improved level of quality and identification of these categories of products (Figure 7). Overall, 70% of people agree to pay more for an improved quality of private brands. The frequently chosen categories are: sweets, dairy products, and basic foods. Men would pay more for sweets, while women would not pay more. People aged between 25 and 44 years would pay more for sweets, and people aged between 45 and 64 years old would pay more for home care and cleaning products. People with low income would not pay more for private brands and people with middle-level income would pay more for sweets. Employees with secondary education would pay more for sweets, and employees with higher education would pay more for home care and cleaning products; unemployed people and entrepreneurs would not pay more for improved private brands.
Figure 7. Do you agree to pay more for a private brand with an improved quality? If yes, choose a category.
Sustainability 07 09293 g007
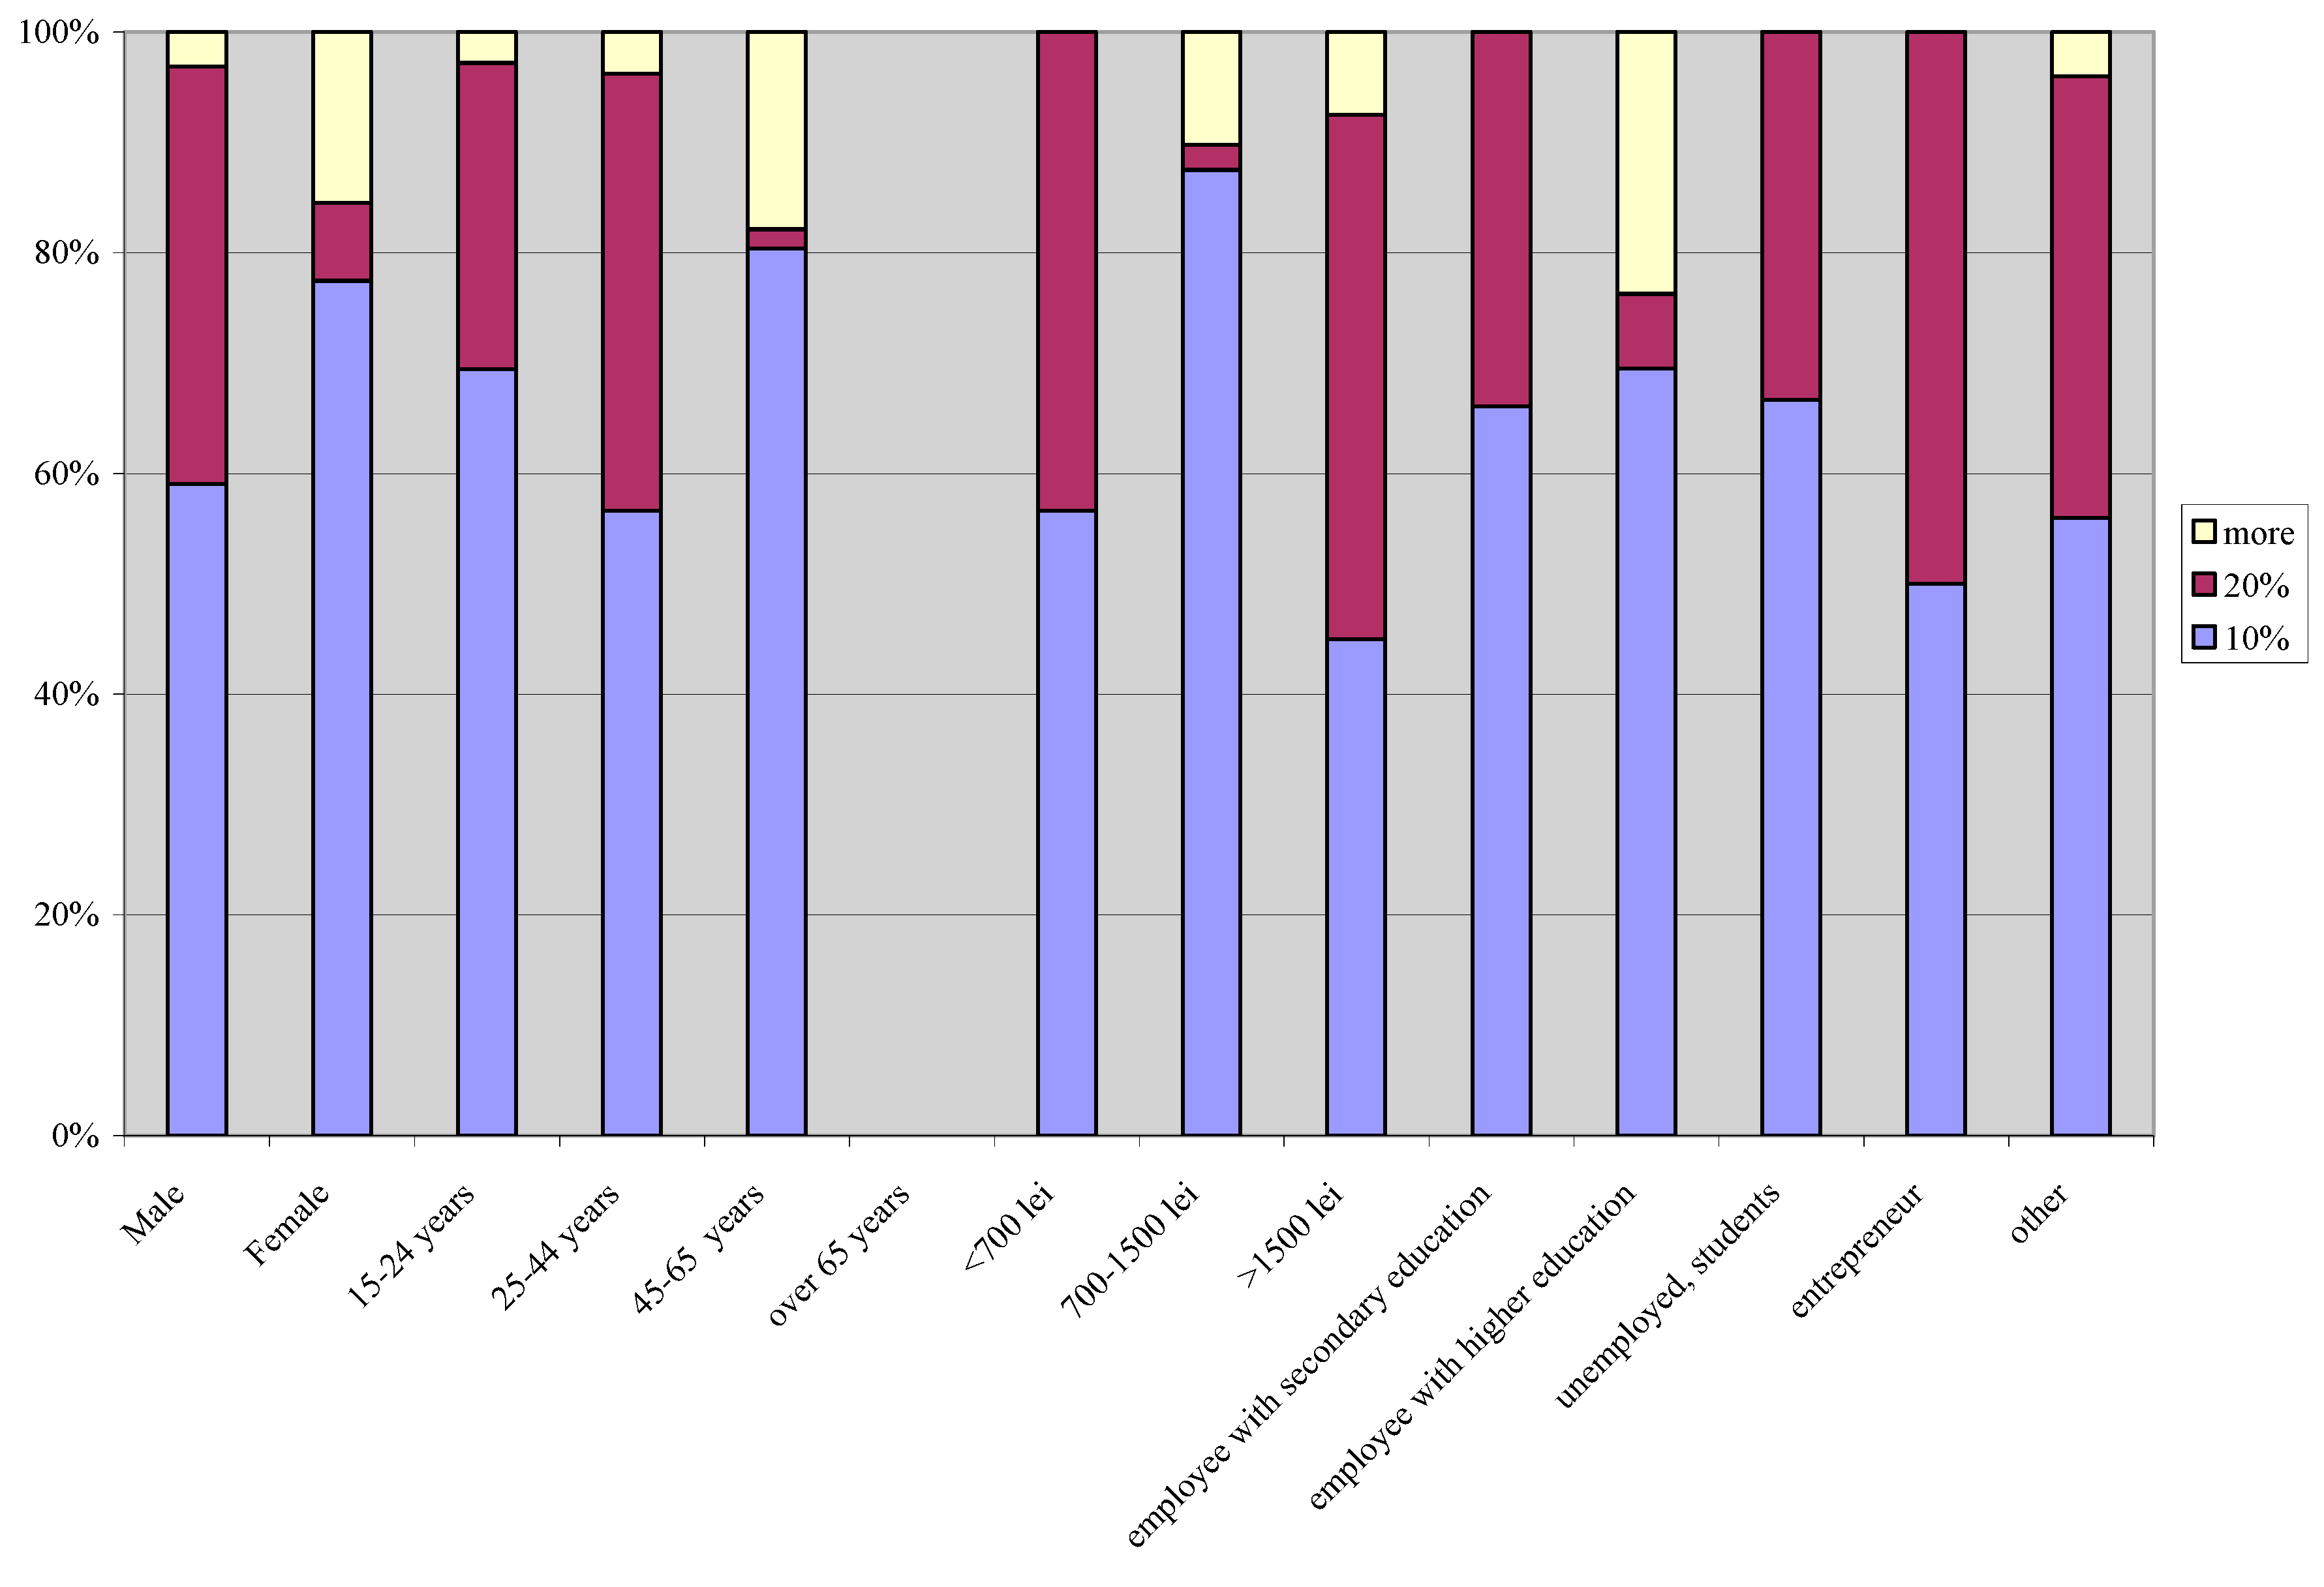
People who agreed to pay more for an improved quality of private brands express their willingness for different levels of prices: 10% higher, 20% higher, more than 20% (Figure 8). Most people, 65%, chose the first category. They are middle-aged women with a middle level of income, or employees with higher education. Men aged between 25 and 44 years with high income, and entrepreneurs would pay 20% more for private brands of improved quality.
This piece of research also investigates people expectations with regards to products’ quality compared to what they have experienced after buying the private brands’ products (Figure 9), asking whether people found a weaker product or not. Overall, the answers are equally distributed between yes and no (48.5% and 51.5%, respectively). People who experienced a weaker product are men aged between 25 and 44 years, with low income, and employees with secondary education and entrepreneurs. The most common criticism of private brand products is related to their taste: “yogurt tastes like powdered milk,” “pasta crumbles in water,” canned fish quality is perceived as low since “their contents are more liquid than solid,” etc. People who do not consider that private brand products are weaker than what they expected are women, aged between 45 and 64 years, with middle-level income, and employees with higher education.
Figure 8. How much more money would you pay for private brands?
Sustainability 07 09293 g008
Figure 9. Did you experience a weaker product than you expected when you bought private brands?
Sustainability 07 09293 g009
Finally, the research aims to rank the actions needed for increasing consumers’ trust in private brands (Table 5).
Table 5. Results of the question: Which actions do you consider the most important for increasing consumers’ trust in private brands, among the following variants?
ActionsVery importantImportantLess important
To mention the name of the producer closer to the retailer on the label14613010
To communicate certifications and independent tests on products’ labels16910012
Tasting private brands’ products in stores9614445
To be recommended by a specialist (e.g., Master Chef, TV star)62107110
To be promoted by producers via fairs and specific contests9813842
People consider that the most important action is to communicate certifications and independent tests on products’ labels, because this variant has the highest average mark of 2.56, on a scale from 1 to 3, where 1 is less important and 3 is very important. This is closely followed by a mention of the name of the producer closer to the retailer on the label, with an average mark of 2.48. Specialists’ recommendations and producers’ promotions via fairs and specific contests are important (2.18) and less important (1.83), respectively.

3.2. Discussion

The results of this piece of research validate some of the hypotheses. The assumptions made at the beginning of the survey are based on results of other researchers and marketing studies. In this section, we aim to identify whether the results of the survey validate the findings of other studies.
Based on other findings [23] and market information, we argued that about 70% of people have bought private brands in the last three months. The results from the survey showed that 76% of people have bought a private brand, which validates the premise.
We expected that the most popular private brands would be in the food category, specifically basic food. The results show that both basic food and dairy products are popular, because people chose the two of them equally (22.9% and 22.6%, respectively).
As other findings show [24,25] the most known private brand is K-classic. This hypothesis is not true, according to the results from the survey. Fifty-two percent of people recognized Pilos, 41% recognized Aro, and 33% chose K-classic. Pilos awareness is based not only on its low price and high quality, but on ready availability in supermarkets close to customers’ residences.
Based on the same studies [24,25], we argued that people prefer the brand K-classic. However, the results of our study show that people buy Pilos more often than other private brands.
In relation to the first hypothesis arguing that 70% of people bought private brands in the last three months, we claimed that 30% of people did not buy private brands and 50% of non-buyers have trust in producers’ famous brands. The results of the survey show that 24% of people did not buy private brands, close to what we expect, but the main reason is that they buy only products they are used to buying. Consumption pattern stability is more valuable than consumers’ fidelity to producers’ brands. This cautious pattern of purchase is based on customers’ resistance to change, which has implications on retailers’ marketing strategies.
We argued that lower price is the reason why people buy private brands, which is true: 44% of people chose this answer. Indeed, products with private brands are priced 15–20% lower than the same products from producer brands and this varies from a product category to other.
We assumed that 80% of people have the willingness to pay higher prices if the quality of private brands’ products increases. In fact, the results show that 71% would pay more for improved quality private brands, especially for sweets, corresponding to what we actually argued—that the products for which people would pay more are sweets and dairy products.
Estimating the price level for private brands’ products of improved quality, we claimed that 50% of people would pay a price 10% higher. The findings show that 65.7% of people would pay 10% more for improved quality.
The answers to the question “Did you experience a weaker product than you expected when you bought private brands?” are opposite to what we expected: 15% of people would have higher expectations with regards to products’ quality compared to what they have experienced. In fact, almost half of respondents have higher expectations from private brands and they experienced weaker products. This result has practical implications for retailers in their efforts to develop and sell private brands.
We considered that the most significant action needed to increase consumers’ trust in private brands is “communicating certification and independent tests on products’ labels.” The answers of the survey jump to the same results, because most respondents have considered this action as very important.
Research limitations. We supposed that people over 65 years old did not know what a private brand means, as shown by the 97% of people in this category who answered that they did not buy private brands in the last three months (Figure 1). This claim is also supported by the fact that people over 65 years old did not answer the question: What private brands have you bought in the last three months? This limit does not significantly change the results of our research.

4. Conclusions

The aim of the study was to achieve a better understanding of the main factors driving consumers’ purchase of private brands of food products. The research started primarily as an exploratory study, and served to identify the private brands in Romanian retail system, their market shares, and the appropriate categories to comprehend purchasing patterns in food retail. Almost 300 interviews were conducted with Romanian consumers. The interviews showed that the typical private brand user is a man aged between 45–65 years old, with middle-level income, and employees with secondary education.
The study also showed that age and occupation are the variables that significantly divide markets between private brand users and non-users, as seen in Figure 1. Furthermore, the market is segmented into different categories by age and gender. Thus, young people buy sweets and dairy products, people aged between 25 and 44 years buy basic foods and sweets, people aged between 45 and 65 years buy dairy products and home care and cleaning products, and people over 65 years old buy dairy products. Men purchase basic foods and sweets while women purchase dairy products and home care and cleaning products.
The main reason why people buy private brands is their lower price compared to producers’ brands (44% of people chose this answer). Low price is significant for young men with low income, the unemployed, or entrepreneurs. The reason why people do not buy private brands is high fidelity to products and relatively stable purchasing patterns. The most common criticism of private brands’ products is related to their taste.
Private brands will continue their rise in retail and, in the future, the food industry will have to focus their efforts and resources to adapt to this new trend. Evolution of the price categories will be shaped according to consumers’ requirements. Retailers will make continuous improvement of quality for products under their own brand as one of the essential conditions for sales performance. The most important action is to communicate certifications and independent tests on products’ labels, as shown by the findings of the research.
For producers, private brands will act as opportunities for increasing the current production capacity of national brands, reduced since 2009, as a result of the recession. Cooperation between producers and retailers, known in practice as trade marketing, thus gains a new dimension. This goes beyond the classical negotiations of placement, promotions, and prices towards the fourth pillar of marketing: product. Producers will become suppliers of products that will be sold under retailers’ brands. This new approach builds sustainable relationships between producers and retailers and moves the retail trade to a higher stage and human consumption towards more sustainable levels.
In conclusion, private brand development is a reality that cannot be ignored and will continue to produce changes on retailers’ shelves. From simple “me too” products, private brands will become freestanding ones. They link retailers to customers, building sustainable relationships between them based on trust, fidelity, and steadiness. Domestic producers will have to accept the transformation and adapt by providing private products for retailers, otherwise they would experience the consequences of a commercial war.

Acknowledgments

This paper presents the results of the research “The policy of private brands in food retail.”

Author Contributions

Dan Boboc designed the research and its reasoning and drew conclusions; Adrian Laurentiu Ariciu collected and analyzed data and performed the paper editing; Raluca Andreea Ion performed the literature review and analyzed and discussed data. All authors read and approved the final manuscript.

Conflicts of Interest

The authors declare no conflict of interest.

References

  1. Andrei, D.R.; Gogonea, R.M.; Zaharia, M.; Andrei, J.V. Is Romanian Rural Tourism Sustainable? Revealing Particularities. Sustainability 2014, 6, 8876–8888. [Google Scholar]
  2. Anderson, S.P.; de Palma, A.; Thisse, J.F. Discrete Choice Theory of product Differentiation; MIT Press: Cambridge, UK, 1992. [Google Scholar]
  3. Bontems, P.; Dilhan, M.; Requillart, V. Strategic Effects of Private Labels. European Rev. Ag. Econ. 1999, 26, 147–165. [Google Scholar] [CrossRef]
  4. Ward, M.; Shimshack, J.; Perloff, J.; Harris, M. Effects of the Private-Label Invasion in Food Industries. Available online: http://are.berkeley.edu/~jperloff/PDF/privlab.pdf (accessed on 3 March 2015).
  5. Ion, R.A.; Popescu, G.C. Food Security: Changes and Trends on World Agricultural Markets. In Proceedings of Competitiveness of Agro-food and Environmental Economy, Bucharest, Romania, 7–8 November 2013; ASE: Bucharest, Romania, 2013. [Google Scholar]
  6. Sales of Private Label Products on Upward Trend to Nearly 12% of Market in 2013. Available online: http://www.newsromania.com/business/gfk-sales-of-private-label-products-on-upward-trend-to-nearly-12-of-market-in-2013-2 (accessed on 1 April 2015).
  7. Craciun, E. Sales of Private Label Products Make Up 14% Of Romania’s Retail Market. Available online: http://www.zfenglish.com/companies/retail-consumer/gfk-sales-of-private-label-products-make-up-14-of-romania-s-retail-market-13495522 (accessed on 1 April 2015).
  8. Beckett, J. Grocers Revamp Brands: Food Chains Improve Look of Private Labels; San Francisco Chronicle: San Francisco, CA, USA, 1992. [Google Scholar]
  9. Jonquieres, G.; Tait, N. A Trolley Full of Troubles. Financial Times, 6 May 1993; 17. [Google Scholar]
  10. Batra, R.; Sinha, I. Consumer-level factors moderating the success of private label brands. J. Retail. 2000, 76, 175–191. [Google Scholar] [CrossRef]
  11. Bettman, J. Relationship of information-processing attitude structures to private brand purchasing behavior. J. Appl. Psychol. 1974, 59, 79–83. [Google Scholar] [CrossRef]
  12. Fei, L.; Dan, C. A Summary of Research on Retailers’ Private Brand Theory in the West. Available online: http://en.cnki.com.cn/Article_en/CJFDTotal-BJSB200601001.htm (accessed on 1 April 2015).
  13. Istudor, N.; Ion, R.A.; Turek, A. Consumers’ Perceptions about Ethics in Agro-Food Products’ Marketing. Amfiteatru Econ. 2008, 23, 92–97. [Google Scholar]
  14. Istudor, N.; Ion, R.A.; Petrescu, I.E. Research on consumers’ self-protection through a healthy diet. Amfiteatru Econ. 2010, 28, 436–443. [Google Scholar]
  15. Kwon, K.N.; Lee, M.H.; Kwon, Y.J. The effect of perceived product characteristics on private brand purchases. J. Consum. Market. 2008, 25, 105–114. [Google Scholar] [CrossRef]
  16. Garretson, J.; Fisher, D.; Burton, S. Antecedents of private label attitude and national brand promotion attitude: similarities and differences. J. Retail. 2002, 78, 91–99. [Google Scholar] [CrossRef]
  17. Choi, C.; Coughlan, A. Private label positioning: Quality versus feature differentiation from the national brand. J. Retail. 2006, 82, 79–93. [Google Scholar] [CrossRef]
  18. Dobre, I. Research on the performance of farms’ management in French agriculture. Quality-Access to Success 2013, 14, 338–343. [Google Scholar]
  19. Manole, V.; Stoian, M.; Ion, R.A. Marketing; ASE: Bucharest, Romania, 2011. [Google Scholar]
  20. Manole, V.; Stoian, M.; Ion, R.A. Agromarketing; ASE: Bucharest, Romania, 2003. [Google Scholar]
  21. Statistical Yearbook of Romania; National Institute of Statistic: Bucharest, Romania, 2012; p. 154. Available online: http://www.insse.ro/cms/ro/content/anuarul-statistic-2012 (accessed on 8 April 2015).
  22. Statistical Yearbook of Romania; National Institute of Statistic: Bucharest, Romania, 2013; p. 154. Available online: http://www.insse.ro/cms/ro/content/anuarul-statistic-2013 (accessed on 8 April 2015).
  23. The Nielsen Company. The state of private label around the world. Available online: http://www.nielsen.com/content/dam/nielsenglobal/kr/docs/global-report/2014/Nielsen%20Global%20Private%20Label%20Report%20November%202014.pdf (accessed on 15 April 2015).
  24. Berger, R. Winning the private label end-game, Private Label Congress 2014. Available online: http://www.distrifood.nl/PageFiles/45520/Private%20labels%20vanuit%20strategisch%20perspectief%20-%20Alexander%20Belderok.pdf (accessed on 25 March 2015).
  25. Shopper Trends 2012/2013 Romania. Available online: http://www.wall-street.ro/files/147257-430.pdf (accessed on 15 April 2015).

