
Spatio-Temporal Features of China’s Urban Fires: An Investigation with Reference to Gross Domestic Product and Humidity


Abstract
:1. Introduction
2. Study Area and Data
3. Methods
3.1. Spatial Autocorrelation Model(Moran’s I Model)
3.2. Selecting Incident-Inducing Factors of Fire Accidents


| Lags | Null Hypotheses | F Stat. | Prob. | Conclusions |
|---|---|---|---|---|
| 1 | H is not the Granger cause of F | 9.42 | 0.01 | rejected |
| T is not the Granger cause of F | 0.73 | 0.41 | accepted | |
| G is not the Granger cause of F | 9.45 | 0.00 | rejected | |
| 2 | H is not the Granger cause of F | 2.39 | 0.16 | accepted |
| T is not the Granger cause of F | 0.73 | 0.52 | accepted | |
| G is not the Granger cause of F | 2.57 | 0.15 | accepted |
3.3. Fire-GDP-Humidity Model (FGHM)
3.4. Co-Integration Test of Each Index in FGHM
3.5. The Fire-Space Dynamic Model

4. Result Analysis
4.1. The Spatio-Temporal Features of China Fires
| 2001 | 2002 | 2003 | 2004 | 2005 | 2006 | 2007 | 2008 | 2009 | |
|---|---|---|---|---|---|---|---|---|---|
| Moran’I | −0.02 | 0 | 0.07 | 0.03 | 0 | −0.01 | −0.02 | −0.01 | −0.04 |
| Z | −1.44 | 0.17 | 4.99 ** | 2.32 * | 0.47 | −0.58 | −0.97 | −0.2 | −2.38 * |
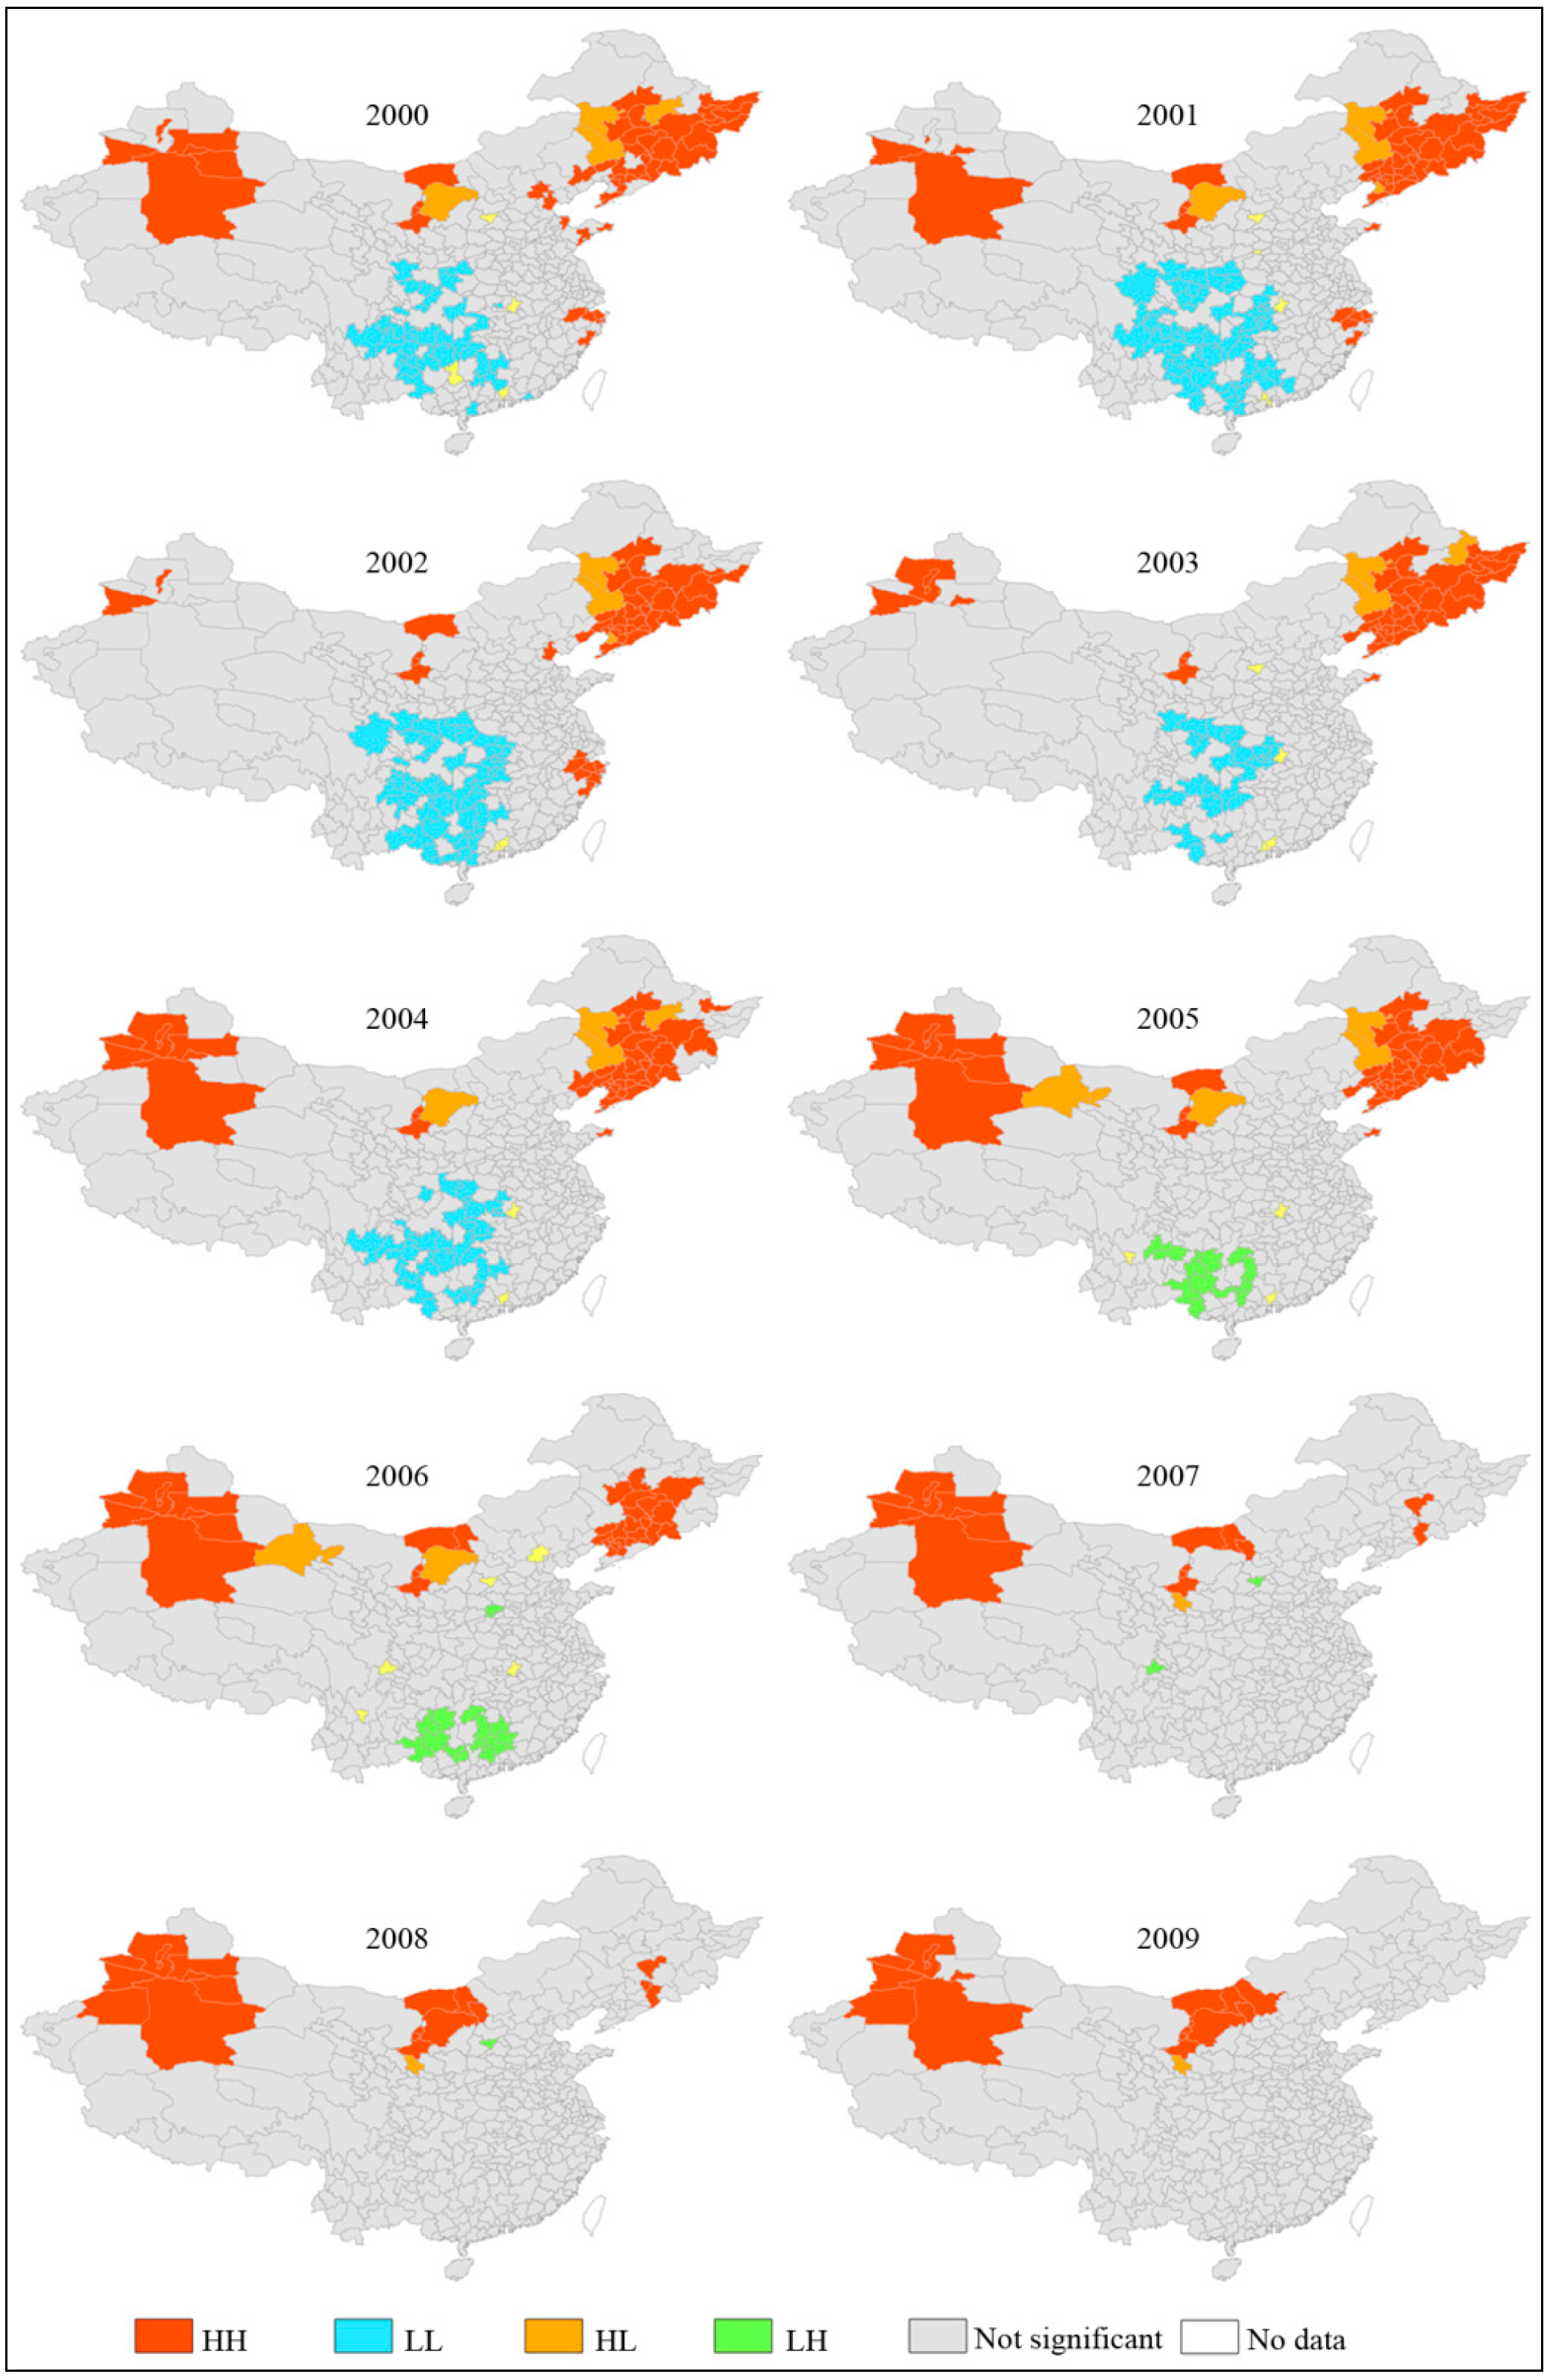
| Year | HH | HL | LH | LL |
|---|---|---|---|---|
| 2000 | 47 | 6 | 4 | 33 |
| 2001 | 43 | 5 | 4 | 52 |
| 2002 | 43 | 3 | 3 | 49 |
| 2003 | 40 | 7 | 3 | 24 |
| 2004 | 40 | 4 | 4 | 32 |
| 2005 | 41 | 7 | 4 | 13 |
| 2006 | 35 | 8 | 2 | 15 |
| 2007 | 18 | 5 | 1 | 0 |
| 2008 | 21 | 3 | 1 | 0 |
| 2009 | 17 | 2 | 1 | 0 |

4.2. The Influence of GDP and Humidity


4.3. The Spatio-Temporal Regulation of China’s Urban Fires
5. Conclusions and Discussion
Acknowledgments
Author Contributions
Conflicts of Interest
References
- Turco, M.; Llasat, M.C.; von Hardenberg, J.; Provenzale, A. Impact of climate variability on summer fires in a Mediterranean environment (northeastern Iberian Peninsula). Clim. Change 2013, 116, 665–678. [Google Scholar] [CrossRef]
- Moritz, M.A.; Morais, M.E.; Summerell, L.A.; Carlson, J.M.; Doyle, J. Wildfires, complexity, and highly optimized tolerance. Proc. Natl. Acad. Sci. USA 2005, 102, 17912–17917. [Google Scholar] [CrossRef] [PubMed]
- Wang, X.L.; Thompson, D.K.; Marshall, G.A.; Tymstra, C.; Carr, R.; Flannigan, M.D. Increasing frequency of extreme fire weather in Canada with climate change. Clim. Change 2015, 130, 573–586. [Google Scholar] [CrossRef]
- Bonan, G.B. Forests and climate change: Forcings, feedbacks, and the climate benefits of forests. Science 2008, 320, 1444–1449. [Google Scholar] [CrossRef] [PubMed]
- Pyne, S.; Andrews, P.; Laven, R. Introduction to Wildland Fire; Wiley: New York, NY, USA, 1996. [Google Scholar]
- Díaz, D.R.; Lloret, F.; Pons, X. Spatial patterns of fire occurrence in Catalonia. Landsc. Ecol. 2004, 19, 731–745. [Google Scholar]
- Marlon, J.R.; Bartlein, P.J.; Carcaillet, C.; Gavin, D.G.; Harrison, S.P.; Higuera, P.E.; Joos, F.; Power, M.J.; Prentice, I.C. Climate and human influences on global biomass burning over the past two millennia. Nat. Geosci. 2008, 1, 697–702. [Google Scholar] [CrossRef]
- Pausas, J.G.; Keeley, J.E. A burning story: The role of fire in the history of life. Bioscience 2009, 59, 593–601. [Google Scholar] [CrossRef] [Green Version]
- Oliveras, I.; Gracia, M.; Moré, G.; Retana, J. Factors influencing the pattern of fire severities in a large wildfire under extreme meteorological conditions in the Mediterranean basin. Int. J. Wildland Fire 2009, 18, 755–764. [Google Scholar] [CrossRef]
- Venevsky, S.; Thonicke, K.; Sitch, S.; Cramer, W. Simulating fire regimes in human-dominated ecosystems: Iberian Peninsula case study. Glob. Chang. Biol. 2002, 8, 984–998. [Google Scholar] [CrossRef]
- Bowman, D.M.J.S.; Balch, J.K.; Artaxo, P.; Bond, W.J.; Carlson, J.M.; Cochrane, M.A.; D’Antonio, C.M.; DeFries, R.S.; Doyle, J.C.; Harrison, S.P. Fire in the earth system. Science 2009, 324, 481–484. [Google Scholar] [CrossRef] [PubMed]
- Perez, V.G.; Marquez, L.M.A.; Cortes, O.A.; Salmeron, M.M. Spatial-temporal analysis of fire occurrence in Durango. Madera Y Bosques 2013, 19, 37–58. [Google Scholar]
- Falk, D.A.; Heyerdahl, E.K.; Brown, P.M.; Farris, C.; Fule, P.Z.; Mckenzie, D.; Swetnam, T.W.; Taylor, A.H.; van Horne, M.L. Multi-scale controls of historical forest-fire regimes: New insights from fire-scar networks. Front. Ecol. Environ. 2011, 9, 446–454. [Google Scholar] [CrossRef]
- Liu, Z.H.; Yang, J.; Chang, Y.; Weisberg, P.J.; He, H.S. Spatial patterns and drivers of fire occurrence and its future trend under climate change in a boreal forest of Northeast China. Global. Chang Bio. 2012, 18, 2041–2056. [Google Scholar] [CrossRef]
- Wang, Z.; Fang, C.; Zhang, X. Spatial expansion and potential zoning of construction land use in the Yangtze River Delta. J. Geogr. Sci. 2015, 25, 1–14. [Google Scholar] [CrossRef]
- Fang, C.; Wang, Z. Quantitative Diagnoses and Comprehensive Evaluations of the Rationality of Chinese Urban Development Patterns. Sustainability 2015, 7, 3859–3884. [Google Scholar] [CrossRef]
- Syphard, A.D.; Radeloff, V.C.; Keeley, J.E.; Hawbaker, T.J.; Clayton, M.K.; Stewart, S.I.; Hammer, R.B. Human influence on California fire regimes. Ecol. Appl. 2007, 17, 1388–1402. [Google Scholar] [CrossRef] [PubMed]
- Yang, J.; He, H.S.; Shifley, S.R. Spatial controls of occurrence and spread of wildfires in the Missouri Ozark highlands. Ecol. Appl. 2008, 18, 1212–1225. [Google Scholar] [CrossRef] [PubMed]
- Duncanson, M.; Woodward, A.; Reid, P. Socioeconomic deprivation and fatal unintentional domestic fire incidents in New Zealand. Fire Saf. J. 2002, 37, 165–179. [Google Scholar] [CrossRef]
- AFAC. Accidental Fire Fatalities in Residential Structures: Who’s at Risk? Technical Report; Australian Fire Authorities Council: Canberra, Australia, 2005. [Google Scholar]
- Smith, R.; Wright, M.; Solanki, A. Analysis of Fire and Rescue Service Performance and Outcomes with Reference to Population Socio-Demographics—Fire Research Series 9/2008; Department for Communities and Local Government: London, UK, 2008.
- Yang, L.Z.; Jiang, D.B. The relationship between fire and socioeconomic factors in China. Eng. Sci. 2003, 5, 62–67. [Google Scholar]
- Schwartz, N.B.; Uriarte, M.; Gutiérrez, V.V.H.; Baethgen, W.; DeFries, R.; Fernandes, K.; Pinedo, V.M.A. Climate, landowner residency, and land cover predict local scale fire activity in the Western Amazon. Global Environ. Change 2015, 31, 144–153. [Google Scholar] [CrossRef]
- Westerling, A.L.; Turner, M.G.; Smithwick, E.A.H.; Romme, W.H.; Ryan, M.G. Continued warming could transform Greater Yellowstone fire regimes by mid-21st century. Proc. Natl. Acad. Sci. USA 2011, 108, 13165–13170. [Google Scholar] [CrossRef] [PubMed]
- Scholze, M.W.; Knorr, N.W.; Arnell, N.W.; Prentice, I.C. A climate-change risk analysis for world ecosystems. Proc. Natl. Acad. Sci. USA 2006, 103, 13116–13120. [Google Scholar] [CrossRef] [PubMed]
- Chrysoulakis, N.; Cartalis, C. Thermal detection of plumes produced by industrial accidents in urban areas based on the presence of the heat island. Int. J. Rem. Sens. 2002, 23, 2909–2916. [Google Scholar] [CrossRef]
- Panao, M.J.N.O.; Goncalves, H.J.P.; Ferrao, P.M.C. Optimization of the urban building efficiency potential for midlatitude climates using a genetic algorithm approach. Renew. Energ. 2008, 33, 887–896. [Google Scholar] [CrossRef]
- Corcoran, J.; Higgs, G.; Rohde, D. Investigating the association between weather conditions, calendar events and socio-economic patterns with trends in fire incidence: An Australian case study. J. Geogr. Syst. 2011, 13, 193–226. [Google Scholar] [CrossRef]
- Gunther, P. Rural fire deaths: the role of climate and poverty. Fire J. 1982, 76, 34–39. [Google Scholar]
- Sufianto, H.; Green, A.R. Urban fire situation in Indonesia. Fire Tech. 2011, 2, 357–387. [Google Scholar] [CrossRef]
- Standardization Administration of the People’s Republic of China. Urban Fire-Danger Weather Ratings GB/T 20487-2006; China Standards Publishing House: Beijing, China, 2006. [Google Scholar]
- Langner, A.; Siegert, F. Spatiotemporal fire occurrence in Borneo over a period of 10 years. Glob. Change Biol. 2009, 15, 48–62. [Google Scholar] [CrossRef]
- Frejaville, T.; Curt, T. Spatiotemporal patterns of changes in fire regime and climate: Defining the pyroclimates of south-eastern France (Mediterranean Basin). Clim. Change 2015, 129, 239–251. [Google Scholar] [CrossRef]
- Zhang, J.Q.; Liu, X.P.; Tong, Z.J. The study of grassland fire disaster risk assessment and regionalization: A case study in the western Jilin Province. Geogr. Res. 2007, 26, 755–762. [Google Scholar]
- Yan, F.; Ang, Y.J.; Wu, B. Spatial and temporal distributions of drought in Hebei Province over the past 50 years. Geogr. Res. 2010, 29, 423–430. [Google Scholar]
- Jennings, C.R. Socioeconomic characteristics and their relationship to fire incidence: A review of the literature. Fire Tech. 1999, 35, 7–34. [Google Scholar] [CrossRef]
- Chang, H.S. Study of the exploration of fire occurrence spatial characteristics and impact factors: a case study of Tainan City. In Proceedings of 14th International Conference on Urban Planning and Regional Development in the Information Society, Spain, 22–25 April 2009; Design Center Sitges: Sitges, Spain, 2009. [Google Scholar]
- Tobler, W.A. A computer movie simulating urban growth in the Detroit region. Econ. Geogr. 1970, 46, 234–240. [Google Scholar] [CrossRef]
- Houthakker, H.S. The Pareto Distribution and the Cobb–Douglas Production Function in Activity Analysis. Rev. Econ. Stud. 1955, 23, 27–31. [Google Scholar] [CrossRef]
- Gao, T.M. Econometric Methods and Modeling; Tsinghua Publishing House: Beijing, China, 2009. [Google Scholar]
- Zhang, Z.-Y.; Zhu, P.F. Improvement on asymptotic efficiency of QMLE for SDPD model. J. Quant. Tech. Econ. 2009, 5, 145–157. [Google Scholar]
- Anselin, L.; Griffith, D.A. Do spatial effects really matter in regression analysis? Pap. Reg. Sci. Assoc. 1988, 65, 11–34. [Google Scholar] [CrossRef]
- Legendre, P. Spatial autocorrelation: trouble or new paradigm? Ecology 1993, 74, 1659–1673. [Google Scholar] [CrossRef]
- Osborne, P.E.; Foody, G.M.; Suarez-Seoane, S. Non-stationarity and local approaches to modelling the distributions of wildlife. Divers. Distrib. 2007, 13, 313–323. [Google Scholar] [CrossRef]
- Liang, W.; Ren, B.P. Judgment of China’s Economic Development Stages and the Analysis of the Characters at the Current Economic Development Stage. J. Quant. Tech. Econ. 2009, 4, 3–18. [Google Scholar]
- Ding, Y.H.; Ren, G.Y.; Shi, G.Y. National assessment report of climate change (I): Climate change in China and its future trend. Adv. Clim. Change Res. 2006, 2, 3–8. [Google Scholar]
- Xu, Y.L.; Huang, X.Y.; Zhang, Y. Statistical analyses of climate change scenarios over China in the 21st Century. Adv. Clim. Change Res. 2005, 1, 80–83. [Google Scholar]
- Xu, B.; He, N.; Gong, P.; Li, Y. Spatiotemporal evolution characteristics of fire disasters in China: GIS-based statistic analysis. J. Nat. Disasters 2012, 21, 198–203. [Google Scholar]
- Openshaw, S. The Modifiable Areal Unit Problem; Geo Books: Norwick, UK, 1983. [Google Scholar]
© 2015 by the authors; licensee MDPI, Basel, Switzerland. This article is an open access article distributed under the terms and conditions of the Creative Commons Attribution license (http://creativecommons.org/licenses/by/4.0/).
Share and Cite
Wang, Z.; Zhang, X.; Xu, B. Spatio-Temporal Features of China’s Urban Fires: An Investigation with Reference to Gross Domestic Product and Humidity. Sustainability 2015, 7, 9734-9752. https://0-doi-org.brum.beds.ac.uk/10.3390/su7079734
Wang Z, Zhang X, Xu B. Spatio-Temporal Features of China’s Urban Fires: An Investigation with Reference to Gross Domestic Product and Humidity. Sustainability. 2015; 7(7):9734-9752. https://0-doi-org.brum.beds.ac.uk/10.3390/su7079734
Chicago/Turabian StyleWang, Zhenbo, Xiaorui Zhang, and Bo Xu. 2015. "Spatio-Temporal Features of China’s Urban Fires: An Investigation with Reference to Gross Domestic Product and Humidity" Sustainability 7, no. 7: 9734-9752. https://0-doi-org.brum.beds.ac.uk/10.3390/su7079734