Article

Application of Environmental Change Efficiency to the Sustainability of Urban Development at the Neighborhood Level

1
Department of Tourism, Leisure and Hospitality Management, National Chi Nan University, Nantou, No.1, University Rd., Puli., Nantou 54561, Taiwan
2
Department of Urban Planning, National Cheng Kung University, No.1, University Rd., East Dist., Tainan City 70101, Taiwan
*
Author to whom correspondence should be addressed.
Sustainability 2015, 7(8), 10479-10498; https://0-doi-org.brum.beds.ac.uk/10.3390/su70810479
Submission received: 6 June 2015 / Revised: 30 July 2015 / Accepted: 31 July 2015 / Published: 5 August 2015
(This article belongs to the Special Issue Planning, Development and Management of Sustainable Cities)

Abstract

:
This study describes a new assessment model framework, termed the driving forces-pressure-state-impact-policy and pattern (DPSIP) model, for environmental change efficiency in urban land development, based on urban sustainable development and the theory of economic efficiency evaluation. A spatial and measurable efficiency value is defined for environmental changes in urban land development, which provides a comprehensive evaluation index for the efficiency of urban development and its environmental impact. This type of urban interior sustainability is considered new within the context of global environmental changes. We identify nine important indicators to evaluate the relative efficiency of 233 neighborhoods in Tainan, Taiwan. The results indicate that the average environmental change efficiency is 89.44%, which shows clear spatial differentiation. The key indicators affecting the efficiency score are area, population density, location, mixed land uses, the floor area ratio, and the impervious ratio. In the future, urban design can reduce environmental impacts and enhance efficiency values.

1. Introduction

Due to urbanization, the size of urban areas and urban populations have been increasing rapidly and continuously worldwide. According to the 2014 Revision of World Urbanization Prospects [1], the urban population is projected to increase by 2.46 billion, an increase from 3.88 billion (54%) in 2014 to 6.34 billion (66%) in 2050. This projected increase in the urban population will create various demands, and the resources necessary for daily life and production in cities are believed to be an important driving force that will contribute to changes in urban land use [2,3,4]. Additional agricultural and rural lands will be converted for urban development, resulting in an expanded urban landscape [5,6,7].
For many cities, changes in land use are required to meet the daily needs of residents and the demands of economic development. The natural environment may suffer the most direct and serious consequences of urbanization due to various interacting factors, such as the economy, society, and culture [8,9,10]. Although changes in land use will affect the environment, they will also provide income, employment, and other economic benefits to cities [11].
Based on the limited availability of land and natural resources and the irreversibility of the impacts on the natural environment, Whitford et al. (2001) and De Koeijer et al. (2003) [12,13] have argued that environmental impacts, or the excessive use of resources, can be reduced; the impact of global environmental change can be mitigated; and the efficiency of urban development can be improved by considering changes in urban land use from the perspective of sustainable development. Assessing the efficiency of economic and social development and their impact on the natural environment is an important issue for researchers and urban planners. Urban development efficiency has traditionally been considered an issue of economic efficiency based on economic theory [14]. Since the emergence of sustainable development, urban development efficiency has become more environmentally oriented. In 1990, Schaltegger and Sturm (1990) [15] introduced the concept of eco-efficiency, which represents the ratio of the increased value of development to the increased environmental impact. In 1992, the World Business Council for Sustainable Development (WBCSD) further defined this concept as the ratio of economic value to its associated impact on environmental indicators. Eco-efficiency emphasizes the integration of economic benefits and environmental impacts, and it thus attempts to effectively combine several components: business units on a micro-scale or individual level; urban or regional development planning and management on a larger spatial scale; and the macro-scale objective of sustainable development [16,17,18,19,20].
Although scholars have increasingly used eco-efficiency to assess the relationship between the economy and the environment, most studies focus on the observations of manufacturers [21,22,23] or the industrial sector at the regional or national level [16,18,19,24,25]. Little effort has been devoted to explicitly exploring and defining the eco-efficiency of urban land development. Therefore, the current knowledge of how to integrate and estimate the impacts of urban land development on the natural environment remains limited. A focus on the eco-efficiency of urban land development would lead to further assessments of the corresponding development efficiency of each spatial unit in cities under the threat of urbanization or urban sprawl. To address the research gap in relation to the environmental impacts of urban land use change, we proposed a new systematic model framework, termed the driving forces-pressure-state-impact-policy and pattern (DPSIP) model, to analyze and structure the relationship between environmental impacts and developmental effectiveness in the process of urban land development.
Additionally, we defined a measurable and detectable environmental change efficiency index based on urban sustainable development and the theory of efficiency evaluation. This efficiency index was used to analyze the influential factors of efficiency scores and to plan the strategies for efficiency improvement with the DPSIP model. Environmental change efficiency was defined as the proportional relationship between the input costs of environmental resources and the social and economic benefits of urban development within the context of global environmental changes.
We considered the following factors to validate the applicability of the method proposed here and to select the area for our empirical research: (a) urban development and its environmental impacts on the environment; (b) the diversification of land use patterns; and (c) the relationship between urban development strategies and improvements in efficiency. Based on these factors, Tainan City was selected as the area for this study. Finally, we employed data envelopment analysis (DEA) and geographically weighted regression (GWR) to design spatial development strategies to increase efficiency by comparing efficiency distributions and urban development patterns.

2. Materials and Methods

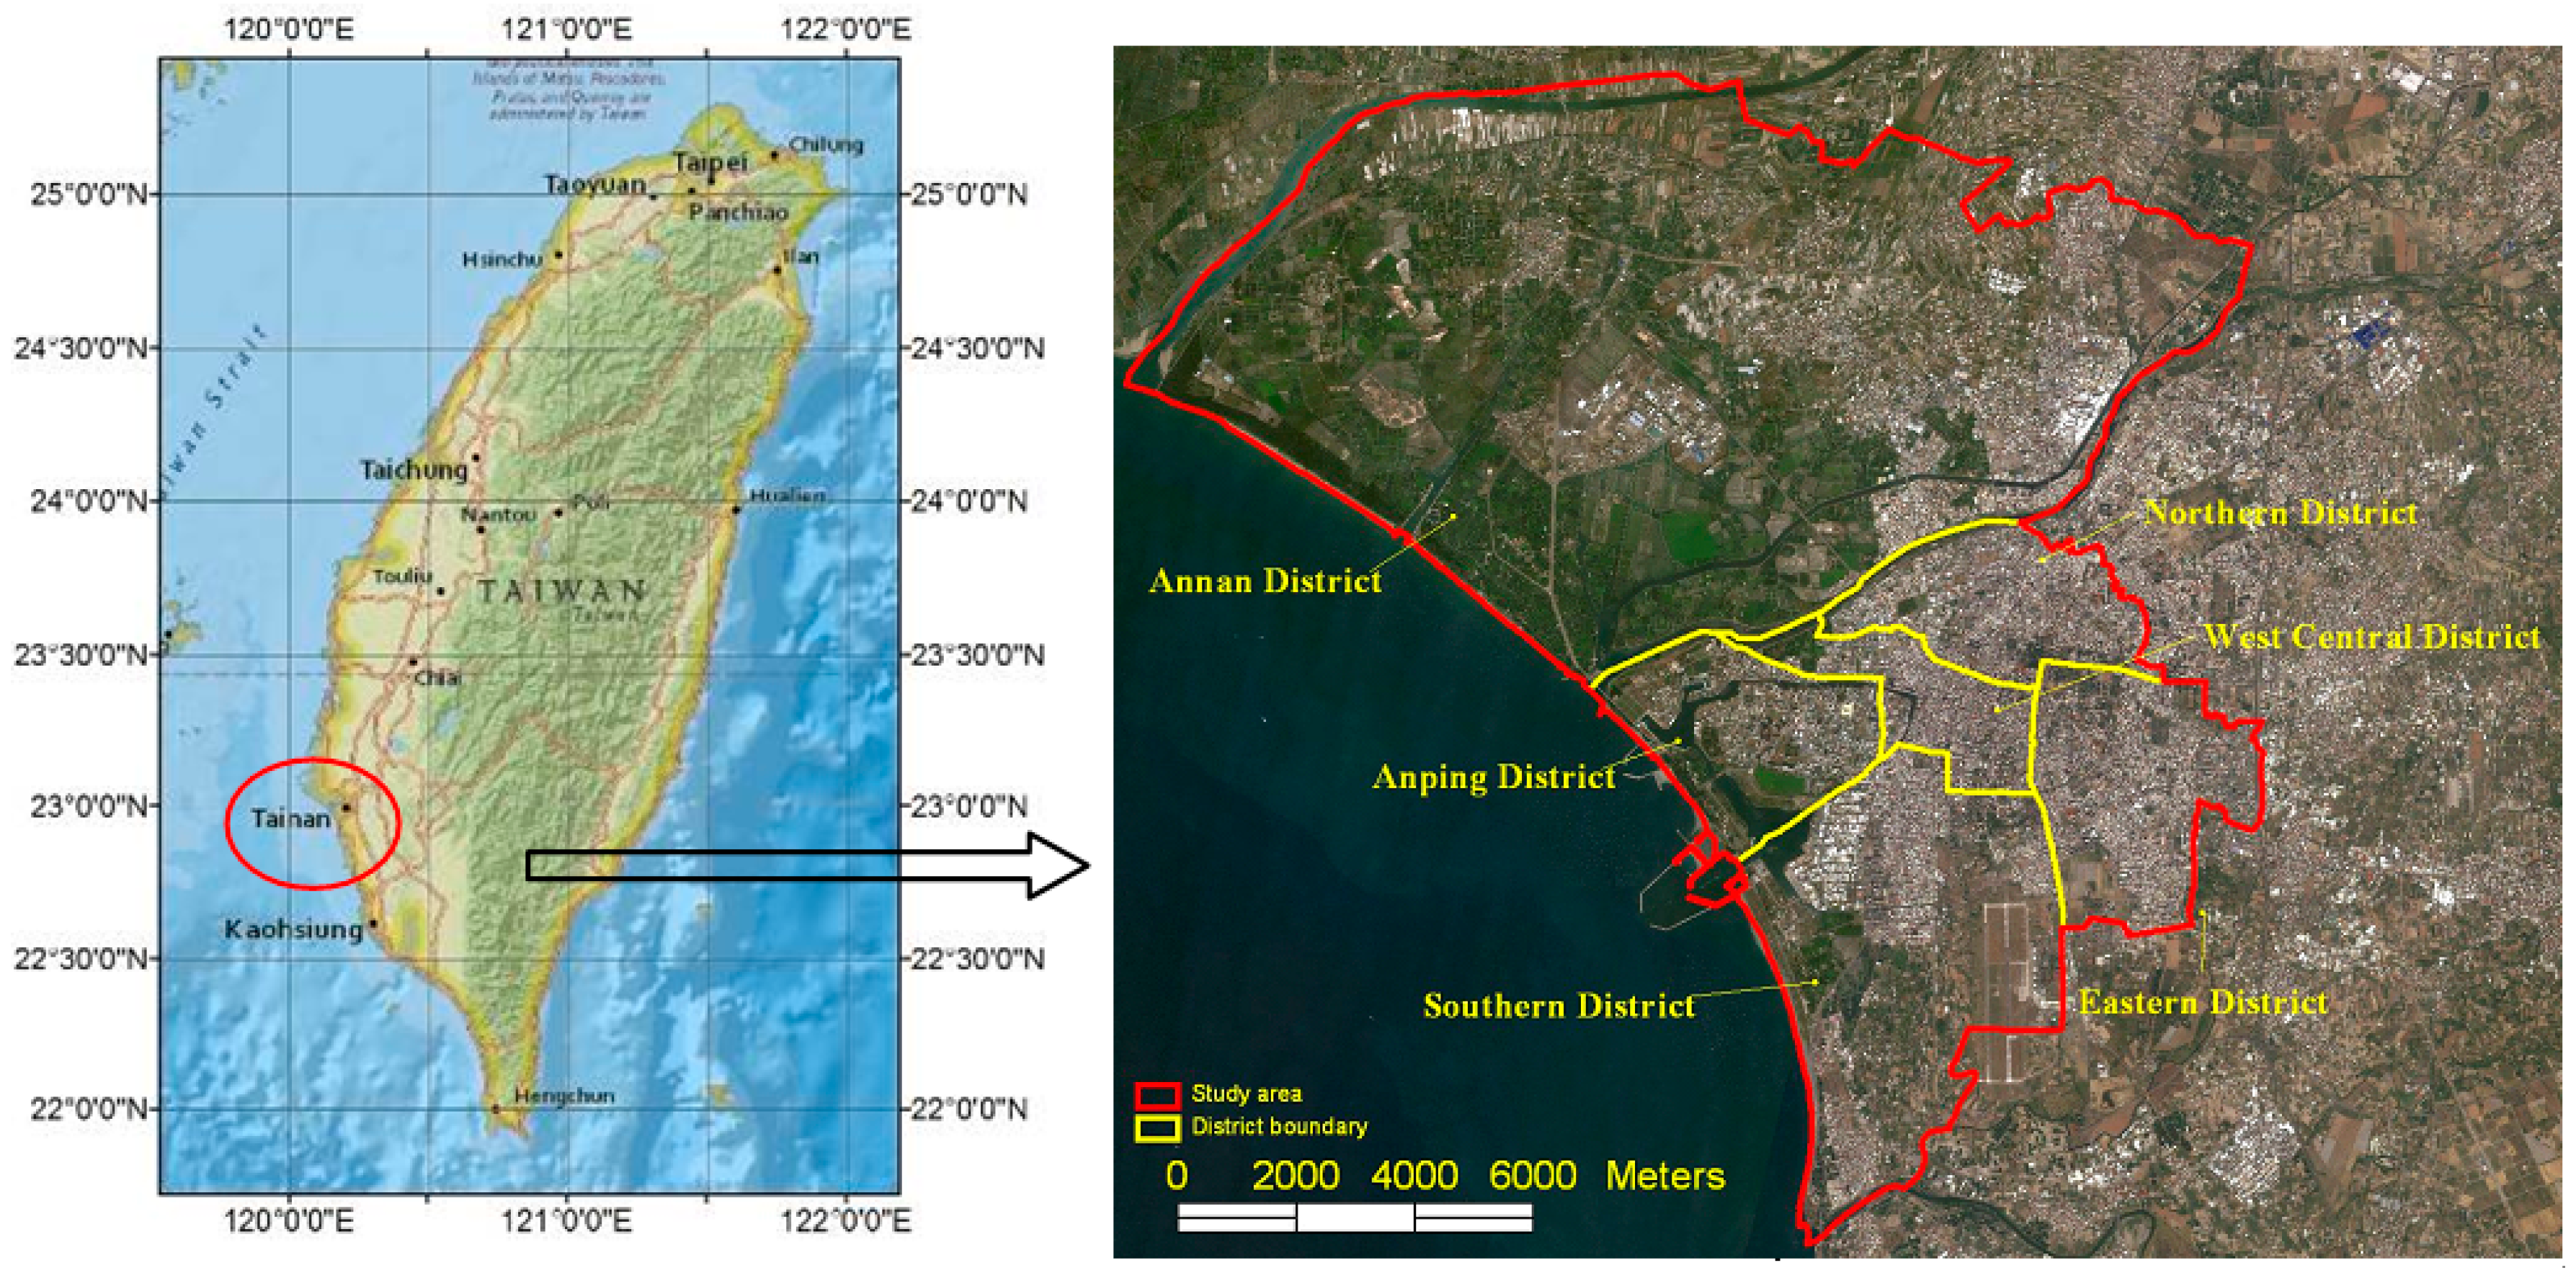
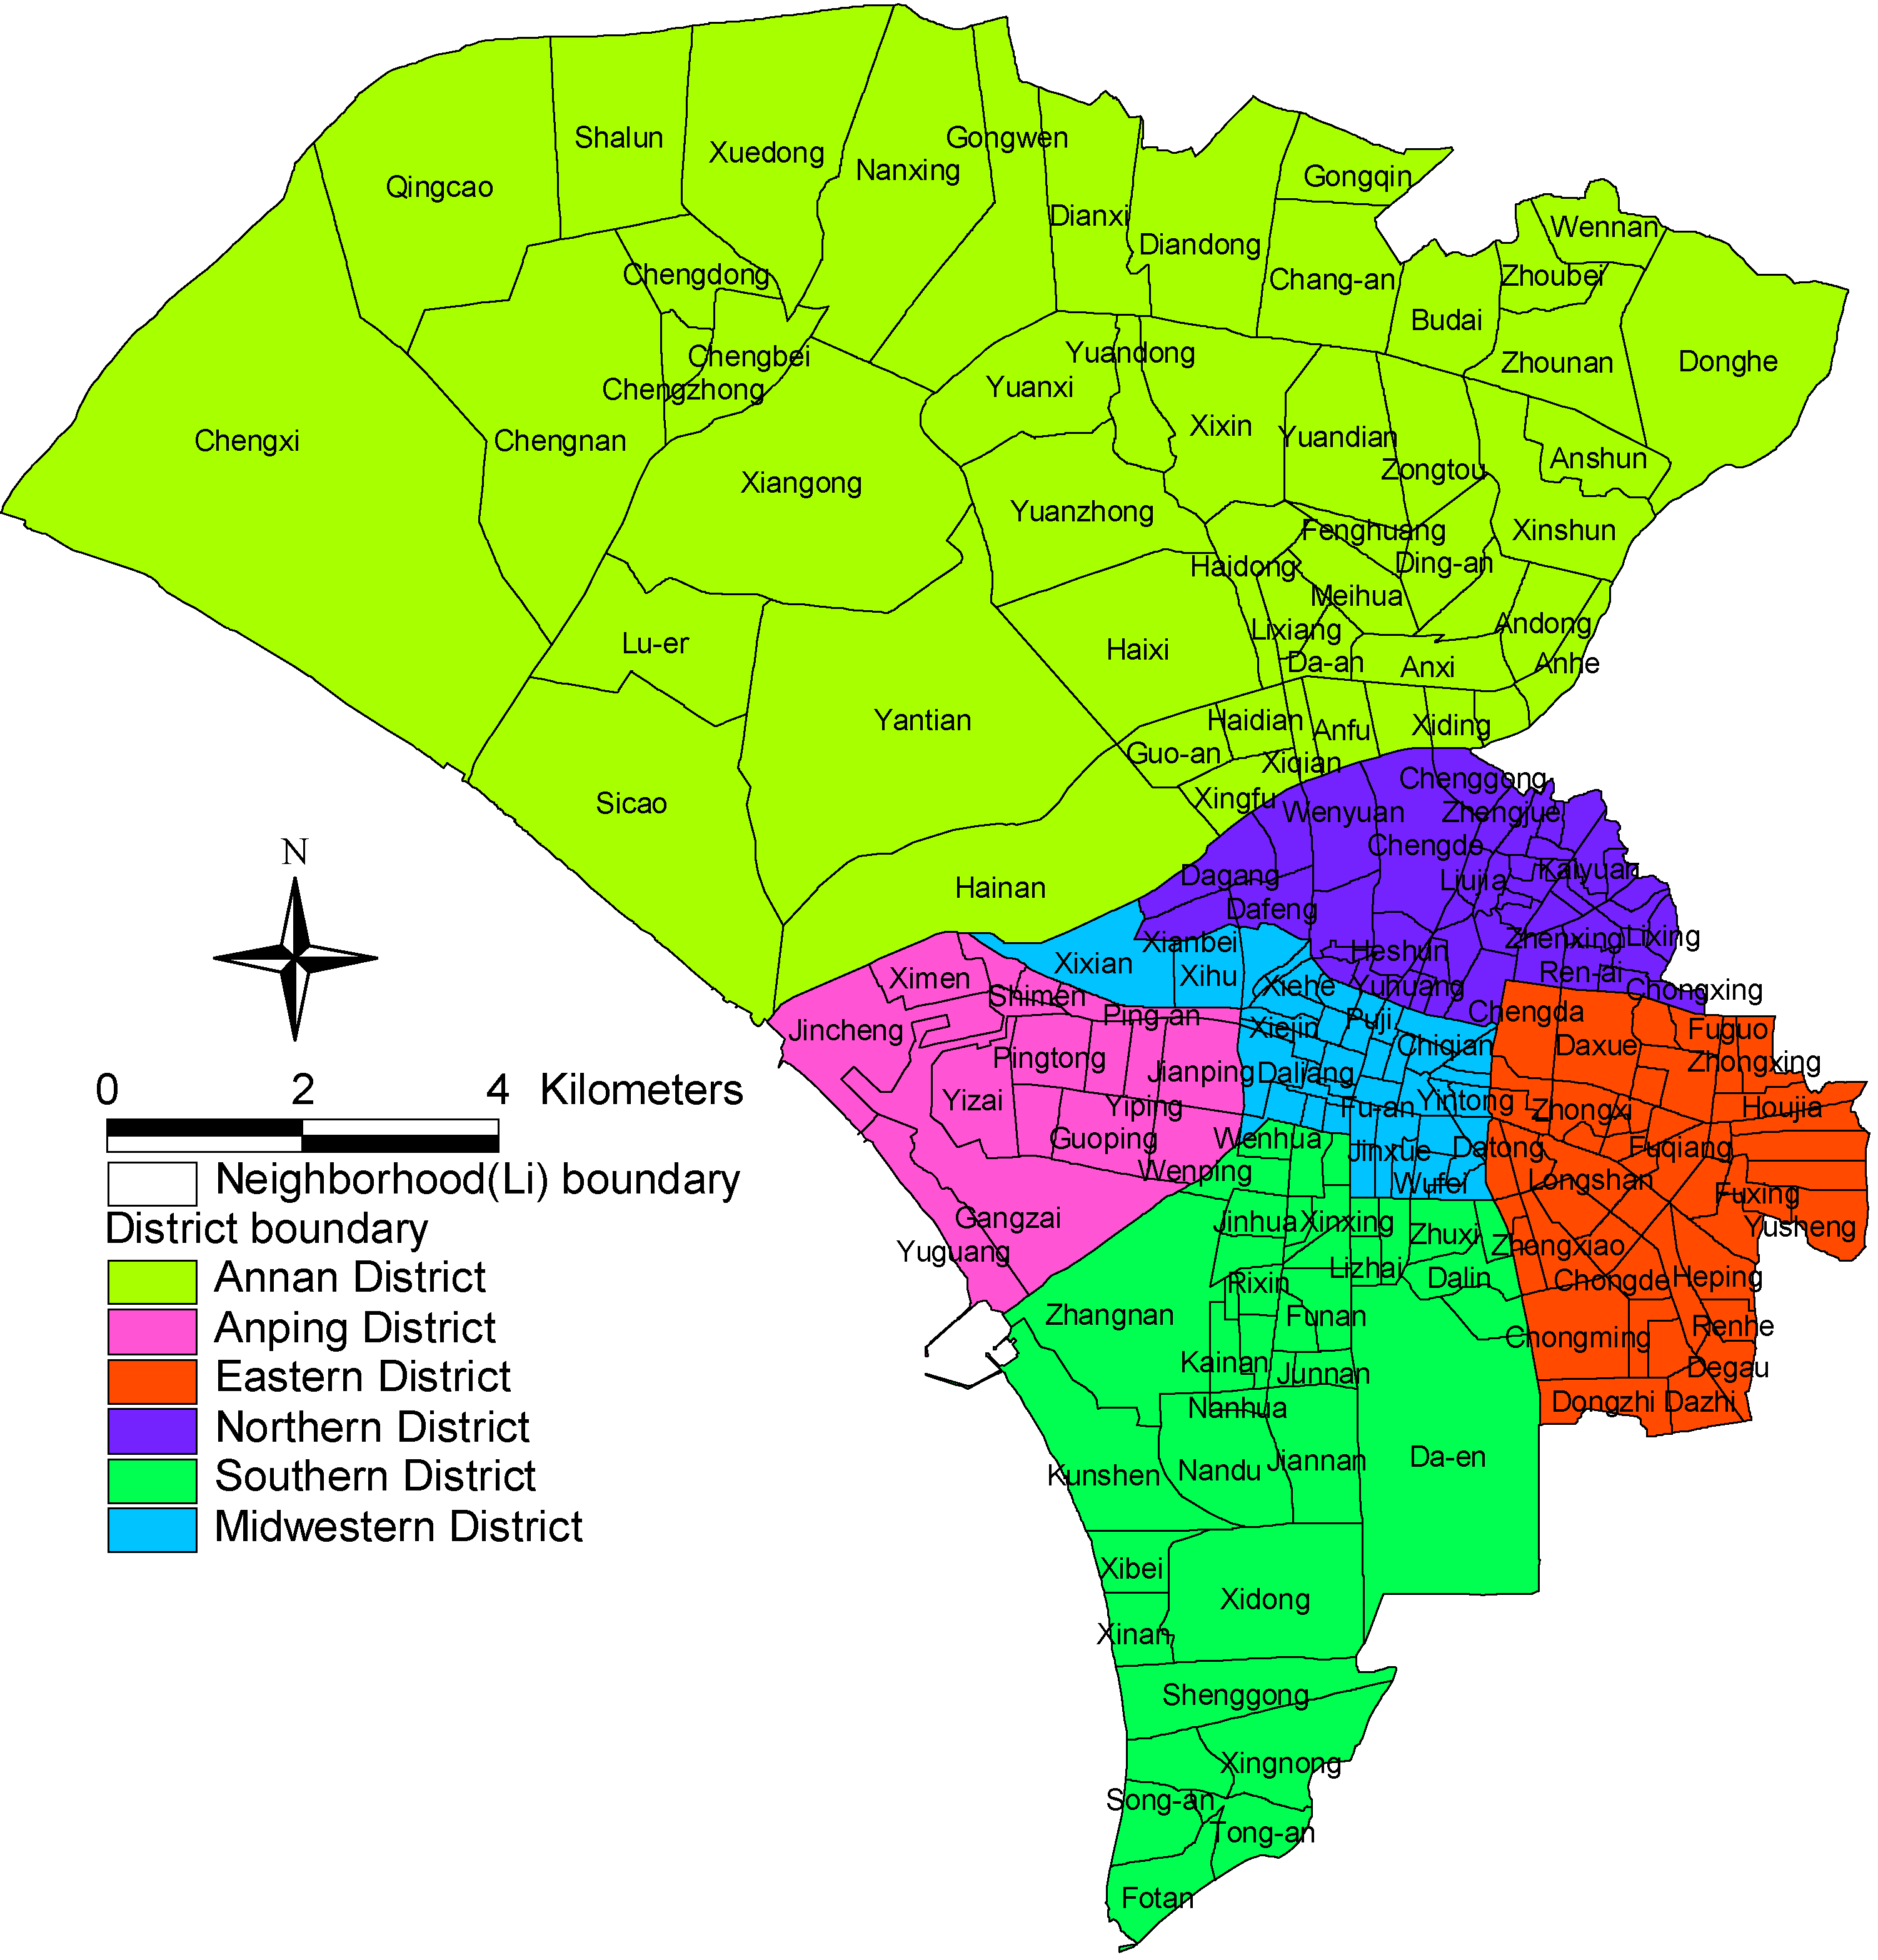
2.1. Empirical Research Area

Tainan City is located in the southern coastal plain of Taiwan (120°11′6.3′′ E, 22°59′31.9′′ N) (see Figure 1), covering an area of 175.65 km2. It is the oldest and currently the fourth largest city in Taiwan, with a total population of 764,658 in 2007. The city is relatively flat, with no mountain ranges or high elevations. Its urban development process is influenced by both several hundred years of history and long-term natural factors as well as the interactions between the two. Tainan City is divided into 233 neighborhoods and six administrative districts: Annan, Anping, East, North, South, and West Central. Tainan City has diversified and complicated types of land use. The largest land area is used for agriculture (37.32%), followed by built-up areas (19.63%), miscellaneous purposes (14.88%), transportation (11.20%), water conservation (8.63%), and public facilities (3.62%), indicating that Tainan City still has a vast area of land available for development. Tainan City recently implemented numerous strategies related to urban development, environmental protection and healthy development, such as the Tainan Region Plan, a land flattening and reforestation program, a program for the transformation of vacant lots and houses and the Tainan Healthy City Plan. These initiatives provide a good opportunity to test whether the model proposed in this study can effectively assess the relationship between urban land development and the environment.
Four basic principles were developed to select the spatial analysis units based on the objectives of this study, the characteristics of study area, the quality of the data and the DEA theory, including the significance of a standard measurement for efficiency assessment and the practical applicability for urban planning, both of which reflect the development characteristics of the area for empirical research and meet the restrictions on the number of units for evaluation and decision making. A total of 233 neighborhoods in the smallest administrative region in Tainan City were considered the decision-making units (DMUs) of analysis. The relative locations are shown in Figure 2.
Figure 1. Location of the research area.
Sustainability 07 10479 g001
Figure 2. Relative locations of the decision-making units (DMUs).
Sustainability 07 10479 g002

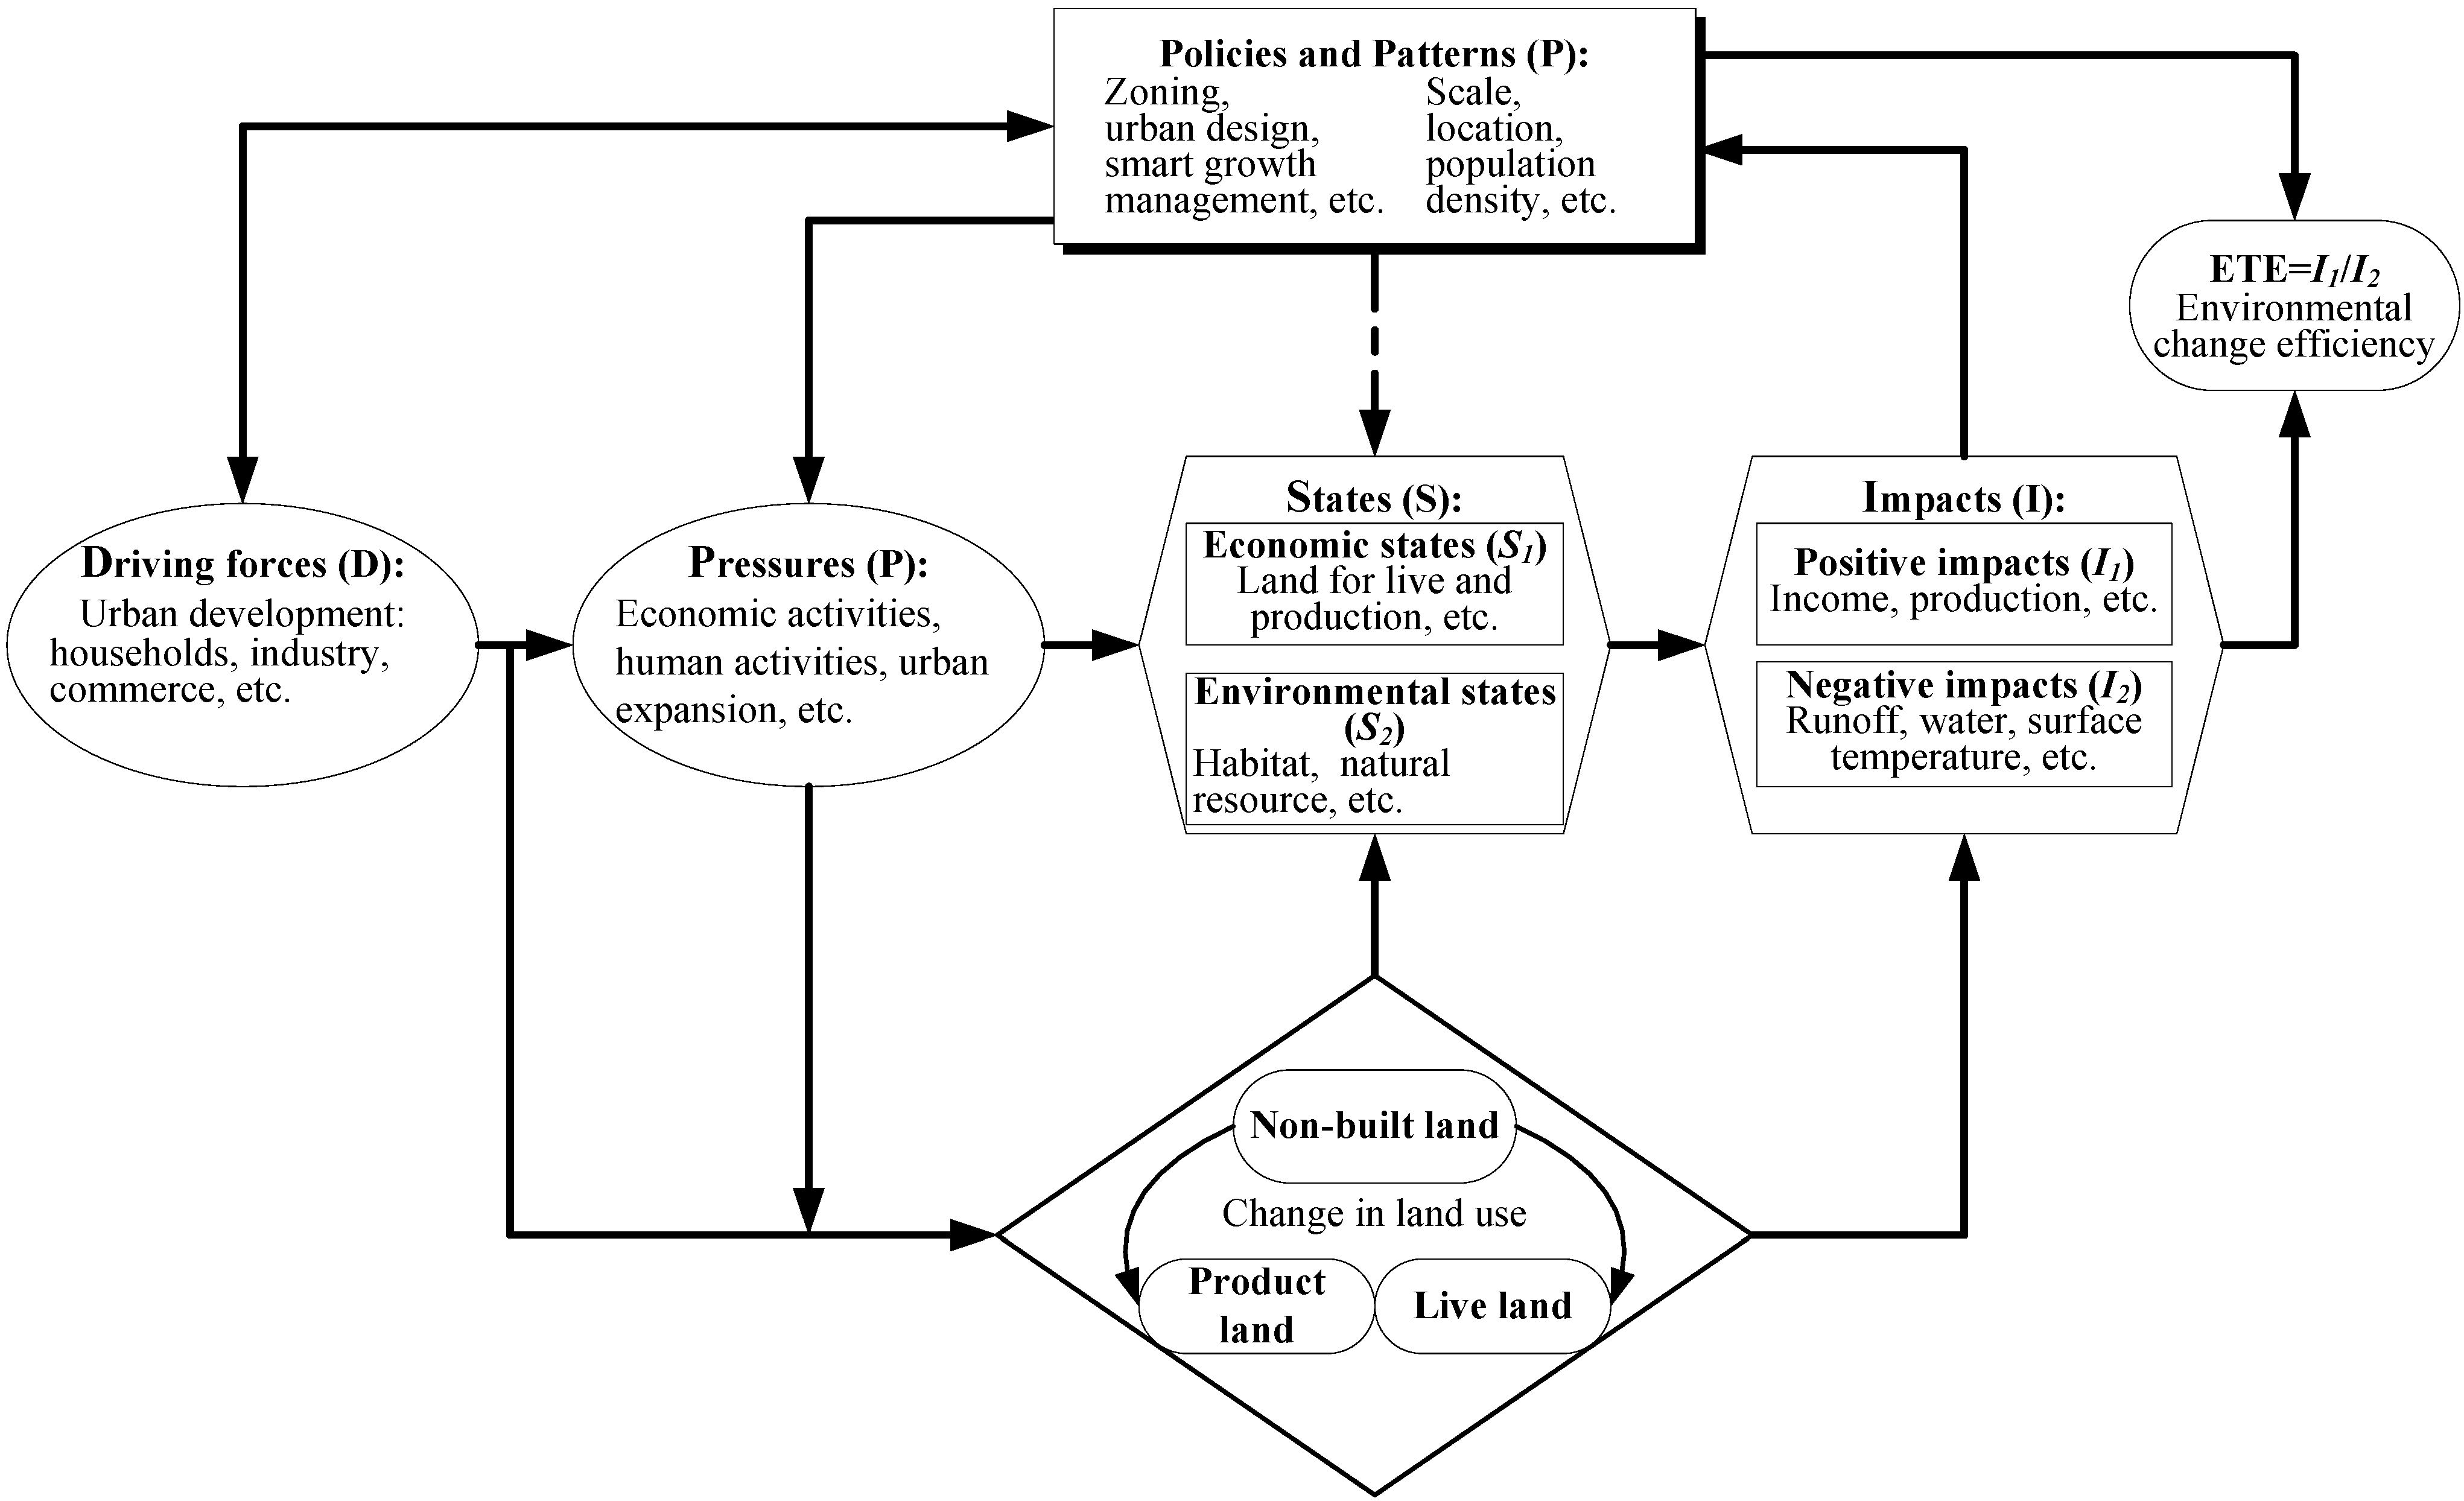
2.2. The applicability of DPSIP in Assessing the Efficiency of Urban Land Development

Many recent studies have used the drivers-pressure-state-impact-response (DPSIR) model to solve environmental problems and diagnostically evaluate sustainable development [26,27,28].
DPSIR is a common theoretical model and interdisciplinary tool used to provide and communicate knowledge of the current state of the environment and causal factors regarding environmental issues. Partially due to its simplicity as a framework, DPSIR arguably cannot account for the dynamics of the system that it models or handle cause-consequence relationships. DPSIR has also shown itself to be incompatible with the multiple perspectives required by human interaction in global ecology; more-over, the framework can only assess one impact at a time, and it is difficult to apply to existing or future policies [29,30,31].
To address these limitations and propose a suitable method for assessing the complex relationships between urban land development, environmental change, and urban policy, we have enhanced and modified the original DPSIR framework and suggest a new assessment model framework: DPSIP (see Figure 3).
Figure 3. The driving forces-pressure-state-impact-policy and pattern (DPSIP) framework applied to environmental change efficiency.
Sustainability 07 10479 g003
The relationship between environmental impacts and developmental effectiveness in the process of urban land development was analyzed and structured using this assessment framework. The implications of the policies played a similar role and relationship to response (R) in the traditional DPSIR system. However, the influence of urban management policies on the entire system of urban development constituted the ultimate policy response for the entire system and, consequently, had an impact in the early stages through the driving force and pressure components.
In contrast to the input and output factors of spatial units for environmental change efficiency within the city, urban development policies and patterns are citywide and represent an external environmental variable. As factors affecting the efficiency of environmental change, urban development policies and patterns develop in the early stages and have high degrees of stability.
Overall, the basic concept of the DPSIP model is that, when driven by the economic and daily activities of humans, pressure is exerted on natural resources and the environment. Thus, policies and patterns change the current state of the environment and the quality of natural resources, resulting in internal and external impacts on the entire system of urban development. Urban planners can respond by adjusting the development strategies related to the environment and the economy to mitigate the pressure on the natural environment, thus achieving the goal of sustainability.

2.2.1. Driving Forces

Driving forces refer to the reasons for change in an urban land use system. Recently, many studies [32,33,34,35] have indicated that urban land use and land cover changes are important drivers of global environmental changes. They are the underlying causes of the changes in urban land use and in environmental conditions. Driving forces can be divided into natural driving forces and socio-economic driving forces [9].

2.2.2. Pressure

Eder and Narodoslawsky (1999) [36] have indicated that environmental pressure mainly results from human activities. Human and commercial activities interact with and influence the natural resources and ecological systems in the environment. The pressure placed on the environment is expressed as the current state of the competition among diverse social and economic driving forces in the quest for land resources [25,31,37].

2.2.3. State

The amount of land that a city’s residents require for daily living and production is an important factor that generates a shift in land use, which is an inevitable component of urban development. In general, the change pattern in urban land development consists primarily of a shift from agricultural land, open space, or other non-built land to production or residential land [5,6,7,32]. These changes in land use patterns result in the alteration of a city’s existing development stages or land characteristics. The same type of land use changes may affect a single parcel of land or an area containing adjacent parcels of land. To measure the characteristics of environmental change in urban development, the state is divided into two factors: S1 of the economy and S2 of the environment. The land use changes measured in S1 of the economy include increases in commercial land, industrial land, residential land, transportation land, and land used for facilities or other related purposes. The land use changes measured in S2 of the environment include changes in non-built lands that cause a decrease in biodiversity or the depletion of natural resources.

2.2.4. Impact

The characteristics of the individual land types are reflected in the state component of DPSIP. The traditional DPSIR framework is capable of analyzing only one impact at a time. In this study, the impact is considered to have two parts: the positive impact (I1) and the negative impact (I2) of urban development, both of which are inherent in land use changes. The positive impact refers to the actual impact and benefits to the economy and residents’ quality of life, including population growth, increased income, and economic development [11,20,24,25,38,39]. Because of changes in land use patterns, the overall environmental impacts are characterized by accumulation and diffusion. These negative impacts involve ecological issues, including a reduction in habitat quality and a decrease in biodiversity due to declining habitats [40,41,42]. Furthermore, land use changes can result in an increase in the area of the impermeable layer of the earth’s surface, affecting cities’ hydrological systems and resulting in increased surface runoff [43,44,45,46] and surface temperature [47,48,49].

2.2.5. Policy and Pattern

Urban planners respond to the demand for urban development and the associated development issues with corresponding policies or guidance for urban development. The primary purpose of these policies is to respond to the driving forces and pressures of urban development.
In the theoretical framework proposed in this study, the urban policy and urban pattern components are the most external factors. Policies and patterns not only affect the initial driving forces of the entire urban development system but also generate direct and indirect effects on the pressure of development, the current state of the land, and the impacts of development, leading to further effects on the efficiency of environmental change.
The results of a literature review reveal that policies that may be relevant to the efficiency of environmental change in urban land development include traditional zoning systems for land use, urban design regulations, and practices adopted by smart growth management [50,51,52,53,54]. These urban development policies influence the current state of urban land use and socio-economic development, thereby affecting the efficiency of the eventual changes to the environment.

2.3. Definition of Environmental Change Efficiency

2.3.1. Definition of Efficiency

Environmental change efficiency involves balancing the natural environment with economic benefits. Efficient urban spatial units improve the management of the urban natural environment and create a competitive advantage by reducing the depletion of natural environmental resources and improving ecological protection. Environmental change efficiency has three characteristics based on the DPSIP model, the theory of efficiency and other studies [17,18,25,54,55]: a simultaneous improvement in the effectiveness of the economy and the natural environment; an increase in the value of urban development with a small environmental impact; and the promotion of urban economic growth with a reduction in the use of natural resources.
The definition of environmental change efficiency is expressed as follows:
Environmental Change Efficiency (ECE) = I 1 ( p o s i t i v e   i m p a c t s ) I 2 ( n e g a t i v e   i m p a c t s ) = j = 1 n O j i = 1 m I i
  • I1 = the positive impacts resulting from the accumulation of current state changes in society and the economy, i.e., the sum of outputs.
  • I2 = the negative impacts resulting from the accumulation of current state changes in related natural environmental resources and the ecological environment, i.e., the sum of inputs.
The numerator for overall outputs represents the change in urban land use patterns due to urban land development. The numerator represents the positive impact (I1) on urban residents’ quality of life and on the economy, which indicates an increase in socio-economic efficiency or the quality of services generated by urban development.
The denominator for overall inputs represents the change in natural environmental resources or changes in the depletion state and ecological environmental impact in the natural environmental system caused by a land use change due to urban development. The denominator represents the negative impact (I2) on the natural environment and natural resources in the urban area at the time of development.
The efficiency scores in this study provide index values of a single composite type to reflect the state of sustainable development. In general, the efficiency index proposed in this study represents the composite performance results for sustainability in an area. With the ability to detect the factors that affect efficiency scores, we can clearly understand the factors that may improve the area’s overall efficiency and thereby achieve the goal of sustainable development. If the value of a city’s average environmental change efficiency can be increased annually and the standard deviation of the environmental change efficiency of a DMU within a city can be decreased annually, then the region can obtain a positive state of development within the context of global environmental change. Moreover, the impact generated by urban development and changes in the state of land use would also be positive.

2.3.2. Input and Output Indicators

When evaluating efficiency, the selection of representative indicators as inputs and outputs is both important and difficult [56]. To select the indicators, we began with a literature review [11,13,25,39,54,57] focusing on the indicators suitable for monitoring and measuring environmental impacts and urban sustainability at the neighborhood level; we selected indicators based on DPSIP and the primary aspects of sustainable development.
In this study, an indicator is defined as a measurable and detectable variable that reflects the causes and effects of land use change and that can be easily understood and used in both planning and decision making. We evaluated potential indicators using the following four criteria: reliability, usability, availability, and usefulness in decision making. An initial list of input and output indicators was developed based on earlier studies [11,13,24,25,39,57]. After the potential indicators had been evaluated, the most suitable indicators were chosen for demonstration in Tainan City. Finally, the final four input indicators and five output indicators were selected based on the availability of data and the practicality of use at the neighborhood level.
The inputs were primarily oriented toward natural environmental resources and the ecological environment, including factors such as surface temperature [57,58,59], surface runoff [2,13,43,44,45,46], habitat quality [13,40,41,42,60], and water consumption [2,44,61].
The outputs were chosen to reflect the benefits and goals of economic and social development according to the Tainan City Sustainable Development Action Plan proposed by the Tainan City Government as well as other studies [11,20,24,25,38,39]. The outputs included population, production, income, the service quality of infrastructure, and accessibility.
The data were primarily collected from the Landsat Thematic Mapper Satellite Image (2007); the Land Use Investigation of Taiwan (2007); the Taiwan Water Corporation (2007); the Department of Household Registration of the Ministry of the Interior (2007); the Industry, Commerce and Service Census (2006); the Financial Data Center of the Ministry of Finance (2007); and the Database of the Traffic Network Digital Map (2007) (see Table 1).
Table 1. Input and output indicators for the data envelopment analysis (DEA) efficiency analysis.
IndicatorsDefinitionUnitsMeanStd. Dev.RangeData Sources
Input
Surface temperatureGlobal average surface temperature°C27.8672.16812.559Landsat Thematic Mapper Satellite Image, 2007 [62]
Surface runoffTotal volume of overland flow draining off the landm3/s12.47520.743195.824Land Use Investigation of Taiwan, 2007 [63]
Habitat qualityArea-weighted mean patch fractal dimension value of habitatsNone1.4200.0980.485Land Use Investigation of Taiwan, 2007 [63]
Water consumptionTotal water usem3381,268268,4211,629,889Taiwan Water Corporation, 2007 [64]
Output
PopulationTotal populationPersons3262173211,252Department of Household Registration, Ministry of the Interior, 2007 [65]
Service quality of infrastructureDensity of infrastructurem2/ha25.566813.164964.8379Land Use Investigation of Taiwan, 2007 [63]
ProductionTotal production of industry and commerceUSD$57,292117,0161,174,532Industry, Commerce and Service Census, 2006 [66]
IncomeTotal household incomeUSD$17,11212,66389,125Financial Data Center, Ministry of Finance, 2007 [67]
AccessibilityGlobal integration value of streetsNone0.2400.0380.150Database of the Traffic Network Digital Map, 2007 [68]
The common methods of efficiency assessment include ratio analysis, regression analysis, and DEA [69]. One characteristic of DEA is that no prior knowledge of the production function between the input and output attribute data is required; similarly, no relative weight needs to be set for the attribute data [54,60,61,62,63,64,65,66,67,68,69,70,71,72]. Therefore, DEA is useful for comprehensively assessing the indicators of different types and data patterns; it is widely used in economic science, agricultural economics, public economics, financial economics, and economic policy. Additionally, DEA is considered an appropriate analysis method for many studies related to eco-efficiency or environmental efficiency [21,22,23,24,54,73,74,75,76,77].
Considering the characteristics of complexity and development in urban areas and the advantages of DEA, we used the input-oriented CRS (constant returns to scale) model to obtain efficiency measures corresponding to the assumptions. The efficiency measures attained from CCR model are known as overall technical efficiency (OTE) scores.

2.4. Influential Factors in Environmental Change Efficiency

Several useful environmental assessment tools exist for promoting sustainable development, including strategic environmental assessment (SEA) [78,79], territorial impact assessment (TIA) [80,81] and spatial policy monitoring. These tools focus on the process by which environmental considerations are fully integrated into the preparation and adoption of policies, plans, and programs. The tools provide a means to consider the relationships between policies, plans, and environmental impacts. To assess the potential factors affecting environmental change efficiency, the efficiency factors were formed using urban characteristics based on the construction framework of DPSIP and the dimensions related to urban land development in SEA and TIA [82,83] and urban policies [52,84].
The policies and management strategies for urban land development have traditionally included zoning and urban design control. The concepts of growth management, smart growth, new urbanism, and sustainable development have been proposed in recent years [50,51,53,85]. Among these, smart growth and new urbanism are the most well-known and can effectively reduce the spread of urban areas and manage urban development. These concepts are currently believed to be the most important planning concepts and development policies.
We integrated urban characteristics and urban policy concepts, both of which affect the efficiency of urban lands and environments, and then cross-compared these factors. From this process, six quantitative indicators were identified, including land area, location, population density, the floor area ratio, the impervious ratio, and mixed land use [51,52,53,86,87,88,89].
Additionally, because the factors that were determined to affect efficiency had different spatial distributions, GWR model was used to analyze the efficiency factors.
GWR is a local multivariate regression function and a developed method for the analysis of spatial data in which the data samples are weighted based on their spatial proximity [90]. In contrast to the more traditional ordinary least-squares regression (OLS), GWR can solve the problem of spatial autocorrelation in residuals and can reduce the instability of space [90,91,92,93,94]. GWR produces a separate set of regression parameters for every observation across the study area. Thus, it avoids the assumed relationships between dependent and independent variables that are generated by traditional OLS models. Because the factors used in this study have different spatial distributions, GWR may be a useful analysis tool for assessing which of these factors influence efficiency.

3. Results and Discussion

3.1. Scores of Environmental Change Efficiency

Table 2 presents the results of the DEA for environmental change efficiency. The average efficiency score of the 233 neighborhoods was 89.44%, with a maximum efficiency score of 100% and a minimum score of 61.90%. A total of 48 neighborhoods had an efficiency score of 100%. Comparing the districts, the ratio of efficient DMUs to all DMUs was 28.95% in the Midwestern District, 27.66% in the Eastern District, 25.58% in the Northern District, 20.00% in the Anping District, 12.82% in the Southern District, and 84.03% in the Annan District. After comparing the means and standard deviations for each district, the Midwestern District emerged as the district with the highest average (95.96%) and the lowest standard deviation (3.63%), followed by the Anping District (92.42%, 7.35%) and the Northern District (91.79%, 8.29%). The Southern District and the Annan District fell below the overall average in Tainan City, with averages of 86.13% and 84.03%, respectively, which was caused by primarily agricultural land use types or the district’s status as a recent growth area with a smaller population, less production and lower service quality of infrastructure.
Table 2. Efficiency results for 233 neighborhoods.
DistrictDMUsEfficiency Score
TotalEfficiencyEfficiency Percentage (%)MeanStd. Dev.
Eastern471327.6689.709.62
Southern39512.8286.1310.50
Midwestern381128.9595.963.63
Northern431125.5891.79 8.29
Anping15320.0092.427.35
Annan5159.8084.039.37
Tainan City2334820.6089.449.48

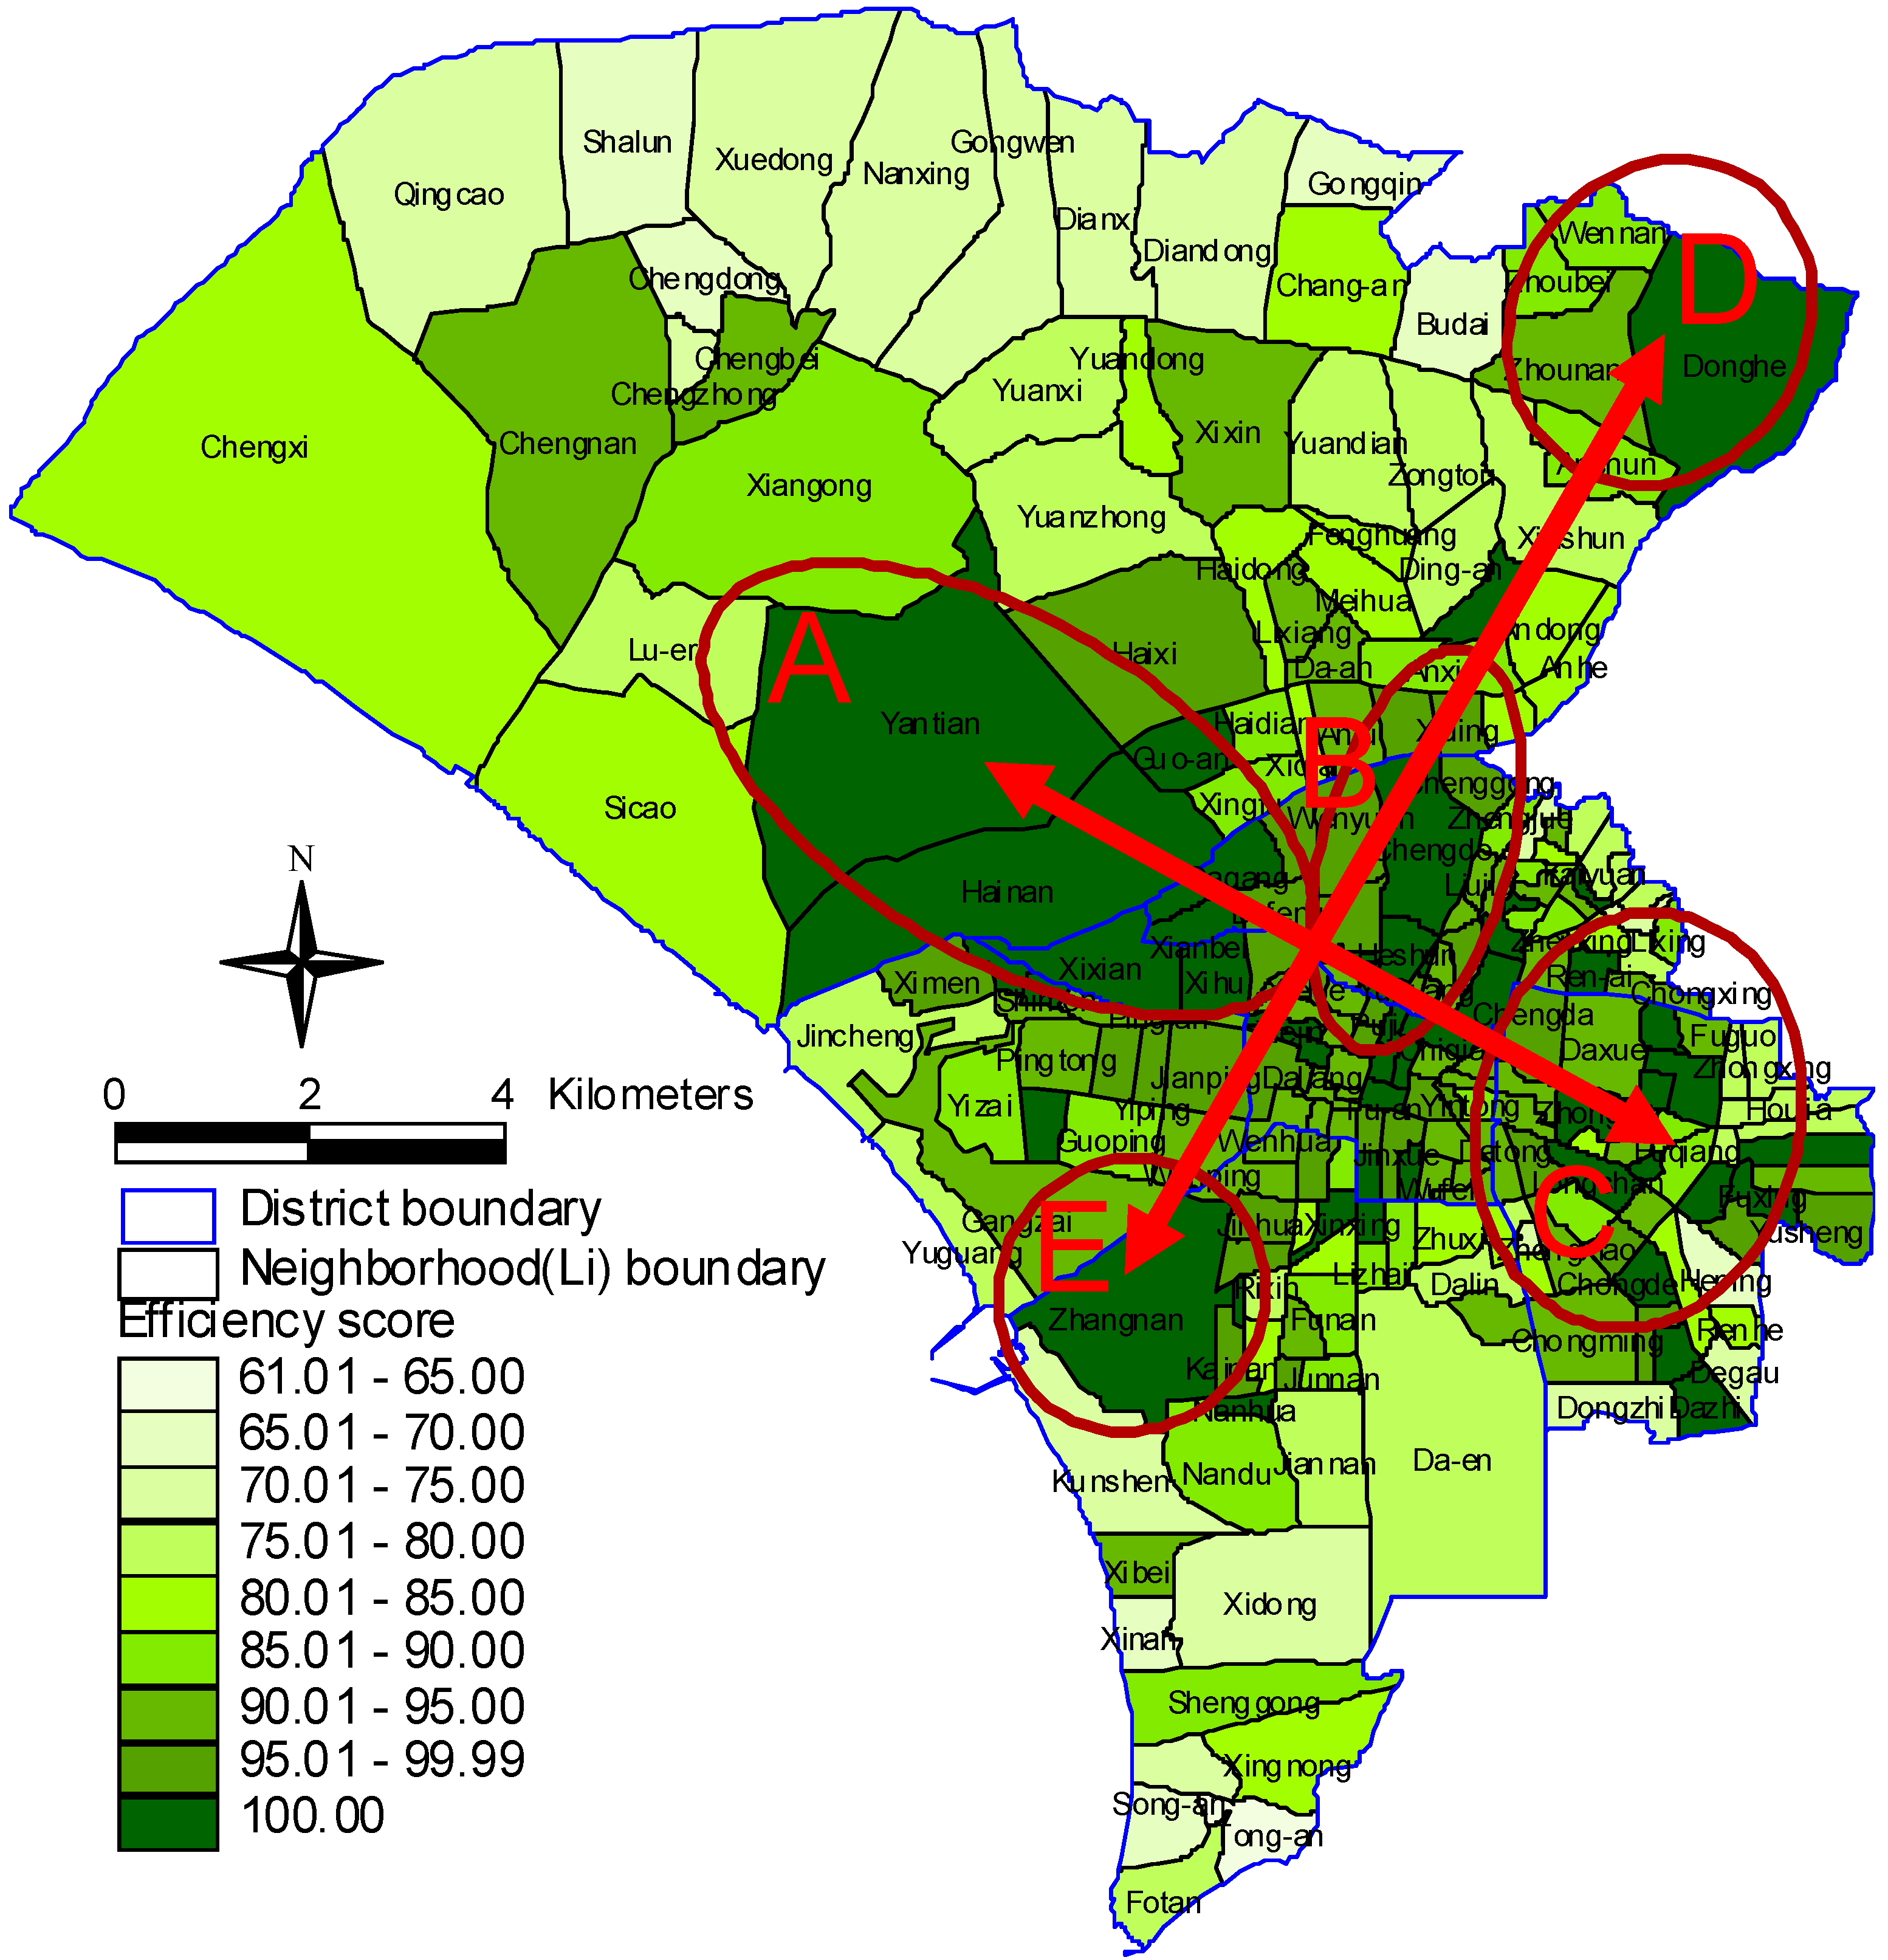
3.2. Spatial Patterns and Slack Analysis of Environmental Change Efficiency

The administrative boundaries of each district denote an actual geographical area of space. The spatial distribution of the DMU efficiency scores revealed an overall decreasing trend in the distribution of efficiency scores, moving outward from the city center and forming two spatial development axes, A C and D E , and signifying relatively efficient urban development (see Figure 4). The A C efficiency axis ran from the southeast side of Tainan City, went through the downtown area, and extended to the northwest. The D E efficiency axis extended from northeast to southwest. Efficiency scores decreased in areas located farther from downtown. With the exception of a few efficient DMUs that represented dispersed development characteristics (e.g., Donghe and Anqing in the Annan District, Yuping in the Anping District, and Xingsheng and Ren-ai in the Northern District), the most efficient DMUs appeared in clustered or adjacent developments and were concentrated across the administrative districts, particularly in the areas adjacent to the Annan, Anping, and Northern Districts and in the DMUs in the Northern and Midwestern Districts.
Figure 4. Spatial patterns of efficiency scores.
Sustainability 07 10479 g004
When the number of DMUs exhibiting differences in a certain input or output indicator increases, most of them must be able to improve their environmental change efficiency via an increase or decrease in this indicator. These indicators are particularly important for improving the overall efficiency of urban land development; they also serve as a reference for subsequent management and improvement strategies. Therefore, we calculated the number of DMUs with changeable differences with respect to nine input and output indicators to understand the importance of the direct input and output indicators that impact the efficiency of urban land development. The ratio of these DMUs to the total number of 233 DMUs was calculated and used as a reference point to determine the indicators for increased efficiency. When a significant number of DMUs revealed a difference in a certain input or output indicator, this indicator became the focus of efficiency improvements for the future; that is, in the future, a reduced value of these input indicators or an increased value of these output indicators will contribute to improved efficiency scores among the DMUs.
Based on the calculated difference between the variables, the indicators relevant to future efficiency improvements were identified as follows: an increase in the quality of public facilities and services (62.23%), an increase in income (57.51%), an increase in production (35.19%), a decrease in surface runoff (25.75%), a decrease in water consumption (18.88%), an increase in habitat quality (17.60%), an increase in the population of urban residents (16.31%), a decrease in the urban surface temperature (12.02%), and an increase in accessibility (8.58%).

3.3. Factors Affecting Environmental Change Efficiency

The adjusted R2 value of the OLS regression was 0.37, whereas the adjusted R2 value of the GWR was 0.53, indicating that the GWR can better explain the influential factors of environmental change efficiency.
The regression coefficients of the variables in the OLS and GWR models were organized, and the efficiency scores increased when the factor values increased. In contrast, a coefficient of less than 0 indicated that the efficiency scores decreased when this variable’s values increased (see Table 3).
Table 3. Parameter summary for the OLS model and the GWR models.
ParameterOLSGWR
MeanMinimumMaximum<0>0p-Value
DMUs(%)DMUs(%)
Area0.01070.0247−0.01220.0877229.4421190.560.05 **
Location−0.0023−0.0026−0.00470.0000233100.0000.000.03 **
Population density0.01010.02750.00580.624600.00233100.000.00 ***
Floor area ratio−0.00430.0061−0.06570.279415064.388335.620.00 ***
Impervious ratio−0.0532−0.0353−0.34850.207814963.958436.050.05 **
Mixed land use−1.5029−1.5202−32.692110.952015064.388335.620.07 *
* Significance level p < 0.1; ** Significance level p < 0.05; *** Significance level p < 0.001.
Our results revealed that five of the six impact variables proposed had spatial differences. Regarding the variables’ influence, the location and population density variables had the same effect in the OLS and GWR models. The effect of the location was negative, indicating that the efficiency scores decreased with increases in the distance from the city center. The result is in line with those of recent studies [83,95,96]. For the population density variable, the efficiency scores increased as the population density increased.
In this study, among the six variables influencing efficiency, with the exception of the two variables discussed above, four variables: area, the floor area ratio, the impervious ratio, and mixed land use had different effects based on the two regression analyses. In general, the GWR simultaneously revealed positive and negative effects in these four variables due to the development characteristics and spatial non-stationarity of the 233 neighborhoods. These differences must be considered when preparing a strategy to improve efficiency in different areas of the city. According to Table 3, the neighborhoods with positive values of influential factors could improve their environmental change efficiency by increasing their area, population density, floor area ratio and mixed land use. In addition, the neighborhoods with negative values of influential factors could improve their environmental change efficiency by decreasing their area, floor area ratio, impervious ratio and mixed land use.

3.4. Efficiency Improvement Strategy

As the focus of early development in Tainan City, some neighborhoods in the Midwestern District had characteristics of high population density, high building density, low plant coverage, and a significant impermeable layer. These characteristics were reflected in the input indicators of environmental resources; an assessment of the indicators of environmental change efficiency revealed relatively poor performance for surface runoff, surface temperature, and habitat quality. To improve efficiency throughout Tainan City, the current urban development strategies for the city, including urban renewal, local environmental change, reforestation, and landscaping in vacant lots, should be continued. The impact on the natural environment generated during the process of urban development can be reduced by increasing the green space and habitats for wildlife.
To improve efficiency through the sustainable development of urban areas and the environment, the foci of future improvements for Tainan City, in descending order, include reducing surface runoff, reducing water consumption, improving habitat quality, and reducing surface temperature. Urban planners can use phased and zoned development, retain existing natural open spaces in urban districts, and increase areas of green space with ecological functions in urban areas through a standardized review of urban design and the implementation of a comprehensive urban planning process. With improved input and output indicators, overall efficiency can be indirectly improved to achieve the long-term goal of reducing the impacts of global environmental change. When developing strategies to improve efficiency in areas that differ in terms of the quality of public facilities and services and in adjacent areas and spatially clustered areas, the development of public facilities should be prioritized.
In terms of the factors influencing efficiency, population density is significant with regard to compact urban development. The influence of different spatial units gradually increased from the junction of the Midwestern, Southern, and Anping Districts fanning out to the south, north, and east of the outlying areas, forming a nearly concentric circle. For the outermost neighborhoods in Tainan City, environmental change efficiency can be greatly improved by increasing the population density. The current land use types in these neighborhoods are primarily agricultural or recently developed with smaller populations and less production activity. We suggested that these neighborhoods be more compact by increasing their population densities. It is not only an important strategy for a compact city but can also increase its environmental efficiency.
A total of 149 neighborhoods in Tainan City (63.95%) could improve their environmental change efficiency by reducing their impervious area ratios. These areas are located primarily in the Midwestern District of the city center and in the nearby Northern and Anping Districts. According to the existing literature [47,48,49], a higher impervious area ratio leads to a greater surface temperature and surface runoff for the city. Therefore, future urban designs can effectively reduce their environmental impact and enhance their efficiency scores by focusing on the impervious area ratio.

4. Conclusions

Changes in a city’s land use and the expansion of urban development are key drivers of global environmental change and are unavoidable aspects of economic and social development in many cities. Although urban development land use changes negatively impact the natural environment, they often produce important economic and social benefits for city residents.
In this study, we propose the DPSIP model framework to address the process, complexity and the relationship between environmental impacts and developmental effectiveness. This model can help researchers overcome the limitations associated with the traditional DPSIR, with which assessing two or more impacts at a time is difficult; DPSIR is also difficult to apply to existing or future policies [29,30,31]. For cities with rapid urbanization, which is similar to what is occurring in Tainan City, DPSIP could generate significant benefits for the entire urban development management system. The urban planners, urban managers, and policymakers could obtain useful information from relevant evaluation results and create policies to improve the efficiency of urban development and could mitigate the global environmental impact caused by urban land use changes according to the factors affecting environmental change efficiency.
Additionally, spatial and measurable efficiency scores were calculated for environmental changes in urban land development, providing a comprehensive evaluation index for the efficiency of urban development and environmental impacts. This index constitutes a new resource for achieving urban sustainability at the neighborhood level.
Finally, GWR was applied to the factors affecting efficiency and was successfully validated. The empirical results revealed that the GWR analysis had greater overall explanatory power than the traditional regression model; the GWR analysis also generated different coefficients based on the spatial difference of DMUs due to the effects of the various influential factors. This feature will help researchers understand the effects of differences across the different DMUs, which may contribute to the development of more specific efficiency strategies.

Acknowledgments

The authors would like to thank the Ministry of Science and Technology of the Republic of China, Taiwan, for financially supporting this research under contract no. MOST-98-2410-H-006-092-MY2.

Author Contributions

This study represents an effort from two authors. Hsing-Fu Kuo performed research, analyzed the data and wrote the paper; Ko-Wan Tsou made contribution to the research design. All authors read and approved the final manuscript.

Conflicts of Interest

The authors declare no conflict of interest.

References

  1. United Nations. World Urbanization Prospects: The 2014 Revision; United Nations: New York, NY, USA, 2014. [Google Scholar]
  2. Haase, D.; Nuissl, H. Does urban sprawl drive changes in the water balance and policy? The case of Leipzig (Germany) 1870–2003. Landsc. Urban Plan. 2007, 80, 1–13. [Google Scholar] [CrossRef]
  3. He, C.Y.; Okada, N.; Zhang, Q.F.; Shi, P.J.; Li, J.G. Modelling dynamic urban expansion processes incorporating a potential model with cellular automata. Landsc. Urban Plan. 2008, 86, 79–91. [Google Scholar] [CrossRef]
  4. Pauleit, S.; Duhme, F. Assessing the environmental performance of land cover types for urban planning. Landsc. Urban Plan. 2000, 52, 1–20. [Google Scholar] [CrossRef]
  5. Carlson, T.N.; Arthur, S.T. The impact of land use—Land cover changes due to urbanization on surface microclimate and hydrology: A satellite perspective. Glob. Planet. Change 2000, 25, 49–65. [Google Scholar] [CrossRef]
  6. Grimm, N.B.; Faeth, S.H.; Golubiewski, N.E.; Redman, C.L.; Wu, J.G.; Bai, X.M.; Briggs, J.M. Global change and the ecology of cities. Science 2008, 319, 756–760. [Google Scholar] [CrossRef] [PubMed]
  7. Kalnay, E.; Cai, M. Impact of urbanization and land-use change on climate. Nature 2003, 423, 528–531. [Google Scholar] [CrossRef] [PubMed]
  8. Hasse, J.E.; Lathrop, R.G. Land resource impact indicators of urban sprawl. Appl. Geogr. 2003, 23, 159–175. [Google Scholar] [CrossRef]
  9. Lambin, E.F.; Meyfroidt, P. Land use transitions: Socio-ecological feedback versus socio-economic change. Land Use Policy 2010, 27, 108–118. [Google Scholar] [CrossRef]
  10. Weng, Q.H. Modeling urban growth effects on surface runoff with the integration of remote sensing and GIS. Environ. Manag. 2001, 28, 737–748. [Google Scholar] [CrossRef]
  11. Prato, T. Evaluating land use plans under uncertainty. Land Use Policy 2007, 24, 165–174. [Google Scholar] [CrossRef]
  12. De Koeijer, T.J.; Wossinik, G.A.A.; Smit, A.B.; Janssens, S.R.M.; Renkema, J.A.; Struik, P.C. Assessment of the quality of farmers’ environmental management and its effects on resource use efficiency: A Dutch case study. Agric. Syst. 2003, 78, 85–103. [Google Scholar] [CrossRef]
  13. Whitford, V.; Ennos, A.R.; Handley, J.F. “City form and natural process”—Indicators for the ecological performance of urban areas and their application to Merseyside, UK. Landsc. Urban Plan. 2001, 57, 91–103. [Google Scholar] [CrossRef]
  14. Ohls, J.C.; Pines, D. Discontinuous urban-development and economic efficiency. Land Econ. 1975, 51, 224–234. [Google Scholar] [CrossRef]
  15. Schaltegger, S.; Sturm, A. Ökologische Rationalität Ansatzpunkte zur Ausgestaltung von ökologieorientierten Managementinstrumenten. Die Unternehmung 1990, 4, 273–290. (In German) [Google Scholar]
  16. Cha, K.; Lim, S.; Hur, T. Eco-efficiency approach for global warming in the context of Kyoto Mechanism. Ecol. Econ. 2008, 67, 274–280. [Google Scholar] [CrossRef]
  17. Huppes, G. Eco-efficiency: From focused technical tools to reflective sustainability analysis. Ecol. Econ. 2009, 68, 1572–1574. [Google Scholar] [CrossRef]
  18. Li, D.Z.; Hui, E.C.M.; Leung, B.Y.P.; Li, Q.M.; Xu, X. A methodology for eco-efficiency evaluation of residential development at city level. Build. Environ. 2010, 45, 566–573. [Google Scholar] [CrossRef]
  19. Seppala, J.; Melanen, M.; Maenpaa, I.; Koskela, S.; Tenhunen, J.; Hiltunen, M.R. How can the eco-efficiency of a region be measured and monitored? J. Ind. Ecol. 2005, 9, 117–130. [Google Scholar] [CrossRef]
  20. Singh, R.K.; Murty, H.R.; Gupta, S.K.; Dikshit, A.K. An overview of sustainability assessment methodologies. Ecol. Indic. 2009, 9, 189–212. [Google Scholar] [CrossRef]
  21. Hua, Z.S.; Bian, Y.W.; Liang, L. Eco-efficiency analysis of paper mills along the Huai River: An extended DEA approach. Omega-Int. J. Manag. Sci. 2007, 35, 578–587. [Google Scholar] [CrossRef]
  22. Kuosmanen, T.; Kortelainen, M. Measuring eco-efficiency of production with data envelopment analysis. J. Ind. Ecol. 2005, 9, 59–72. [Google Scholar] [CrossRef]
  23. Yang, W.; Jin, F.J.; Wang, C.J.; Lv, C. Industrial eco-efficiency and its spatial-temporal differentiation in China. Front. Environ. Sci. Eng. 2012, 6, 559–568. [Google Scholar] [CrossRef]
  24. Sanjuan, N.; Ribal, J.; Clemente, G.; Fenollosa, M.L. Measuring and improving eco-efficiency using data envelopment analysis A case study of Mahon-Menorca cheese. J. Ind. Ecol. 2011, 15, 614–628. [Google Scholar] [CrossRef]
  25. Yu, Y.D.; Chen, D.J.; Zhu, B.; Hu, S.Y. Eco-efficiency trends in China, 1978–2010: Decoupling environmental pressure from economic growth. Ecol. Indic. 2013, 24, 177–184. [Google Scholar] [CrossRef]
  26. Holman, I.P.; Rounsevell, M.D.A.; Cojacaru, G.; Shackley, S.; McLachlan, C.; Audsley, E.; Berry, P.M.; Fontaine, C.; Harrison, P.A.; Henriques, C.; et al. The concepts and development of a participatory regional integrated assessment tool. Clim. Change 2008, 90, 5–30. [Google Scholar] [CrossRef] [Green Version]
  27. Niemeijer, D.; de Groot, R.S. A conceptual framework for selecting environmental indicator sets. Ecol. Indic. 2008, 8, 14–25. [Google Scholar] [CrossRef]
  28. Tscherning, K.; Helming, K.; Krippner, B.; Sieber, S.; Paloma, S.G.Y. Does research applying the DPSIR framework support decision making? Land Use Policy 2012, 29, 102–110. [Google Scholar] [CrossRef]
  29. Bell, S. DPSIR = A Problem Structuring Method? An exploration from the “Imagine” approach. Eur. J. Oper. Res. 2012, 222, 350–360. [Google Scholar] [CrossRef]
  30. Carr, E.R.; Wingard, P.M.; Yorty, S.C.; Thompson, M.C.; Jensen, N.K.; Roberson, J. Applying DPSIR to sustainable development. Int. J. Sustain. Dev. World Ecol. 2007, 14, 543–555. [Google Scholar] [CrossRef]
  31. Svarstad, H.; Petersen, L.K.; Rothman, D.; Siepel, H.; Watzold, F. Discursive biases of the environmental research framework DPSIR. Land Use Policy 2008, 25, 116–125. [Google Scholar] [CrossRef]
  32. Dalla-Nora, E.L.; de Aguiar, A.P.D.; Lapola, D.M.; Woltjer, G. Why have land use change models for the Amazon failed to capture the amount of deforestation over the last decade? Land Use Policy 2014, 39, 403–411. [Google Scholar] [CrossRef]
  33. Grimmond, S. Urbanization and global environmental change: Local effects of urban warming. Geogr. J. 2007, 173, 83–88. [Google Scholar] [CrossRef]
  34. Schaldach, R.; Alcamo, J.; Koch, J.; Kolking, C.; Lapola, D.M.; Schungel, J.; Priess, J.A. An integrated approach to modelling land-use change on continental and global scales. Environ. Model. Softw. 2011, 26, 1041–1051. [Google Scholar] [CrossRef]
  35. Seto, K.C.; Satterthwaite, D. Interactions between urbanization and global environmental change. Curr. Opin. Environ. Sustain. 2010, 2, 127–128. [Google Scholar] [CrossRef]
  36. Eder, P.; Narodoslawsky, M. What environmental pressures are a region’s industries responsible for? A method of analysis with descriptive indices and input-output models. Ecol. Econ. 1999, 29, 359–374. [Google Scholar] [CrossRef]
  37. Haase, D.; Totzer, T. Urban–Rural linkages-analysing, modelling, and understanding drivers, pressures, and impacts of land use changes along the rural-to-urban gradient. Environ. Plan. B 2012, 39, 194–197. [Google Scholar] [CrossRef]
  38. Lee, Y.J.; Huang, C.M. Sustainability index for Taipei. Environ. Impact Assess. Rev. 2007, 27, 505–521. [Google Scholar] [CrossRef]
  39. Zhao, C.J.; Fu, G.B.; Liu, X.M.; Fu, F. Urban planning indicators, morphology and climate indicators: A case study for a north-south transect of Beijing, China. Build. Environ. 2011, 46, 1174–1183. [Google Scholar] [CrossRef]
  40. Kattwinkel, M.; Biedermann, R.; Kleyer, M. Temporary conservation for urban biodiversity. Biol. Conserv. 2011, 144, 2335–2343. [Google Scholar] [CrossRef]
  41. Kohsaka, R. Developing biodiversity indicators for cities: Applying the DPSIR model to Nagoya and integrating social and ecological aspects. Ecol. Res. 2010, 25, 925–936. [Google Scholar] [CrossRef]
  42. Sandstrom, U.G.; Angelstam, P.; Khakee, A. Urban comprehensive planning—Identifying barriers for the maintenance of functional habitat networks. Landsc. Urban Plan. 2006, 75, 43–57. [Google Scholar] [CrossRef]
  43. Fox, D.M.; Witz, E.; Blanc, V.; Soulie, C.; Penalver-Navarro, M.; Dervieux, A. A case study of land cover change (1950–2003) and runoff in a Mediterranean catchment. Appl. Geogr. 2012, 32, 810–821. [Google Scholar] [CrossRef]
  44. Lin, Y.P.; Hong, N.M.; Wu, P.J.; Wu, C.F.; Verburg, P.H. Impacts of land use change scenarios on hydrology and land use patterns in the Wu-Tu watershed in Northern Taiwan. Landsc. Urban Plan. 2007, 80, 111–126. [Google Scholar] [CrossRef]
  45. Tang, J.; Wang, L.; Yao, Z. Analyses of urban landscape dynamics using multi-temporal satellite images: A comparison of two petroleum-oriented cities. Landsc. Urban Plan. 2008, 87, 269–278. [Google Scholar] [CrossRef]
  46. Zhang, B.A.; Xie, G.D.; Zhang, C.Q.; Zhang, J. The economic benefits of rainwater-runoff reduction by urban green spaces: A case study in Beijing, China. J. Environ. Manag. 2012, 100, 65–71. [Google Scholar] [CrossRef] [PubMed]
  47. Coseo, P.; Larsen, L. How factors of land use/land cover, building configuration, and adjacent heat sources and sinks explain urban heat islands in Chicago. Landsc. Urban Plan. 2014, 125, 117–129. [Google Scholar] [CrossRef]
  48. Li, W.; Bai, Y.; Chen, Q.; He, K.; Ji, X.; Han, C. Discrepant impacts of land use and land cover on urban heat islands: A case study of Shanghai, China. Ecol. Indic. 2014, 47, 171–178. [Google Scholar] [CrossRef]
  49. Miller, J.D.; Kim, H.; Kjeldsen, T.R.; Packman, J.; Grebby, S.; Dearden, R. Assessing the impact of urbanization on storm runoff in a peri-urban catchment using historical change in impervious cover. J. Hydrol. 2014, 515, 59–70. [Google Scholar] [CrossRef] [Green Version]
  50. Cabrera, J.F.; Najarian, J.C. Can new urbanism create diverse communities? J. Plan. Educ. Res. 2013, 33, 427–441. [Google Scholar] [CrossRef]
  51. Dierwechter, Y. The spaces that smart growth makes: Sustainability, segregation, and residential change across Greater Seattle. Urban Geogr. 2014, 35, 691–714. [Google Scholar] [CrossRef]
  52. Miles, R.; Song, Y. “Good” neighborhoods in Portland, Oregon: Focus on both social and physical environments. J. Urban Aff. 2009, 31, 491–509. [Google Scholar] [CrossRef]
  53. Wey, W.M.; Hsu, J. New Urbanism and Smart Growth: Toward achieving a smart National Taipei University District. Habitat Int. 2014, 42, 164–174. [Google Scholar] [CrossRef]
  54. Yin, K.; Wang, R.S.; An, Q.X.; Yao, L.; Liang, J. Using eco-efficiency as an indicator for sustainable urban development: A case study of Chinese provincial capital cities. Ecol. Indic. 2014, 36, 665–671. [Google Scholar] [CrossRef]
  55. Huppes, G.; Ishikawa, M. Why eco-efficiency? J. Ind. Ecol. 2005, 9, 2–5. [Google Scholar] [CrossRef]
  56. Bosetti, V.; Locatelli, G. A data envelopment analysis approach to the assessment of natural parks’ economic efficiency and sustainability. The case of Italian national parks. Sustain. Dev. 2006, 14, 277–286. [Google Scholar] [CrossRef]
  57. Pauleit, S.; Ennos, R.; Golding, Y. Modeling the environmental impacts of urban land use and land cover change—A study in Merseyside, UK. Landsc. Urban Plan. 2005, 71, 295–310. [Google Scholar] [CrossRef]
  58. Hoppe, P. Different aspects of assessing indoor and outdoor thermal comfort. Energy Build. 2002, 34, 661–665. [Google Scholar] [CrossRef]
  59. Svensson, M.K.; Eliasson, I. Diurnal air temperatures in built-up areas in relation to urban planning. Landsc. Urban Plan. 2002, 61, 37–54. [Google Scholar] [CrossRef]
  60. Hirzel, A.H.; Hausser, J.; Chessel, D.; Perrin, N. Ecological-niche factor analysis: How to compute habitat-suitability maps without absence data? Ecology 2002, 83, 2027–2036. [Google Scholar] [CrossRef]
  61. Interlandi, S.J.; Crockett, C.S. Recent water quality trends in the Schuylkill River, Pennsylvania, USA: A preliminary assessment of the relative influences of climate, river discharge and suburban development. Water Res. 2003, 37, 1737–1748. [Google Scholar] [CrossRef]
  62. United States Geological Survey. 2007 Landsat Thematic Mapper Satellite Image. Available online: http://glovis.usgs.gov/ (accessed on 10 January 2010).
  63. National Land Surveying and Mapping Center. 2007 Land Use Investigation of Taiwan; National Land Surveying and Mapping Center: Taipei, Taiwan, 2009. [Google Scholar]
  64. Taiwan Water Corporation. 2007 Annual Consumption of Water for Villages; Taiwan Water Corporation: Taipei, Taiwan, 2009. [Google Scholar]
  65. Department of Household Registration of the Ministry of the Interior. 2007 Population for Villages; Ministry of the Interior: Taipei, Taiwan, 2008.
  66. Directorate General of Budget, Accounting and Statistics. 2006 Industry, Commerce and Service Census; Directorate General of Budget, Accounting and Statistics: Taipei, Taiwan, 2008.
  67. Financial Data Center of the Ministry of Finance. 2007 Family Income Statistics; Ministry of Finance: Taipei, Taiwan, 2009.
  68. Institute of Transportation of the Ministry of Transportation and Communications. 2007 Database of the Traffic Network Digital Map; Ministry of Transportation and Communications: Taipei, Taiwan, 2009.
  69. Thanassoulis, E. A comparison of regression-analysis and data envelopment analysis as alternative methods for performance assessments. J. Oper. Res. Soc. 1993, 44, 1129–1144. [Google Scholar] [CrossRef]
  70. Bevilacqua, M.; Braglia, M. Environmental efficiency analysis for ENI oil refineries. J. Clean. Prod. 2002, 10, 85–92. [Google Scholar] [CrossRef]
  71. Huang, J.H.; Yang, X.G.; Cheng, G.; Wang, S.Y. A comprehensive eco-efficiency model and dynamics of regional eco-efficiency in China. J. Clean. Prod. 2014, 67, 228–238. [Google Scholar] [CrossRef]
  72. Lauwers, L. Justifying the incorporation of the materials balance principle into frontier-based eco-efficiency models. Ecol. Econ. 2009, 68, 1605–1614. [Google Scholar] [CrossRef]
  73. Coelli, T. A multi-stage methodology for the solution of orientated DEA models. Oper. Res. Lett. 1998, 23, 143–149. [Google Scholar] [CrossRef]
  74. De Koeijer, T.J.; Wossink, G.A.A.; Struik, P.C.; Renkema, J.A. Measuring agricultural sustainability in terms of efficiency: The case of Dutch sugar beet growers. J. Environ. Manag. 2002, 66, 9–17. [Google Scholar] [CrossRef]
  75. Dyckhoff, H.; Allen, K. Measuring ecological efficiency with data envelopment analysis (DEA). Eur. J. Oper. Res. 2001, 132, 312–325. [Google Scholar] [CrossRef]
  76. Ezcurra, R.; Iraizoz, B.; Rapun, M. Regional efficiency in the European Union. Eur. Plan. Stud. 2008, 16, 1121–1143. [Google Scholar] [CrossRef]
  77. Hernandez-Sancho, F.; Picazo-Tadeo, A.; Reig-Martinez, E. Efficiency and environmental regulation—An application to Spanish wooden goods and furnishings industry. Environ. Resour. Econ. 2000, 15, 365–378. [Google Scholar] [CrossRef]
  78. Victor, D.; Agamuthu, P. Strategic environmental assessment policy integration model for solid waste management in Malaysia. Environ. Sci. Policy 2013, 33, 233–245. [Google Scholar] [CrossRef]
  79. White, L.; Noble, B.F. Strategic environmental assessment for sustainability: A review of a decade of academic research. Environ. Impact Assess. Rev. 2013, 42, 60–66. [Google Scholar] [CrossRef]
  80. Camagni, R. Territorial Impact Assessment for European regions: A methodological proposal and an application to EU transport policy. Eval. Program Plan. 2009, 32, 342–350. [Google Scholar] [CrossRef] [PubMed]
  81. Golobic, M.; Marot, N. Territorial impact assessment: Integrating territorial aspects in sectoral policies. Eval. Progr. Plan. 2011, 34, 163–173. [Google Scholar] [CrossRef] [PubMed]
  82. Alonso, W. The economics of urban size. Pap. Reg. Sci. 1971, 26, 67–83. [Google Scholar] [CrossRef]
  83. Prud’homme, R.; Lee, C.W. Size, sprawl, speed and the efficiency of cities. Urban Stud. 1999, 36, 1849–1858. [Google Scholar] [CrossRef]
  84. Berke, P.; Godschalk, D.R.; Kaiser, E.J.; Rodriguez, D. Urban Land Use Planning; University of Illinois Press: Chicago, IL, USA, 2006. [Google Scholar]
  85. Knaap, G.; Talen, E. New urbanism and smart growth: A few words from the academy. Int. Reg. Sci. Rev. 2005, 28, 107–118. [Google Scholar] [CrossRef]
  86. Awuah, K.G.B.; Hammond, F.N.; Lamond, J.E.; Booth, C. Benefits of urban land use planning in Ghana. Geoforum 2014, 51, 37–46. [Google Scholar] [CrossRef]
  87. Chou, T.L.; Chang, J.Y. Urban sprawl and the politics of land use planning in urban Taiwan. Int. Dev. Plan. Rev. 2008, 30, 67–92. [Google Scholar] [CrossRef]
  88. Folmer, E.; Risselada, A. planning the neighbourhood economy: Land-use plans and the economic potential of urban residential neighbourhoods in the Netherlands. Eur. Plan. Stud. 2013, 21, 1873–1894. [Google Scholar] [CrossRef]
  89. McLaughlin, J. Urban Land Use Planning. Land Use Policy 2009, 26, 511–511. [Google Scholar] [CrossRef]
  90. Brunsdon, C.; Fotheringham, A.S.; Charlton, M.E. Geographically weighted regression: A method for exploring spatial nonstationarity. Geogr. Anal. 1996, 28, 281–298. [Google Scholar] [CrossRef]
  91. Cardozo, O.D.; Garcia-Palomares, J.C.; Gutierrez, J. Application of geographically weighted regression to the direct forecasting of transit ridership at station-level. Appl. Geogr. 2012, 34, 548–558. [Google Scholar] [CrossRef]
  92. Fotheringham, A.S.; Brunsdon, C. Local forms of spatial analysis. Geogr. Anal. 1999, 31, 340–358. [Google Scholar] [CrossRef]
  93. Li, T.; Corcoran, J.; Pullar, D.; Robson, A.; Stimson, R. A geographically weighted regression method to spatially disaggregate regional employment forecasts for South East Queensland. Appl. Spat. Anal. Policy 2009, 2, 147–175. [Google Scholar] [CrossRef]
  94. Sheehan, K.; Strager, M.; Welsh, S. Advantages of geographically weighted regression for modeling benthic substrate in two greater Yellowstone ecosystem streams. Environ. Model. Assess. 2013, 18, 209–219. [Google Scholar] [CrossRef]
  95. Fang, C.L.; Guan, X.L.; Lu, S.S.; Zhou, M.; Deng, Y. Input-output efficiency of urban agglomerations in China: An application of data envelopment analysis (DEA). Urban Stud. 2013, 50, 2766–2790. [Google Scholar] [CrossRef]
  96. Murphy, E. Urban spatial location advantage: The dual of the transportation problem and its implications for land-use and transport planning. Transp. Res. Pt. A 2012, 46, 91–101. [Google Scholar] [CrossRef]

