Article

Diversity and Abundance of Soil Animals as Influenced by Long-Term Fertilization in Grey Desert Soil, China

1
Institute of Soil Fertilizer and Agricultural Water Saving, Xinjiang Academy of Agricultural Sciences, Urumqi 830091, China
2
Xinjiang Key Laboratory of Soil and Plant Ecological Processes, College of Grassland and Environmental Sciences, Xinjiang Agricultural University, Urumqi 830052, China
3
Institute of Forestry, Xinjiang Agricultural University, Urumqi 830052, China
4
State Key Laboratory of Desert and Oasis Ecology, Xinjiang Institute of Ecology and Geography, Urumqi 830011, China
*
Authors to whom correspondence should be addressed.
Sustainability 2015, 7(8), 10837-10853; https://0-doi-org.brum.beds.ac.uk/10.3390/su70810837
Submission received: 3 June 2015 / Revised: 29 July 2015 / Accepted: 29 July 2015 / Published: 7 August 2015

Abstract

:
The relationship between soil fauna and different fertilizer management practices is of growing concern. The aim of this research was to investigate the response of soil fauna to fertilization regimes, to explore the relationships among the community of soil animals, soil moisture and crop yields. The application of organic fertilizers (i.e., sheep manure or crop residues) increased crop yields and promoted the number of individuals and species of soil fauna owing to the exogenous organic matter that fertilizers provided for the survival and development of soil fauna. Furthermore, the treatments that applied sheep manure (i.e., sheep manure only or nitrogen, phosphorus, potassium and sheep manure plus) were significantly beneficial for increasing crop yields and diversity of soil fauna compared to treatments with crop residues returned (i.e., crop residues returned only or nitrogen, phosphorus, potassium and crop residues returned to the field) (p < 0.05) due to the response of soil fauna to diverse exogenous nutrients and the effect of soil fertility. Therefore, the finding that soil fauna abundance is significantly positively correlated with soil moisture and crop yield may mean the effects of fertilizer applications on soil animals were partly masked by the soil moisture and crop yield.

1. Introduction

Soil fauna are important components of agricultural ecosystems, due to their functional roles in these processes and the provision of various ecosystem services—for example, they would accelerate the organic matter decomposition and nutrient transformation [1,2]. It is known that the application of fertilizers can enhance soil fertility and promote soil rehabilitation. However, the most profound impact of fertilizers on soil properties is their ability of changing crop yields [3]. This process will subsequently change the diversity and abundance of soil fauna by affecting the habitation environment of the soil fauna [4,5]. Therefore, the community of soil animals in croplands is closely related to fertilization regimes [6,7].
Previous research has shown the relationship between the biodiversity of soil fauna and ecosystem function in soil systems [8,9]. They also reported that long-term organic and mineral fertilization in a field experiment led to increased abundance of soil micro-arthropods (e.g., Collembola) [10]. The application of green manure herbage management effects on earthworm populations has also been reported [11]. Blanchart [12] reported that a long-term legume cover crop increased macrofauna and predatory nematode density and biomass (especially earthworms and termites). Long-term manure fertilizer increased the abundance of total nematodes, and the relative abundance of bacterivores [6]. However, long-term nutrient fertilization did not affect faunal abundances and had no such effects on community composition of Oribatida and Collembola [13]. In fact, combination of long-term organic and chemical fertilizer treatments reduced the abundance of Oribatida such as Epilohmannia sp. and Xylobates sp. [14]. These results indicate that the relationship between habit types under different fertilizer regimes and functional soil fauna plays a key role in ecological sustainability in agriculture. Although the relationship between soil fauna and long-term fertilization regimes has received sustained attention, there are few studies on grey desert soils. The fact that the changes in the crop yields makes them sustainable to obtain the response of soil fauna to fertilization regimes. Belonging to weathered soils, they are typically managed with little external input, which contributes to nutrient-poor soils under a typical continental arid climate [15]. However, they are important agricultural soils in northwestern China, because as much as 52,528 square kilometers of grey desert soils are cultivated agricultural land across China and more than a quarter is in Xinjiang [16]. Long-term fertilization can inevitably cause changes in the soil fertility and productivity while maintaining and improving crop yields [17,18,19]. Soil fauna has been shown to be sensitive for sustainable processes in agriculture [20]. Therefore, this study aims to investigate the following: (1) the effects of long-term fertilization on the structure of the community of soil animals; (2) the relationship among major the community of soil animals, soil moisture, and crop yield caused by fertilization regimes.

2. Materials and Methods

2.1. Site Description, Climate Characteristics and Soil Properties

The experimental location in the grey desert soil of Xinjiang was one site of the National Long-term Monitoring Network of Soil Fertility and Fertilizer Effects, established in 1990 to investigate the effects of climate, crop rotation and application of inorganic and organic fertilizers on crop yield and soil fertility in the main agricultural areas of China. The experimental site (43°58′ N, 87°25′ E, 600 m a.s.l.) was located in the suburbs of Urumqi, Xinjiang, China, and has a typical continental arid climate [15]. The study site is typical oasis farmland with a maize-wheat-cotton crop rotation in order to keep the soil quality not affected by the crops. The mean annual precipitation is 242 mm, 70% of which falls in winter and summer. During the study period, the mean annual temperature was 7.6 °C and the lowest and highest mean monthly air temperatures were −15 °C in January and 27.2 °C in July, respectively. Sunshine time is 2454 h per year. The annual frost-free period is about 156 days. Annual evaporation is about 2570 mm [16]. The soil was classified as a grey desert soil in the Chinese classification and as a Calcaric Cambisol in the FAO soil classification [21]. The soil is a grey desert soil with percentage clay, silt and sand fractions in the top 20 cm of the soil profile of 30.3%, 52.5% and 17.2%, respectively. The main soil properties in the plough layer (0–20 cm) of the fertilizer experiment were as follows: soil pH (water:soil = 2.5:1) 8.1, organic matter 8.8 g C kg−1, total nitrogen (N) 0.87 g N kg−1, total phosphorus (P) 0.67 g P kg−1, total potassium (K) 23.0 g K kg−1, alkaline hydrolysable N 55.2 mg N kg−1, Olsen-P 3.4 mg P kg−1 and ammonium acetate (NH4OAc) extractable K 288.0 mg K kg−1. The field was wasteland before the start of the long-term experiment in April 1990.

2.2. Experimental Design

The long-term fertilization experiment was commenced in April 1990 on cropland of grey desert soil. The plots were hydrologically isolated by partition walls of depth 70 cm filled with cement to avoid unexpected species movement between the individual plots [22]. The study included 11 fertilizer treatments: (1) CK (unfertilized control); (2) N (nitrogen only); (3) NP (nitrogen and phosphorus); (4) NK (nitrogen and potassium); (5) PK (phosphorus and potassium); (6) NPK (nitrogen, phosphorus and potassium); (7) M (sheep manure only); (8) SNPK (nitrogen, phosphorus, potassium and crop residues returned to the field); (9) MNPK (nitrogen, phosphorus, potassium and sheep manure plus); (10) 1.5MNPK (nitrogen, phosphorus, potassium and 1.5 times sheep manure plus); (11) S (crop residues returned only) and; (12) CK0 (abandonment). Detailed information on the treatments is given in Table 1. Nitrogen fertilizer (as urea) was applied in two split applications, 60% N as basal fertilizer and 40% N as topdressing in the treatments. All phosphorus (P) and potassium (K) fertilizers (as calcium superphosphate and potassium sulfate, respectively), and organic fertilizers (including straw and manure) were applied as basal fertilizers. The sheep dung applied in the study area was collected from the same sheep farm. The fertilizers and manures were evenly broadcast onto the soil surface and immediately incorporated into the plowed soil (0–20 cm depth) by tillage before sowing. Drip irrigation was adopted during the experimental period. Crops were harvested close to the ground with farm machinery, and all harvested biomass was removed from the plots, with little or no crop residues returned to the land except in the SNPK treatment. Each fertilizer treatment had three field replications and the sampling was in a randomized complete block design. The experimental plot covered an area of 468 m2 and crop yields were determined from the whole plot area. The long-term experiment was conducted during 1990–2014 [15].
Table 1. Treatments and application rates of mineral fertilizers, organic manure and straw in a long-term fertilization experiment in grey desert area.
TreatmentSheep manure (kg ha−1)Straw (kg ha−1)N (kg ha−1)P2O5 (kg ha−1)K2O (kg ha−1)
CK00000
CK000000
N00241.500
NP00241.5138.00
NK00241.5058.5
PK000138.058.5
NPK00241.5138.058.5
M60,0000000
S04500–9000000
SNPK04500–9000216.7116.652.0
MNPK30,000084.951.412.4
1.5 MNPK60,0000151.890.419.0
Treatments represent habit types labeled as: unfertilized control (CK), nitrogen only (N), nitrogen and phosphorus (NP), nitrogen and potassium (NK), phosphorus and potassium (PK), nitrogen, phosphorus and potassium (NPK), sheep manure only (M), nitrogen, phosphorus, potassium and crop residues returned to the field (SNPK), nitrogen, phosphorus, potassium and sheep manure plus (MNPK), nitrogen, phosphorus, potassium and 1.5 times sheep manure plus (1.5MNPK), crop residues returned only (S), abandonment (CK0).

2.3. Sampling Methods

Soil samples were taken from the plough layer (0–20 cm) at 10 places in each treatment plot and mixed thoroughly, then air-dried, sieved through a 2.0 mm sieve and stored for analysis. Soil organic matter (SOM) was analyzed by dichromate oxidation and titration using ferrous ammonium sulfate. Soil samples for moisture were taken from each treatment at earring stage and filling stages of winter wheat (Triticum aestivum L.) in 2014. Five soil cores with 3 cm diameter were randomly collected to 20 cm depth from areas within 1.5 m of the edge after harvested and the soil moisture was determined gravimetrically after being kept at 105 °C for 24 h [23]. The wheat plant samples were collected before harvest time. There were three points for each fertilization treatment and per point was 1 m2 quadrat included more than 50 wheat plants, which weigh fresh weight and dry weight of wheat for calculating the crop yield of wheat. The soil pH (water:soil at 2.5:1), available N (alkaline diffusion method), Olsen-P (0.5 mol/L sodium bicarbonate (NaHCO3) at pH 8.5 extractable P) and available K (1 mol/L ammonium acetate (NH4OAc) extractable K) in the samples were analyzed [24]. Total N and, P in soil were analyzed using the micro-Kjeldahl digestion and, colorimetric analysis, respectively [24].
For the soil fauna studying, soil samples were collected in the earring and filling stage of the winter wheat (Triticum aestivum L.) in 2014. Three replication soil samples were collected from each plot. Soil samples were collected using a self-regulating geotome (5 cm depth, 100 cm3 for soil hygrocolous fauna and 200 cm3 for the dry soil fauna). Macrofauna were collected by hand-sorting on site and preserved in 70% alcohol, then the collected fauna samples were extracted by the modified Tullgren funnel method in the laboratory [25,26]. The soil samples remained in the steel cylinders during the extraction and the funnels were equipped with sieves of 2 and 0.5 mm for dry and hygrocolous soil fauna, respectively. A standard 60W filament bulb, regulated with a dimmer switch, was used for extraction with light intensity gradually increased during the extraction process. Soil fauna was collected in small plastic bottles filled with 75% alcohol. Finally, the soil fauna were identified and counted under a binocular dissecting microscope equipped with double-tube anatomical lenses [25,26].

2.4. Data Analysis

Dominant groups (the group with proportion of individual numbers representing over 10% of the total sample) and common groups (the group with proportion of individual numbers representing 1%–10% of the total sample) were sorted as follows: Nematodes, Oribatida, Mesostigmata, Onychiuridae, Entomobryidae, Formicidae, Aphididae, Staphylinidae, Scaphidiidae, Lycosidae and, Oonopidae. Soil fauna community diversity was quantified using the Shannon-Wiener index (H’), Pielou evenness index (J) and, Margalef richness index (d) [27,28,29]. Non-metric multidimensional scaling (non-metric-MDS), another nonlinear iteration ordination technique developed recently, was widely used and adapted to analyze nonlinear data structure [30] using Euclidean distance calculated for each fertilization distance coefficient matrix in two-dimensional space using non-metric multidimensional scaling model fits from the coefficient matrix of each fertilizer treatment. This matrix was then subjected to MDS. MDS analysis of such a matrix produces a map where some grades that were often sorted together appear close together and those that were rarely sorted together appear far apart on that map. The relationship at the series grade would be indicated primarily by ecological analysis, which had been completed by separated lattices of sample components themselves, and the stress indicated the dissimilarity defined between the initial axis defined by non-metric-MDS and truth value to a certain extent, and the stress was thought to be coinciding very well with each other when it was less than 0.1000 [22]. The method of principal component analysis (PCA) was used to analyze how the major the community of soil animals were influenced by habit types under different fertilizer regimes. The analytical program CANOCO for Windows 4.5 was used [31].
Descriptive statistics of the data (e.g., application rate of N fertilizer, Olsen-P and sheep manure, etc.) for the long-term monitoring experiment site were obtained using Excel software (Microsoft Corporation, 2010). In the case of non-homogeneity of variances, data were log-transformed (x + 1) before further analysis. The data of the abundance and biodiversity indices among different fertilizer plots for ANOVA and path analysis were normalized log (x + 1) if required. Statistical significance was determined at p = 0.05 and levels of significance among the different treatments (including the fallow) were evaluated using Tukey’s post hoc multiple comparisons test. The data were analyzed for homogeneity of variance using Levene’s test of equality for error variances and asymmetry. Statistical analysis was conducted using SPSS 19.0 software [32].

3. Results

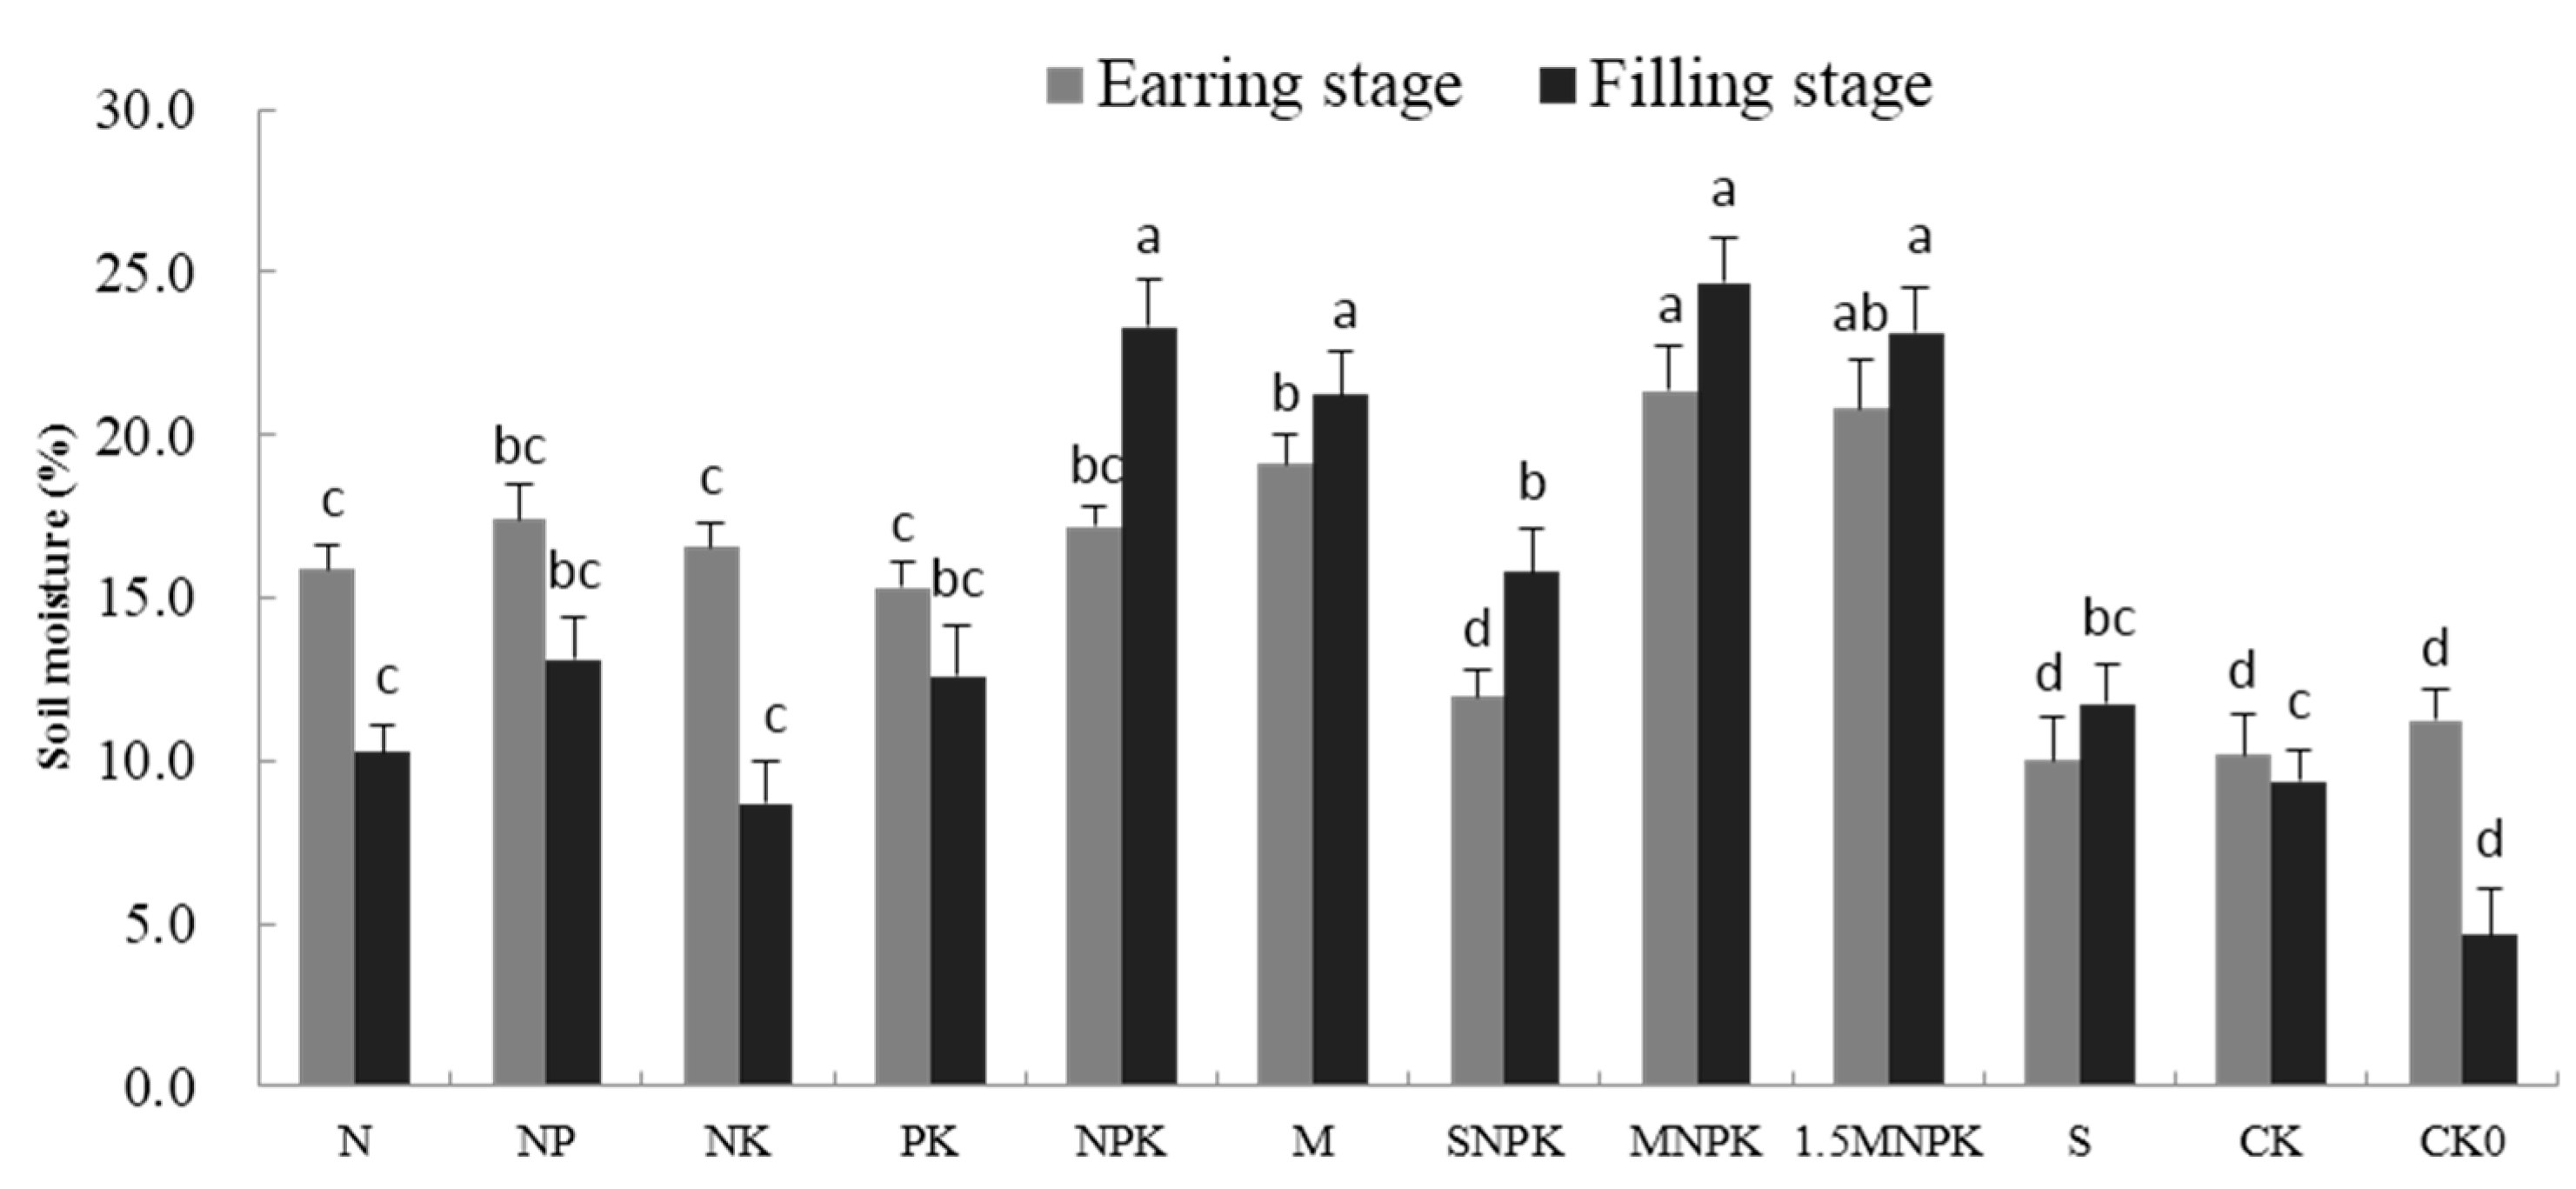
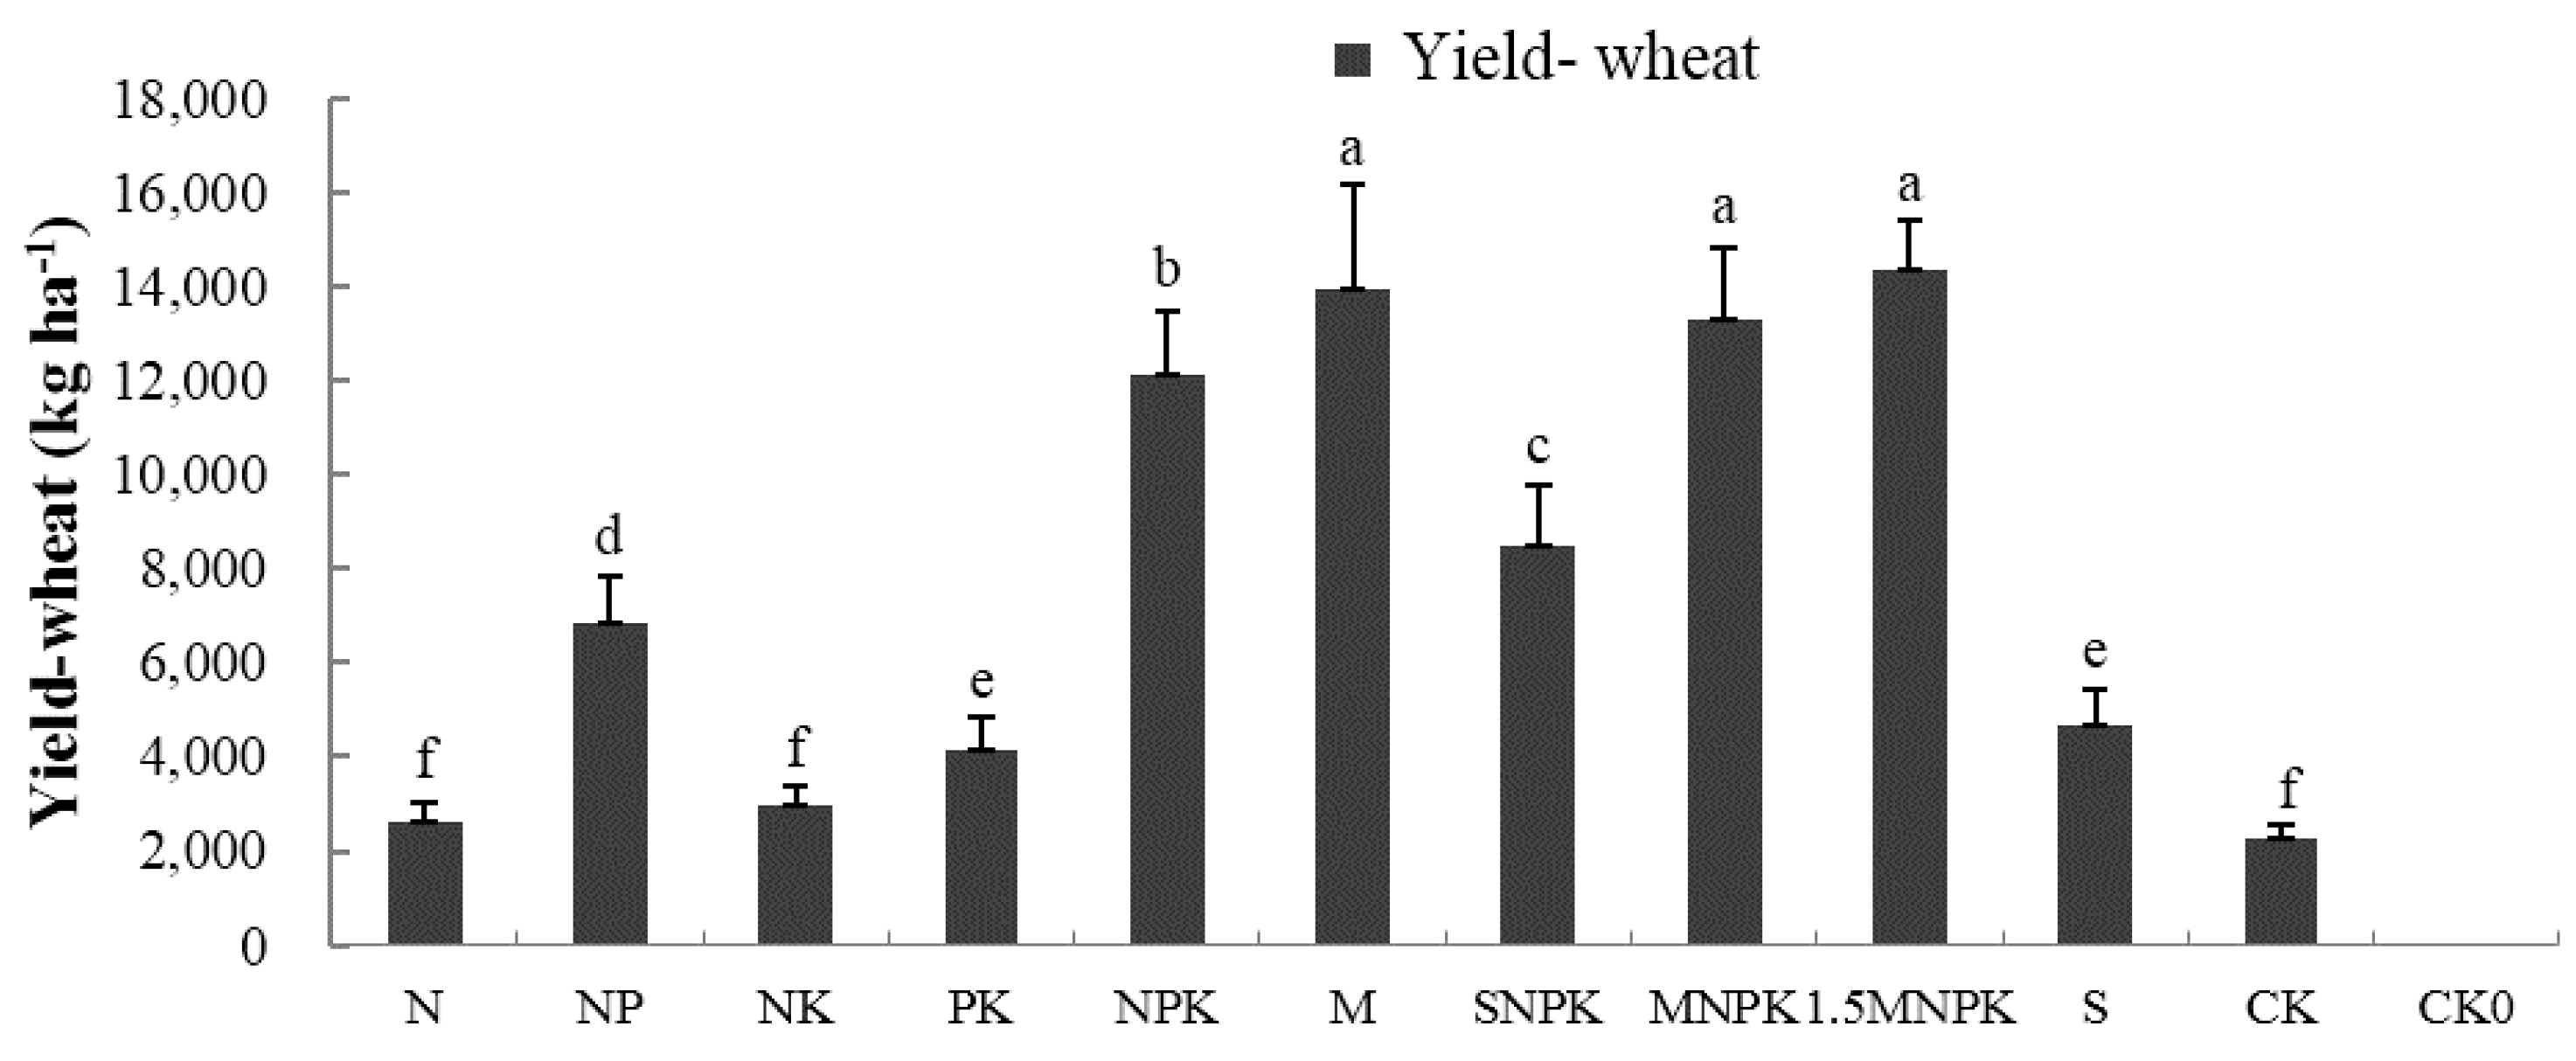
3.1. The Impact of Fertilization on the Soil Moisture and Crop Yield

The highest soil moisture content was found in the MNPK treatment and the lowest one was found in the S and Abandonment treatments at the earring and filling stages, respectively. The soil moisture content was significantly higher in the M and MNPK fertilizer treatments than those in the N, PK, S and SNPK treatments at the earring and filling stages (p < 0.05, Figure 1). However, the other fertilizer treatments showed no significant difference in soil moisture contents (p > 0.05, Figure 1).
Figure 1. Soil moisture content of grey desert soil under different fertilization treatments. Treatments with the same letters (a or b) are not significantly different (ANOVA with LSD test, p > 0.05).
Sustainability 07 10837 g001
The yields of wheat for different fertilizer treatments are showed in Figure 2. The crop yields of the treatments with the long-term application of organic sheep manure (i.e., M and MNPK) had a higher impact level than those obtained from the treatments with other fertilization regimes (i.e., N, NPK, SNPK and S et al. (p < 0.05), Figure 2). The crop yields in the N, NP, PK and NK treatments were less impacted, not achieving statistically significant levels. Thus, these results indicated that the crop yields were significantly influenced by habit types under different fertilizer regimes. The combined application of NPK fertilizers with organic manure was an important fertilization technique in enhancing the crop yield and maintaining the quality of grey desert soil.
Figure 2. The yields of wheat for different fertilization treatments. Treatments with the same letters (a or b) are not significantly different (ANOVA with LSD test, p > 0.05).
Sustainability 07 10837 g002

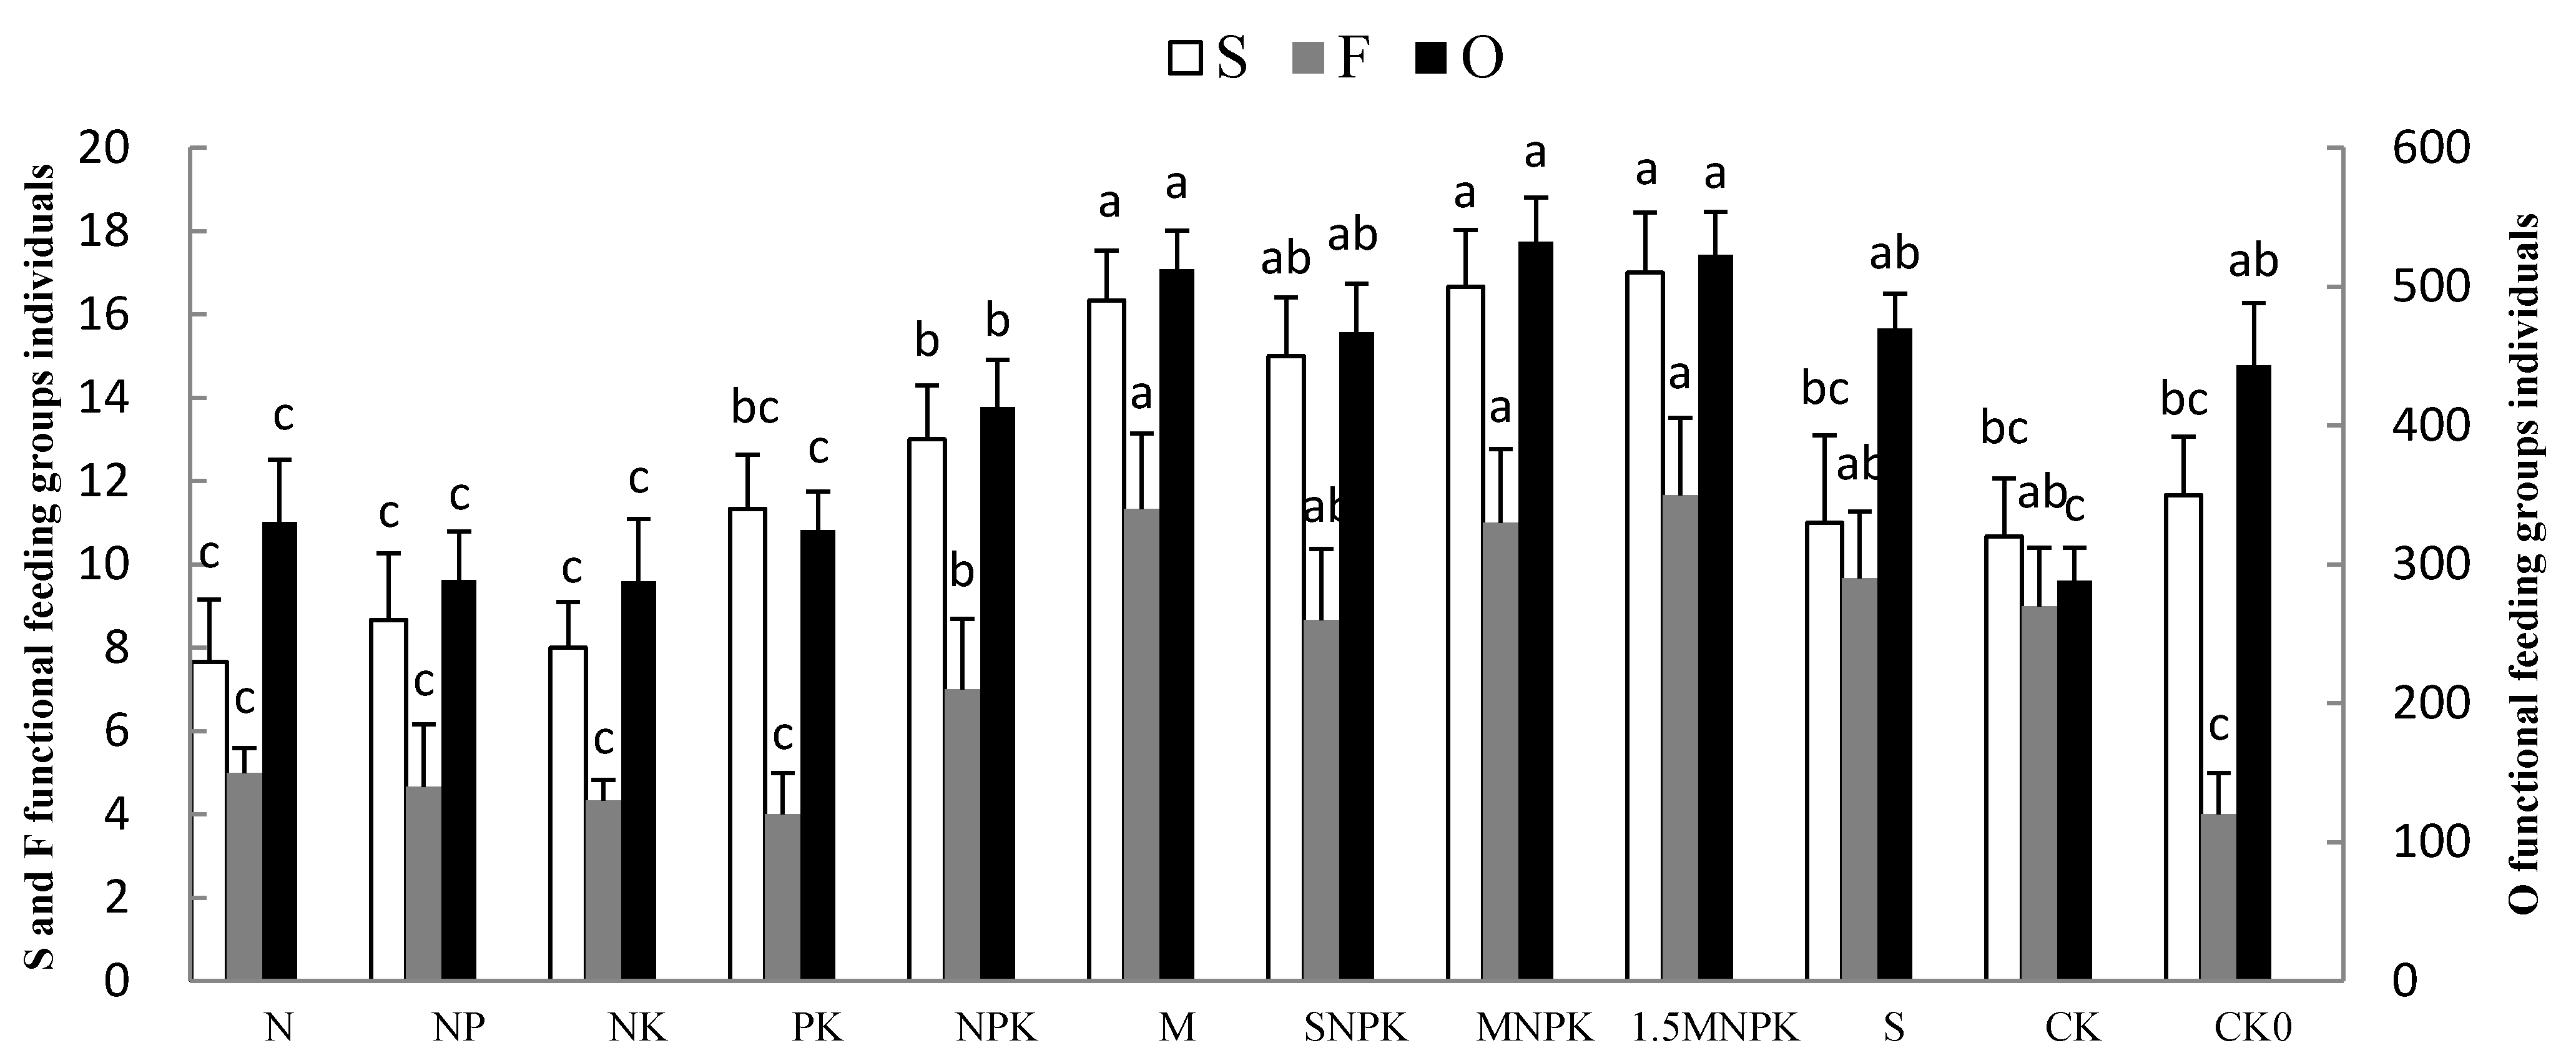
3.2. The Impact of Fertilization on Soil Fauna Community Structure and Diversity

There were 17,788 individuals, belonging to 15 orders and 35 families, obtained from 108 soil samples and 120 pitfall traps collected in 12 plots. There were 29 families of macro fauna, with common groups Formicidae, Aphididae, Staphylinidae, Scaphidiidae, Lycosidae and Oonopidae, representing 3.29%, 1.15%, 2.48%, 1.52%, 1.52% and 2.12% of the total of fauna individuals, respectively. The meso and micro fauna were Nematodes, Oribatida, Prostigmata, Mesostigmata, Onychiuridae, Entomobryidae, Ceratocombidae, Projapygidae, and Scutigerellidae. The dominant group was Nematodes and Oribatida, which account for 60.55% and 12.64% of the total fauna, respectively. Common groups were Mesostigmata, Onychiuridae and Entomobryidae, which were 5.41%, 4.40% and 1.42% of the total of fauna individuals, respectively. The highest numbers of individuals and abundance of soil fauna community were found in the 1.5 MNPK treatment (Table 2). Compared with NPK and N, the numbers of individuals and species of soil fauna were higher in the M, S, MNPK and SNPK treatments. The application of organic materials (i.e., sheep manure or crop residues) tended to increase the number of individuals in the soil fauna (Table 2).
Figure 3. Saprozoic (S), fungivorous (F) and omnivorous (O) members of the soil fauna community (mean ± standard error). Treatments with the same letters (a or b) are not significantly different (ANOVA with LSD test, p > 0.05).
Sustainability 07 10837 g003
Six types of guilds were gathered, which included omnivores, saprozoic, phytophages, fungivores, predators and cadavericoles, of which those of omnivores, predators and saprozoic were greater than the others, accounting for 88.46, 4.83 and 3.68% of the total guilds, respectively (Table 2). Saprozoic, fungivores and omnivores of soil fauna were significantly higher in the M, MNPK and SNPK than in the NPK and N treatments (p < 0.05), whereas the other fertilization regimes showed no significant differences (p > 0.05) (Figure 3).
Table 2. The total number of individuals of soil fauna community in the different fertilization regimes.
TaxaSizeNNPNKPKNPKMSNPKMNPK1.5 MNPKSCKCK0Pet.Deg.Gu.
NematodesMeso/micro6786416316639731235112512951256113364449760.55***O
OribatidaMeso/micro25315716225016318317017818216814623612.64***O
ProstigmataMeso/micro62125 27 8320.21 O
MesostigmataMeso/micro58534447122134881431523837465.41**O
Collembola
OnychiuridaeMeso/micro11131411384938525042134524.40**O
EntomobryidaeMeso/micro587417182226341311871.42**O
Thysanoptera
PhlaeothripidaeeMacro 112157119527217190.75 S
Hymenoptera
FormicidaeMacro4547494648524645465351583.29**O
FormicinaeMacro 1355522311821140.50 O
Homoptera
AphididaeMacro2515681627451115521111.15**Ph
Coleoptera
NitidulidaeMacro 1 131 2 10.05 S
Nitidulidae larva 510 3 0.10
StaphylinidaeMacro2326243439494550513332352.48**S
Staphylinidae larva 2 0.01
ScaphidiidaeMacro1514131221342633352927121.52**F
ScarabaeidaeMacro 12123231 10.09 Ph
LucanidaeMacro1 813 31 0.10 S
CarabidaeMacro6222324252610.21 Pr
CicindelidaeMacro 1 0.01 Pr
SilphidaeMacro 1 1 312 310.07 Ca
CoccinellidaeMacro 4116 626 310.17 Pr/Ph
Diptera
DolichopodidaeMacro61117 21211 0.18 Pr/S
Orthoptera
CatantopidaeMacro233 2 111 0.17 Ph
GryllidaeMacro 11 1 2 30.04 Ph
Isopoda
ArmadillidiidaeMacro 2 1 1 0.02 O
Araneae
LycosidaeMacro121793714132079191622121.52**Pr
ZoridaeMacro 56 82142100.21 Pr
OonopidaeMacro 2038735252211207752.12**Pr
HeteropodidaeMacro 2132711 220.12 Pr
ProdidomidaeMacro1 1211415 1 0.10 Pr
PhilodromidaeMacro2 11 3 0.04 Pr
ZoropsidaeMacro 1 111 21 0.04 Pr
LeptonetidaeMacro4 1 0.03 Pr
LiphistiidaeMacro 11 2 0.02 Pr
OxyopidaeMacro 1 11 0.02 Pr
GnaphosidaeMacro 23 10.03 Pr
Opiliones
PhalangiidaeMacro 1 1 0.01 Pr
Hemiptera
CeratocombidaeeMeso/micro 113 11 1 0.04 Ph
Diplura
ProjapygidaeMeso/micro 1 12 0.02 O
Symphyla
ScutigerellidaeMeso/micro10 1 13111130.12 S
Total group 192527292525283127242424
Total Individuals1184105499112611499187017781973203715871054150017788
a Pet., percent; Deg., degree; Gu., guild; b Meso/micro., meso and micro fauna; Macro., macro fauna; c O, omnivores; S, saprozoic; Ph, phytophage; F, fungivorous; Pr, predators; Ca, cadavericoles; d *** dominant group; ** common group.
The indexes d, H’ and J were used to analyze the impacts of fertilization regimes on diversity of soil fauna (Figure 4). The highest d of soil fauna were for the 1.5 MNPK treatment, with an average of 4.45 ± 0.16. The highest H’ and J of soil fauna were for the M treatment, with averages of 2.73 ± 0.12 and 0.59 ± 0.06, respectively. The highest soil fauna d was obtained in the 1.5MNPK treatment and it was significantly higher than results of the other treatments, especially S and SNPK treatments (p < 0.05, Figure 4). The H’ of soil fauna was significantly higher in the M and MNPK treatments than in the NK and S treatments (p < 0.05, Figure 4), whereas the other fertilization regimes showed no significant difference (p > 0.05, Figure 4). The soil fauna J in the MNPK treatment was significantly higher than that in both the application of N and S treatments (p < 0.05, Figure 4). However, the other fertilization regimes showed no significant difference in soil fauna J (p > 0.05, Figure 4).
Figure 4. Richness, diversity and evenness of the soil fauna community (mean ± standard error). Treatments with the same letters (a or b) are not significantly different (ANOVA with LSD test, p > 0.05).
Sustainability 07 10837 g004
The number of individuals of Nematodes, Collembola (Onychiuridae and Entomobryidae), Staphylinidae, Mesostigmata, Lycosidae, and TI were significantly positively correlated with soil moisture and crop yield (Table 3). As decomposers, these soil faunas performed important functions in nutrient cycling, and they exhibited the most sensitive response to the changes in the habit types under different fertilizer regimes.
Table 3. Person correlation coefficients among main groups of soil fauna, soil moisture and crop yield.
FactorsNem.Ony.Sta.Pros.Meso.Lyco.Ent.Oono.Sca.TI.TG.
SM0.799 **0.382 **0.749 **0.0280.927 **0.665 *0.170 *−0.0620.613 *0.684 *0.448
CY-W0.855 **0.330 **0.811 **−0.1040.946 **0.727 **0.103 *0.0360.659 *0.757 **0.444
SM., soil moisture; CY-W., crop yield-wheat; Nem., Nematodes; Ony., Onychiuridae; Sta., Staphylinidae; Pros., Prostigmata; Meso., Mesostigmata; Lyco., Lycosidae; Ent., Entomobryidae; Oono., Oonopidae; Sca., Scaphidiidae; TI., total individuals; TG., total groups. * p < 0.05; ** p < 0.01.

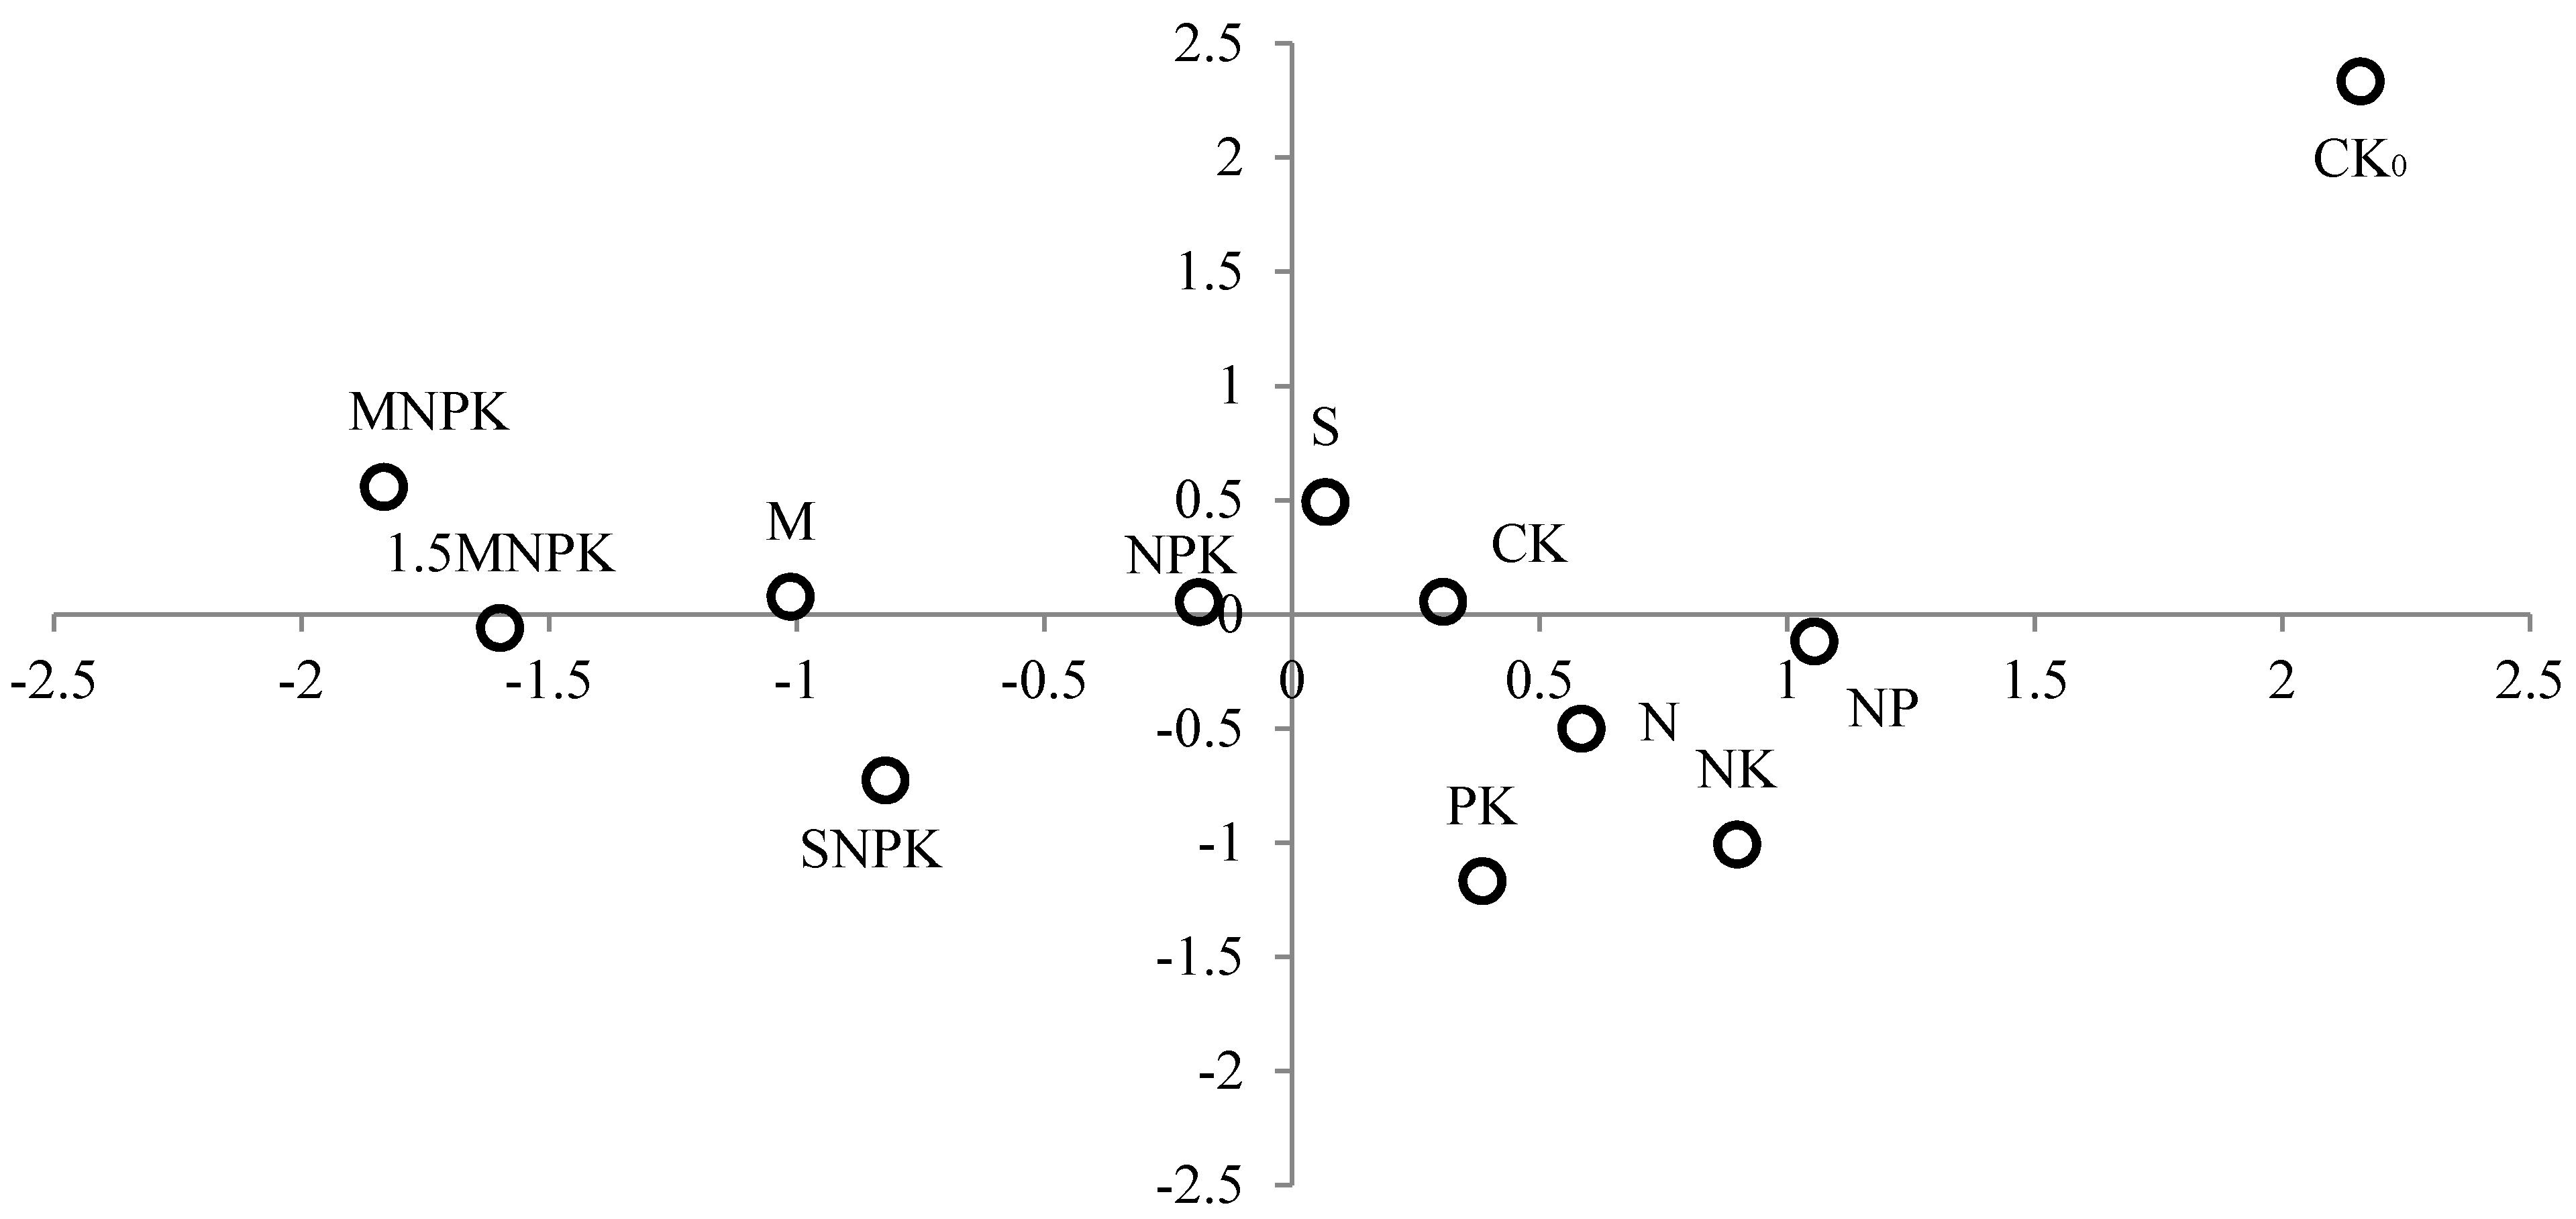
3.3. Soil Fauna Classification and Sorting

The number of dominant and common group individuals was grouped together was counted and this data formed a similarity matrix (Table 4, Figure 5). The stress value of 0.0825 (<0.1000) and the linear fit scatter plots (R2 = 0.9728) in this research showed very good matching between arable soil fauna and habit types under different fertilizer regimes and clearly indicated a good relationship in the two-dimensional non-metric multidimensional scaling (NM-MDS) ordinal configuration.
Table 4. Optimal Euclidean distance coefficient matrix of different fertilization regions.
TreatmentsNNPNKPKNPKMSNPKMNPK1.5MNPKSCKCK0
N0
NP0.9230
NK0.9510.5770
PK0.9510.9511.2470
NPK1.2470.7120.9511.3570
M2.0931.6672.0932.0930.8250
SNPK1.6661.3571.9711.6680.9510.7120
MNPK3.2112.7092.9522.7091.3751.3571.6670
1.5MNPK2.7092.2272.7092.0931.2470.7121.2471.2470
S1.6660.9510.9231.6660.7121.1571.6661.6681.6680
CK1.2470.5770.7121.3570.7121.2471.2472.0932.0930.5770
CK03.5703.2412.7093.9083.2113.9084.2714.4114.4112.7092.9520
Figure 5. The two-dimensional non-metric multidimensional scaling ordinal configuration of the soil fauna (stress = 0.0825).
Sustainability 07 10837 g005
Principal component analysis (PCA) showed that balanced fertilizer with application of organic materials had much more effect on soil fauna than synthetic fertilizer alone and there was a positive correlation trends between them.

4. Discussion

4.1. The Link between Soil Fauna and Different Fertilization Regimes

The application of sheep manure and crop residues significantly affected soil moisture and crop yield (Figure 1 and Figure 2), which in turn affected the diversity and abundance of soil fauna. Meanwhile, a higher soil fauna biodiversity were obtained when sheep manure was added to the soil (Table 2, Figure 4). The quantities of soil fauna individuals and groups in the treatment of fertilizer or/and sheep manure (M or MNPK treatment) were much larger than those in the other treatments (Table 2, Figure 4). These results may be explained by the fact that soil fauna ingested decomposed organic matter such as sheep manure with high nutrients and content of soil humus. This process, in turn, likely affected the bacterivorous (i.e., Nematodes) and fungivorous (i.e., Onychiuridae and Entomobryidae) soil fauna and increased the diversity and abundance of soil fauna [33,34], which is in accordance with the findings of this research (Table 2, Figure 3). However, compared with the results found in grey desert soil area in September 2004 in Xinjiang Province [22], the individuals and communities of soil fauna (especially Nematodes, Collembola, Oribatida and Mesostigmata) in this study were significantly increased with the combination of inorganic fertilizer and organic manure or crop residues returning. Therefore, these results indicate that the combined application of synthetic NPK fertilizers with organic manure increased crop yields greatly, which, in turn, changes the community of soil animals.
The effect of fungivorous soil fauna on agricultural productivity has been increasingly brought to attention [35]. Among the 12 treatments, the individuals of saprozoic and fungivorous soil fauna in the treatments with organic materials (M, S, MNPK and SNPK) were more than those in synthetic fertilizer treatments (N, PK and NPK et al.) (Figure 3), which was in accordance with the trends of crop yield found in the present study (Figure 2). These results indicated that saprozoic and fungivorous soil fauna were the dominant community in the grey desert soil with the treatment in this study and performed important functions in nutrient cycling, increasing the availability of nutrients [36,37] and exhibited the most sensitive response to the changes in crop yields, which was in accordance with the results found in grey desert soil area in Xinjiang Province, China [38].
All soil fauna indices in different fertilization regimes with sheep manure (treatments of M and MNPK) were significantly higher than those in synthetic fertilizer treatments only (N, PK and NPK et al.) (Table 2, Figure 4). The results showed that the decomposed organic materials may be of the utmost importance for the diversity and abundance of soil fauna, especially in the studied grey desert soil lacking soil organic matter and available soil nutrients. However, there were no significant increases in soil fauna indices between S and SNPK fertilization regimes applied with crop residues returned, which differed from the findings of purple soil [26]. Such a difference is that soil fauna attributed to the diverse exogenous nutrients [39]. Therefore, the crop yield was affected obviously in habit types under different fertilizer regimes, which leads to the changes of the community of soil animals. However, further study about the influent mechanism of soil fertility is needed.

4.2. The Link between Soil Fauna and Habit Types under Different Fertilization Regimes

There was a significant correlation among soil animals, soil moisture and crop yield in habit types under different fertilizer regimes, such as TI and the individuals’ abundance of Nematodes, Onychiuridae, Entomobryidae and Mesostigmata (Table 3, Figure 7). This result indicated that the composition and abundance of soil animals were relatively sensitive to the soil moisture and crop yield. In this study, which was carried out at the earring and filling stage of wheat, the acute day/night temperature fluctuations in grey desert soil area under a typical continental arid climate will dramatically change the soil moisture, which would affect the individuals of some high humidity found soil fauna, such as Onychiuridae and Nematodes. The crop yields of the treatments with the long-term application of organic sheep manure (i.e., M and MNPK) had a higher impact level than those fertilization regimes (i.e., N, NPK, S et al. (p < 0.05), Figure 2), indicating that M alone represents recycling and sustainable agriculture and then NPK added represent conventional, exploitative farming practice. Here, the crop yield afforded soil fauna food sources [20].
There was a good relationship between soil fauna and habit types under different fertilizer regimes (Figure 5, Figure 6 and Figure 7). The map showed the effects of fertilization with organic matters, synthetic fertilizer and crop residues returned, unbalanced fertilization on the community of soil animals, respectively. These results suggest that the distribution of soil fauna was related to characteristics of habit types under different fertilizer regimes.
The exogenous organic matter was the utmost energy source for the soil fauna, and the composition and abundance of soil fauna would change with the mineralization and decomposition of soil organic matter. A long-term fertilization experiment in the grey desert area indicated that organic fertilizer was the most effective means to improve or maintain the organic matter and crop yield [40]. In the present study, this research showed that the highest diversity and abundance of soil animals and the crop yield were in the MNPK treatment. Although these communities of soil animals showed a relatively sensitive response to changes of crop yield, these findings suggest that further studies are needed to determine whether soil fauna can be suited to the changes of soil fertility, which indicate soil fertility/quality changes in grey desert soil. Therefore, the functions soil fauna play in regard to changes in soil fertility require further study.
Figure 6. The linear fit scatter plots for the two-dimensional NM-MDS ordinal configuration (R2 = 0.9728).
Sustainability 07 10837 g006
Figure 7. Results of principal component analysis of major communities of soil fauna in association with habit types under different fertilizer regimes. Circles represent habit types labeled as a reference to Table 1. Arrows represent communities of soil fauna labeled as a reference to Table 3.
Sustainability 07 10837 g007

5. Conclusions

Long-term fertilization offers stable soil conditions for soil fauna. In this study, the communities of soil animals in grey desert soil were investigated in the National Long-term Monitoring Network of Soil Fertility and Fertilizer Effects. Balanced fertilization tended to increase the abundance of soil animals compared with no fertilizer and unbalanced fertilization such as N, NK, NP and PK. The addition of crop residues and organic sheep manure in combination with NPK substantially increased the abundance of individuals and communities. The finding that soil fauna abundance is significantly positively correlated with soil moisture and crop yield may mean the effects of fertilizer applications on soil animals were partly masked by the soil moisture and crop yield.
The grey desert soil region is an extremely arid climate, which is located on the alluvial plain of the Tianshan Mountains, and comprehensive fertilization and water management are vitally important to maintain soil fauna biodiversity as well as soil function and agricultural sustainability in this region.

Acknowledgments

The authors thank the National Natural Science Foundation of China (41361066), Xinjiang Uygur Autonomous Region Graduate Research Innovation Foundation of China (XJGRI2014077), Special Fund for Agro-scientific Research in the Public Interest of China (201203030-08-04) and the National Long-term Monitoring Network of Soil Fertility and Fertilizer Effects in Grey Desert Soil in China for providing funding for this work. We appreciate the help provided by Lin Yinhua and Lu Ping from Key Laboratory of Forest Protection, State Forestry Administration/Research Institute of Forest Ecology, Environment and Protection, Chinese Academy of Forestry and Jiangxi Academy of Sciences, in identifying soil fauna.

Author Contributions

Maibo Jiang performed research of soil fauna and wrote the paper. Xihe Wang performed the implementation of field management. Yunhao Liusui analyzed the data. Xueqing Sun performed the field sampling. Chengyi Zhao and Hua Liu designed research. All authors have read and approved the final manuscript.

Conflicts of Interest

The authors declare no conflict of interest.

References

  1. Eekeren, N.; Bommele, L.; Bloem, J.; Schouten, T.; Rutgers, M.; Goede, R.; Reheul, D.; Brussaard, L. Soil biological quality after 36 years of ley-arable cropping, permanent grassland and permanent arable cropping. Appl. Soil Ecol. 2008, 40, 432–446. [Google Scholar] [CrossRef]
  2. Xin, W.D.; Yin, X.Q.; Song, B. Contribution of soil fauna to litter decomposition in Songnen sandy lands in northeastern China. J. Arid Environ. 2012, 77, 90–95. [Google Scholar] [CrossRef]
  3. Kiba, D.I.; Zongo, N.A.; Lompo, F.; Jansa, J.; Compaore, E.; Sedogo, P.M.; Frossard, E. The diversity of fertilization practices affects soil and crop quality in urban vegetable sites of Burkina Faso. Eur. J. Agron. 2012, 38, 12–21. [Google Scholar] [CrossRef]
  4. Murray, P.J.; Cook, R.; Currie, A.F.; Dawson, L.A.; Gange, A.C.; Grayston, S.J.; Treonis, A.M. Interactions between fertilizer addition, plants and the soil environment: Implications for soil fauna structure and diversity. Appl. Soil Ecol. 2006, 33, 199–207. [Google Scholar] [CrossRef]
  5. Ayuke, F.O.; Brussaard, L.; Vanlauwe, B.; Six, J.; Lelei, D.K.; Kibunja, C.N.; Pulleman, M.M. Soil fertility management: Impacts on soil macrofauna, soil aggregation and soil organic matter allocation. Appl. Soil Ecol. 2011, 48, 53–62. [Google Scholar] [CrossRef]
  6. Li, Q.; Jiang, Y.; Liang, W.J.; Lou, Y.L.; Zhang, E.P.; Liang, C.H. Long-term effect of fertility management on the soil nematode community in vegetable production under greenhouse conditions. Appl. Soil Ecol. 2010, 46, 111–118. [Google Scholar] [CrossRef]
  7. Williams, A.; Börjesson, G.; Hedlund, K. The effects of 55 years of different inorganic fertilizer regimes on soil properties and microbial community composition. Soil Biol. Biochem. 2013, 67, 41–46. [Google Scholar] [CrossRef]
  8. Coleman, D.C.; Whitman, W.B. Linking species richness, biodiversity and ecosystem function in soil systems. Pedobiologia 2005, 49, 479–497. [Google Scholar] [CrossRef]
  9. Fu, S.L.; Zou, X.M.; Coleman, D. Highlights and perspectives of soil biology and ecology research in China. Soil Biol. Biochem. 2009, 41, 868–876. [Google Scholar] [CrossRef]
  10. Kautz, T.; Fando, C.L.; Ellmer, F. Abundance and biodiversity of soil microarthropods as influenced by different types of organic manure in a long-term field experiment in Central Spain. Appl. Soil Ecol. 2006, 33, 278–285. [Google Scholar] [CrossRef]
  11. Froseth, R.B.; Bakken, A.K.; Bleken, M.A.; Riley, H.; Pommeresche, R.; Kristensen, K.T.; Hansen, S. Effects of green manure herbage management and its digestate from biogas production on barley yield, N recovery, soil structure and earthworm populations. Eur. J. Agron. 2014, 52, 90–102. [Google Scholar] [CrossRef]
  12. Blanchart, E.; Villenave, C.; Viallatoux, A.; Barthes, B.; Girardin, C.; Azontonde, A.; Feller, C. Long-term effect of a legume cover crop (Mucuna pruriens var. utilis) on the communities of soil macrofauna and nematofauna, under maize cultivation, in southern Benin. Eur. J. Soil Biol. 2006, 42, S136–S144. [Google Scholar]
  13. Lindberg, N.; Persson, T. Effects of long-term nutrient fertilization and irrigation on the microarthropod community in a boreal Norway spruce stand. For. Ecol. Manag. 2004, 188, 125–135. [Google Scholar] [CrossRef]
  14. Cao, Z.P.; Han, X.M.; Hu, C.; Chen, J.; Zhang, D.P.; Steinberger, Y. Changes in the abundance and structure of a soil mite (Acari) community under long-term organic and chemical fertilizer treatments. Appl. Soil Ecol. 2011, 49, 131–138. [Google Scholar] [CrossRef]
  15. Wang, B.; Liu, H.; Wang, X.H.; Li, J.M.; Ma, Y.B.; Ma, X.W. Soil phosphorus accumulation model for an arid area of north-western China with 3-year rotation of wheat, maize and cotton. J. Agric. Sci. 2014. [Google Scholar] [CrossRef]
  16. Lv, J.L.; Liu, X.J.; Liu, H.; Wang, X.H.; Li, K.H.; Tian, C.Y.; Christie, P. Greenhouse gas intensity and net annual global warming potential of cotton cropping systems in an extremely arid region. Nutr. Cycl. Agroecosys. 2014, 98, 15–26. [Google Scholar] [CrossRef]
  17. Mando, A.; Ouattara, B.; Sédogo, M.; Stroosnijder, L.; Ouattara, K.; Brussaard, L.; Vanlauwe, B. Long-term effect of tillage and manure application on soil organic fractions and crop performance under Sudano-Sahelian conditions. Soil Till Res. 2005, 80, 95–101. [Google Scholar] [CrossRef]
  18. Ferro, N.D.; Charrier, P.; Morari, F. Dual-scale micro-CT assessment of soil structure in a long-term fertilization experiment. Geoderma 2013, 204–205, 84–93. [Google Scholar] [CrossRef]
  19. Naveed, M.; Moldrup, P.; Vogel, H.J.; Lamandé, M.; Wildenschild, D.; Tuller, M.; Jonge, L.W. Impact of long-term fertilization practice on soil structure evolution. Geoderma 2014, 217–218, 181–189. [Google Scholar] [CrossRef]
  20. Brussaard, L.; Pulleman, M.M.; Ouédraogo, E.; Mando, A.; Six, J. Soil fauna and soil function in the fabric of the food web. Pedobiologia 2007, 50, 447–462. [Google Scholar] [CrossRef]
  21. FAO. World Reference Base for Soils Resources; World Soil Resource Report No. 103; FAO: Rome, Italy, 2014. [Google Scholar]
  22. Lin, Y.H.; Liu, H.; Zhang, S.Q.; Zhang, F.D. The community abundance and diversity of arable soil insect community following different fertilizer treatments in Xinjiang, China. Agric. Sci. China 2008, 7, 210–216. [Google Scholar] [CrossRef]
  23. Lin, Y.H.; Lu, P.; Yang, X.Y.; Zhang, F.D. Soil insect diversity and abundance following different fertilizer treatments on the Loess Plateau of China. J. Integr. Agr. 2013, 12, 1644–1651. [Google Scholar] [CrossRef]
  24. Page, A.L.; Miller, R.H.; Keeney, D.R. Methods of soil analysis. Part 2: Chemical and Microbiological Properties; American Society of Agronomy/Soil Science Society of America: Madison, WI, USA, 1982. [Google Scholar]
  25. Yin, W.Y. Pictorial Keys to Soil Animals of China; Science Press: Beijing, China, 1998. [Google Scholar]
  26. Zhu, X.Y.; Zhu, B. Diversity and abundance of soil fauna as influenced by long-term fertilization in cropland of purple soil, China. Soil Till Res. 2014, 3321, 1–8. [Google Scholar] [CrossRef]
  27. Shannon, C.E. A mathematical theory of communication. Bell Syst. Tech. J. 1948, 27, 379–423. [Google Scholar] [CrossRef]
  28. Pielou, E.C. An Introduction to Mathematical Ecology; Wiley-Interscience: New York, NY, USA, 1969. [Google Scholar]
  29. Margalef, R. Perspectives in Ecological Theory; The University of Chicago Press: Chicago, IL, USA, 1970; pp. 111–119. [Google Scholar]
  30. Johnson, T.E.; Hasted, A.; Ristic, R.; Bastian, S.E.P. Multidimensional scaling (MDS), cluster and descriptive analyses provide preliminary insights into Australian Shiraz wine regional characteristics. Food Qual. Preference 2013, 29, 174–185. [Google Scholar] [CrossRef]
  31. Ter Braak, C.J.F. Canonical correspondence analysis: A new eigenvector technique for multivariate direct gradient analysis. Ecology 1986, 67, 1167–1179. [Google Scholar] [CrossRef]
  32. Kirkpatrick, L.A.; Feenay, B.C. A Simple Guide to SPSS for Windows, for Version 12.0; Thomson Wadsworth: Stamford, CT, USA, 2005. [Google Scholar]
  33. Briar, S.S.; Grewal, P.S.; Somasekhar, N.; Stinner, D.; Miller, S.A. Soil nematode community, organic matter, microbial biomass and nitrogen dynamics in field plots transitioning from conventional to organic management. Appl. Soil Ecol. 2007, 37, 256–266. [Google Scholar] [CrossRef]
  34. Papatheodorou, E.M.; Kordatos, H.; Kouseras, T.; Monokrousos, N.; Spiroudi, U.M.; Diamantopoulos, J.; Stamou, G.P.; Argyropoulou, M.D. Differential responses of structural and functional aspects of soil microbes and nematodes to abiotic and biotic modifications of the soil environment. Appl. Soil Ecol. 2012, 61, 26–33. [Google Scholar] [CrossRef]
  35. Li, Q.; Bao, X.L.; Lu, C.Y.; Zhang, X.K.; Zhu, J.K.; Jiang, Y.; Liang, W.J. Soil microbial food web responses to free-air ozone enrichment can depend on the ozone-tolerance of wheat cultivars. Soil Biol. Biochem. 2012, 47, 27–35. [Google Scholar] [CrossRef]
  36. Hassall, M.; Adl, S.; Berg, M.; Griffiths, B.; Scheu, S. Soil fauna-microbe interactions: Towards a conceptual framework for research. Eur. J. Soil Biol. 2006, 42, S54–S60. [Google Scholar] [CrossRef]
  37. Carrillo, Y.; Ball, B.A.; Bradford, M.A.; Jordan, C.F.; Molina, M. Soil fauna alter the effects of litter composition on nitrogen cycling in a mineral soil. Soil Biol. Biochem. 2011, 43, 1440–1449. [Google Scholar] [CrossRef]
  38. Liu, H.; Lin, Y.H.; Zhang, Y.S.; Tan, X.X.; Wang, X.H. Effects of long-term fertilization on biodiversity and enzyme activity in grey desert soil. Acta Ecol. Sin. 2008, 28, 3898–3904. [Google Scholar]
  39. Mandal, A.; Patra, A.K.; Singh, D.; Swarup, A.; Masto, R.E. Effect of long-term application of manure and fertilizer on biological and biochemical activities in soil during crop development stages. Bioresour. Technol. 2007, 98, 3585–3592. [Google Scholar] [CrossRef] [PubMed]
  40. Wang, X.H.; Liu, H.; Jia, H.T.; Jiang, P.A. Effects of long-term fertilization on soil organic matter and physical properties in grey desert. Xinjiang Agric. Sci. 2014, 51, 58–65. [Google Scholar]

