
The Environmental Sustainability of Nations: Benchmarking the Carbon, Water and Land Footprints against Allocated Planetary Boundaries


Abstract
:1. Introduction
1.1. Environmental Sustainability Assessment (ESA): A Brief Overview
1.2. Environmental Footprints: Descriptive Pressure Indicators
1.3. Planetary Boundaries: Critical Threshold Indicators
1.4. The Need for Integrating Footprints and Boundaries into ESA
2. Methods
2.1. A Footprint-Boundary ESA (F-B ESA) Framework
- Environmental sustainability: A safe state in which the footprint of human activities placed on the environment is kept within boundary of capacity.
- Environmental unsustainability: An unsafe state in which the footprint of human activities placed on the environment exceeds boundary of capacity.
2.2. Selecting Key Environmental Footprints for Cross-National Analysis
2.3. Data Sources

| Footprint Metric | Data Source | Boundary Metric | Data Source |
|---|---|---|---|
| Carbon footprint | EUREAPA 2011 [29] | Carbon boundary | IPCC 2014 [30]; PRB 2009 [31]; UNEP 2014 [32] |
| Water footprint | Mekonnen et al. 2011 [33] | Water boundary | FAO 2012 [34] |
| Land footprint | GFN 2012 [35] | Land boundary | GFN 2012 [35] |
2.4. Allocating Selected Planetary Boundaries to Nations
2.4.1. Downscaling Planetary Carbon Boundary on a Per Capita Basis
2.4.2. Quantifying National Water and Land Boundaries on a Resource Availability Basis
2.5. Measuring the Sustainability Gap: Two Alternative Indicators
- Fi,j is the converted footprint for environmental issue i for country j.
- Bi,j is the converted boundary for environmental issue i for country j.
2.5.1. Environmental Sustainability Distance (ESD)
2.5.2. Environmental Sustainability Ratio (ESR)
2.5.3. The Comparative Advantage of ESRs over ESDs in a Cross-National Context
2.5.4. Production-Based versus Consumption-Based ESR
3. Results
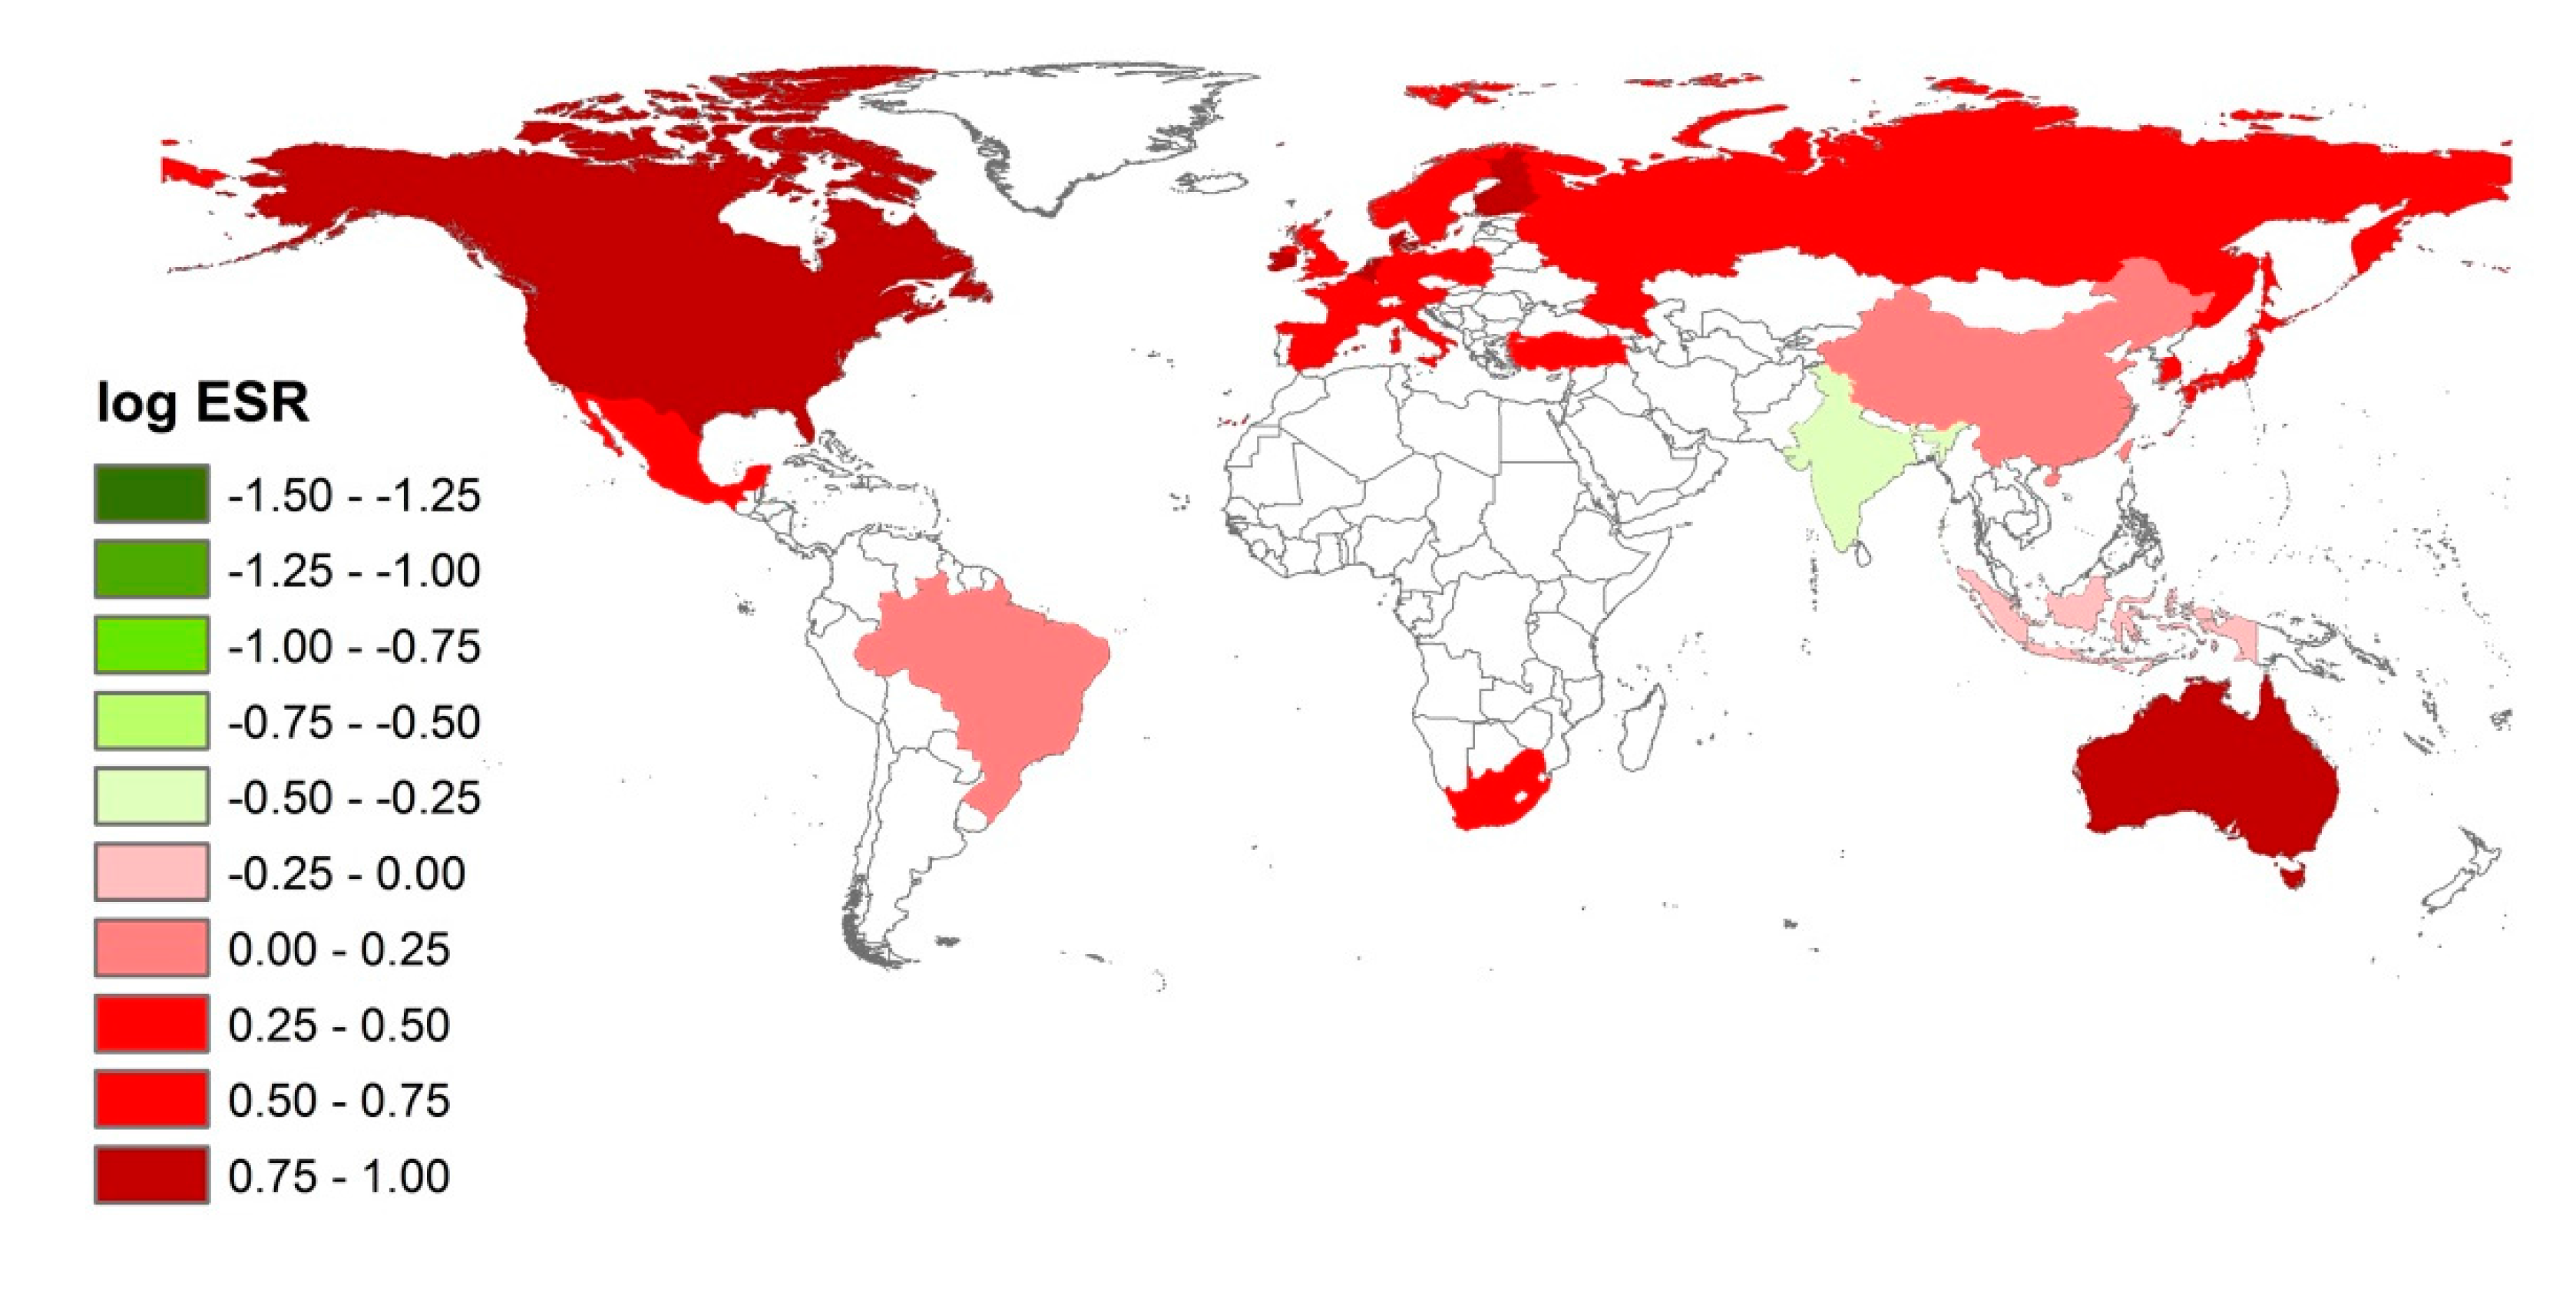
3.1. The Environmental Sustainability of National Carbon Emissions

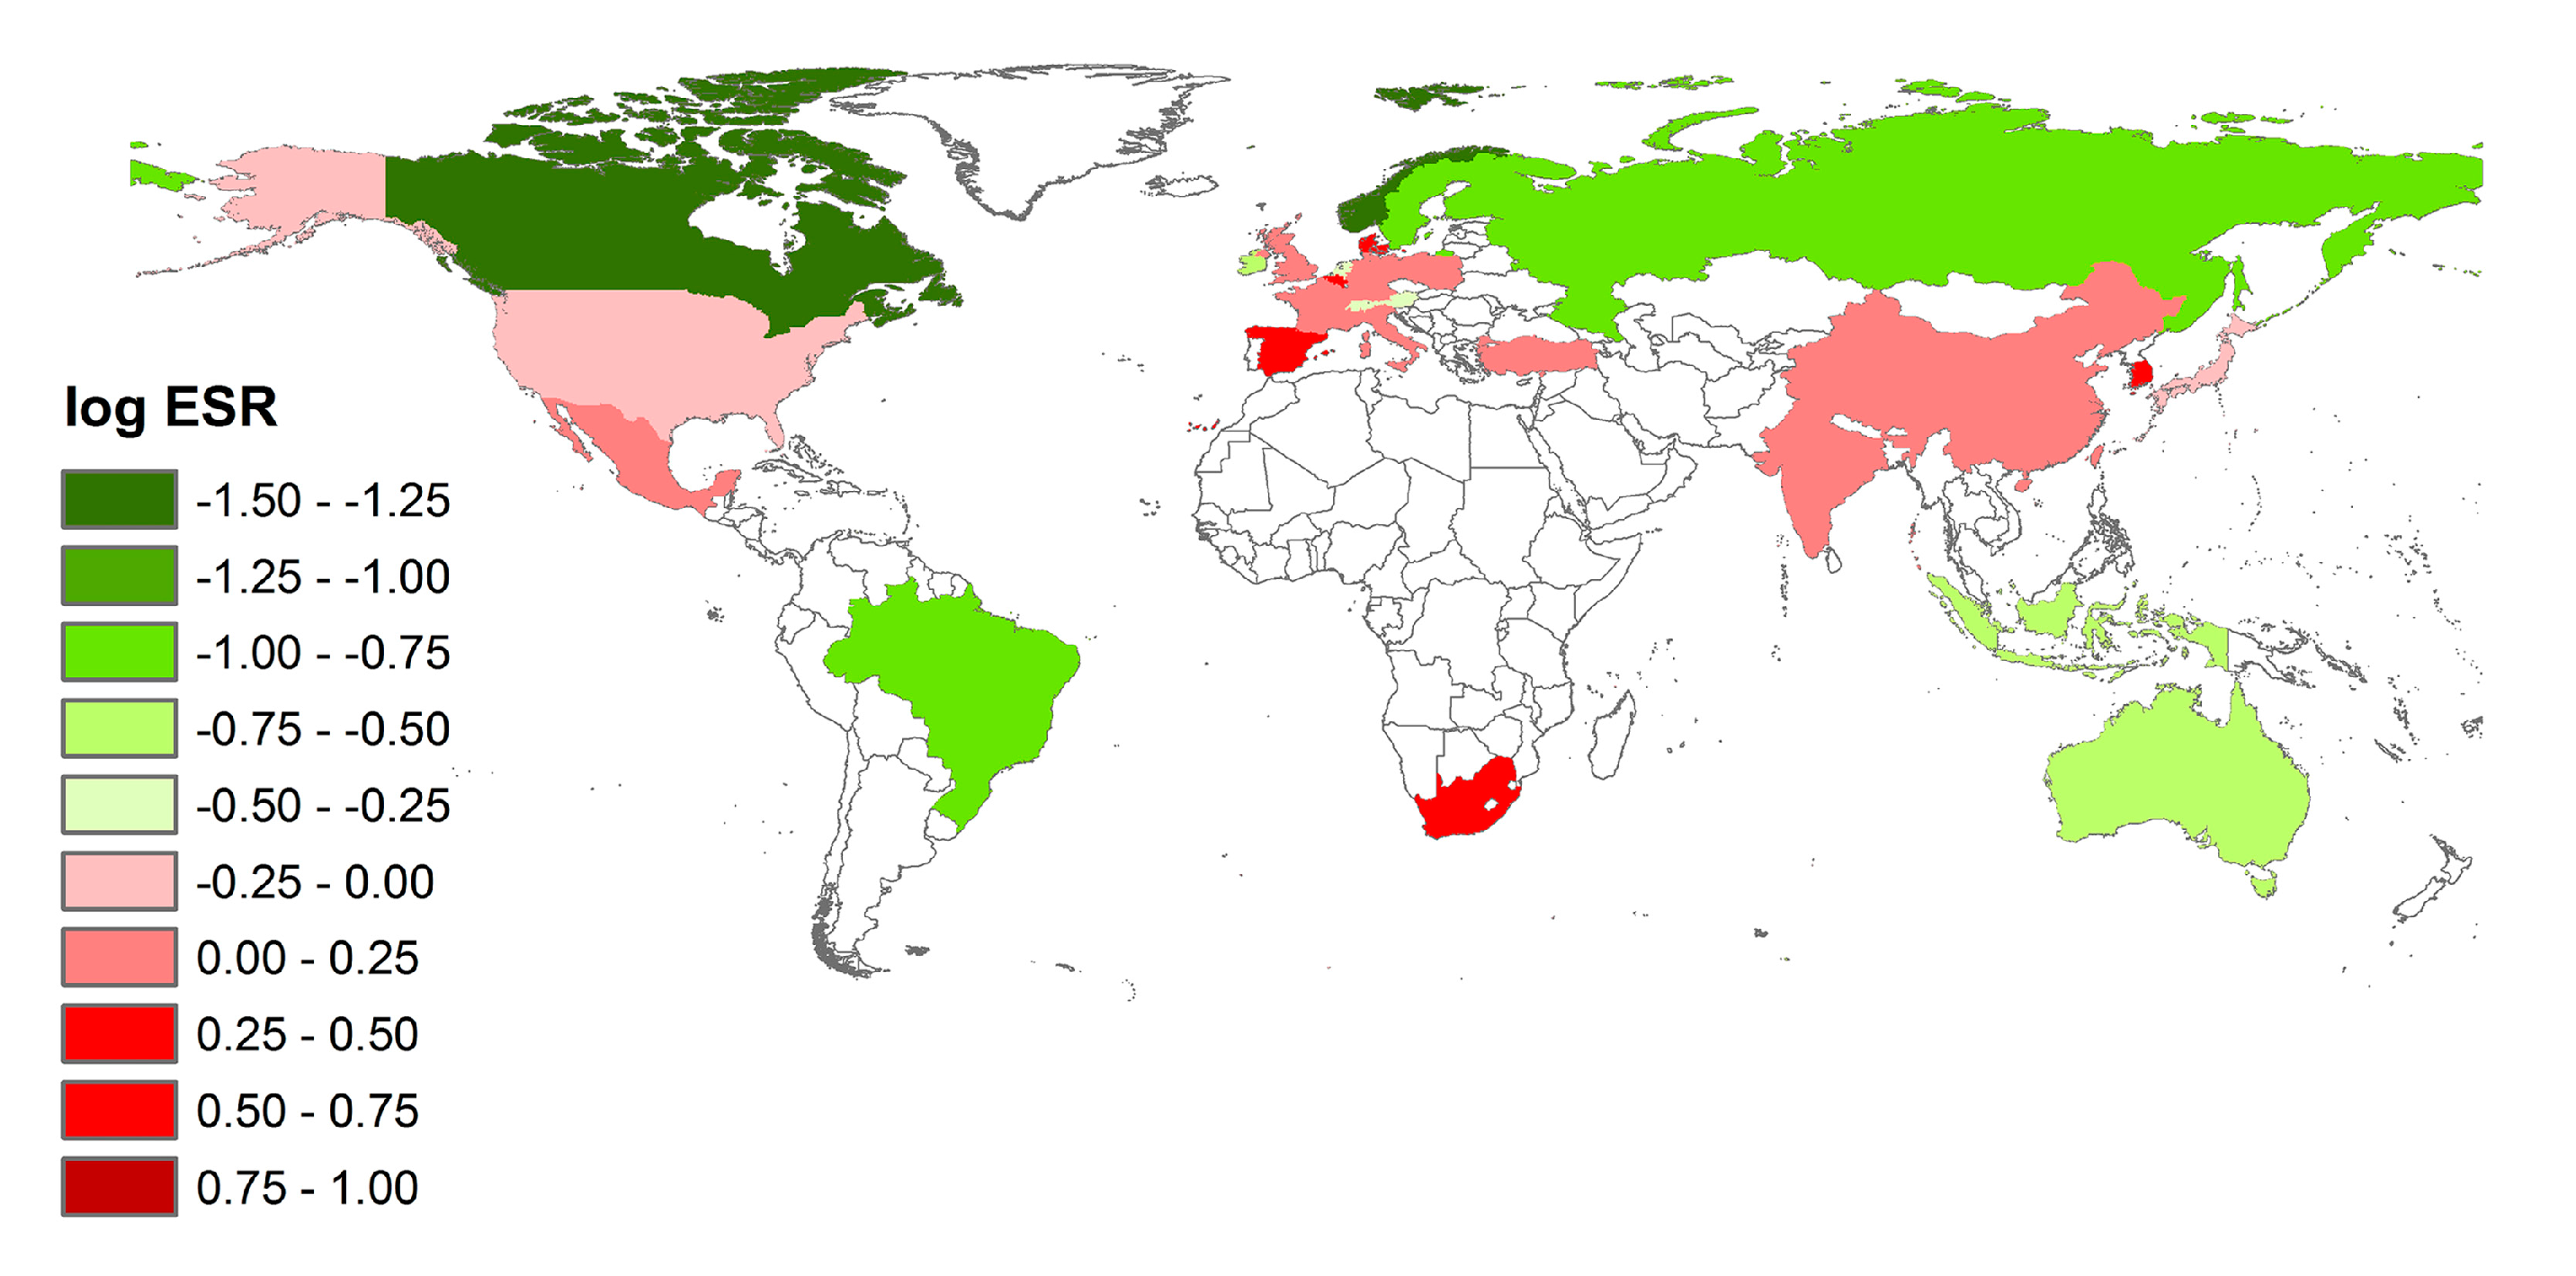
3.2. The Environmental Sustainability of National Water Use

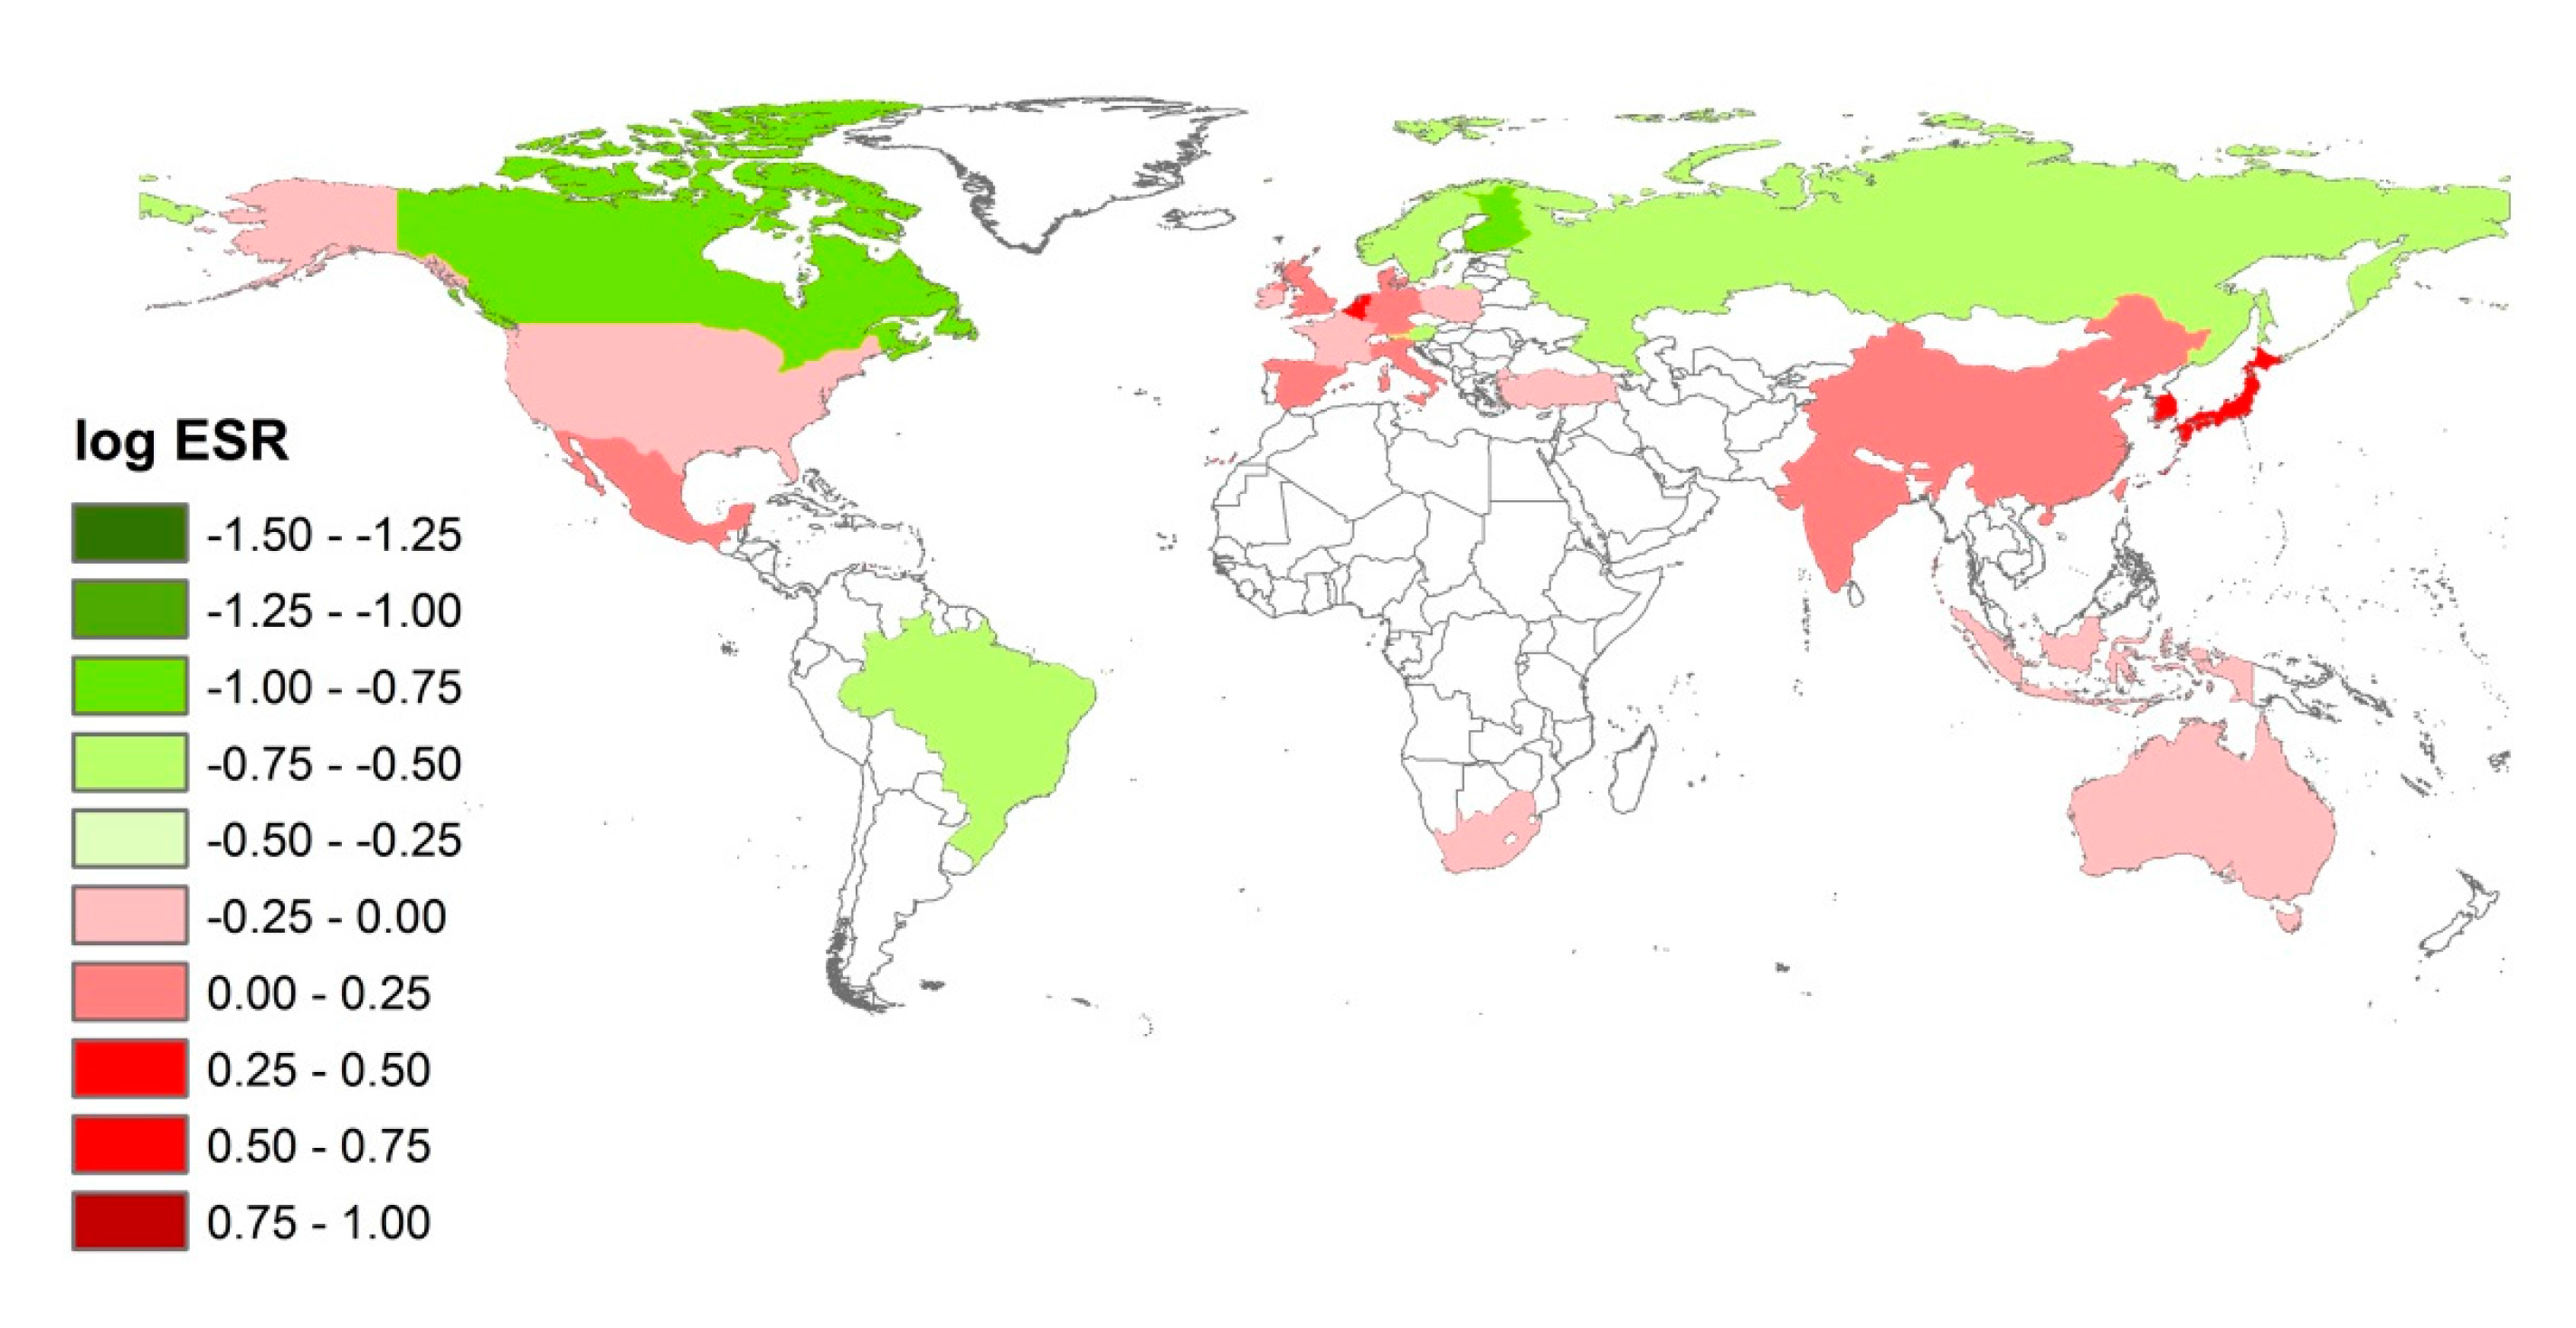
3.3. The Environmental Sustainability of National Land Use

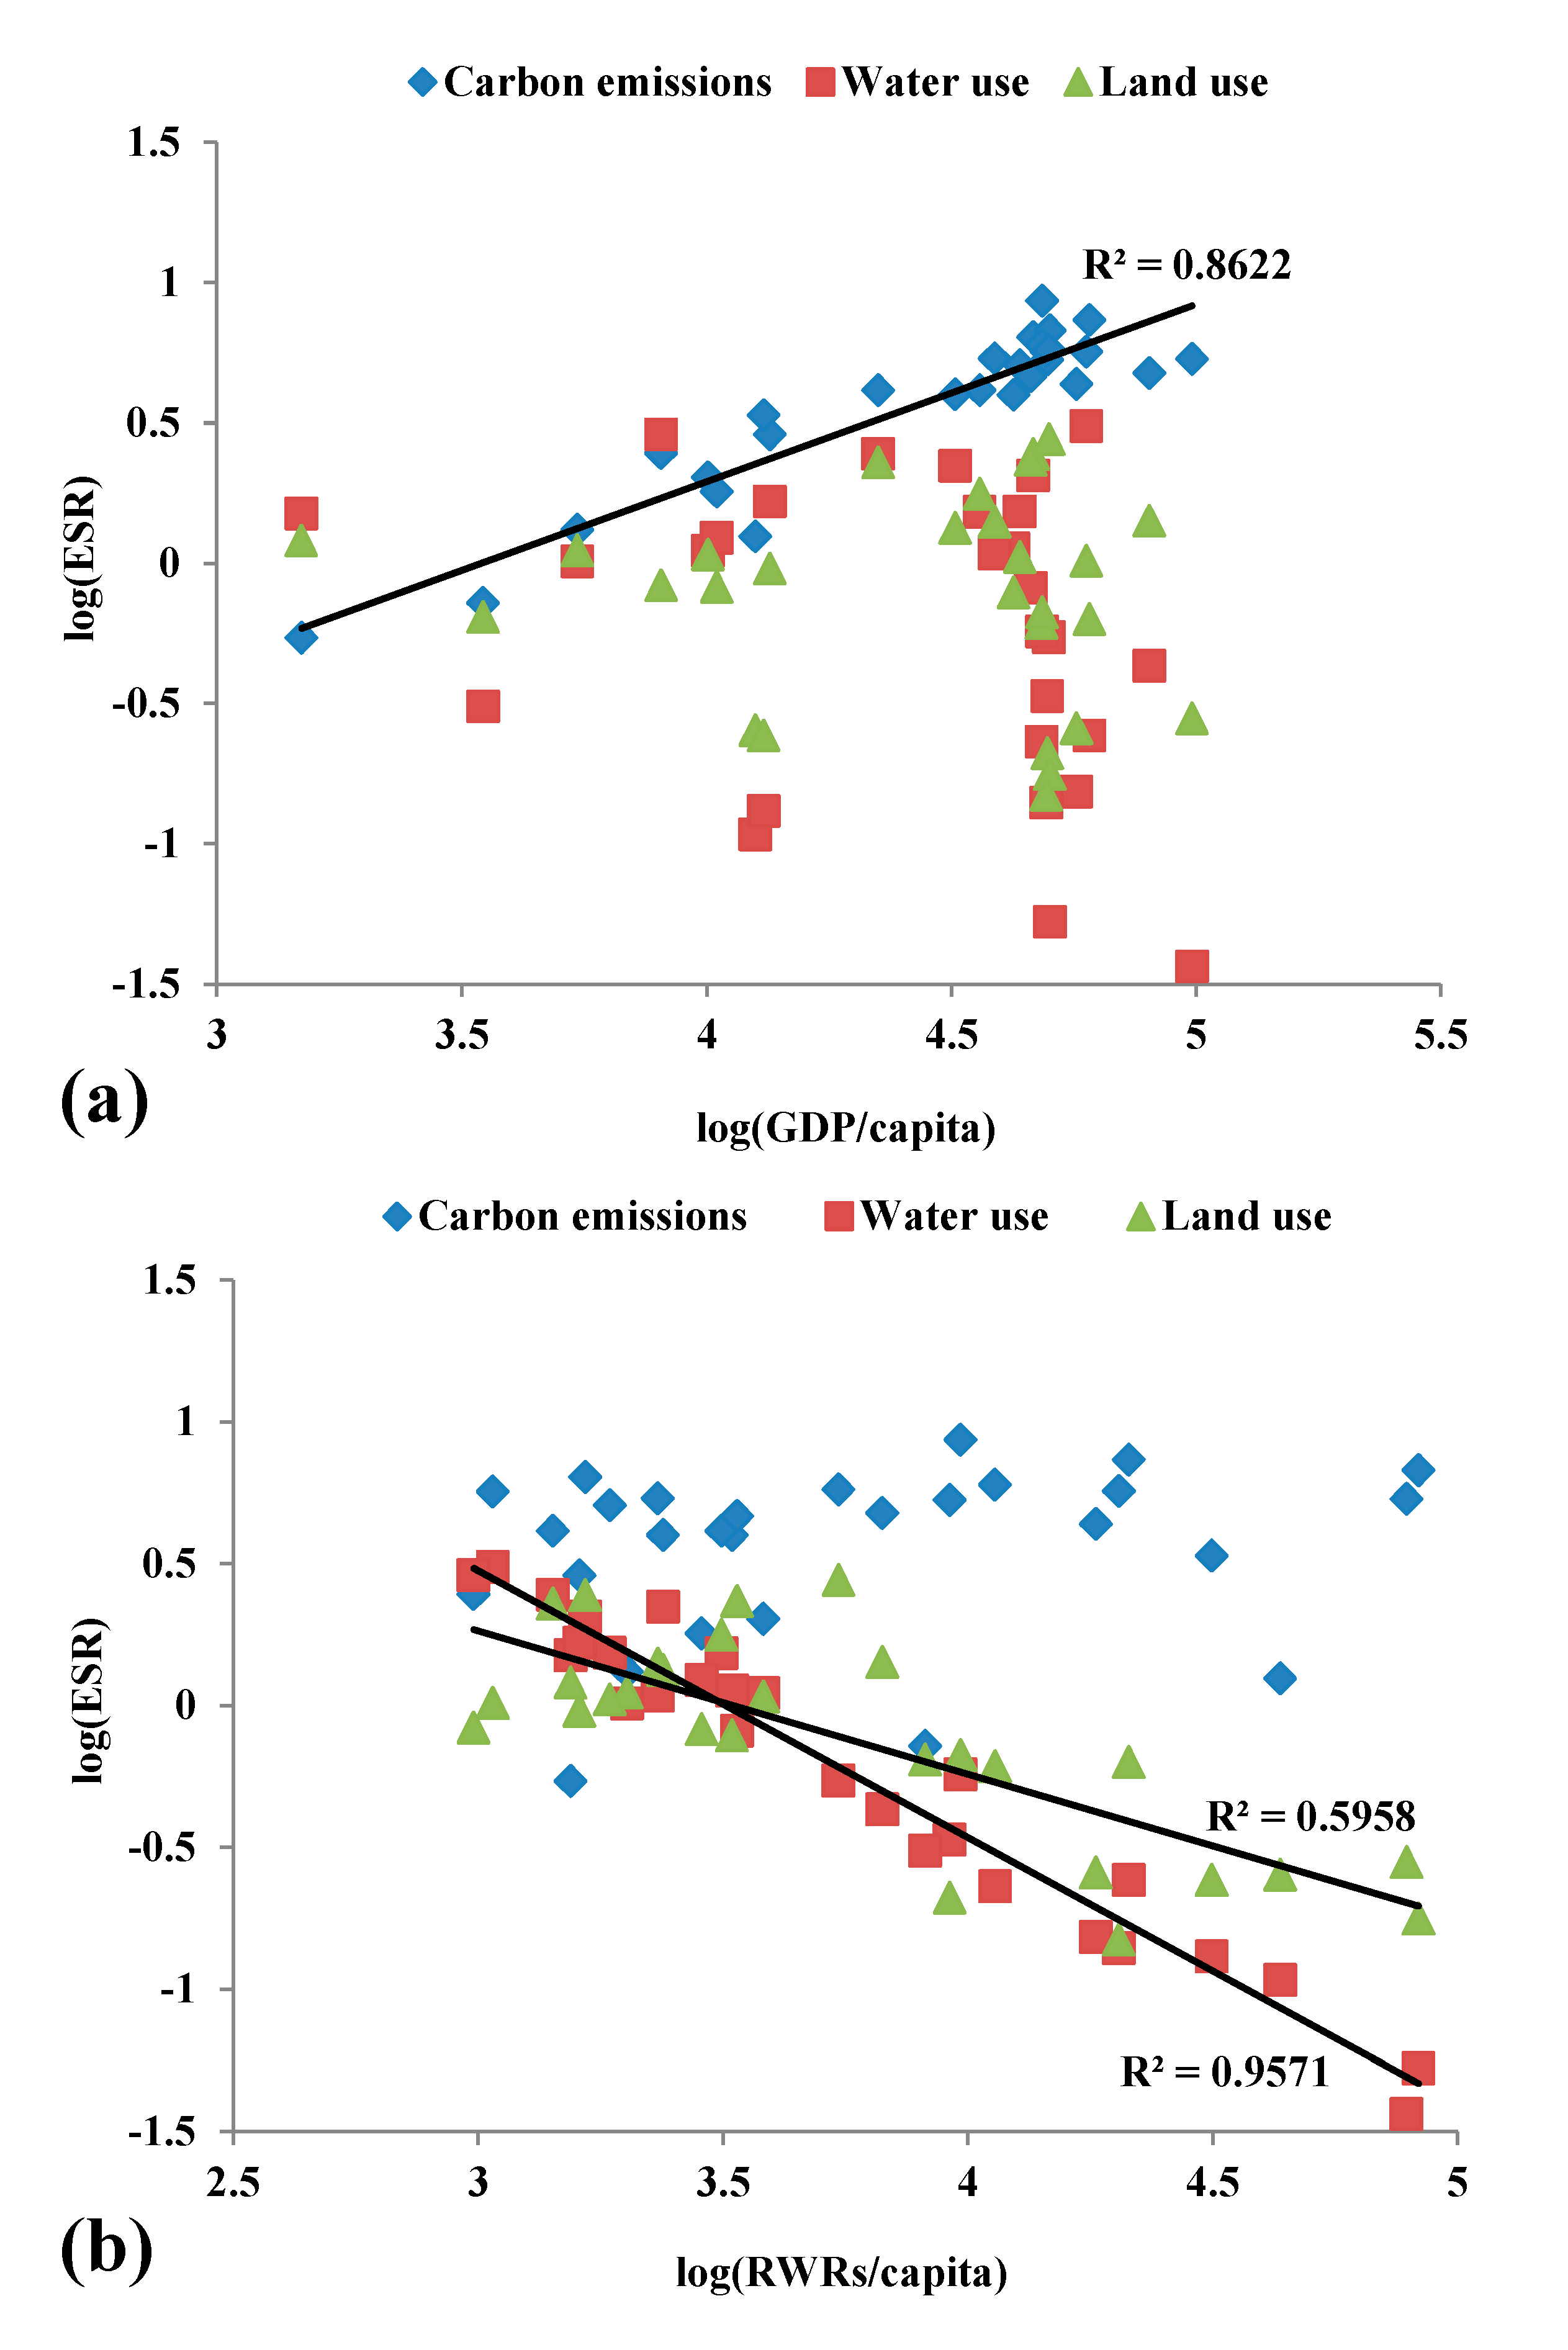
4. Discussion


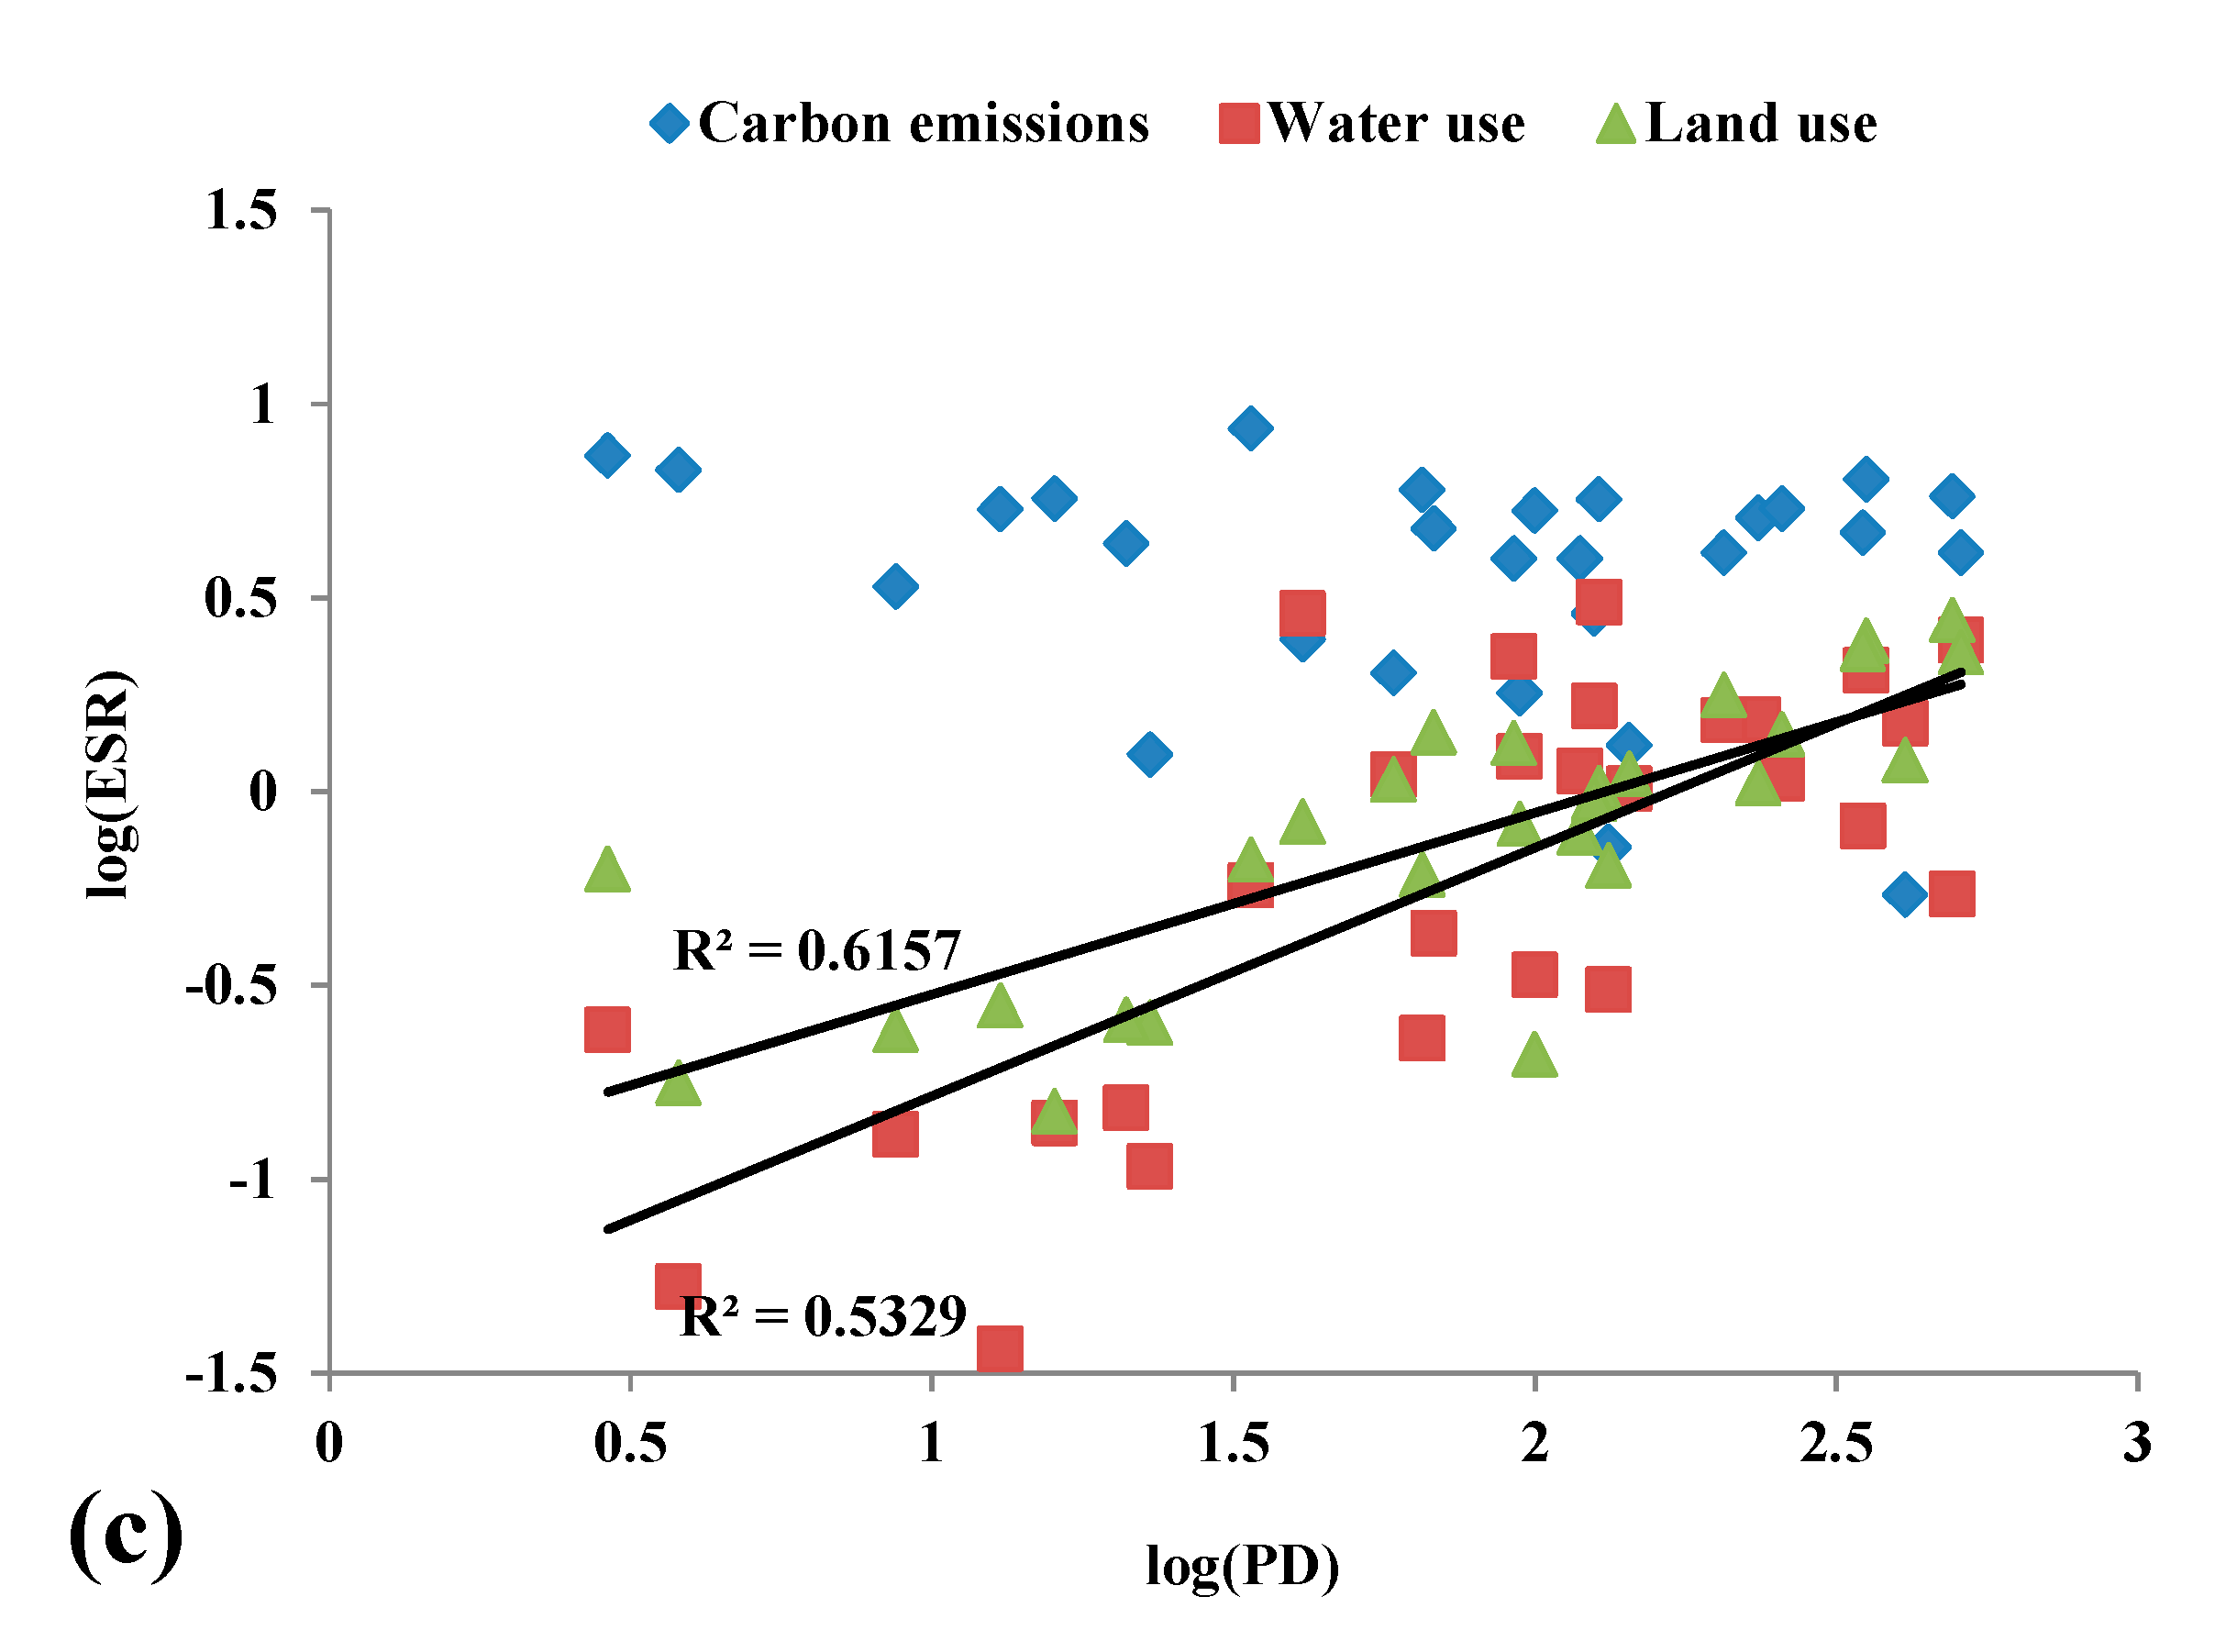
| log(ESR) | log(GDP) | log(RWRs) | log(PD) | Model Fit | ||||||||
|---|---|---|---|---|---|---|---|---|---|---|---|---|
| b | SE | p | b | SE | p | b | SE | p | R2 | F | p | |
| Carbon | 0.658 | 0.049 | 0.000 | −0.149 | 0.061 | 0.023 | -0.110 | 0.055 | 0.055 | 0.889 | 64.226 | 0.000 |
| Water | 0.054 | 0.050 | 0.290 | −1.037 | 0.063 | 0.000 | -0.097 | 0.056 | 0.097 | 0.963 | 209.248 | 0.000 |
| Land | 0.128 | 0.098 | 0.204 | −0.299 | 0.123 | 0.023 | 0.275 | 0.109 | 0.019 | 0.698 | 18.524 | 0.000 |


| log(GDP) | log(RWRs) | log(PD) | Model fit | |||||||||
|---|---|---|---|---|---|---|---|---|---|---|---|---|
| b | SE | p | b | SE | p | b | SE | p | R2 | F | p | |
| log(ESRI) | 0.412 | 0.049 | 0.000 | −0.255 | 0.061 | 0.000 | −0.066 | 0.055 | 0.240 | 0.766 | 26.117 | 0.000 |
5. Conclusions
Acknowledgments
Author Contributions
Conflicts of Interest
References
- Griggs, D.; Stafford-Smith, M.; Gaffney, O.; Rockström, J.; Öhman, M.C.; Shyamsundar, P.; Steffen, W.; Glaser, G.; Kanie, N.; Noble, I. Sustainable development goal for people and planet. Nature 2013, 495, 305–307. [Google Scholar] [CrossRef] [PubMed]
- Costanza, R.; Kubiszewski, I.; Giovannini, E.; Lovins, H.; McGlade, J.; Pickett, K.E.; Ragnarsdóttir, K.V.; Roberts, D.; Vogli, R.D.; Wilkinson, R. Time to leave GDP behind. Nature 2014, 505, 283–285. [Google Scholar] [CrossRef] [PubMed] [Green Version]
- Goodland, R.; Daly, H. Environmental sustainability: Universal and non-negotiable. Ecol. Appl. 1996, 6, 1002–1017. [Google Scholar] [CrossRef]
- Wackernagel, M.; Rees, W.E. Perceptual and structural barriers to investing in natural capital: Economics from an ecological footprint perspective. Ecol. Econ. 1997, 20, 3–24. [Google Scholar] [CrossRef]
- Samuel-Johnson, K.; Esty, D.C. Pilot Environmental Sustainability Index Report. In Proceedings of the World Economic Forum: Annual Meeting, Davos, Switzerland, 28 January 2000.
- Esty, D.C.; Levy, M.A.; Srebotnjak, T.; de Sherbinin, A.; Kim, C.H.; Anderson, B. Pilot Environmental Performance Index; Yale Center for Environmental Law & Policy: New Haven, CT, USA, 2006. [Google Scholar]
- Steinhart, C.E.; Schierow, L.-J.; Sonzogni, W.C. An environmental quality index for the great lakes. J. Am. Water Resour. Assoc. 1982, 18, 1025–1031. [Google Scholar] [CrossRef]
- Puolamaa, M.; Kaplas, M.; Reinikainen, T. Index of Environmental Friendliness: A Methodological Study; Official Statistics of Finland: Helsinki, Finland, 1996. [Google Scholar]
- Kaly, U.; Briguglio, L.; McLeod, H.; Schmall, S.; Pratt, C.; Pal, R. Environmental Vulnerability Index (EVI) to Summarise National Environmental Vulnerability Profiles. SOPAC Technical Report 275. 1999. Available online: http://ict.sopac.org/VirLib/TR0275.pdf (accessed on 1 December 2014).
- Sutton, P.; Costanza, R. Global estimates of market and non-market values derived from nighttime satellite imagery, land cover, and ecosystem service valuation. Ecol. Econ. 2002, 41, 509–527. [Google Scholar] [CrossRef]
- Fang, K.; Heijungs, R.; de Snoo, G.R. Understanding the complementary linkages between environmental footprints and planetary boundaries in a footprint—Boundary environmental sustainability assessment framework. Ecol. Econ. 2015, 114, 218–226. [Google Scholar] [CrossRef]
- Hoekstra, A.Y.; Wiedmann, T.O. Humanity’s unsustainable environmental footprint. Science 2014, 344, 1114–1117. [Google Scholar] [CrossRef] [PubMed]
- Čuček, L.; Klemeš, J.J.; Kravanja, Z. A review of Footprint analysis tools for monitoring impacts on sustainability. J. Clean. Prod. 2012, 34, 9–20. [Google Scholar] [CrossRef]
- Giampietro, M.; Saltelli, A. Footprints to nowhere. Ecol. Indic. 2014, 46, 610–621. [Google Scholar] [CrossRef]
- Kitzes, J.; Galli, A.; Bagliani, M.; Barrett, J.; Dige, G.; Ede, S.; Erb, K.; Giljum, S.; Haberl, H.; Hails, C.; et al. A research agenda for improving national Ecological Footprint accounts. Ecol. Econ. 2009, 68, 1991–2007. [Google Scholar] [CrossRef]
- Van den Bergh, J.C.J.M.; Grazi, F. Ecological footprint policy? Land use as an environmental indicator. J. Ind. Ecol. 2014, 18, 10–19. [Google Scholar] [CrossRef]
- Rees, W.E. Ecological footprint and appropriated carrying capacity: What urban economics leaves out. Environ. Urban. 1992, 4, 121–130. [Google Scholar] [CrossRef]
- Hoekstra, A.Y.; Hung, P.Q. Virtual Water Trade: A Quantification of Virtual Water Flows between Nations in Relation to International Crop Trade; Value of Water Research Report Series No. 11; UNESCO-IHE Institute for Water Education: Delft, The Netherlands, 2002. [Google Scholar]
- Wiedmann, T.; Minx, J. A definition of “carbon footprint”. In Ecological Economics Research Trends; Pertsova, C.C., Ed.; Nova Science Publishers: New York, NY, USA, 2008; pp. 1–11. [Google Scholar]
- Fang, K.; Heijungs, R.; de Snoo, G.R. Theoretical exploration for the combination of the ecological, energy, carbon, and water footprints: Overview of a footprint family. Ecol. Indic. 2014, 36, 508–518. [Google Scholar] [CrossRef]
- O’Brien, M.; Schütz, H.; Bringezu, S. The land footprint of the EU bioeconomy: Monitoring tools, gaps and needs. Land Use Policy 2015, 47, 235–246. [Google Scholar] [CrossRef]
- Rockström, J.; Steffen, W.; Noone, K.; Persson, Å.; Chapin, F.S., III; Lambin, E.F.; Lenton, T.M.; Scheffer, M.; Folke, C.; Schellnhuber, H.J.; et al. A safe operating space for humanity. Nature 2009, 461, 472–475. [Google Scholar] [CrossRef] [PubMed]
- Steffen, W.; Richardson, K.; Rockström, J.; Cornell, S.E.; Fetzer, I.; Bennett, E.M.; Biggs, R.; Carpenter, S.R.; de Vries, W.; de Wit, C.A.; et al. Planetary boundaries: Guiding human development on a changing planet. Science 2015, 347. [Google Scholar] [CrossRef] [PubMed]
- Cole, M.J.; Bailey, R.M.; New, M.G. Tracking sustainable development with a national barometer for South Africa using a downscaled “safe and just space” framework. Proc. Natl. Acad. Sci. USA 2014, 111, E4399–E4408. [Google Scholar] [CrossRef] [PubMed]
- Dearing, J.A.; Wang, R.; Zhang, K.; Dyke, J.G.; Haberl, H.; Sarwar Hossain, M.; Langdon, P.G.; Lenton, T.M.; Raworth, R.; Brown, S.; et al. Safe and just operating spaces for regional social–ecological systems. Glob. Environ. Change 2014, 28, 227–238. [Google Scholar] [CrossRef] [Green Version]
- Smith, N.J.; McDonald, G.W.; Patterson, M.G. Is there overshoot of planetary limits? New indicators of human appropriation of the global biogeochemical cycles relative to their regenerative capacity based on “ecotime” analysis. Ecol. Econ. 2014, 104, 80–92. [Google Scholar] [CrossRef]
- Lewis, S.L. We must set planetary boundaries wisely. Nature 2012, 485. [Google Scholar] [CrossRef] [PubMed]
- Schyns, J.F.; Hoekstra, A.Y. The added value of water footprint assessment for national water policy: A case study for Morocco. PLoS ONE 2014, 9, e99705. [Google Scholar] [CrossRef] [PubMed]
- EUREAPA. Scenario Modelling and Policy Assessment Tool, 2011. Available online: https://www.eureapa.net (accessed on 15 October 2012).
- Intergovernmental Panel on Climate Change (IPCC). Climate Change 2014: Synthesis Report 2014. Available online: http://www.ipcc.ch/pdf/assessment-report/ar5/syr/SYR_AR5_LONG ERREPORT.pdf (accessed on 6 January 2015).
- Population Reference Bureau (PRB). World Population Data Sheet 2009. Available online: http://www.prb.org/pdf09/09wpds_eng.pdf (accessed on 25 March 2014).
- United Nations Environment Programme (UNEP). The Emissions Gap Report 2014: A UNEP Synthesis Report. Available online: http://www.unep.org/publications/ebooks/emissionsgapreport2014/portals/50268/pdf/EGR2014_LOWRES.pdf (accessed on 6 January 2015).
- Mekonnen, M.M.; Hoekstra, A.Y. National Water Footprint Accounts: The Green, Blue and Grey Water Footprint of Production and Consumption. Volume 2: Appendices 2011. Available online: http://www.waterfootprint.org/Reports/Report50-NationalWaterFootprints-Vol2.pdf (accessed on 5 October 2012).
- Food and Agriculture Organization of the United Nations (FAO). AQUASTAT 2012. Available online: http://www.fao.org/nr/water/aquastat/data/query/index.html (accessed on 30 January 2015).
- Global Footprint Network (GFN). National Footprint Accounts 2012 Edition. Available online: http://www.footprintnetwork.org/images/article_uploads/National_Footprint_Accounts_2012_Edition_Report.pdf (accessed on 17 June 2015).
- Rogelj, J.; McCollum, D.; O’Neill, B.C.; Riahi, K. 2020 emissions levels required to limit warming to below 2 °C. Nat. Clim. Change 2013, 3, 405–412. [Google Scholar] [CrossRef]
- Aubauer, H.P. Development of ecological footprint to an essential economic and political tool. Sustainability 2011, 3, 649–665. [Google Scholar] [CrossRef]
- Hoekstra, A.Y. Human appropriation of natural capital: A comparison of ecological footprint and water footprint analysis. Ecol. Econ. 2009, 68, 1963–1974. [Google Scholar] [CrossRef]
- Bogardi, J.J.; Fekete, B.M.; Vörösmarty, C.J. Planetary boundaries revisited: A view through the “water lens”. Curr. Opin. Environ. Sustain. 2013, 5, 581–589. [Google Scholar] [CrossRef]
- Rockström, J.; Gordon, L.; Folke, C.; Falkenmark, M.; Engwall, M. Linkages among water vapor flows, food production, and terrestrial ecosystem services. Conserv. Ecol. 1999, 3. Article 5. [Google Scholar]
- Hoekstra, A.Y.; Mekonnen, M.M.; Chapagain, A.K.; Mathews, R.E.; Richter, B.D. Global monthly water scarcity: Blue water footprints versus blue water availability. PLoS ONE 2012, 7, e32688. [Google Scholar] [CrossRef] [PubMed]
- Gerten, D.; Hoff, H.; Rockström, J.; Jägermeyr, J.; Kummu, M.; Pastor, A.V. Towards a revised planetary boundary for consumptive freshwater use: Role of environmental flow requirements. Curr. Opin. Environ. Sustain. 2013, 5, 551–558. [Google Scholar] [CrossRef]
- Bass, S. Keep off the grass. Nat. Rep. Clim. Change 2009, 3, 113–114. [Google Scholar] [CrossRef]
- Borucke, M.; Moore, D.; Cranston, G.; Gracey, K.; Iha, K.; Larson, J.; Lazarus, E.; Morales, J.C.; Wackernagel, M.; Galli, A. Accounting for demand and supply of the biosphere’s regenerative capacity: The National Footprint Accounts’ underlying methodology and framework. Ecol. Indic. 2013, 24, 518–533. [Google Scholar] [CrossRef]
- Peters, G.P. From production-based to consumption-based national emission inventories. Ecol. Econ. 2008, 65, 13–23. [Google Scholar] [CrossRef]
- Wiedmann, T. A review of recent multi-region input-output models used for consumption-based emissions and resource accounting. Ecol. Econ. 2009, 69, 211–222. [Google Scholar] [CrossRef]
- Zhang, Y.J. The impact of financial development on carbon emissions: An empirical analysis in China. Energy Policy 2011, 39, 2197–2203. [Google Scholar] [CrossRef]
- Nykvist, B.; Persson, Å.; Moberg, F.; Persson, L.; Cornell, S.; Rockström, J. National Environmental Performance on Planetary Boundaries: A Study for the Swedish Environmental Protection Agency; Stockholm Resilience Center & Stockholm Environment Institute: Stockholm, Sweden, 2013. [Google Scholar]
- Meyfroidt, P.; Lambin, E.F.; Erb, K.H.; Hertel, T.W. Globalization of land use: Distant drivers of land change and geographic displacement of land use. Curr. Opin. Environ. Sustain. 2013, 5, 438–444. [Google Scholar] [CrossRef]
- Weinzettel, J.; Hertwich, E.G.; Peters, G.P.; Steen-Olsen, K.; Galli, A. Affluence drives the global displacement of land use. Glob. Environ. Change 2013, 23, 433–438. [Google Scholar] [CrossRef]
- Wiedmann, T.; Barrett, J. A Review of the ecological footprint indicator—Perceptions and methods. Sustainability 2010, 2, 1645–1693. [Google Scholar] [CrossRef]
- Tuomisto, H.L.; Hodge, I.D.; Riordan, P.; Macdonald, D.W. Exploring a safe operating approach to weighting in life cycle impact assessment—A case study of organic, conventional and integrated farming systems. J. Clean. Prod. 2012, 37, 147–153. [Google Scholar] [CrossRef]
- Chapman, P.M.; Maher, B. The need for truly integrated environmental assessments. Integr. Environ. Assess. Manag. 2014, 10, 151–151. [Google Scholar] [CrossRef] [PubMed]
- Kates, R.W. What kind of a science is sustainability science? Proc. Natl. Acad. Sci. USA 2011, 108, 19449–19450. [Google Scholar] [CrossRef] [PubMed]
- Hoekstra, A.Y. The sustainability of a single activity, production process or product. Ecol. Indic. 2015, 57, 82–84. [Google Scholar] [CrossRef]
- Molden, D. The devil is in the detail. Nat. Rep. Clim. Change 2009, 3, 116–117. [Google Scholar] [CrossRef]
- Jaramillo, F.; Destouni, G. Comment on “Planetary boundaries: Guiding human development on a changing planet”. Science 2015, 348. [Google Scholar] [CrossRef] [PubMed]
© 2015 by the authors; licensee MDPI, Basel, Switzerland. This article is an open access article distributed under the terms and conditions of the Creative Commons Attribution license (http://creativecommons.org/licenses/by/4.0/).
Share and Cite
Fang, K.; Heijungs, R.; Duan, Z.; De Snoo, G.R. The Environmental Sustainability of Nations: Benchmarking the Carbon, Water and Land Footprints against Allocated Planetary Boundaries. Sustainability 2015, 7, 11285-11305. https://0-doi-org.brum.beds.ac.uk/10.3390/su70811285
Fang K, Heijungs R, Duan Z, De Snoo GR. The Environmental Sustainability of Nations: Benchmarking the Carbon, Water and Land Footprints against Allocated Planetary Boundaries. Sustainability. 2015; 7(8):11285-11305. https://0-doi-org.brum.beds.ac.uk/10.3390/su70811285
Chicago/Turabian StyleFang, Kai, Reinout Heijungs, Zheng Duan, and Geert R. De Snoo. 2015. "The Environmental Sustainability of Nations: Benchmarking the Carbon, Water and Land Footprints against Allocated Planetary Boundaries" Sustainability 7, no. 8: 11285-11305. https://0-doi-org.brum.beds.ac.uk/10.3390/su70811285