1. Introduction
In the 1970s, the term
vulnerability first appeared in natural disaster research [
1]. The term was then gradually applied to fields such as poverty, development and global environmental change [
2]. Kates listed vulnerability research as one of the seven core issues in sustainability science [
3], and further put it in the field research of global sustainable development up to the strategic level. Currently, vulnerability research is a key method in global change and sustainable development research [
4]. In recent years, many research findings on vulnerability have emerged in various fields, including basic research on the concept and connotation of vulnerability and its theoretical framework [
5], and climate and environmental change and its impact on issues such as sea levels [
6], forests [
7], social development [
8] and the city [
9]. Vulnerability research is also used in natural disaster research, such as flood [
10], earthquake [
11], tsunami [
12], snowstorm [
13] and fire [
14]; in research on water and land resources [
15]; on poverty and employment [
16]; and on traffic systems [
17]. At the same time, vulnerability theory has been introduced into the field of urban research, in which city-related issues, such as diseases [
18], terrain [
19], and heritage [
20] are being studied.
GIS techniques, and especially GIS-based multicriteria decision analysis (GIS-MCDA) methods, have increasingly become integral components of urban, regional and environmental planning over the past 30 years [
21]. In fact, GIS-MCDA is one of the most useful methods for spatial planning and management [
22]. Generally, GIS-MCDA can be defined as a process that combines and transforms geographical data and value judgments to obtain information for decision-making [
23]. The key points in this process are the GIS overlay techniques proposed by McHarg (1969) and later developed by Steinitz
et al. (1976) [
24,
25]. GIS-MCDA techniques are also useful in urban vulnerability research. In fact, the rapid development of GIS is helping to foster research into urban vulnerability. GIS-MCDA may provide a new integrated technology platform for the measurement of urban vulnerability, significantly improving the efficiency and accuracy of measurement and making the measurement process visible.
The research on urban ecological vulnerability is conducted based on traditional research on ecological vulnerability [
26]. Here are some typical studies regarding to urban ecological vulnerability. The study on types, manifestations and genesis of urban ecological vulnerability [
27], the assessment of urban ecological vulnerability based on a certain respect, for instance, the change of land use [
28], landscape pattern and soil erosion [
29], vegetation coverage [
30] and land resources [
31].
In general, urban ecological vulnerability research has increasingly obtained more attention [
32]; it still needs to be improved. The existing studies carried out research based on a single respect, which resulted in the lack of comprehensive measurements and evaluations on urban ecological vulnerability. Meanwhile, there are insufficient studies on how to regulate the urban ecological vulnerability. “Regulate” means to divide the region into various zones and apply different control policies or strategies to them. Based on the foregoing, this paper quantitatively measures urban ecological vulnerability from the two aspects of ecological sensitivity and resilience by coupling GIS with the measurement mathematical model in the GIS platform, further processing into the urban ecological vulnerability index for a more comprehensive and systematic measurement. At the same time, attempts have been made to spatially designate different types of vulnerability regulatory zones and further provide the corresponding countermeasures for each type, thus giving some implications for the urban ecological vulnerability regulation and providing theoretical and technical references for research on urban ecological vulnerability.
2. Methods
2.1. Basic Principles
In traditional natural disaster and environmental change research,
vulnerability refers to the potential of the system to encounter, and be affected by, disaster [
33]. In the humanities and social science research,
vulnerability is the level of ability and inability to cope with adverse effects inherent in a system [
34]. In summary, vulnerability can be defined as the assembly of such terms as exposure, sensitivity, adaptability and resilience [
35]. To extend the traditional application of vulnerability research to the urban ecology, vulnerability is defined as the inherent sensitivity and resilience of the urban ecology when encountering external interference—that is, sensitivity and resilience to interference and pressure in terms of spatial and ecological aspects that are irreplaceable and relatively fixed. Mountains, rivers, vegetative cover and other ecological elements are all spatial entities with a fixed geographic location. They are natural endowments and inherent ecological conditions that can’t be moved, copied or transacted. Secondly, the urban ecology is a relatively stable structure formed over a long period, but does not have absolute stability. When people’s activities follow the ecological rules [
36], the ecology maintains its stability and the degree of vulnerability will be at a low level and conducive to sustainable development. On the other hand, if people conduct activities against ecological rules, the ecology will face adverse changes, damaging its stability and balance. The degree of vulnerability will rise rapidly and be unfavorable for urban sustainable development.
2.2. Methods for Measuring Ecological Vulnerability
Urban ecological vulnerability incorporates ecological sensitivity and resilience. As long as these two elements are comprehensively measured, we can achieve an overall and objective result from quantitative measurement. Ecological sensitivity refers to the level of sensitivity of the urban ecological entity and its elements to interference and pressure, which is also referred to as the probability of the ecology encountering interference [
37]. The higher the sensitivity, the more probable a threat to the ecology, and the lower the sensitivity, the less likely the risk. Ecological resilience refers to the capacity for self-adjustment and restoration after an event [
38]. External interference adds pressure to the urban ecology, but if the ecology can bear the pressure (
i.e., it is resilient enough), then it will remain stable and sound. Once the pressure exceeds the limit of resilience, the ecology may face irreversible changes and lose some, or all, of its ecological functions. The stronger the capacity for restoration, the lower the level of vulnerability.
From the quantitative perspective, the ecological vulnerability index (EVI) is the combination of the ecological sensitivity index (ESI) and the ecological resilience index (ERI), both newly-formed evaluation functions of a respective group of ecological factors. The current most commonly used model is the weighed linear combination (WLC) method [
39], which can be closely integrated with the GIS overlay technique. ESI and ERI can be expressed in the following formulae:
In the formula,
xi (
i = 1,2,3, …,
n) is a group of ecological factors used for evaluation of ecological sensitivity; while
xj (
j = 1,2,3, …,
m) is the other group of ecological factors for evaluation of ecological resilience. The calculation formula of EVI is:
In the formula, WES and WER, respectively, refer to ecological sensitivity and resilience weight. It needs to be noted that the ESI is of positive correlation to the EVI, which means that the higher ESI becomes, the higher EVI will be. While the ERI is the inverse—the higher ERI becomes, the lower the EVI will be. Therefore, the standardized norms on ESI and ERI make the logic consistent for validating the measurement.
In essence, the process of the calculation of EVI is a typical GIS-MCDA function. Index system, index weights and the overlay rules of GIS constitute the three key elements of GIS-MCDA, in which index weights are usually the greatest contributor to uncertainty because of the sensitivity of the weights used [
40,
41]. Changes of index weights, even small ones, are likely to lead to different results when index system and overlay rules are determined. Therefore, weight determination in GIS-MCDA is a difficult problem and there is still no standard calculation method, leading to controversy and uncertainty of the weights. Researchers need to make sure that each step of the weights calculation is reasonable, thus reducing the impact of weight sensitivity on the results of GIS-MCDA as much as possible [
42]. For this paper, two different weight calculation methods are used to minimize the impact of weight sensitivity according to the characteristics of the index system. The first is the ranking method, which is the easiest and most appropriate when the index number is less than three (
i.e., two indices) and the importance of the two factors can be clearly defined. The other is the analytical hierarchy process (AHP), which is based on the combination of qualitative analysis and quantitative analysis [
43]. AHP is the most commonly used method in GIS-MCDA and can be used when there are many factors and the importance of all factors cannot clearly be defined. In particular, some specific indices do not need a weight calculation when the logical overlay rules of GIS are applied. This helps to reduce the impact of weight sensitivity on the application of the results.
2.3. Methods for Regulating Ecological Vulnerability
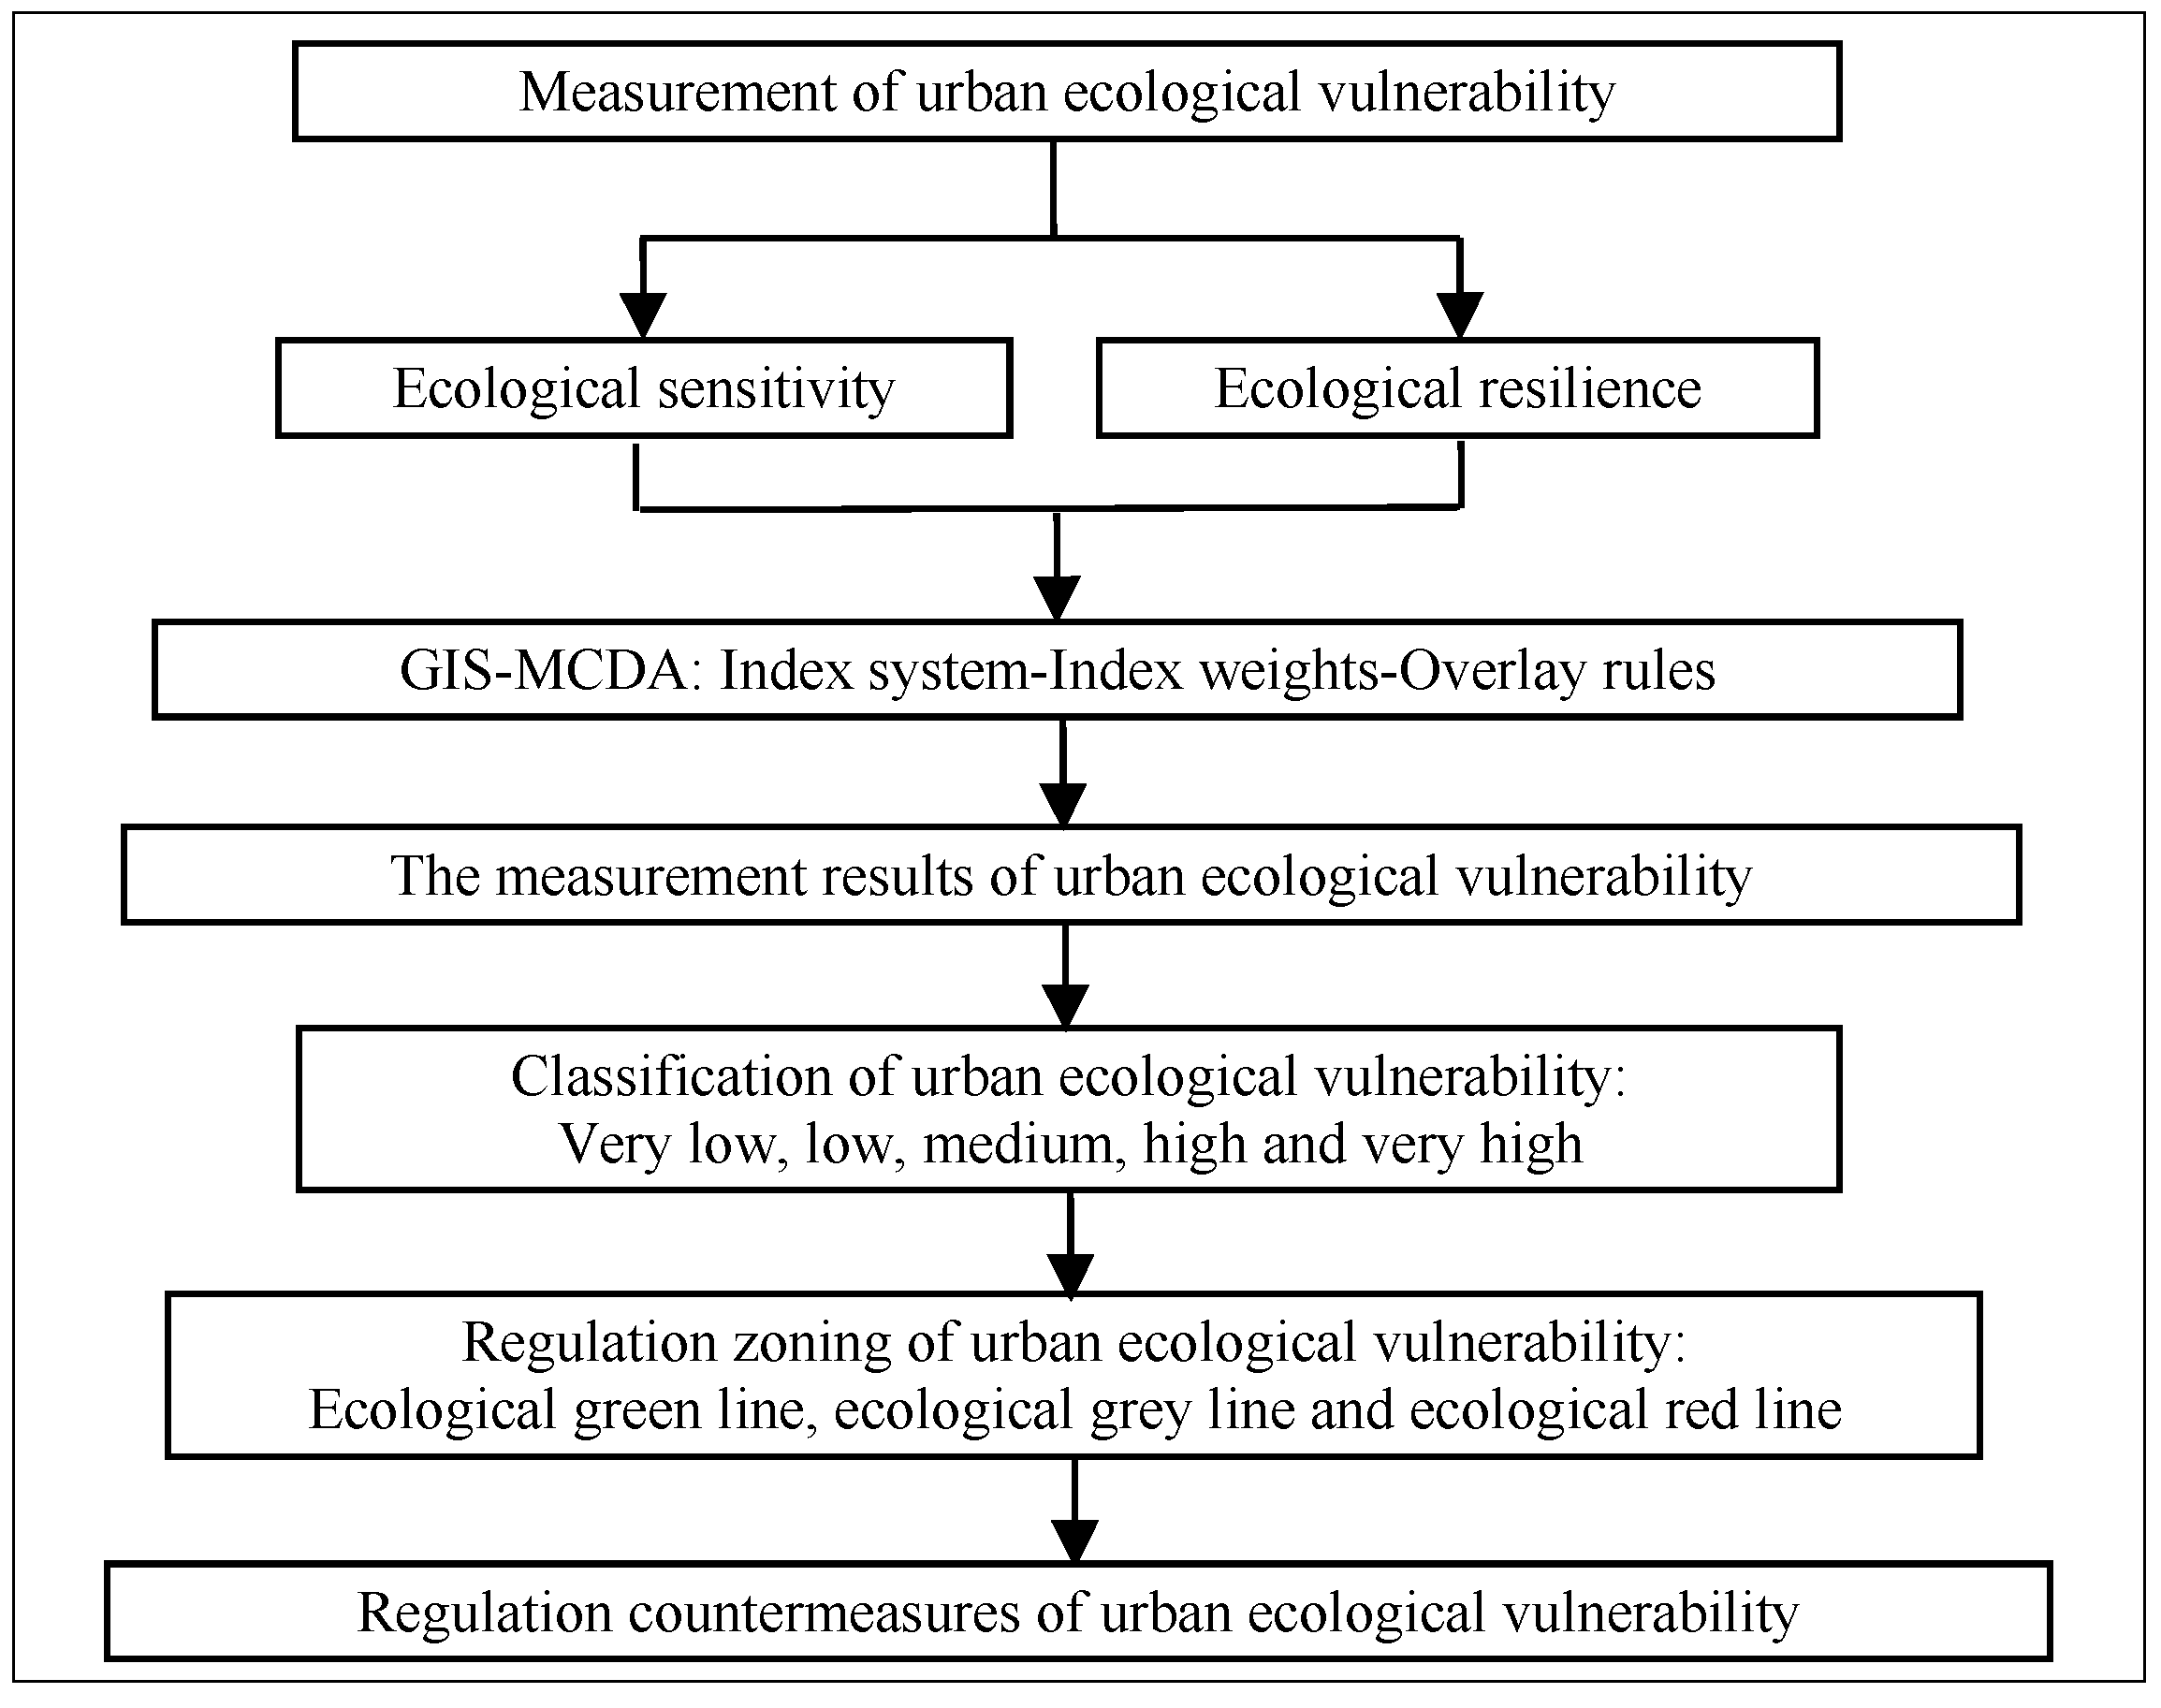
According to the measurement results of urban ecological vulnerability, we can classify the city into five ranks according to the level of its vulnerability—very low, low, medium, high and very high areas. Furthermore, three types of regulatory zone, ecological green line, ecological grey line and ecological red line, can be obtained.
The ecological green line regulatory area includes the very low vulnerability and low vulnerability areas. From the perspective of sustainable development, the ecological green line area is usually the one abundant in natural resources, good for urban development and livable for residents. The grey line area is mainly made up of medium vulnerability areas, which are a transitional area between the red line and the green line areas. In essence, the grey line area can serve different functions in the development strategy of the city. For instance, if a city pursues sprawling development, the area can provide sufficient space as back-up for urban development; while if the city carries out the strategy of shrinkage protection, the area can serve as the ecological buffer zone to protect the environment for future urban growth. The ecological red line area is made up of high vulnerability and very high vulnerability areas with rich natural resources, which serve as the ecological foundation for urban sustainable development. Its key functions include ecological conservation and restoration. That is to say, the ecological red line area cannot be used for urban development or industrialization. Instead, the red line area becomes important natural capital for future generations, thus promoting sustainable development and the maintenance of natural heritage.
In summary, measurement and regulatory zoning aims to analyze the distribution characteristics of urban ecological vulnerability and create classifications according to the level of vulnerability. It provides evidence for decision-making for urban ecology protection and sustainable development. According to the above method principles, the technical research route for urban ecological vulnerability measurement and its regulatory zoning is shown in
Figure 1.
Figure 1.
The technical route of this study.
Figure 1.
The technical route of this study.
3. Case Study
3.1. Overview of the Research Area
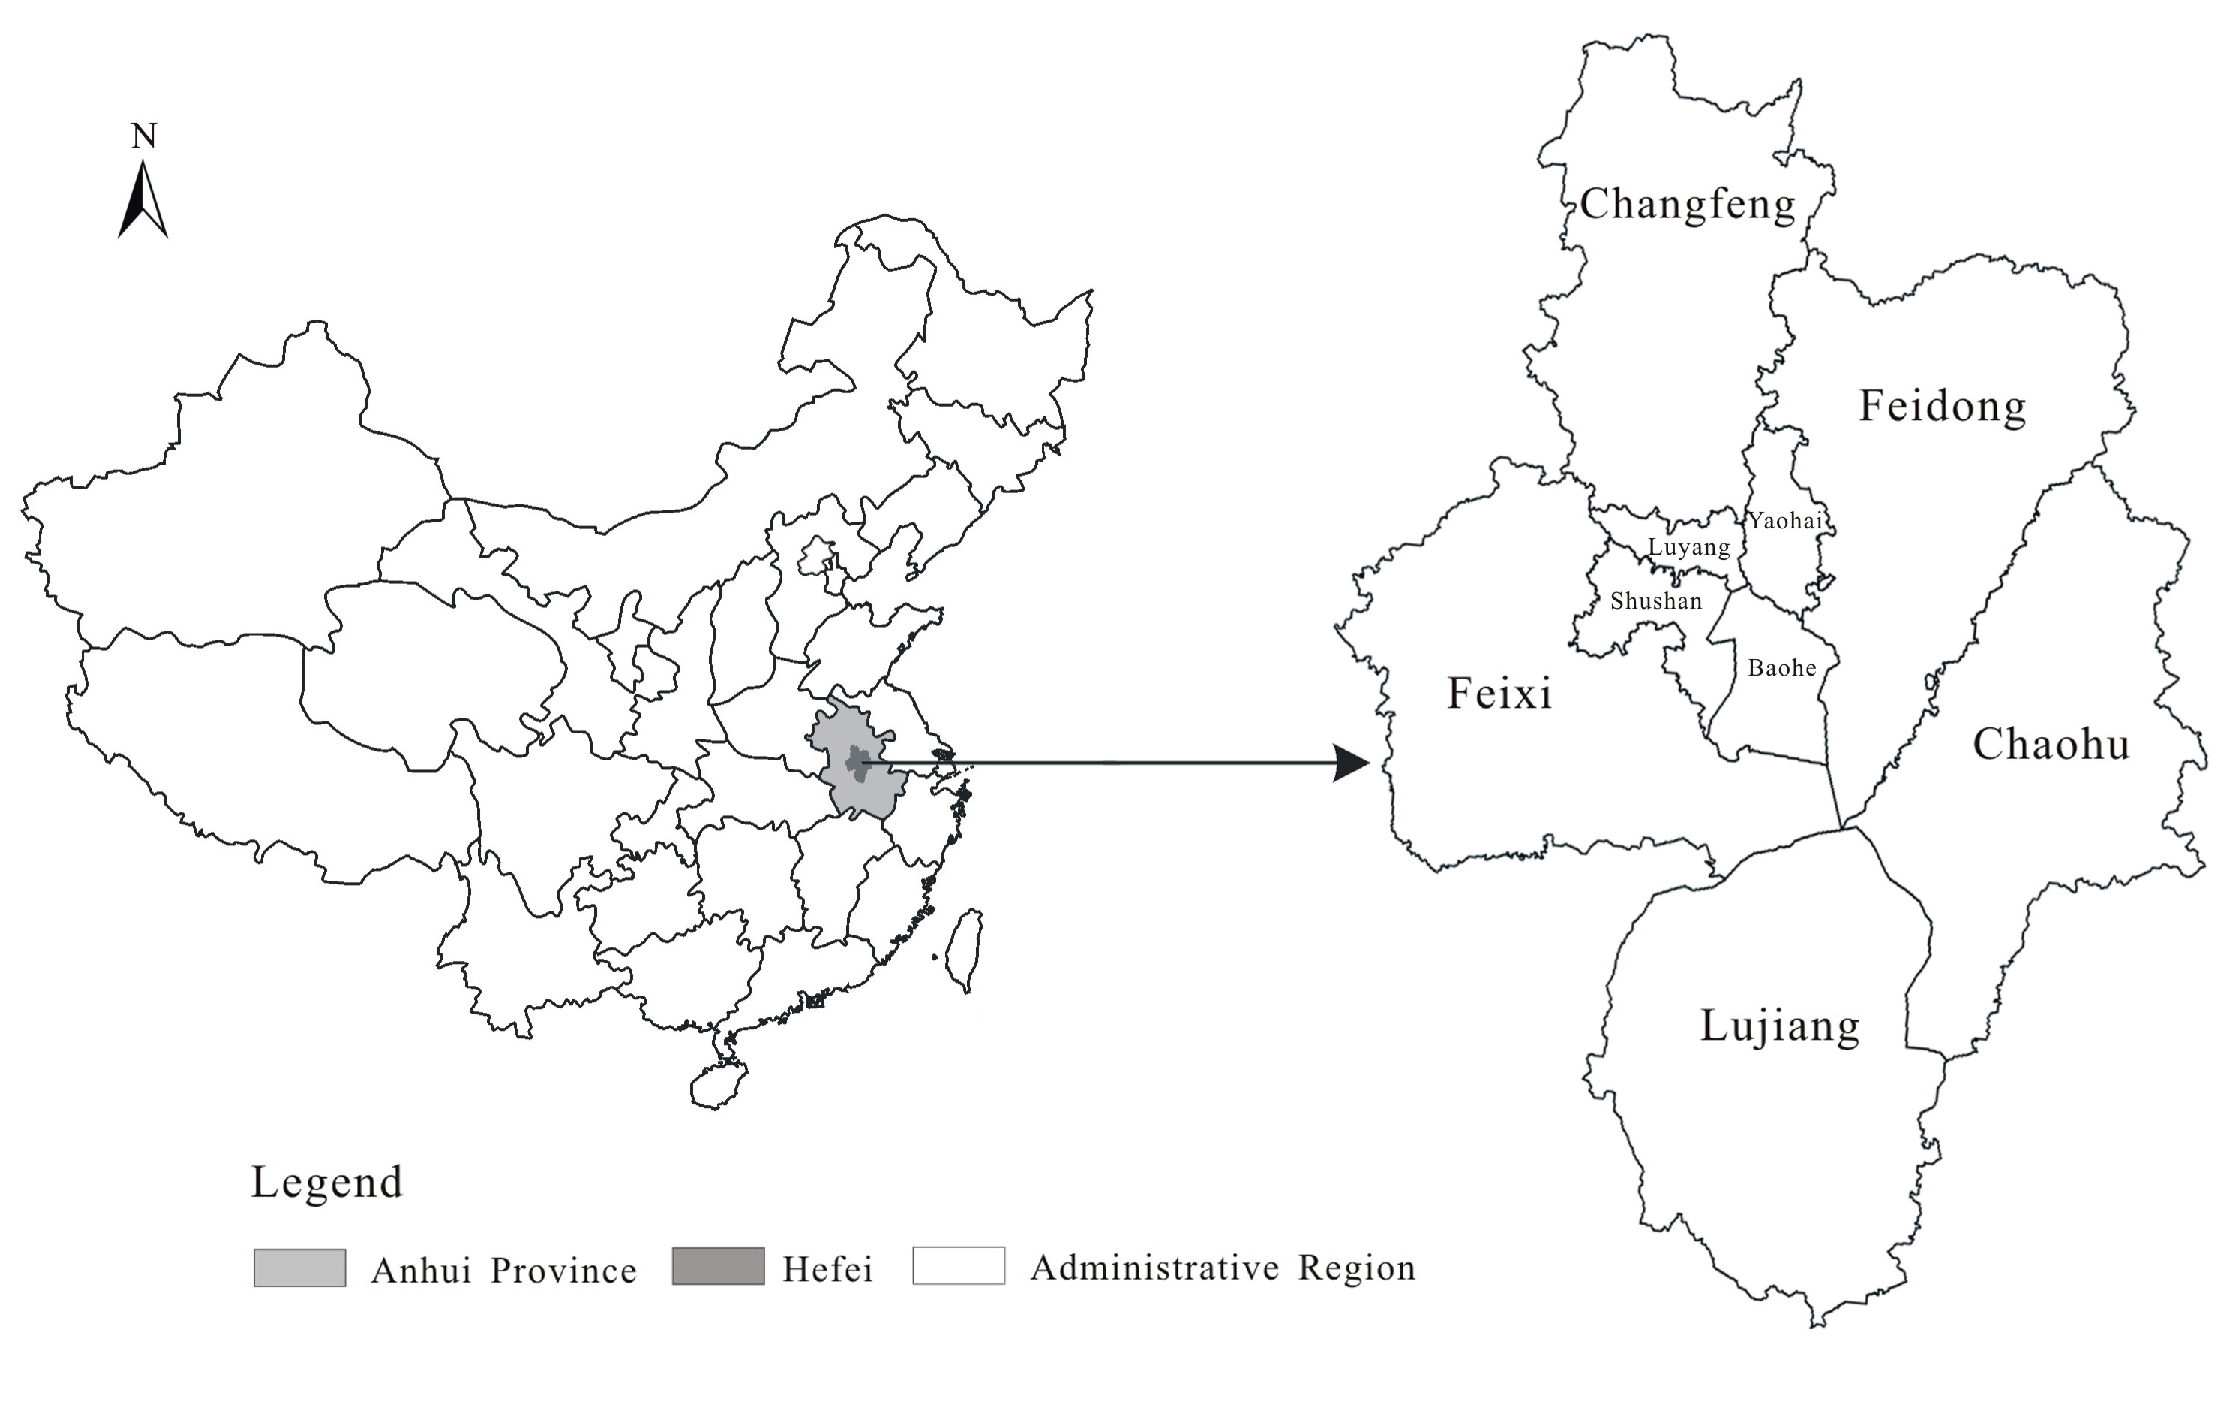
This paper takes the city of Hefei in China as a case study. Hefei, the capital and the largest city of Anhui province, is located in the central part of China. It is also the key city for the implantation of the national strategy for the development of central China. Hefei covers a total area of 11,433 square kilometers and has four counties (Changfeng, Feidong, Feixi and Lujiang), one county-level city (Chaohu city) and four municipal districts (Yaohai, Luyang, Shushan and Baohe) (see
Figure 2). Hefei is the location of China’s fifth largest freshwater lake (Chaohu Lake), which is the most prominent ecological resource and entity of the city.
Hefei is a typical city in a region of rapid urbanization, where the imbalance between economic and social development and ecological resources is worsening, as is the relationship between the population and the ecology. The ecology of the city is facing increasing pressure. At present, there are many regional core cities in China encountering similar ecological problems. For these reasons, this paper selects Hefei city as the empirical research area, to provide support for decision-making around ecological protection and promotion, alongside theoretical references and practical methods for further study into urban ecological vulnerability.
Figure 2.
Location sketch of Hefei city, China.
Figure 2.
Location sketch of Hefei city, China.
3.2. Index System Construction
According to the connotation of ecological sensitivity and resilience, we constructed the index system (see
Table 1) for measuring the city’s ecology, adhering to the principle of prioritizing leading factors, of applying scientific theories to practice and of maintaining clarity and applicability based on the ecological features of the city. The index system is made up of three layers—the target layer, the criteria layer and the indicator layer. The target layer refers to the EVI of Hefei city and the criteria to the two combined indices of ESI and ERI, founded on which is the indicator layer for spatial measurement.
Based on Hefei’s characteristics of natural ecological, this paper selects four indicators including topography, water, land use and geological hazard risk as the main ones for the ecological sensitivity assessment. Topography is one of the most important indicators having effects on the ecological sensitivity, which consists of slope and elevation. The study area has complicated topography in its diversity (including the plains, hills, mountain range, etc.) so that the two factors of slope and elevation are integrated into one indicator for ecological sensitivity. Water plays a key role in improving the regional environment and adjusting the temperature and humidity in the region. As the precious resource in the study area, water needs to be in rational use and protection, which is crucial to the ecological balance of the area. Therefore, water is listed in the indicator layer as the most important one for ecological sensitivity. Land use can reflect the development situation of the ecological environment, thus becoming another important indicator for ecological sensitivity. Geological hazard risk shows the occurrence rate of natural disasters, which means that high-risk areas apparently bear high level of ecological sensitivity.
Table 1.
The index system of ecological vulnerability measurement in Hefei.
Table 1.
The index system of ecological vulnerability measurement in Hefei.
| Target Layer | Criteria Layer | Indicator Layer |
|---|
| Ecological vulnerability index of Hefei city, EVI | Ecological sensitivity index, ESI | Topography |
| Water |
| Land use |
| Geological hazard risk |
| Ecological resilience index, ERI | Vegetation coverage |
| Amount of reserved water resources |
| Amount of reserved cultivated land |
| Land area |
The vegetation coverage is one of the most important indicators in the measurement of ecological capacity for self-restoration among various measurement indicators, represented in the paper by the normalized difference vegetation index (NDVI) and based on remote sensing image computing. Currently, NDVI is most widely used in vegetation remote sensing research, because it is the best factor for indicating vegetation growth status and coverage [
44].Specifically, NDVI value ranges from −1 to 1. When there is no vegetation coverage on the earth surface, the value is negative or zero. By contrast, the vegetation coverage will make the NDVI value positive and they are in positive correlation,
i.e., more vegetation coverage means a higher value. A higher NDVI value means more vegetation coverage, which means stronger ecological restoring forces and lower vulnerability.
Water resource is the most indispensable ecological factor that supports urban economic and social development. In China, the development of many cities is constrained by water resource shortage. Accordingly, water resource shall serve as an indicator for ecological resilience. A high index value means higher ecological resilience within the spatial unit and a lower level of vulnerability. Land (farmland included) is the basic carrier of urban development. A higher value here indicates a larger spatial area and more strategic scope. In the event of problems, there is more space for recovery and so the vulnerability level will be lower.
It should be pointed out that in regard to resilience, in addition to the natural ecological factors; there are also humanity factors [
45] in terms of economy, society and so on. City is a comprehensive entity with the integration of natural and humanity elements, of which the ecological vulnerability in natural perspectives has become the object of study. The aim is to objectively evaluate the level of supporting capability for and restraints imposed by urban natural ecological on those humanity factors. For this reason, this paper has only options of natural factors as indicators in the evaluation of ecological resilience.
3.3. Data Sources and Processing
According to the index system shown in
Table 1, the ecological factor data were collected using the administrative zones map of Hefei city, the Landsat-7 ETM image of Hefei shot on 10 March 2011 with a spatial resolution of 30 m, topographic maps with the scale of 1:20,000, the digital elevation model (DEM) data built from the digitized topographic map, the land use data and the geological disaster risks data (such as from landslides, avalanches, debris flow and earthquake fracture zones)extracted from the land resources database of Hefei city, the urban master plan and land use plan in 2013 of Hefei city.
The spatial data for each index factor was obtained to indicate ecological sensitivity and resilience after processing with the technical support of ENVI4.8 and ArcGIS9.3. Based on the characteristics of Hefei’s ecology, some of the first grade indices of ecological sensitivity were processed in detail for the second grade indices. Furthermore, the two types of indices were analyzed by ArgGIS9.3 against the ecological sensitivity buffer zones of different distances. The values for the analysis of buffer zones follow the requirements of
The Technical Specification for Ecological Function Regionalization (National Standard of the People’s Republic China) and take the existing research literature [
46] as the reference. Besides, justifiable modifications have been made in accordance with the natural ecological characteristics of the study area. Corresponding sensitivity level values are given on this basis. Normally, adhering to
The Technical Specification for Ecological Function Regionalization, the level values are classified in accordance with the sensitivity level of each index factor into the first, third, fifth, seventh and ninth, respectively, representing very low, low, medium, high and very high sensitivity areas. The processed ecological sensitivity index system can be seen in
Table 2.
Table 2.
The index system of ecological sensitivity measurement in Hefei.
Table 2.
The index system of ecological sensitivity measurement in Hefei.
| Index | Classification | Value | Sensitivity Level |
|---|
| Topography | Slope | >20° | 9 | Very high sensitivity |
| 10°–20° | 7 | High sensitivity |
| 5°–10° | 5 | Medium sensitivity |
| 2.5°–5° | 3 | Low sensitivity |
| 0°–2.5° | 1 | Very low sensitivity |
| Elevation | >200m | 9 | Very high sensitivity |
| 100–200m | 7 | High sensitivity |
| 50–100m | 5 | Medium sensitivity |
| 20–50m | 3 | Low sensitivity |
| 0–20m | 1 | Very low sensitivity |
| Water | Important lakes and reservoirs | Water body itself and buffer zone(1000 m) | 9 | Very high sensitivity |
| Buffer zone (1000–2000 m) | 7 | High sensitivity |
| Buffer zone (2000–3000 m) | 5 | Medium sensitivity |
| Buffer zone (3000–5000 m) | 3 | Low sensitivity |
| Buffer zone (>5000 m) | 1 | Very low sensitivity |
| Medium sized lakes and reservoirs | Water body itself and buffer zone(500 m) | 9 | Very high sensitivity |
| Buffer zone (500–1000 m) | 7 | High sensitivity |
| Buffer zone (1000–2000 m) | 5 | Medium sensitivity |
| Buffer zone (2000–3000 m) | 3 | Low sensitivity |
| Buffer zone (>3000 m) | 1 | Very low sensitivity |
| Water | General lakes and reservoirs | Water body itself and buffer zone(100 m) | 9 | Very high sensitivity |
| Buffer zone (100–200 m) | 7 | High sensitivity |
| Buffer zone (200–500 m) | 5 | Medium sensitivity |
| Buffer zone (500–1000 m) | 3 | Low sensitivity |
| Buffer zone (>1000 m) | 1 | Very low sensitivity |
| Important rivers | Water body itself and buffer zone(200 m) | 9 | Very high sensitivity |
| Buffer zone (200–500 m) | 7 | High sensitivity |
| Buffer zone (500–1000 m) | 5 | Medium sensitivity |
| Buffer zone (1000–2000 m) | 3 | Low sensitivity |
| Buffer zone (>2000 m) | 1 | Very low sensitivity |
| General rivers | Water body itself and buffer zone(100 m) | 9 | Very high sensitivity |
| Buffer zone (100–200 m) | 7 | High sensitivity |
| Buffer zone (200–300 m) | 5 | Medium sensitivity |
| Buffer zone (300–500 m) | 3 | Low sensitivity |
| Buffer zone (>500 m) | 1 | Very low sensitivity |
| Wetland | Wetland itself and buffer zone(100 m) | 9 | Very high sensitivity |
| Buffer zone (100–200 m) | 7 | High sensitivity |
| Buffer zone (200–500 m) | 5 | Medium sensitivity |
| Buffer zone (500–1000 m) | 3 | Low sensitivity |
| Buffer zone (>1000 m) | 1 | Very low sensitivity |
| Land use | Basic farmland | 9 | Very high sensitivity |
| Woodland | 7 | High sensitivity |
| Garden plot | 5 | Medium sensitivity |
| General farmland | 3 | Low sensitivity |
| Other used land | 1 | Very low sensitivity |
| Geological hazard risk | Earthquake fracture and buffer zone(1000 m) | 9 | Very high sensitivity |
| High risk area of landslide, dilapidation and debris flow | 7 | High sensitivity |
| Medium risk area of landslide, dilapidation and debris flow | 5 | Medium sensitivity |
| Low risk area of landslide, dilapidation and debris flow | 3 | Low sensitivity |
| Safe area | 1 | Very low sensitivity |
The index factors of ecological resilience were processed by ENVI4.8 against the remote sensing image data to obtain the NDVI for Hefei city, thus collecting the spatial data on Hefei’s vegetation coverage. At the same time, the related data on index factors such as water resources, farmland and land area were collected from Hefei township statistics by using GIS. Each index, including the second grade index, had a corresponding grid data layer in ArcGIS9.3, on which the subsequent spatial overlay analysis could be made.
3.4. Index Weight Calculation and Integration
The ranking method and AHP were adopted for calculating the index weights for each measurement indicator, of which the topography factor with two second grade indices adopting the ranking method for calculation. The formula of the ranking method is:
In the formula, Wj refers to the standardized weight of the j index; n is the number of index. rj and rk are, respectively, the importance sequence values of the j and k index.
The water body with six second grade indices was analyzed using the GIS logic overlaying method without calculating weight. The weight of the four respective first grade indices of ecological sensitivity and resilience were all calculated using the AHP method. The key point of AHP method is to decide the importance levels of indexes [
42]. In this paper, we used the rank values of indexes obtained from the Delphi method. We found 20 experts in the ecological environment field and asked each of them to give a rank value of index A compared to index B. Then, we used the average value as the final rank value of index A to index B, depending on which the judgment matrix of AHP method was built. The integrated measurement indices underwent spatial overlaying analysis based on the GIS platform.
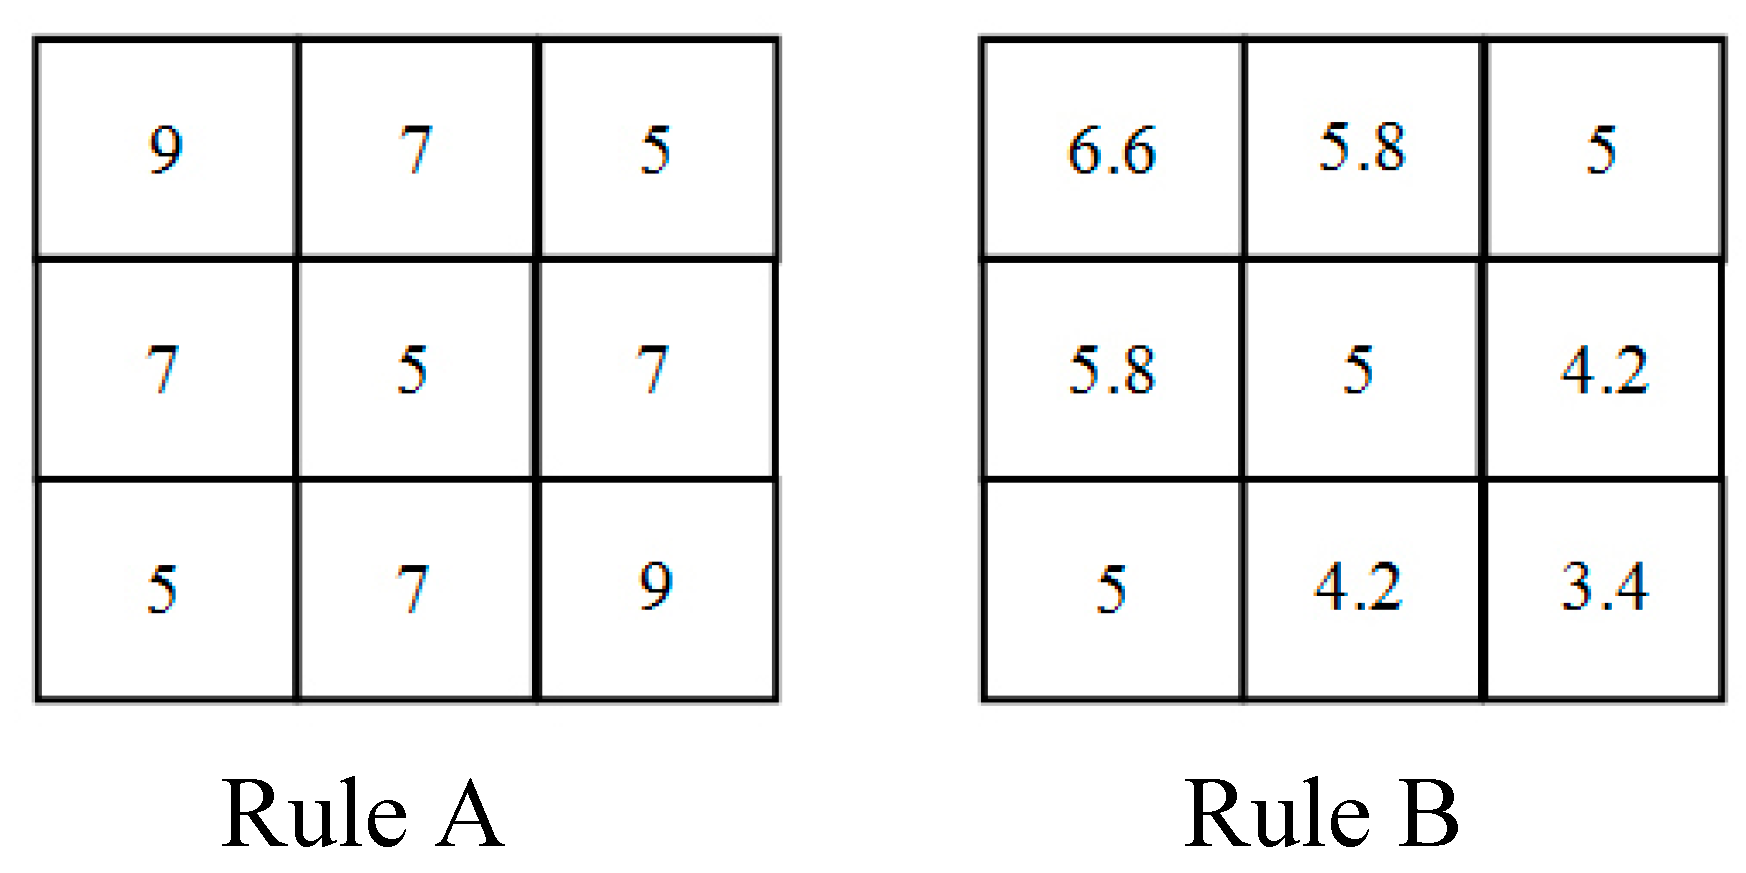
This paper follows the principle of measuring the ecological environmental vulnerability of Hefei City by the adoption of the maximum value and WLC overlay methods. A simple example is given here to show the differences between these two overlay rules in GIS. There are two items of raster data,a and b, and each data has nine grids (
Figure 3). Meanwhile, there are two results obtained by using two different overlay rules (
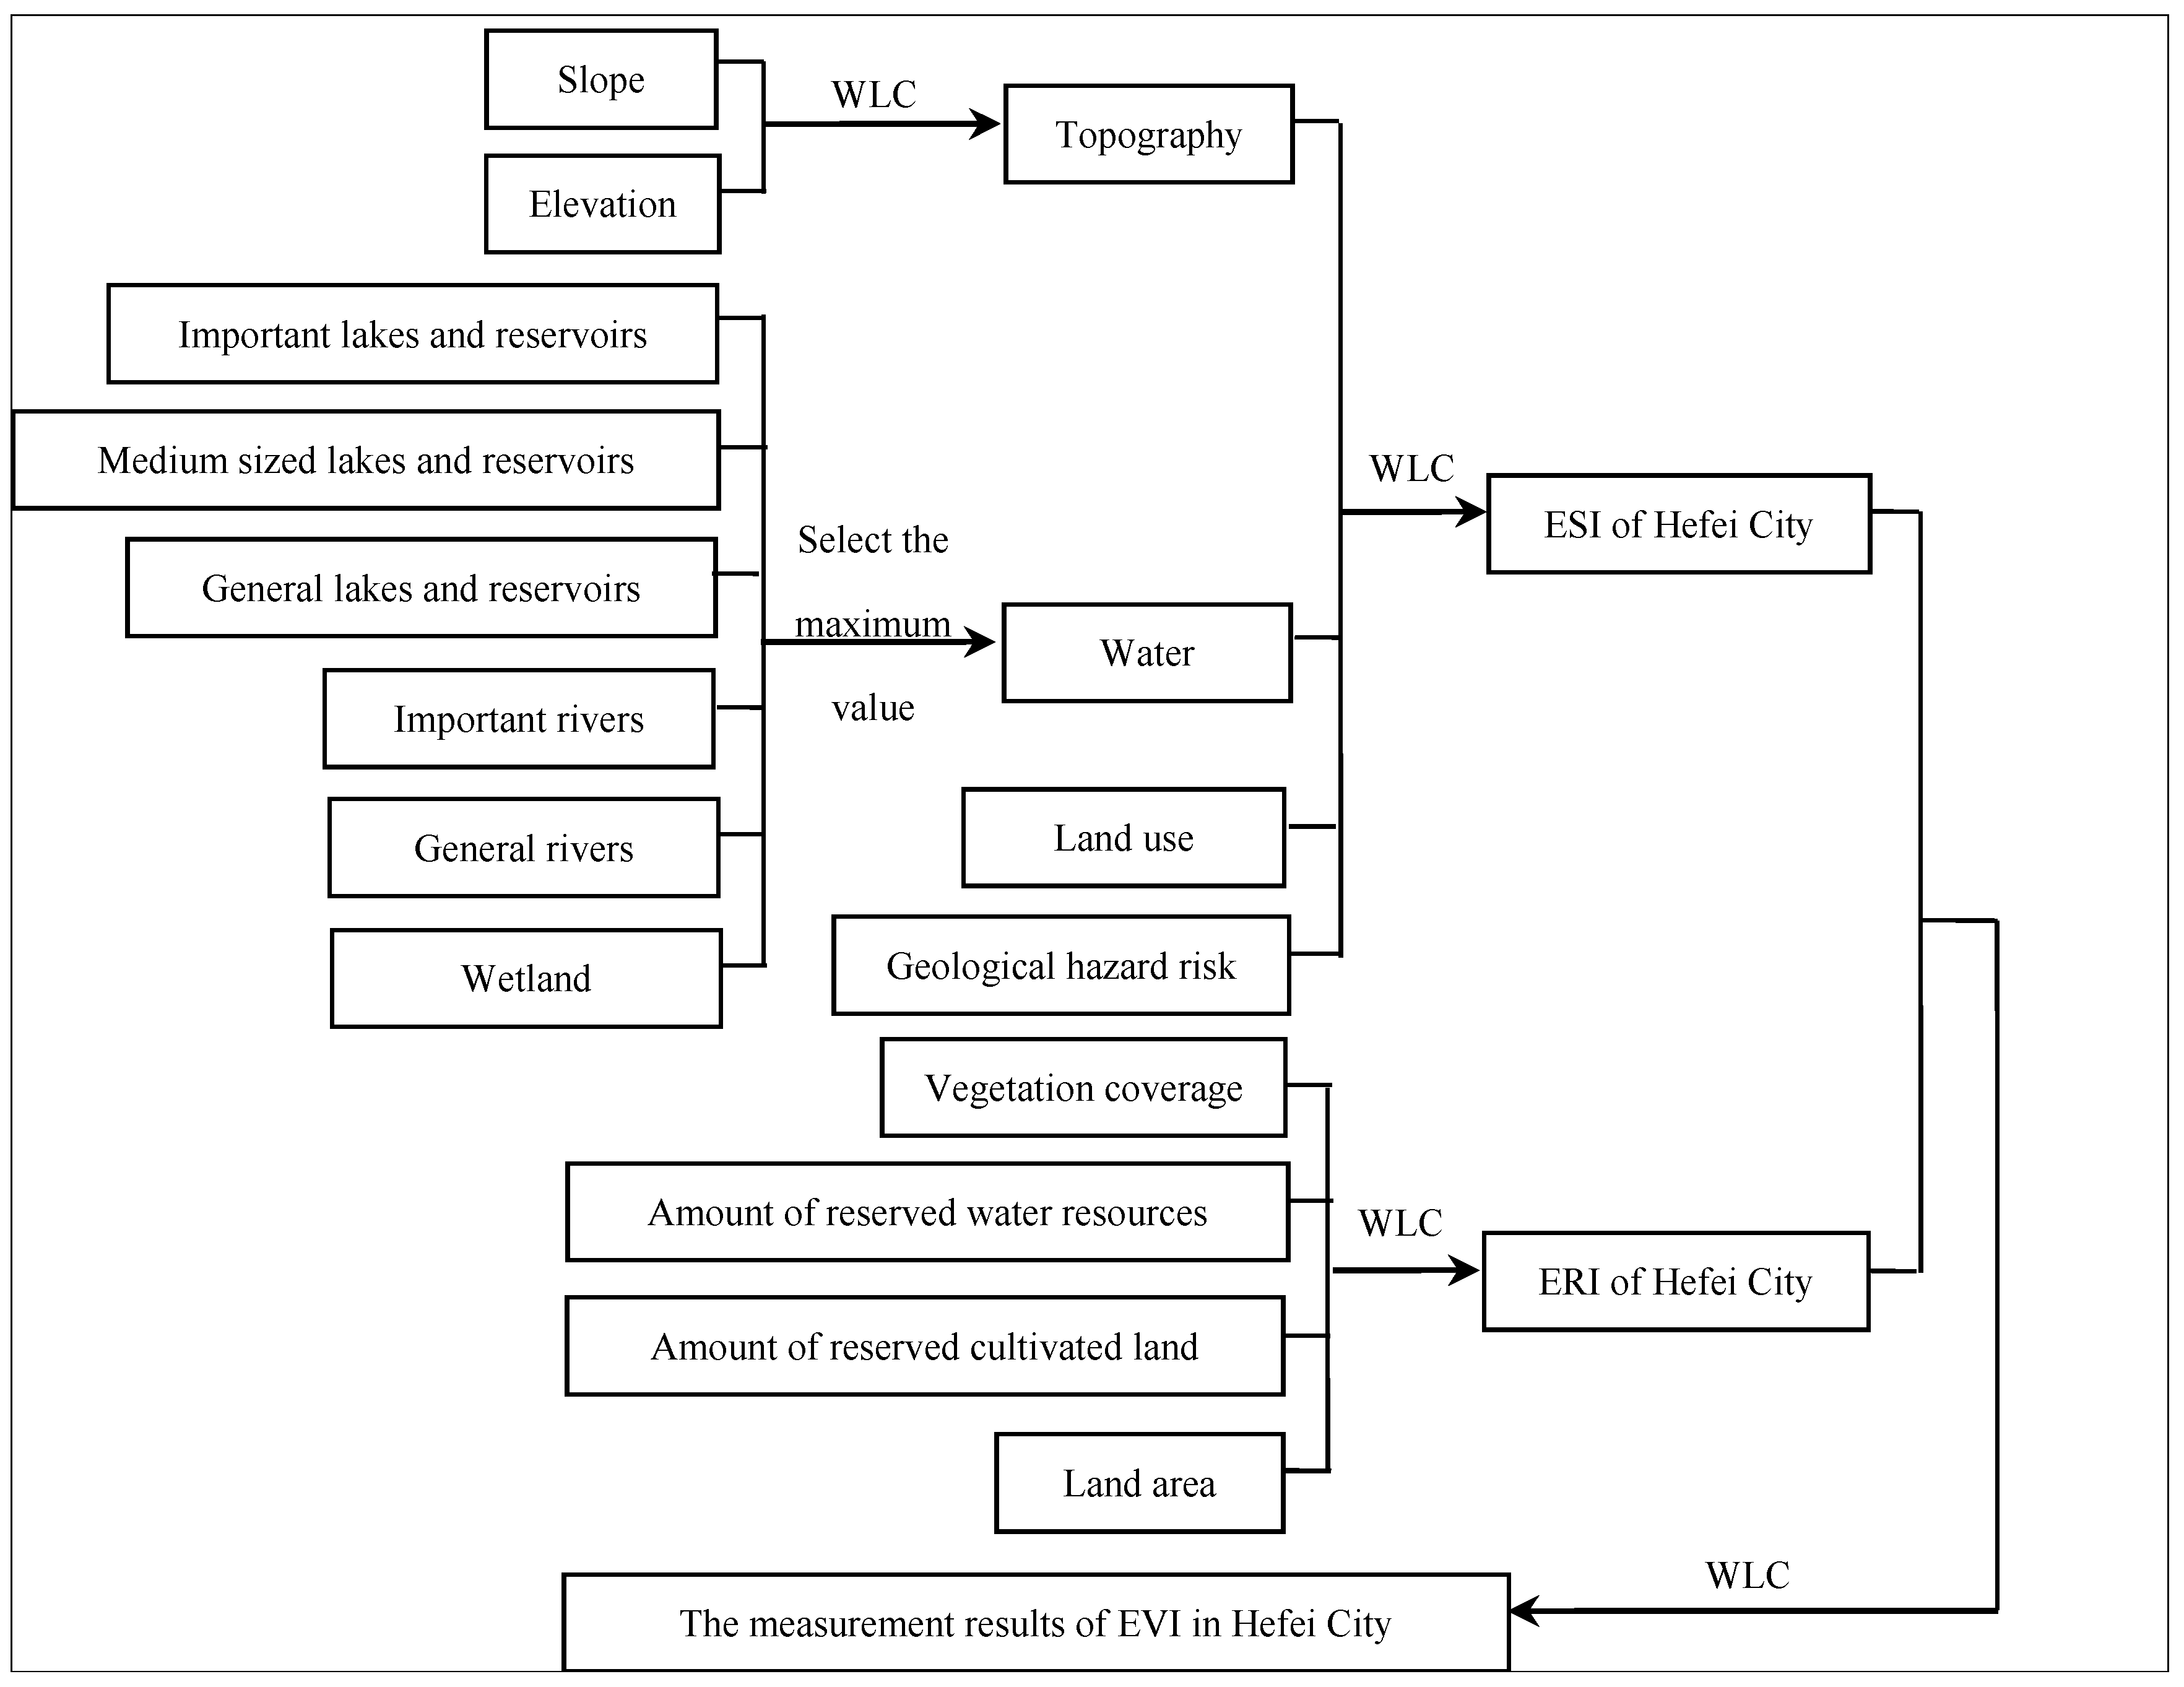
Figure 4). Rule A selects the maximum value compared with the original data, and rule B uses the WLC method (the weights of data a and b are 0.7 and 0.3, respectively). The process of index overlay and its rules are shown in
Figure 5.
It should be noted that the six second grade indices of water resource were calculated by taking the higher value, which means that the highest value output should be regarded as the final result among the various index factors. The purpose of this is to make the problem of—and the design of solutions for—ecological sensitivity more prominent in order to protect the ecology. This also reflects the “law of the minimum” in ecology [
47].
Figure 3.
Two grid data for overlay.
Figure 3.
Two grid data for overlay.
Figure 4.
Results of different overlay rules.
Figure 4.
Results of different overlay rules.
Figure 5.
The GIS spatial analysis progress of ecological vulnerability measurement in Hefei.
Figure 5.
The GIS spatial analysis progress of ecological vulnerability measurement in Hefei.
The level of ecological sensitivity serves as the root of urban ecological vulnerability as well as the internal ecology of the urban system with its inherent vulnerability and instability. Therefore, ecological sensitivity should be viewed as highly important and receive a higher level of attention. To calculate the weights of ESI and ERI by ranking method, the importance sequence values of each are 1 and 2, respectively. Equation (4) obtains the weights of ESI and ERI 0.67 and 0.33, respectively. The last step was to carry out a weighted combine of the normalized ecological sensitivity and resilience indices, thereby collecting the measurement data for the urban ecological vulnerability index of Hefei.
3.5. Zoning for Ecological Vulnerability
Following the spatial analysis shown in
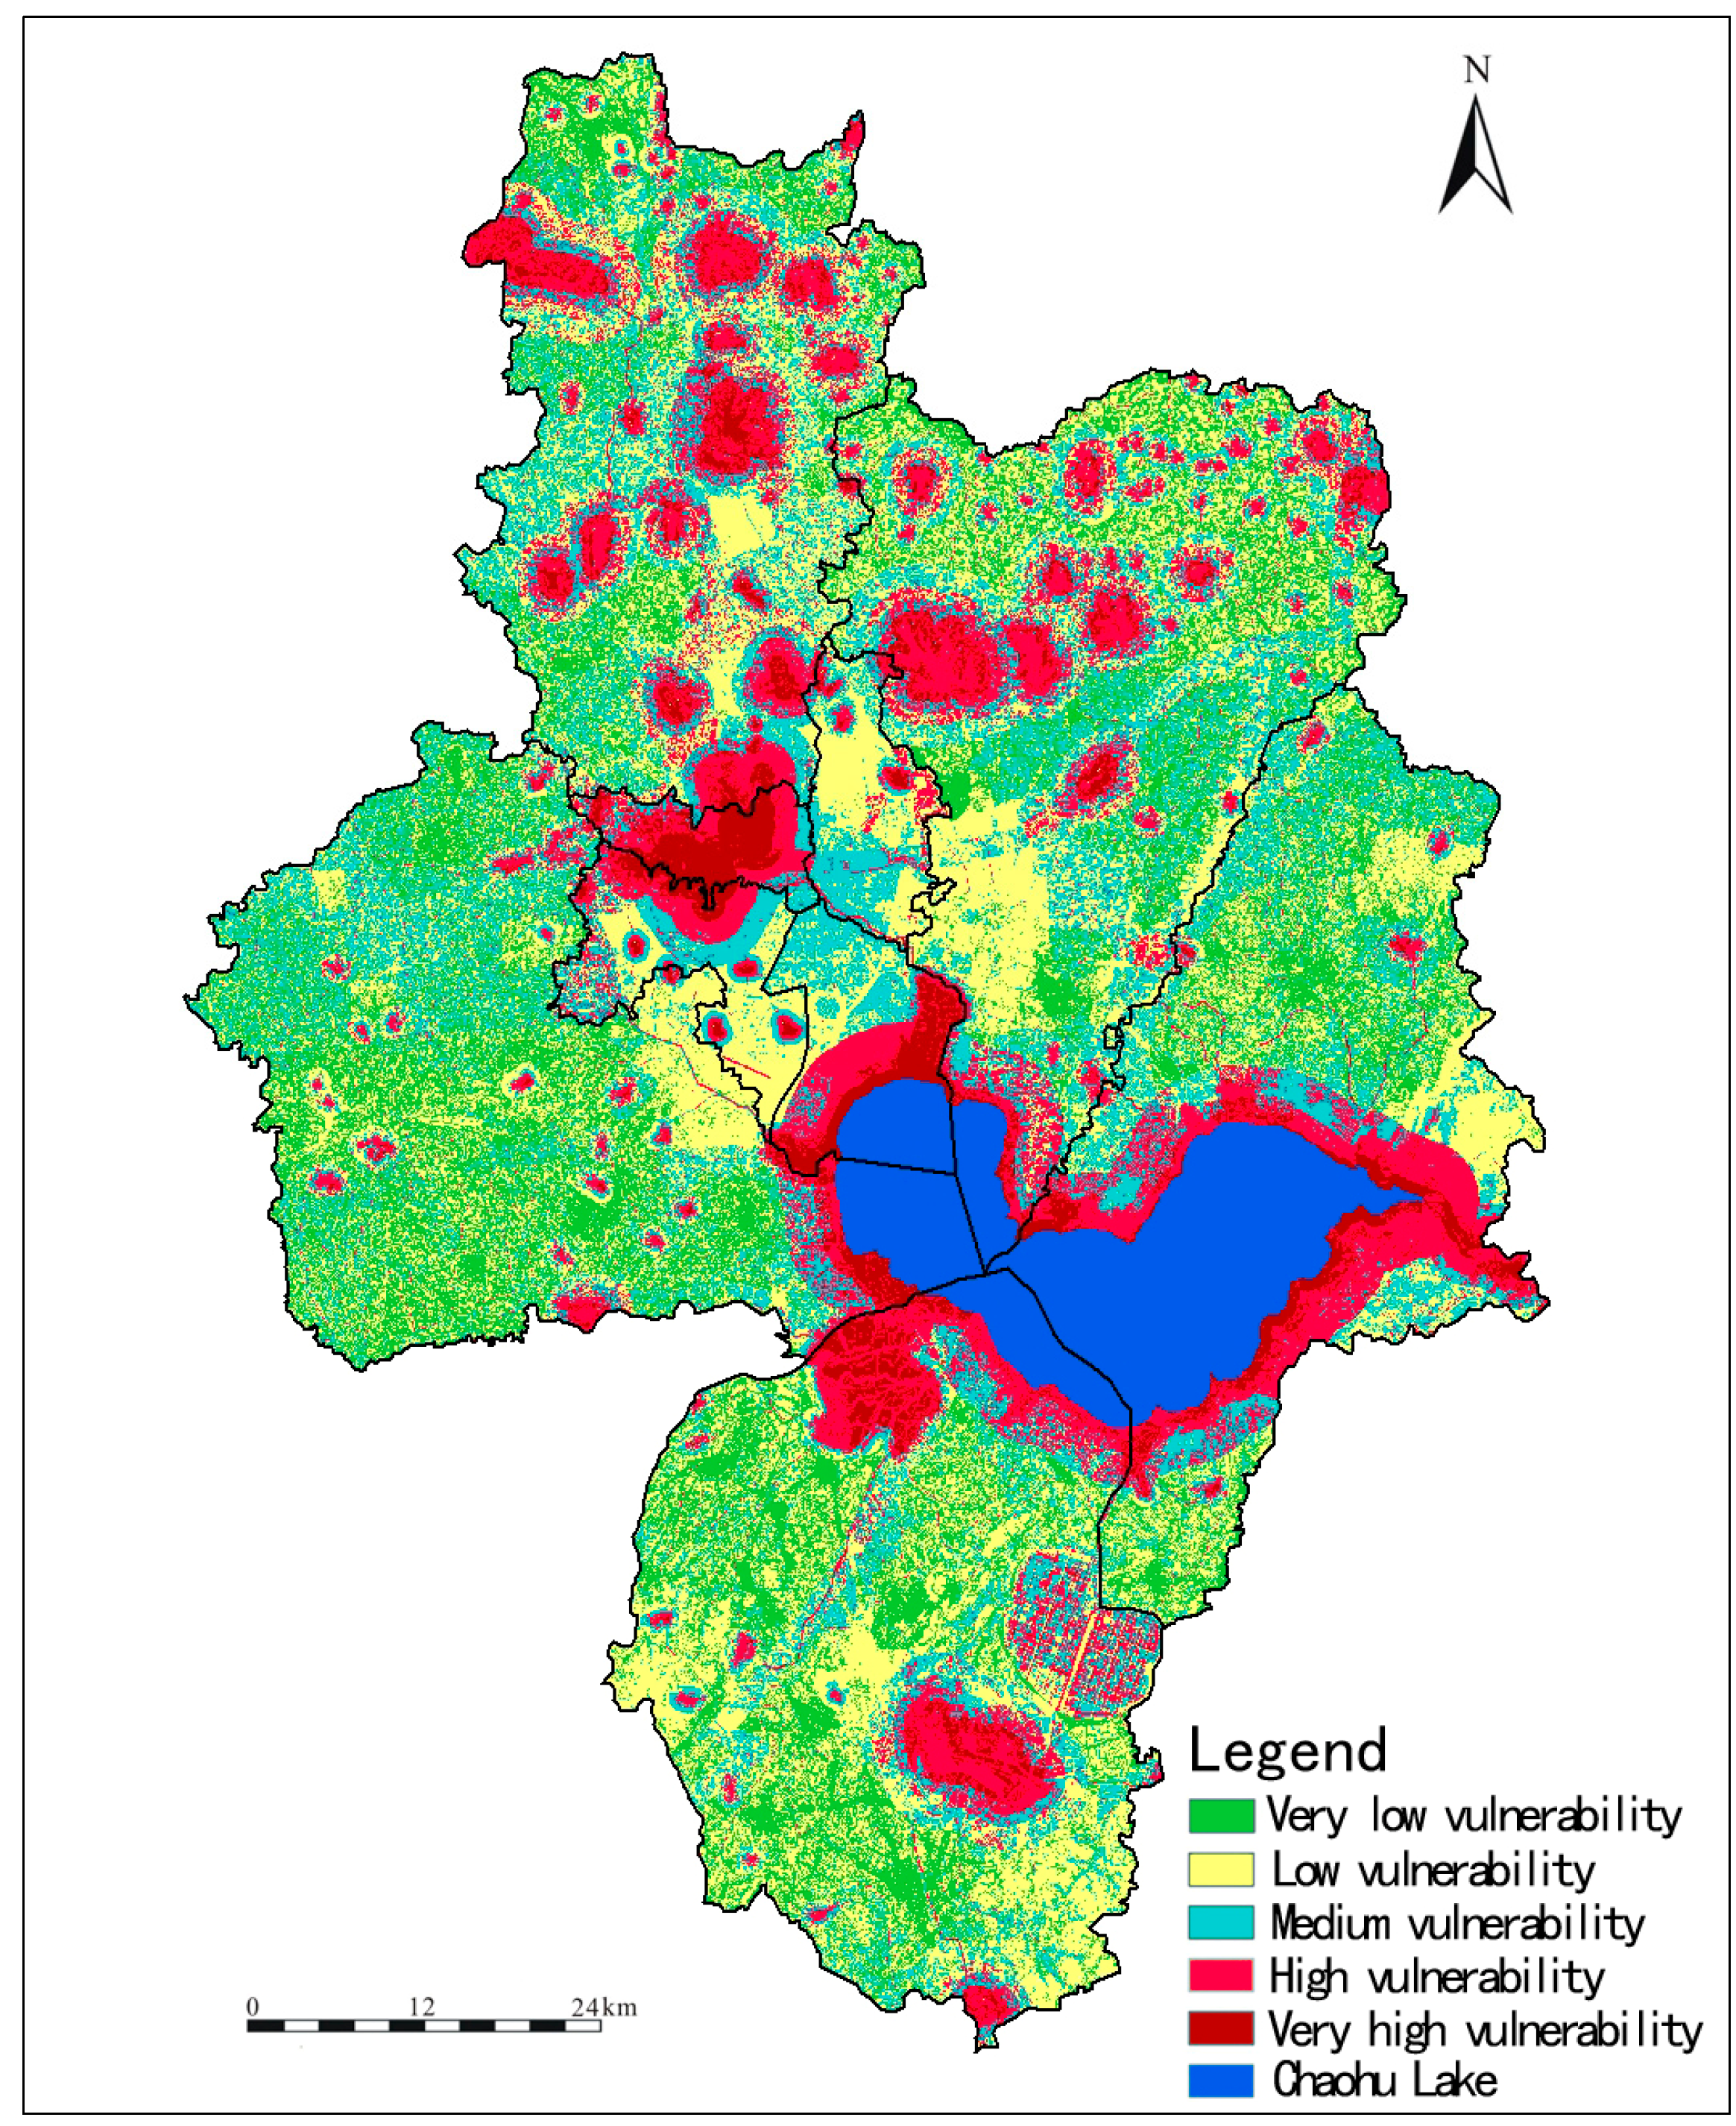
Figure 5, we obtained the measurement results of ecological vulnerability in Hefei city and were able to classify the city into five ranks according to the level of its vulnerability—very low, low, medium, high and very high, as shown in
Figure 6 and
Table 3.
It can be seen in
Figure 6 and
Table 3 that the very low vulnerability areas are mainly used as farmland, mostly in the western and southern parts of Hefei city. The low vulnerability area covers the largest area of 3731.79 square kilometers, 32.64% of the entire city area. This is mainly made up of general farmland. The urban built-up areas including the downtown area, Feixi county and Feidong county constitute the largest low vulnerability sub-area. The medium vulnerability area includes forestland, garden plots, basic farmland, the buffer zone of the river or lake reservoir and the geological hazard risk area. Those of high vulnerability are mainly Chaohu Lake and the peripheral wetlands, some core buffer zones of large and medium-sized water areas, small reservoirs and the buffer zones, geological hazard risk areas and so on. The very high vulnerability area contains Chaohu Lake and its core buffer zone, some large and medium-sized water areas and their core buffer zones.
Figure 6.
The zoning map of ecological vulnerability levels of Hefei.
Figure 6.
The zoning map of ecological vulnerability levels of Hefei.
Table 3.
The area and proportion of each ecological vulnerability area of Hefei.
Table 3.
The area and proportion of each ecological vulnerability area of Hefei.
| Vulnerability Areas | Area (km2) | Proportion (%) |
|---|
| Very low vulnerability | 2397.64 | 20.97 |
| Low vulnerability | 3731.79 | 32.64 |
| Medium vulnerability | 2240.17 | 19.59 |
| High vulnerability | 1736.98 | 15.19 |
| Very high vulnerability | 1326.43 | 11.61 |
3.6. Regulatory Zoning for Ecological Vulnerability
According to
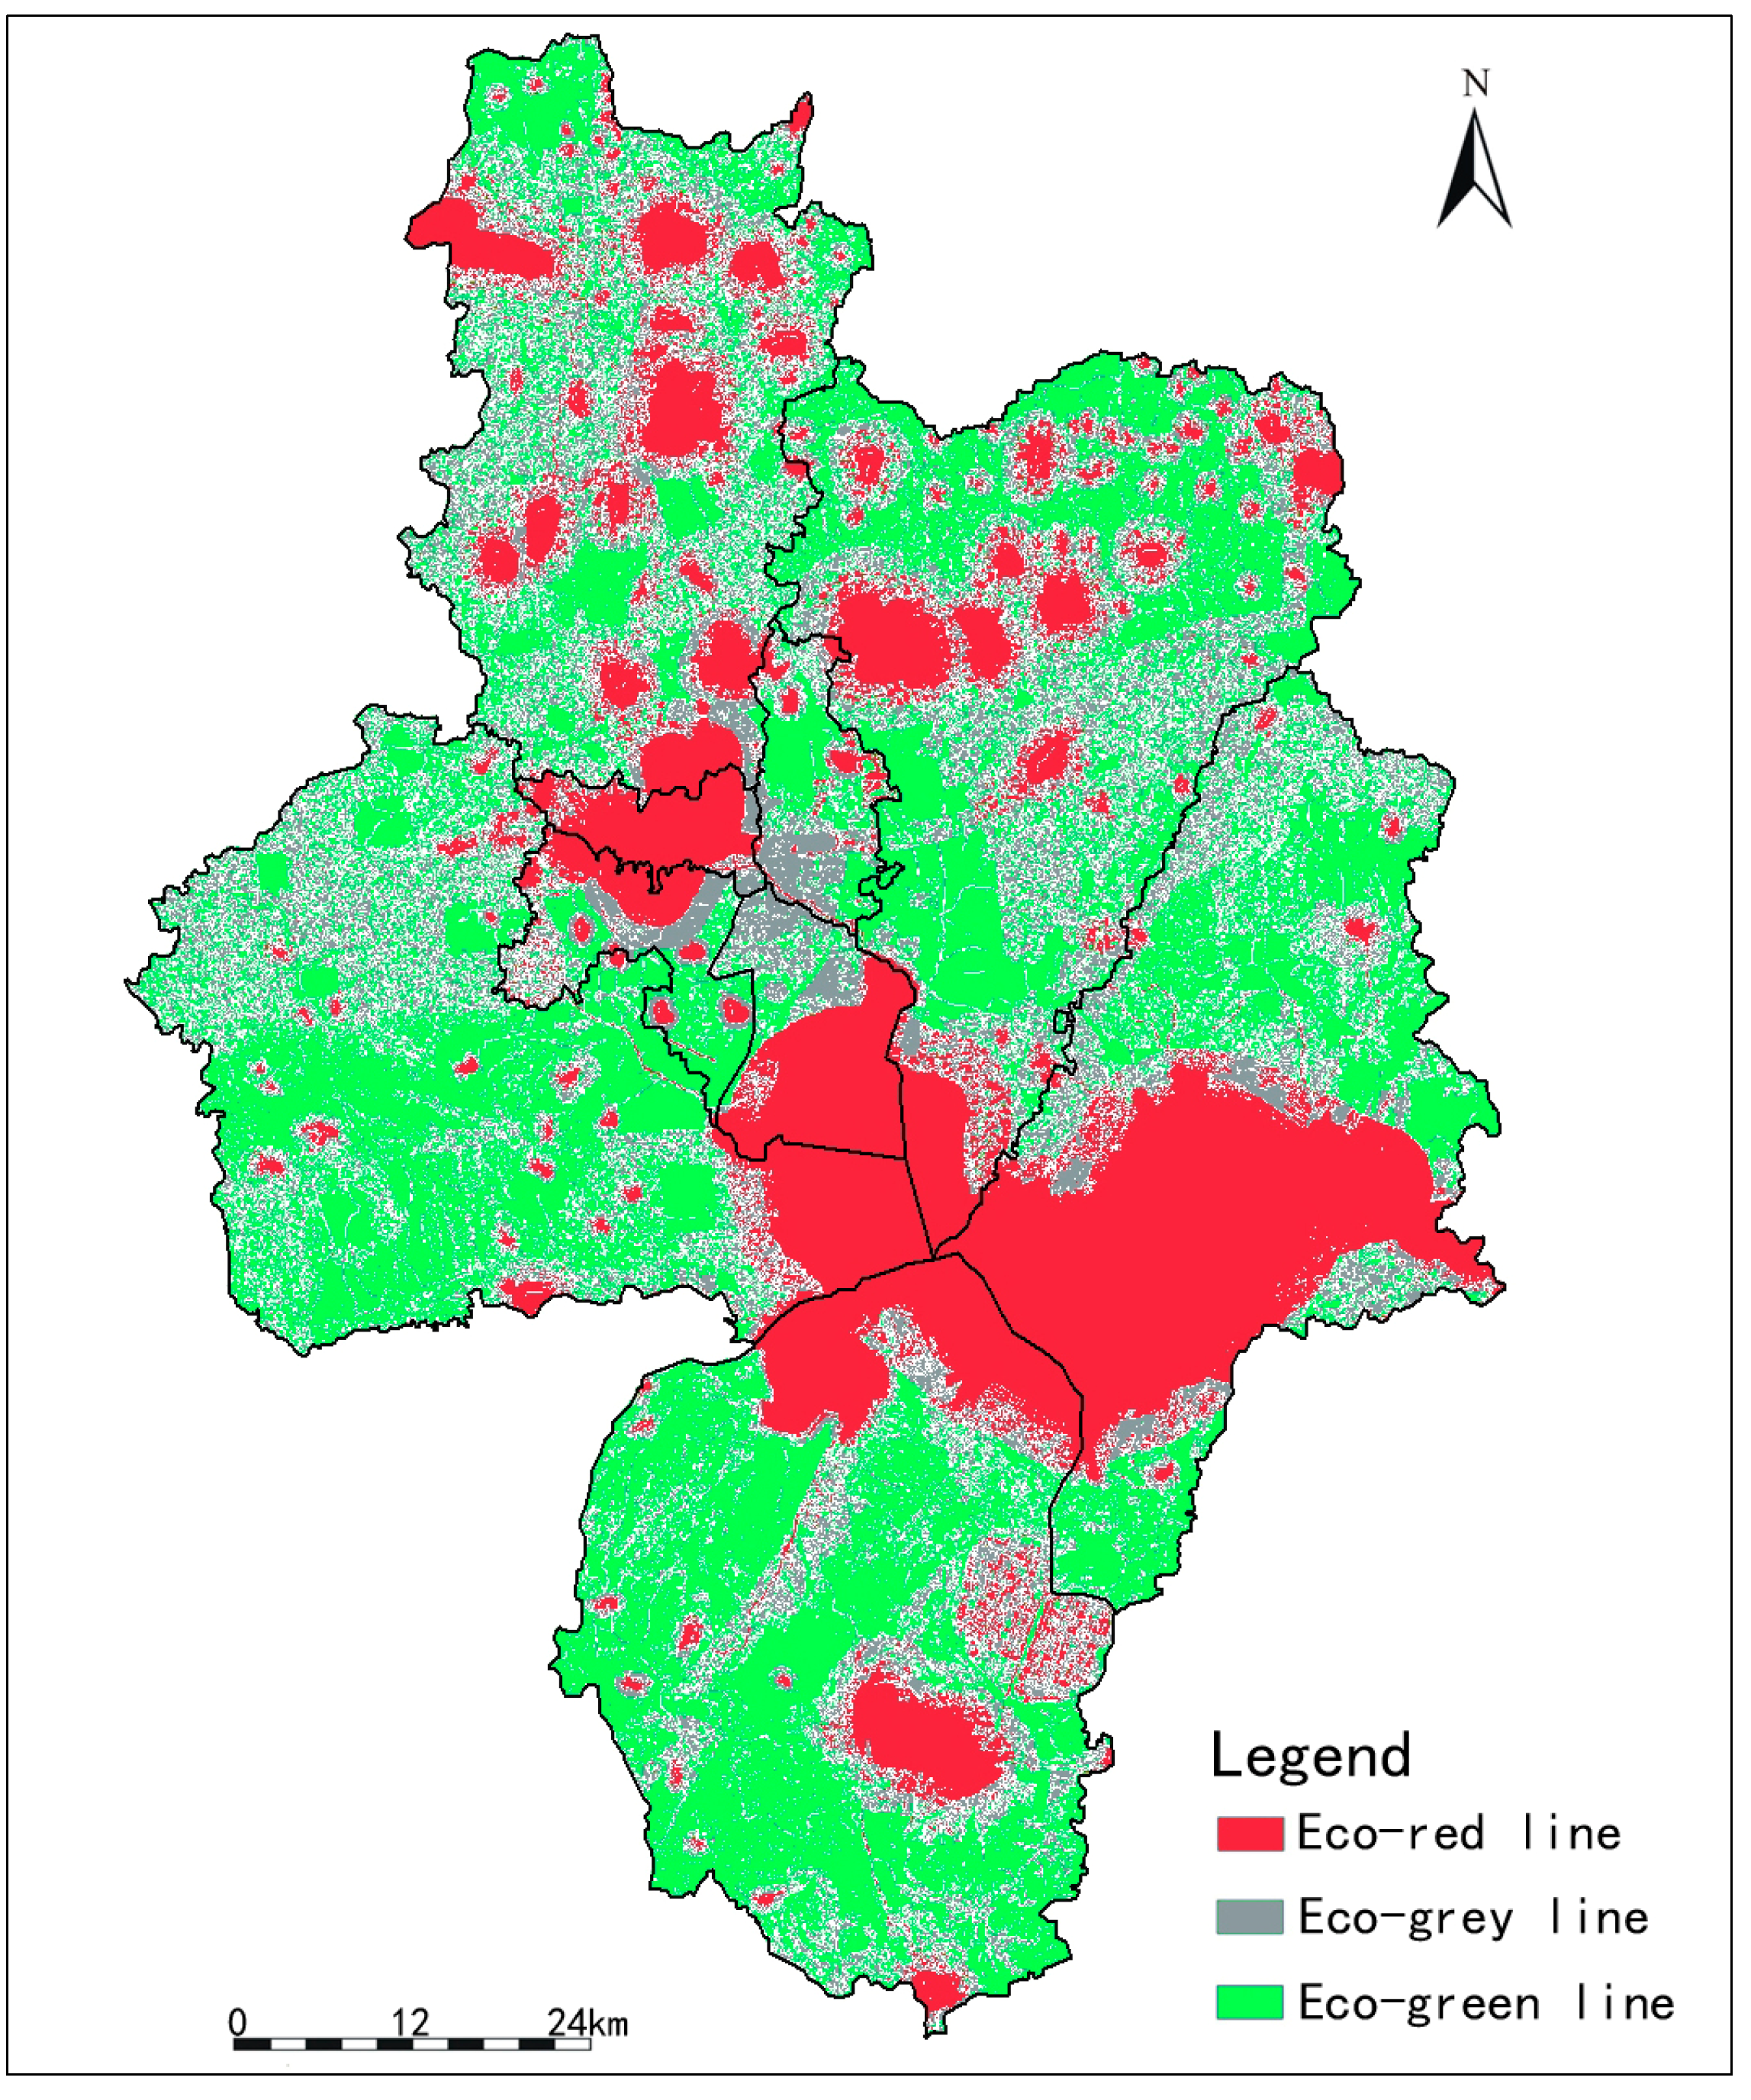
Section 2.3, five types of vulnerability areas can be further grouped into three kinds of regulatory zones—ecological green line areas, ecological grey line areas and ecological red line areas, with more details shown in
Figure 7 and
Table 4.
The right conditions enable ecological green line area to bear high-intensity construction and development, thus becoming the main carrier for the urbanization and industrialization of Hefei city. Most of the green line area is located in the central and southern part of the city and has a total area of 6129.43 square kilometers, amounting to 53.61% of the city area. It is also the largest of all three types of regulatory area, which shows that the city has a vast hinterland of rich resources conducive to future development.
The grey line area of Hefei is mainly in the northern part of the city and has a total area of 2240.17 square kilometers amounting to 19.59% of the total area—the smallest of the three kinds of regulatory zone. The red line area covers an area of 3063.41 square kilometers, equivalent to 26.80% of the total area. The large and medium-sized lakes and reservoirs surrounding the Chaohu Lake, wetlands and the core buffer zones within the area are dotted through the area. Chaohu Lake is the most important ecological resource and an important source of natural capital for Hefei city. There are also a large number of large- and medium-sized lakes and reservoirs in the city administrative area, such as Huangpi, Wanfu and Daishan Lakes, and Dafangying and Dongpu reservoirs. Given the imbalance between the increasing demands for water and the decreasing water resources of the city, these water sources are becoming more precious, and are therefore classified as the red line area.
Figure 7.
The regulatory zone of ecological vulnerability of Hefei.
Figure 7.
The regulatory zone of ecological vulnerability of Hefei.
Table 4.
The area and proportion of each regulatory zone of ecological vulnerability of Hefei.
Table 4.
The area and proportion of each regulatory zone of ecological vulnerability of Hefei.
| Regulation Zone of Vulnerability | Composition | Area (km2) | Proportion (%) |
|---|
| Eco-green line | Very low vulnerability | 6129.43 | 53.61 |
| Low vulnerability |
| Eco-grey line | Medium vulnerability | 2240.17 | 19.59 |
| Eco-red line | High vulnerability | 3063.41 | 26.80 |
| Very high vulnerability |
3.7. Regulatory Countermeasures to Ecological Vulnerability
Defining the bearing capacity of each kind of regulatory zone allows urban development requirements to be more appropriately mapped to suitable areas. The red line area represents the key natural capital and irreplaceable ecological entity of Hefei and is therefore suitable only for strictly-limited development. Industrial projects and construction in any form are forbidden, but tourism, recreation and some other activities providing ecological services for public welfare. As the area with ecological resilience, the grey line area serves as the ecological buffer zone for Hefei city. Large-scale space allows for development alongside protection of the natural environment. The main task here, where construction is essential, is to control the nature of projects, aiming for no pollution, high efficiency and low energy consumption. The green line area is the main area for urban development, and the focus is on construction to expand the economic scale of the city.
4. Conclusions and Discussion
In this paper, GIS-MCDA technology was introduced into the field of urban ecological vulnerability research. The connotation concept of urban ecological vulnerability and GIS-MCDA based measurement techniques for urban ecological vulnerability were put forward. Meanwhile, Taking the city of Hefei in China as the case study, this research quantitatively measured its ecological vulnerability based on GIS-MCDA and classified the city into five types of very low, low, medium, high and very high levels of vulnerability. These were further classified into three kinds of ecological regulatory zone—green line, grey line and red line areas. Ecological green line areas were the largest, amounting to 53.61% of the city area. Ecological grey line areas were the smallest, amounting to 19.59% of the total area. This means that there are sufficient spatial resources for future development of urbanization in Hefei city. Finally, this paper suggested regulatory countermeasures and development strategies for each regulatory zone in Hefei city. We would argue that classifying areas should be compulsory when devising planning regulations, with the areas clearly shown in the construction and development control index and other compulsory elements of the ecological regulatory area. Our findings also suggest that the authorities of Hefei use the Administrative Method on the Urban Ecological Vulnerability Regulatory Zoning at a strategic level for sustainable development in coordination with urban planning, national land resources, ecological protection and other administrative policies. The Method should include the delineated principles, the construction development, industrialization guidance, incentive mechanisms and the implementation of the three kinds of vulnerability regulatory areas, thereby forming a set of systematic policies for taking vulnerability into account.
Overall, this research can provide references for urban spatial zoning study and practice in urban planning such as ecological function zoning, environmental zoning, spatial structure zoning from a methodological point of view. The work was carried out by following the classic technical route of GIS-MCDA. The measurement index system was created based on ecological sensitivity and ecological resilience. Two different weight calculation methods—ranking and AHP—were used according to the characteristics of the index system. Maximum value and WLC rules were applied as the overlay rules to get the final results of the vulnerability measurement. Under the research context, the study shows that we can use the powerful spatial analysis techniques of GIS as long as a planning research problem (especially ones related to spatial zoning) can be solved by following the classic technical route of GIS-MCDA, based on the index system, index weights and overlay rules. In addition, the visual interface of GIS allows researchers to establish a clearer and smoother communication channel, which can greatly enhance the efficiency of problem-solving in urban planning.
This study may provide a scientific basis for urban ecological protection and construction in other cities in developing countries (including China). For example, Chinese cities are now places where conflicts between economic development and ecological protection are at their most intense [
48]. The urban ecology is increasingly vulnerable. How to effectively control the vulnerability has become a major subject both for theoretical research and practical exploration [
49]. Traditional Chinese urban ecological risk assessment and management is often built on the subjective judgment of government officials and planners, which often leads to ineffective and unscientific decisions. Therefore, this paper provides a new way of thinking and a new approach for the protection, construction, evaluation and management of the urban ecology in China and other developing countries. On the one hand, ecological vulnerability constituted by ecological sensitivity and ecological resilience can provide a new idea on urban ecological risk assessment for those cities in developing countries. The new idea can obtain a more comprehensive and systematic measurement result of urban ecological vulnerability. On the other hand, this work can offer an effective approach for urban ecological risk management based on the vulnerability regulatory zones. Specifically, cities can clearly define the areas that should be protected as ecological red line, the areas that can be moderately exploited as ecological grey line and the areas that can be intensively developed as ecological green line. In this way, the urban ecology can be developed and protected in a coordinated way. Moreover, the risk of urban ecological problems will be controlled at a low level, thus conducive to sustainable development of cities in developing countries.
Although GIS-MCDA techniques have been widely used in the fields of urban, regional and environmental planning and management, there are still few actual studies on the application of GIS-MCDA to the field of urban ecological vulnerability. From this point of view, this study helps to expand the application of GIS-MCDA techniques. However, there are still some aspects should be further studied. Future research should focus on the sensitivity of index weights. We plan to carry out weight sensitivity analysis and uncertainty analysis of GIS-MCDA applied to the measurement of urban ecological vulnerability. Secondly, it is necessary to use a new weight calculation method, such as fuzzy AHP, to minimize the impact of weight sensitivity on the results. It is inevitable, of course that some limitations of the study, such as the problem that GIS analysis results are susceptible to data inaccuracy, could lead to error in the vulnerability measurement. The spatial resolution of data used in this study is 30 meters. A pixel of 900 square meters only represents one type of vulnerability area such as low vulnerability area. While if the resolution is 10 m, the pixel can be classified into 9 pixels in a detailed way, thus obtaining more accurate results. For instance, 8 of 9 pixels continue to represent the low vulnerability area while 1 pixel changes to the very low vulnerability area. It indicates that the possible deviation of the study result reaches 11% according, to rough estimation in the context of 30-mspatial resolution. Hence, when the situation allows, data of higher accuracy should be selected if possible to ensure the precise results of research to the largest extent. In addition, the stability and reliability of the study needs further discussion. For example, when land use indicator is ignored, it means that the weights of other three indicators will have changes, thus causing the different measurement results. Given the data is accessible; therefore, measurement indicators should be selected on a comprehensive basis in order to ensure the stability and liability of the final results of the study.
The problems regarding the spatial data accuracy and indicator selection above-mentioned show that the researchers need to have more accurate data for options and establish a more comprehensive measurement index system when conditions permit. At the same time, when index system, index value, index weight and overlay rule are consistent, the results should have repeatability and testability. Only in this way, it will ensure a more accurate and stable study result.
Despite the limitations, this paper adopts the vulnerability index as a method for illustrating the essential characteristics of the urban ecology. It provides a method to quantitatively measure and regulate urban ecological vulnerability, which can be regarded as one useful attempt and exploration in urban vulnerability research field by using GIS-MCDA methods. With more and deeper research, urban ecological vulnerability studies will be improved, thus contributing more scientific support and guidance for urban sustainable development.


