Article

Using Multiple Tools to Analyze Resource Exchange in China

1
School of Information Management, Beijing Information Science & Technology University, Beijing 100192, China
2
School of Environment, State Key Joint Laboratory of Environment Simulation and Pollution Control, Tsinghua University, Beijing 100084, China
3
College of Architecture and Environment, Sichuan University, Chengdu 610065, China
4
Civil and Environmental Engineering School, University of Science and Technology Beijing, Beijing 100083, China
*
Author to whom correspondence should be addressed.
Sustainability 2015, 7(9), 12372-12385; https://0-doi-org.brum.beds.ac.uk/10.3390/su70912372
Submission received: 19 June 2015 / Revised: 6 August 2015 / Accepted: 21 August 2015 / Published: 10 September 2015

Abstract

:
With the rapid development of globalization, the function of international physical resource exchange is becoming increasingly important in economic growth through resource optimization. However, most existing ecological economy studies use physical trade balance (PTB) directly or use physical imports and exports individually to analyze national material metabolization. Neither the individual analysis of physical imports and exports nor the direct analysis of PTB is capable of portraying the comprehensive contributions of a certain product to total physical trade. This study introduced an indicator, i.e., the physical contribution to the trade balance (PCB), which evolved from the traditional index of contribution to the trade balance (CB). In addition, trade balance (TB), PTB, CB, and PCB were systematically related and combined. An analysis was conducted using the four tools to obtain overall trade trends in China. This study discovered that both physical trade value and quantity exhibited different characteristics when China joined the World Trade Organization in 2002 and experienced the global economic crisis in 2009. Finally, the advantages of a supporting policy decision by applying multiple analytical tools to physical trade were discussed.

1. Introduction

With the rapid development of globalization, the function of international resource exchange or physical trade has become increasingly important in economic growth through resource optimization. Most countries are becoming increasingly dependent on the imports of certain resources to maintain national production and consumption, as well as on supplying certain types of resources to the rest of the world [1,2]. Therefore, physical trade has drawn increasing attention in national-, ecological-, socio-political-, and economic-related studies [3,4]. Such studies are commonly based on the framework of economy-wide material flow analysis (EW-MFA) [1,5]. EW-MFA defines the total domestic material input (DMI) of a nation as domestic extraction (DE) plus imports; meanwhile, domestic material consumption (DMC) is defined as DMI minus exports [6].
For example, the international physical trade of the European Union-27 increased significantly from 2000 to 2007, with imports increasing by 21% and exports increasing by 18%. During this period, DE in these countries only increased by 5%. In addition, the ratio of physical trade balance (PTB) to DE rose from 15% to 20% [7]. Moreover, countries in Asia, such as Malaysia, Thailand, Japan, and China [8], experienced an increase in physical trade [9]. In addition, resource productivity derived from EW-MFA is widely recognized as the gross domestic product (GDP) output per unit of DMC, which can also be calculated as DE plus PTB [10]. Therefore, increasing attention has been paid to physical trade because of the growing influence of this concept on overall material metabolism in recent years [5,11]. However, the direct trade flows do not include the up- and down-stream raw material equivalents related to the international trades without implied environmental burden. In addition, research on corresponding indirect flows and embodied emissions, which can provide a comprehensive perspective on the effects of international trade on the global environment, is continuously conducted [2]. For example, most studies have focused on air emissions embodied in international trade, particularly carbon dioxide [12]. Other hot spots include embodied resources (raw material equivalents), embodied water flow [2,13], and indirect ecological effects [14,15]. However, all existing studies use physical imports and exports individually through input–output tables or structural decomposition analysis.
In fact, most countries import and export the same types of goods simultaneously, which is known as intra-industry trade (IIT). The most widely accepted explanation for this phenomenon is Krugman’s new trade theory [16] because trade is specialized to take advantage of increasing returns rather than following differences in regional resource endowments. Therefore, neither the individual analysis of physical imports and exports nor the direct analysis of PTB can portray comprehensive contributions to total physical trade of a certain product. In the present study, we use an index of physical contribution to the trade balance (PCB) as an expansion method of analyzing physical imports and exports. Moreover, we systematically relate the PCB results to the traditional index of contribution to the trade balance (CB) and the PTB results. This relation provides an analytical framework that connects the economy and EW-MFA research on physical imports and exports.
China during the first decade of the new century (2000–2009) was chosen as the study subject based on the following reasons. (1) The economy of China has been experiencing a rapid growth stage, with an average annual GDP increase of 10.5%; (2) the accession of China to the World Trade Organization (WTO) in November 2002 has brought unprecedented opportunities and challenges to its international trade [17]; (3) the global financial crisis that started in the autumn of 2008 is covered in the target time frame. The dramatic change in international trade experienced by China in the last decade provides diverse samples to compare different alternatives to trade analysis methods [18].
The present study uses four approaches, i.e., trade balance (TB), PTB, CB, and PCB, to analyze Chinese international trade from 2000 to 2009. Aside from physical trade, value quantity is also analyzed to explore the patterns behind international material exchange, which may provide the country with a comprehensive understanding of international material flows and support further political decisions.

2. Methodology and Data

2.1. Methodology

The EW-MFA introduces two physical trade flows: physical international imports (PIM) and physical international exports (PEX) [19]. The derived indicators of PTB can be expressed as follows (Equation (1)):
P T B = P I M P E X
where PIM and PEX represent physical imports and exports, respectively. The monetary trade balance is defined as exports (EX) minus imports (IM) in value quantity, as shown in Equation (2):
T B = E X I M
Robinson [20], Balassa [21], and Grubel [22] first introduced IIT as a measuring pattern of trade goods. IIT refers to the exchange of product groups belonging to the same industry, in which the same types of goods are simultaneously imported and exported. IIT has various indices, including the Grubel–Lloyd (G&L) index, the Balassa index, the Aquino index, the CB index, and so on. We chose CB [23], which Lafay first proposed to originally measure revealed comparative advantage (RCA), as the prototype of the PCB model (Equation (3)). The combined effects between resource endowment and technology influence RCA among countries [24].
C B i = x i m i i = 1 n ( x i + m i ) i = 1 n x i i = 1 n m i i = 1 n ( x i + m i ) × x i + m i i = 1 n ( x i + m i )
where xi is the export of product i, mi is the import of product i, and n represents all product categories. CBi, as the indicator of the contribution of a product to the trade balance of a country, may also be written as follows:
C B i = t s i × x i + m i i = 1 n ( x i + m i )
where the trade specialization index (tsi), which indicates the distribution of normalized trade balances in a country among its various products, can be defined as the difference between the normalized trade balance in a product (zi) and the total balance (Z), as follows:
t s i = z i Z
where zi is defined as the ratio of the trade balance to the total value of trade (exports plus imports), that is,
z i = x i m i x i + m i
Total balance (Z) can be expressed as follows:
Z = i = 1 n x i i = 1 n m i i = 1 n ( x i + m i )
CB depends on the intensity of specialization (ts) and on the relative scale of trade flow. The contribution of a product to trade balance may decrease, despite an increase in the intensity of specialization, if the relative scale continues to decline.
To analyze physical trade activity, we adjusted the CB index into the PCB index as follows:
P C B i = p x i p m i i = 1 n ( p x i + p m i ) i = 1 n p x i i = 1 n p m i i = 1 n ( p x i + p m i ) × p x i + p m i i = 1 n ( p x i + p m i )
where pxi is the physical exports of product i and pmi is the physical imports of product i. PCBi can be used to analyze either a single type of product or certain groups of products according to various research demands. For example, products may be grouped based on either industrial or material categories.
Similarly, the definitions of the normalized physical trade balance in a product (pzi) and total physical balance (pZ) are as follows:
p z i = p x i p m i p x i + p m i
p Z = i = 1 n p x i i = 1 n p m i i = 1 n ( p x i + p m i )

2.2. Data Source

All trade data on the physical and value quantities in China are collected from the UN Comtrade Database [25]. In the national monetary input–output table (MIOT), all trade commodities are classified into certain sectors according to their Standard International Trade Classification (SITC) code. The allocation between commodity SITC and material production sectors is cited from publications of the National Bureau of Statistics of China [26,27]. Although the MIOT of China has 42 sectors [26], the first 22 sectors are the material production sectors because they are the only sectors that import and export physical commodities.
Unlike the annual trade data in value quantity with exhaustive official statistics, physical trade statistics comprise all uncertainties in this study. Inherent uncertainties are inevitable because all physical trade data were collected from the UN Comtrade Database. Meanwhile, not all mass data were collected from Chinese Custom Reports [28] because Comtrade estimates part of these data. The only other source of physical Chinese import and export data, i.e., the Ports-of-Entry Yearbook of China from the China Association of Port-of-Entry [29], does not include detailed categorized data. This yearbook only counts the total weight of Chinese port throughputs. Although the weights of import and export products are also estimated in this yearbook, the estimation methods are not clearly mentioned. The total weight provided in the yearbook is generally 13%–16% higher than that of the UN Comtrade every year. Estimation is possibly based on the standard load of the containers in port-of-entry sites. With regard to the sharp increase in physical exports in 2002 (UN Comtrade Database), the physical exports presented in the yearbook were nearly tripled. Consequently, we consider the UN Comtrade Database to be more reliable and appropriate for international comparative studies because it exhibits unified global physical trade data processing.

3. Result

3.1. International Trade of 22 Material Production Sectors in Value and Physical Quantity

As shown in Table 1, all trade commodities were classified into 22 material production sectors according to Table S1 in the commodity allocation of SITC and material production sectors in the supplementary file. Overall, the value and physical quantity of international trade were significantly different. The following aspects can reflect these results.
Table 1. Material and nonmaterial production sectors.
IDMaterial Production Sectors
01Agriculture, Forestry, Animal Husbandry & Fishery
02Mining and Washing of Coal
03Extraction of Petroleum and Natural Gas
04Mining of Metal Ores
05Mining and Processing of Nonmetal Ores and Other Ores
06Manufacture of Foods and Tobacco
07Manufacture of Textile
08Manufacture of Textile Wearing Apparel, Footwear, Caps, Leather, Fur, Feather(Down) and Its products
09Processing of Timbers and Manufacture of Furniture
10Papermaking, Printing and Manufacture of Articles for Culture, Education and Sports Activities
11Processing of Petroleum, Coking, Processing of Nuclear Fuel
12Chemical Industry
13Manufacture of Nonmetallic Mineral Products
14Smelting and Rolling of Metals
15Manufacture of Metal Products
16Manufacture of General Purpose and Special Purpose Machinery
17Manufacture of Transport Equipment
18Manufacture of Electrical Machinery and Equipment
19Manufacture of Communication Equipment, Computer and Other Electronic Equipment
20Manufacture of Measuring Instrument and Machinery for Cultural Activity & Office Work
21Manufacture of Artwork, Other Manufacture
22Scrap and Waste
IDNon-Material Production Sectors
23Supply of Electric Power and Heat Power
24Distribution of Gas
25Production and Distribution of Water
26Construction
27Traffic, Transport and Storage
28Post
29Information Transmission, Computer Services and Software
30Wholesale and Retail Trades
31Hotels and Catering Services
32Financial Intermediation
33Real Estate
34Leasing and Business Services
35Research and Experimental Development
36Comprehensive Technical Services
37Management of Water Conservancy, Environment and Public Facilities
38Services to Households and Other Services
39Education
40Health, Social Security and Social Welfare
41Culture, Sports and Entertainment
42Public Management and Social Organization
Note: The 22 material production sectors are the first 22 categories in Table 1.

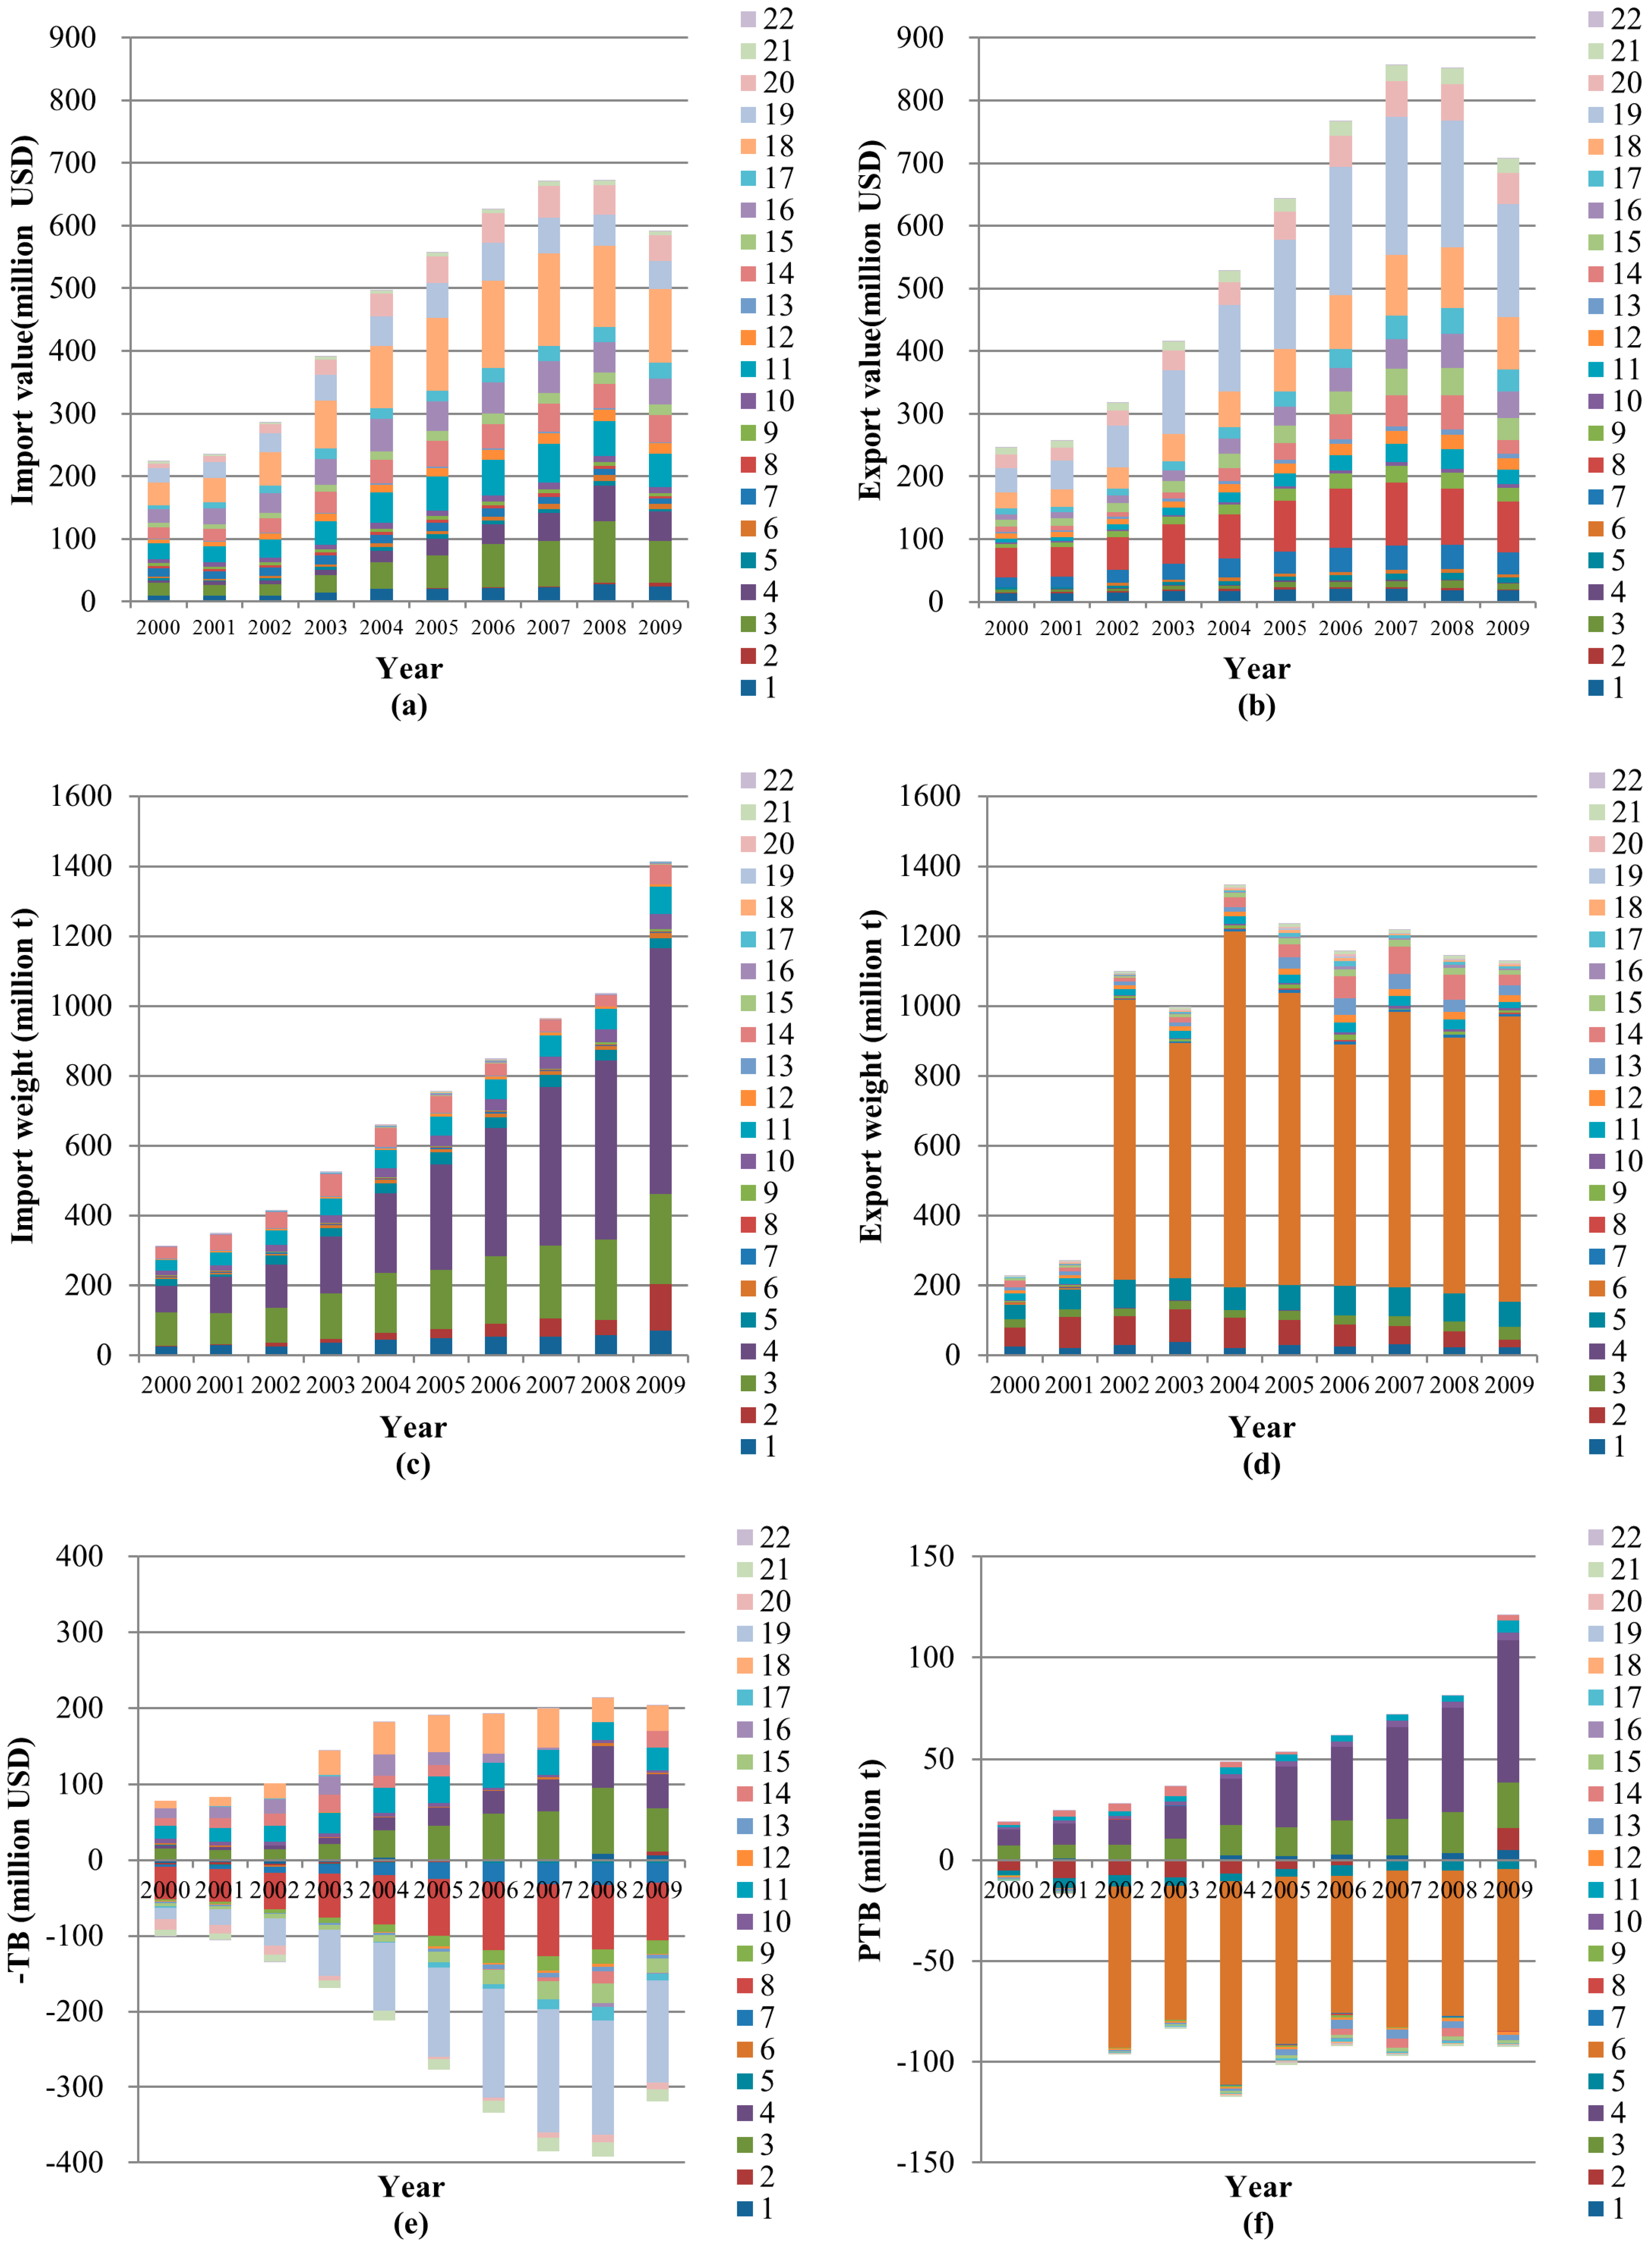
3.1.1. Total Imports and Exports

No linear relation was observed between value and physical trade in either imports or exports. For example, the value of exports increased only by 26% in 2002, whereas physical quantity increased by as high as 306%. Moreover, imported physical quantity significantly increased instead of decreased in 2009 when import value fell.

3.1.2. Import and Export Components

The values and physical quantities of different industries are significantly different. The prices of products with equal weights vary due to the nature of commodities. Meanwhile, the ratio of product value to physical quantity within the same industry has been constantly changing over the last decade. Two reasons may explain this phenomenon.
(a)
The change in trade structure of the same industry. For example, both the values and physical quantities of biomass export products have massively increased since 2002. The value (in million USD) increased from 29 (2000) and 32 (2001) to 5218 (2002), and the physical quantity (in million tons) rose to 803 (2002) from 3.86 (2000) and 3.94 (2001). These events were strongly connected to the accession of China to WTO in 2002, which removed the existing tariff barrier and allowed Chinese biomass products with low added values to increase their competitiveness. The prices of these products were also significantly lower than those in other sectors, and total gross became an important component of physical exports (Sector 6) after 2002. Although the export values of biomass products have increased substantially since 2002, their overall proportion remains below 2.5%, which is too slim to be recognized in Figure 1b. However, export physical quantities have risen from 2% to above 60%.
Figure 1. International trade of 22 material production sectors according to (a) import value; (b) export value; (c) import weight; (d) export weight; (e) −TB, and (f) PTB. Note: all the detail data used in Figure 1 is listed in Tables S3–S8 of the Supplementary File.
Sustainability 07 12372 g001
(b)
The change in unit mass price in all industries. In the last decade, the product prices of all industries were constantly changing. The added values of products in most industries increased. A special situation occurred during the global economic crisis in 2009. The physical quantity of “SITC 321 coal”, “SITC 322.1 solid fuels manufactured from coal”, “SITC 345 coal gas”, and “SITC 325 coke and semi-coke of coal” (Sector 2), as well as of “SITC 274.2 iron pyrites” and “SITC 281 iron ore and concentrates” (Sector 4), increased significantly in the import component while the corresponding total import value decreased compared with that in previous years. This situation occurred because the effect of the global economic crisis on China was relatively small, which should be attributed to its different economic system mechanism. The special situation of the raw product groups in these two sectors caused the aforementioned difference in value and physical quantity in 2009.

3.1.3. Trade Balance

China has been in a favorable balance of trade (value) in the last decade. Before 2007, surplus was constantly increasing. The growth of surplus was faster from 2005 to 2007 and slightly declined in 2008 and 2009. By contrast, PTB exhibited a fluctuation tendency. Imported physical quantity was larger than exported physical quantity in 2000, 2001, and 2009. Meanwhile, exported physical quantity was larger than imported physical quantity in other years. In addition, no correlation between value and physical quantity was observed.
According to the detailed trade data, nearly all products are being imported and exported simultaneously. A simple individual analysis of imports and exports, and trade balance and PTB of the value as well as physical quantity can hardly explain the contribution of each sector or sector combinations to the entire international trade and material flow. Consequently, CB and PCB are chosen as analytical approaches.

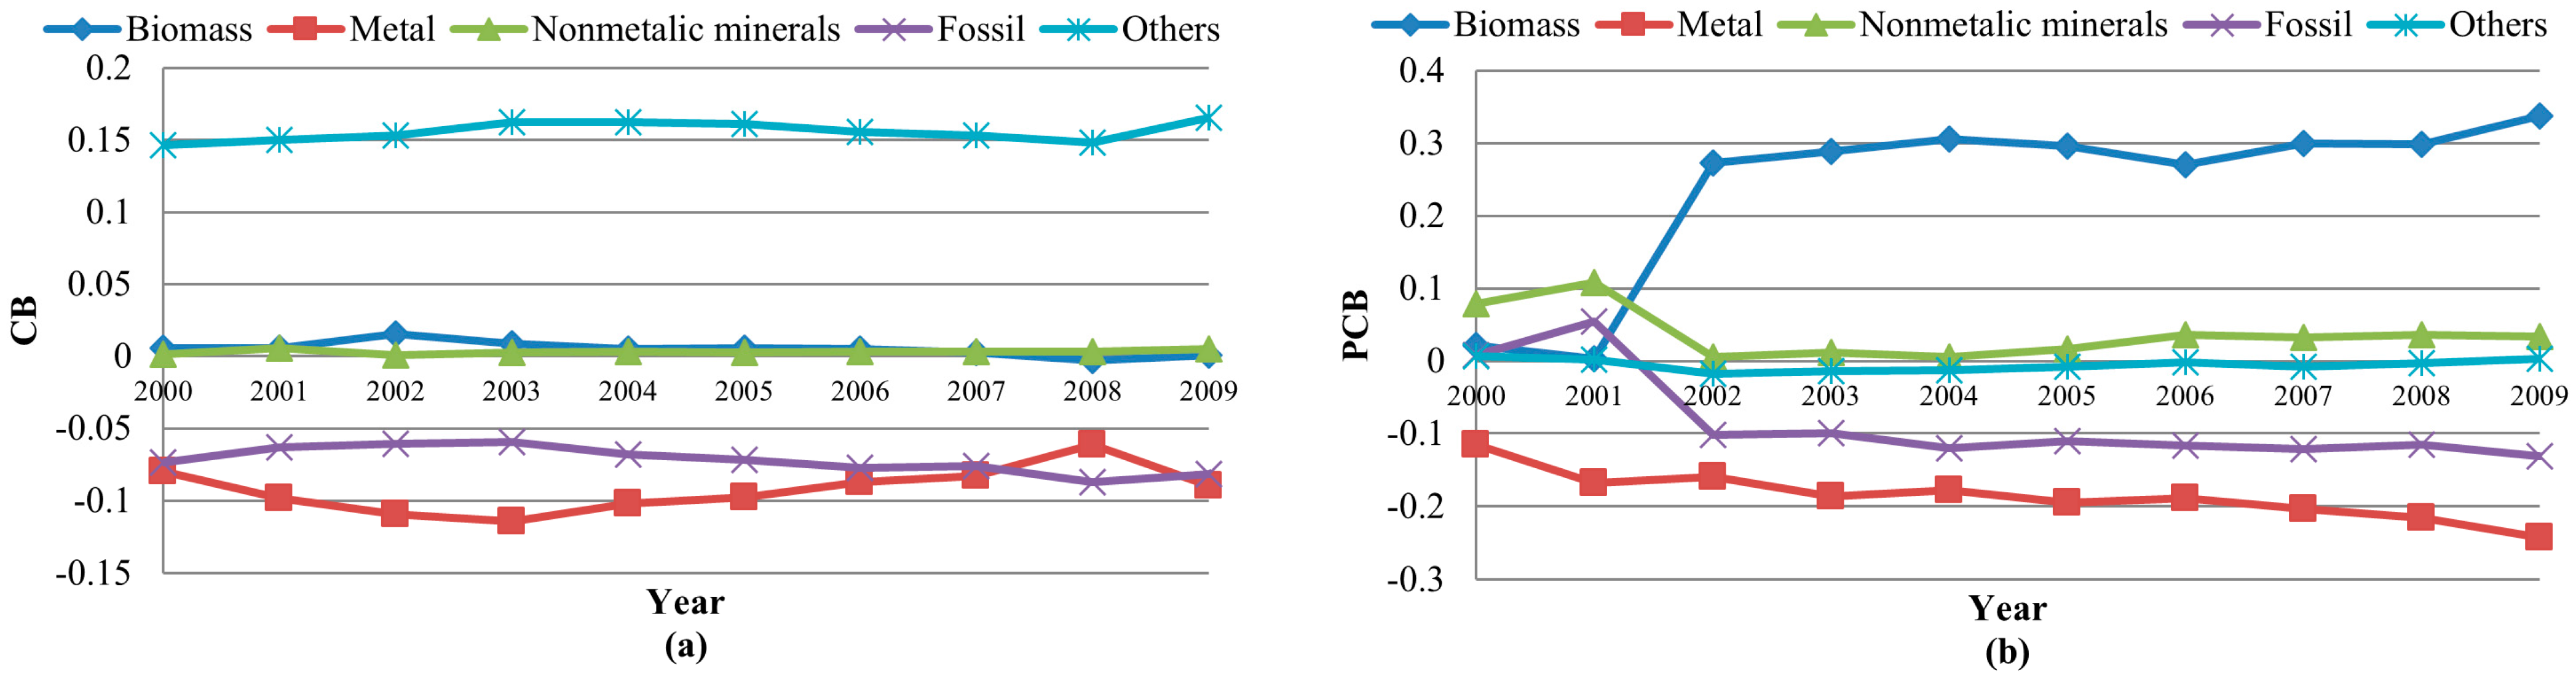
3.2. CB and PCB According to EW-MFA Material Categories

EW-MFA divides physical trade into five main categories [6]: biomass and biomass products (biomass), metal ores and concentrates, processed metals (metal), primary and processed nonmetallic minerals (nonmetallic minerals), petroleum resources (fossil), and other products (others). Other products refer to finished products that are difficult to categorize because they may include different categories of materials.
The details for allocating goods can be found in Table S2’s commodity allocation of material production sectors, the EW-MFA import categories in the supplementary file, and in Table 2. The metal category decreased gradually from −0.12 to −0.24, which indicates that the metal category brought an increasingly serious negative effect to total physical trade competitiveness. The fossil category also decreased from positive to negative in 2002 and continued declining since then. The nonmetallic mineral category has always been low (i.e., below 0.04 after 2002) because of its low value and small export volume, although the total mass increased. The PCB of other products was always below 0.02 because the mass was small and the difference between import and export was insignificant. These numbers contributed minimally to total physical trade. The PCB of biomass substantially increased from nearly 0 (2002) to 0.34 (2009). Consequently, we can conclude that only biomass contributes to the reduction in DMC in both imports and exports.
Table 2. Allocation of industrial and material classification in material production sectors.
IDMaterial Production SectorsIndustrial ClassificationMaterial Classification
01Agriculture, Forestry, Animal Husbandry & FisheryLabor-intensiveBiomass and biomass products
02Mining and Washing of CoalCapital-intensivePetroleum resources (fossil energy carriers)
03Extraction of Petroleum and Natural GasCapital-intensivePetroleum resources (fossil energy carriers)
04Mining of Metal OresCapital-intensiveMetal ores and concentrates, processed metals
05Mining and Processing of Nonmetal Ores and Other OresCapital-intensiveNonmetallic minerals primary and processed
06Manufacture of Foods and TobaccoLabor-intensiveBiomass and biomass products
07Manufacture of TextileLabor-intensiveOther
08Manufacture of Textile Wearing Apparel, Footwear, Caps, Leather, Fur, Feather (Down) and Its productsLabor-intensiveOther
09Processing of Timbers and Manufacture of FurnitureLabor-intensiveBiomass and biomass products
10Papermaking, Printing and Manufacture of Articles for Culture, Education and Sports ActivitiesLabor-intensiveOther
11Processing of Petroleum, Coking, Processing of Nuclear FuelCapital-intensivePetroleum resources (fossil energy carriers)
12Chemical IndustryCapital/Technology-intensiveOther
13Manufacture of Nonmetallic Mineral ProductsCapital-intensiveNonmetallic minerals primary and processed
14Smelting and Rolling of MetalsCapital-intensiveMetal ores and concentrates, processed metals
15Manufacture of Metal ProductsCapital-intensiveMetal ores and concentrates, processed metals
16Manufacture of General Purpose and Special Purpose MachineryCapital-intensiveMetal ores and concentrates, processed metals
17Manufacture of Transport EquipmentCapital/Technology-intensiveMetal ores and concentrates, processed metals
18Manufacture of Electrical Machinery and EquipmentCapital/Technology-intensiveMetal ores and concentrates, processed metals
19Manufacture of Communication Equipment, Computer and Other Electronic EquipmentCapital/Technology-intensiveOther
20Manufacture of Measuring Instrument and Machinery for Cultural Activity & Office WorkCapital/Technology-intensiveOther
21Manufacture of Artwork, Other ManufactureOtherOther
22Scrap and WasteOtherOther

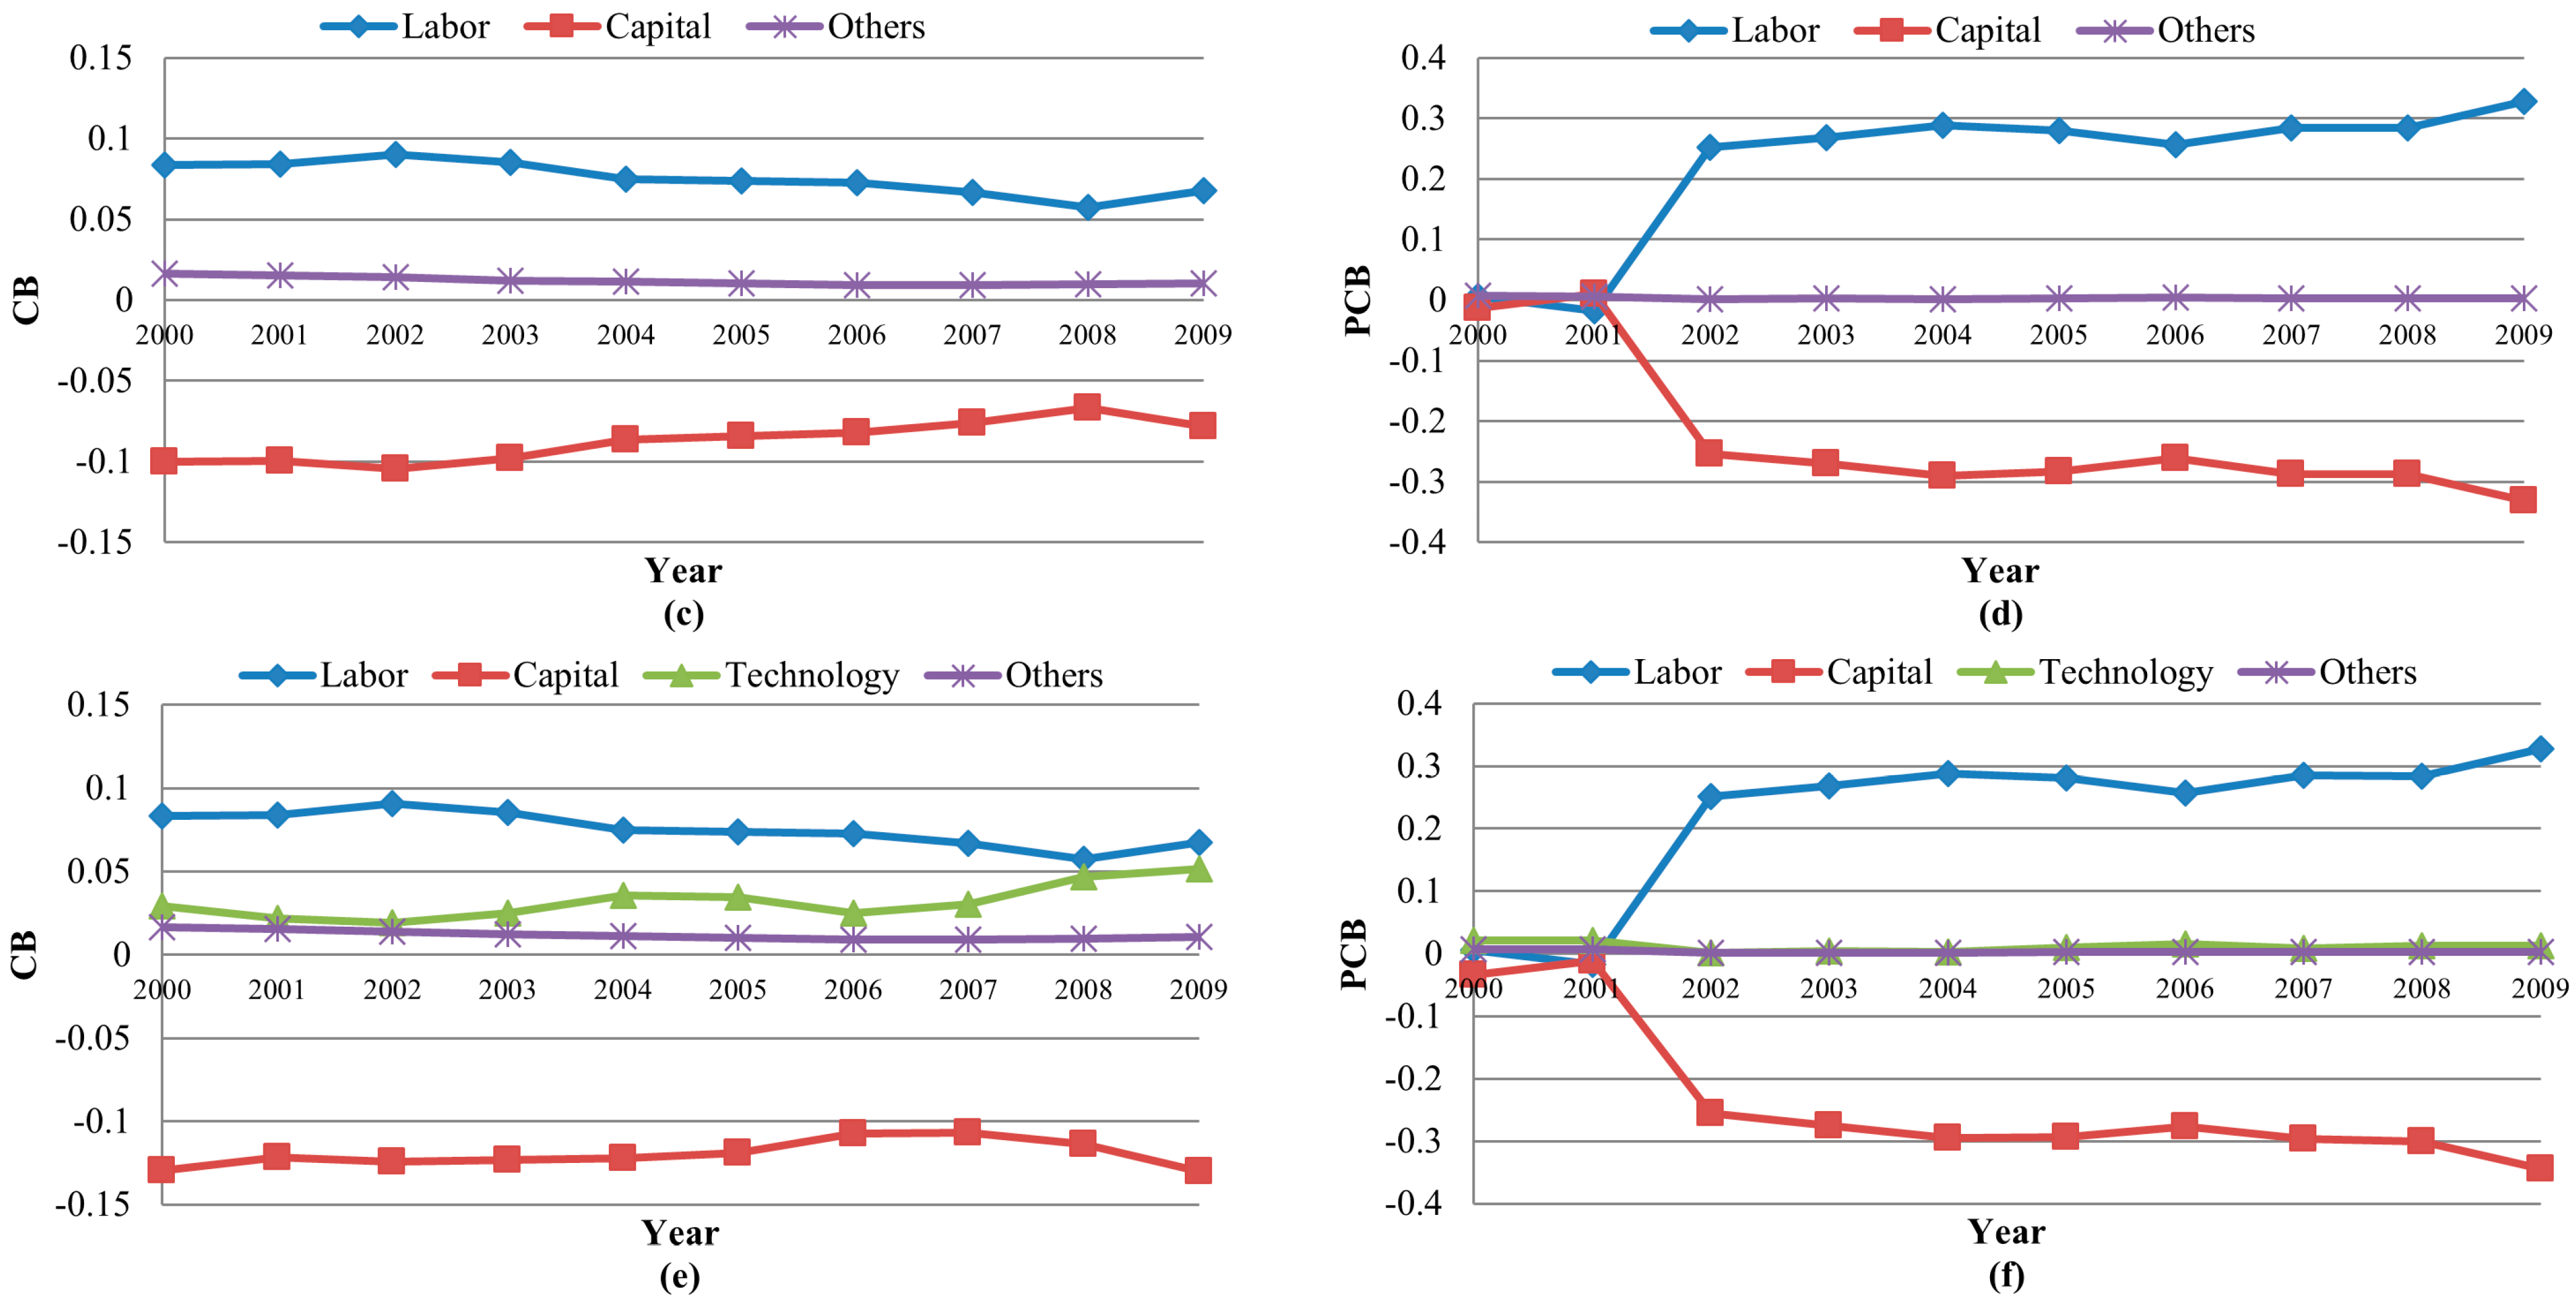
3.3. CB and PCB According to Conventional Industry Classification

According to the dominant factor of the production process, industries can be categorized into labor-intensive industry, capital-intensive industry, and others (Figure 2c,d). The technology-intensive industry was extracted from the capital-intensive industry based on three categories (Figure 2e,f) because of some overlaps between the capital-intensive industry and the technology-intensive industry. The allocation of industries is based on Table 2.
As shown in Figure 2c,d, the CB and PCB trends of the labor-intensive industry and the capital-intensive industry were poles apart, whereas that of other industries was basically flat. In the last decade, the CB of the labor-intensive industry was constantly decreasing, though it remained positive. The corresponding PCB slightly increased and remained positively high since 2002. The PCB of the capital-intensive industry kept declining, which demonstrated that capital-intensive products gradually occupied increasing net import from the perspective of mass. However, the corresponding CB was generally increasing, which suggests that the contribution of capital-intensive products to import (value) decreased.
After extracting the technology-intensive industry from the capital-intensive industry, as shown in Figure 2e,f, the overall trends of the labor-intensive industry, capital-intensive industry, and others are consistent with those shown in Figure 2c,d. The PCB of the technology-intensive industry remained as low as 0.003, whereas its CB increased from 0.03 to 0.05. This result is attributed to the increase in export value of technology-intensive products, which is high when mass is small.
Figure 2. Contribution to the trade balance (CB) and physical contribution to the trade balance (PCB) according to (a,b) biomass, metal, nonmetallic minerals, petroleum resources, and other products; (c,d) according to labor-intensive industry, capital-intensive industry, and others; (e,f) according to labor-intensive industry, capital-intensive industry, technology-intensive industry, and others.
Sustainability 07 12372 g002aSustainability 07 12372 g002b

4. Discussion

From the perspective of trade value, the industry structure of China, which is represented by the intensiveness of factors, experienced no substantial change during the first decade of the new century. The labor-intensive industry achieves a comparative advantage. The technology-intensive industry follows, with a weaker comparative advantage. Meanwhile, the capital-intensive industry obtains a comparative disadvantage. This structure is attributed to the current factor endowment of China. The labor force of the country is large, with a huge number of lowly skilled workers. Meanwhile, capital is scarce as a result of the effects of an incomplete opening of capital accounts and the imperfections of the financial market. The comparative advantage of the technology-intensive industry was weak before 2008 because China was still in the early stage of industrialization and the international competitiveness of the high-tech industry was still limited.
The CB of the labor-intensive industry of China continued declining from 2000 to 2008, whereas that of the technology-intensive and capital-intensive industries continued increasing. These trends indicate the direction of the industrial structure adjustment during the modernization of China; however, a substantial change in the industrial structure is still far from realization. The trends have been reversed since 2008, when the CB of the technology-intensive industry significantly decreased, whereas those of the labor-intensive and capital-intensive industries increased. These events have resulted from the effect of the global economic crisis on the export structure of China. The trend changed because the update rate of electronic products has slowed down, while lower-cost and rapidly consumed products are demanded in overseas markets. Although this effect is regarded as temporary, further observation is required.
The gap between the PCBs of the labor-intensive industry and the technology-intensive industry is obvious. The properties of products cause this gap, so that technology-intensive products obtain large values. In 2002, the PCBs of the labor-intensive and capital-intensive industries transitioned because of the accession of China to WTO. This event resulted in a tremendous difference in the comparative advantage of the labor-intensive industry in terms of physical quantity; however, the difference was not obvious in terms of value. This situation suggests that the unit weight value of exported labor-intensive products decreased. That is, cheaper products from the labor-intensive industry have been exported since the accession of China to WTO. The analysis of the detailed categorized industry shows that the PCBs of exported products from the food manufacturing and tobacco processing industries have significantly increased since 2002. The removal of the tariff barrier allowed China to export more labor-intensive products with low added values.
To portray the resource consumption panorama of an economic system’s intra-industry trade, direct resource exchange data and indicators are the primary basis. Indirect flows and indicators, like raw material equivalent and conceptual indirect PCB, are able to represent environmental burdens. The latter calculation is based on the former and a set of “cradle-to-product” coefficients [2]. This study is the first step for improving data and index about direct physical intra-industry trade. Future research would be focused on the physical intra-industry trade integration of the System of National Accounts (SNA), life cycle assessment (LCA), and environmentally-extended input-output (EIO) models [30].

5. Conclusions

This study adopted TB, PTB, CB, and PCB to examine physical trade in China from 2000 to 2009. The increasing trends of imports, both in value and physical quantity, were basically stable, except for the physical quantity of coals and metal ores, which increased significantly in 2009 as the total import value decreased (the price factor was attributed to the global economic crisis). However, exports exhibited considerable fluctuations. The total physical export in 2002 was approximately three times higher than that of the previous year. The PCBs of biomass (EW-MFA) and the labor-intensive industry have notably increased since 2002, whereas CB increased gradually (commodity composition changed because of the accession of China to WTO).
Applying multiple tools to analyze international trade may explain how changes in international circumstances or domestic policies lead to different influences on the value and physical quantity of trade. The method of combining PCB and CB, which measures the trade specialization and relative scale of various products, can reveal the internal connection between the values and physical quantities of both imports and exports. Further studies should focus on flows embodied in physical trade based on PCB to synthetically analyze underlying environmental pressures on imports and exports.

Supplementary Files

Supplementary File 1

Acknowledgments

This research was supported by the National Key Technology R&D Program of China (No. 2012BAC03B01).

Author Contributions

Nan Li and Tianzhu Zhang conceived and designed the method; Jianchuan Qi and Yuanyi Huang collected the raw data; Nan Li conducted the analysis and wrote the paper.

Conflicts of Interest

The authors declare no conflict of interest.

References

  1. Bleischwitz, R.; Welfens, P.J.J.; Zhang, Z.X. Sustainable Growth and Resource Productivity: Economic and Global Policy Issues; Greenleaf: Sheffield, UK, 2009. [Google Scholar]
  2. Wiedmann, T.O.; Schandl, H.; Lenzen, M.; Moran, D.; Suh, S.; West, J.; Kanemoto, K. The material footprint of nations. Proc. Natl. Acad. Sci. USA 2015, 112, 6271–6276. [Google Scholar] [CrossRef] [PubMed]
  3. York, R.; Rosa, E.A.; Dietz, T. Footprints on the earth: The environmental consequences of modernity. Am. Soc. Rev. 2003, 68, 279–300. [Google Scholar] [CrossRef]
  4. Jorgenson, A.K.; Burns, T.J. The political-economic causes of change in the ecological footprints of nations, 1991–2001: A quantitative investigation. Soc. Sci. Res. 2007, 36, 834–853. [Google Scholar] [CrossRef]
  5. Bleischwitz, R.; Welfens, P.J.J.; Zhang, Z.X. International Economics of Resource Efficiency: Eco-Innovation Policies for a Green Economy; Physica-Verlag: Heidelberg, Germany, 2011. [Google Scholar]
  6. Eurostat. Economy Wide Material Flow Accounts: Compilation Guide 2013; Eurostat: Luxembourg, 2013. [Google Scholar]
  7. Hass, J.; Popescu, C. Economy-Wide Material Flows: European Countries Required More Materials between 2000 and 2007; Eurostat: Luxembourg, 2011. [Google Scholar]
  8. Schandl, H.; West, J. Material flows and material productivity in China, Australia, and Japan. J. Ind. Ecol. 2012, 16, 352–364. [Google Scholar] [CrossRef]
  9. Giljum, S.; Dittrich, M.; Bringezu, S.; Polzin, C.; Lutter, S. Resource Use and Resource Productivity in Asia; Sustainable Europe Research Institute (SERI): Vienna, Austria, 2010. [Google Scholar]
  10. Krausmann, F.; Gingrich, S.; Eisenmenger, N.; Erb, K.-H.; Haberl, H.; Fischer-Kowalski, M. Growth in global materials use, gdp and population during the 20th century. Ecol. Econ. 2009, 68, 2696–2705. [Google Scholar] [CrossRef]
  11. Dittrich, M.; Bringezu, S. The physical dimension of international trade: Part 1: Direct global flows between 1962 and 2005. Ecol. Econ. 2010, 69, 1838–1847. [Google Scholar] [CrossRef]
  12. Wiebe, K.S.; Bruckner, M.; Giljum, S.; Lutz, C.; Polzin, C. Carbon and materials embodied in the international trade of emerging economies. J. Ind. Ecol. 2012, 16, 636–646. [Google Scholar] [CrossRef]
  13. Guan, D.; Hubacek, K. Assessment of regional trade and virtual water flows in China. Ecol. Econ. 2007, 61, 159–170. [Google Scholar] [CrossRef]
  14. Moran, D.D.; Wackernagel, M.C.; Kitzes, J.A.; Heumann, B.W.; Phan, D.; Goldfinger, S.H. Trading spaces: Calculating embodied ecological footprints in international trade using a product land use matrix (PLUM). Ecol. Econ. 2009, 68, 1938–1951. [Google Scholar] [CrossRef]
  15. Dittrich, M.; Bringezu, S.; Schütz, H. The physical dimension of international trade, part 2: Indirect global resource flows between 1962 and 2005. Ecol. Econ. 2012, 79, 32–43. [Google Scholar] [CrossRef]
  16. Krugman, P. Increasing returns and economic geography. J. Political Econ. 1991, 99, 483–499. [Google Scholar] [CrossRef]
  17. Vennemo, H.; Aunan, K.; He, J.; Hu, T.; Li, S.; Rypdal, K. Environmental impacts of China’s wto-accession. Ecol. Econ. 2008, 64, 893–911. [Google Scholar] [CrossRef]
  18. Lemoine, F. Past successes and new challenges: China’s foreign trade at a turning point. China World Econ. 2010, 18, 1–23. [Google Scholar] [CrossRef]
  19. Fischer-Kowalski, M.; Krausmann, F.; Giljum, S.; Lutter, S.; Mayer, A.; Bringezu, S.; Moriguchi, Y.; Schütz, H.; Schandl, H.; Weisz, H. Methodology and indicators of economy-wide material flow accounting. J. Ind. Ecol. 2011, 15, 855–876. [Google Scholar] [CrossRef]
  20. Robinson, E.A.G. Economic Consequences of the Size of Nations: Proceedings of a Conference Held by the International Economics Association; Macmillan: London, UK, 1960. [Google Scholar]
  21. Balassa, B.A. Economic Development and Integration; Centro de Estudios Monetarios Latinoamericanos: Mexico City, Mexico, 1965. [Google Scholar]
  22. Grubel, H.G. Intra-industry specialization and the pattern of trade. Can. J. Econ. Political Sci. 1967, 33, 374–388. [Google Scholar] [CrossRef]
  23. Lafay, G. The Measurement of Revealed Comparative Advantages; Chapman & Hill: London, UK, 1992. [Google Scholar]
  24. Krugman, P.R.; Obstfeld, M.; Melitz, M. International Economics—Theory and Policy; Prentice Hall: Boston, MA, USA, 2011. [Google Scholar]
  25. United Nations Statistics Division (UNSD). United Nations Commodity Trade Statistics Database. Available online: http://comtrade.un.org/db/ (accessed on 8 July 2015).
  26. National Bureau of Statistics of China (NBSC). 2007 Input-Output Tables of China; China Statistics Press: Beijing, China, 2007.
  27. National Bureau of Statistics of China (NBSC). China Statistical Yearbook 2011; China Statistics Press: Beijing, China, 2011.
  28. China Customs (CC). China Customs Statistics Yearbook 2000–2009; China Customs Press: Beijing, China, 2000–2009. [Google Scholar]
  29. China Association of Ports-of-Entry (CAOP). China’s Ports-of-Entry Yearbook 2001–2010; China Customs Press: Beijing, China, 2001–2010. [Google Scholar]
  30. Liang, S.; Jia, X.-P.; Zhang, T.-Z. Three-dimensional hybrid enterprise input-output model for material metabolism analysis: A case study of coal mines in China. Clean Technol. Environ. Policy 2011, 13, 71–85. [Google Scholar] [CrossRef]

