4.2. Energy Analysis
In the evaluation of energy capability of a system are two key aspects: the characteristics of wind at the sites under consideration and the features of the turbine to be installed [
13]. In order to calculate the power from a wind turbine over a range of wind speeds a generalized expression is needed for the probability density distribution. An expression which gives a good fit to wind data is known as the Weibull distribution [
14]:
where
v is the wind speed (m/s),
c is the scale factor (m/s), and k is the shape factor (dimensionless).
The scale parameter is related in a univocal way to the average speed, is directly proportional to it, and from which does not differ much in numerical terms. The shape factor is a dimensionless term that characterizes the amplitude of the wind speed dispersion around the mean. This parameter, such as that of scale, is typical of a site under investigation and should be obtained by a measurement campaign. When this is not possible, one should take a guide value based on the climatic conditions of the area under study or similarity to other sites in the same climatic area. The shape factor is, therefore, an irregularity index of the wind regime.
Mountain areas and urban areas characterized by very irregular winds have values of k between 1 and 1.5, ocean areas with very regular winds have a value between 2.5 and 4, and the coastal areas in temperate areas have a value of k around 2.
The Weibull distribution expressed by Equation (1) falls into default when the wind speed is null. In order to take this into account the calm wind frequency (“
s” in percentage) must be considered. The parameters used in this study are summarized in
Table 3.
Table 3.
Parameters for Enna e Gela.
Table 3.
Parameters for Enna e Gela.
| Stations | c (m/s) | k | s % |
|---|
| Enna | 6.23 | 1.83 | 11.39 |
| Gela | 4.65 | 1.46 | 7.22 |
Due to the fact that each turbine can be installed on towers at different lengths, it is necessary to calculate the trend of the wind speed
v according to quota
h (vertical velocity profile). This trend is usually expressed by the following relationship:
where
v is the wind speed at the height to be extrapolated,
v0 is the wind speed recorded by meteorological station from the ground level
h0 (10 m), and the power law exponent α is the wind shear exponent. This parameter is generally between 0.1 and 0.4 and depends on the surface roughness, atmospheric stability, and height range
Figure 4 and
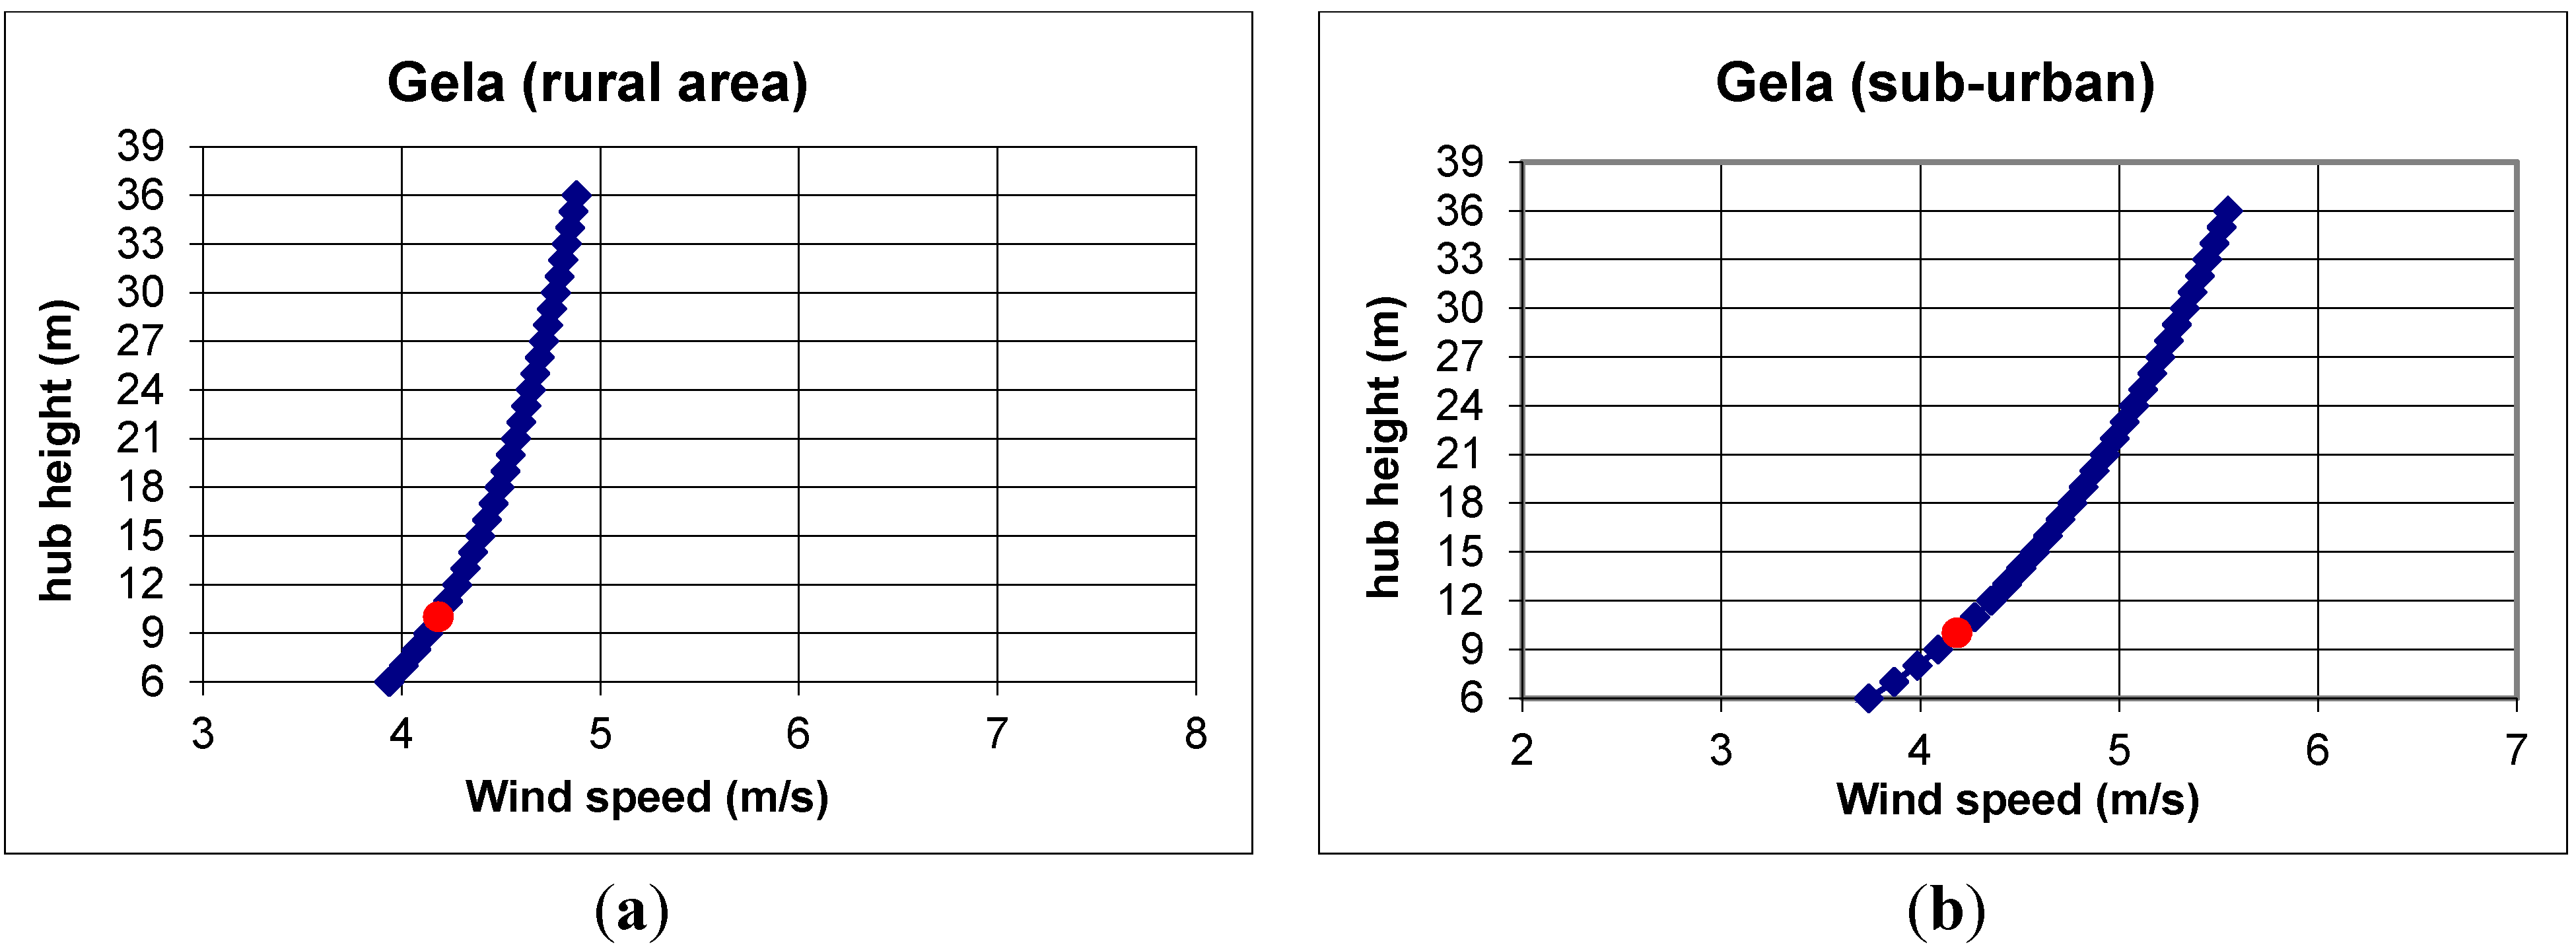
Figure 5 show the speed profiles for the two locations under investigation regarding both types of soil analyzed. In red is the speed measured in the region of 10 m above ground level.
Figure 4.
(a) Wind velocity profile for Enna rural area; (b) Wind velocity profile for Enna sub urban area.
Figure 4.
(a) Wind velocity profile for Enna rural area; (b) Wind velocity profile for Enna sub urban area.
Figure 5.
(a) Wind velocity profile for Gela rural area; (b) Wind velocity profile for Gela sub urban area.
Figure 5.
(a) Wind velocity profile for Gela rural area; (b) Wind velocity profile for Gela sub urban area.
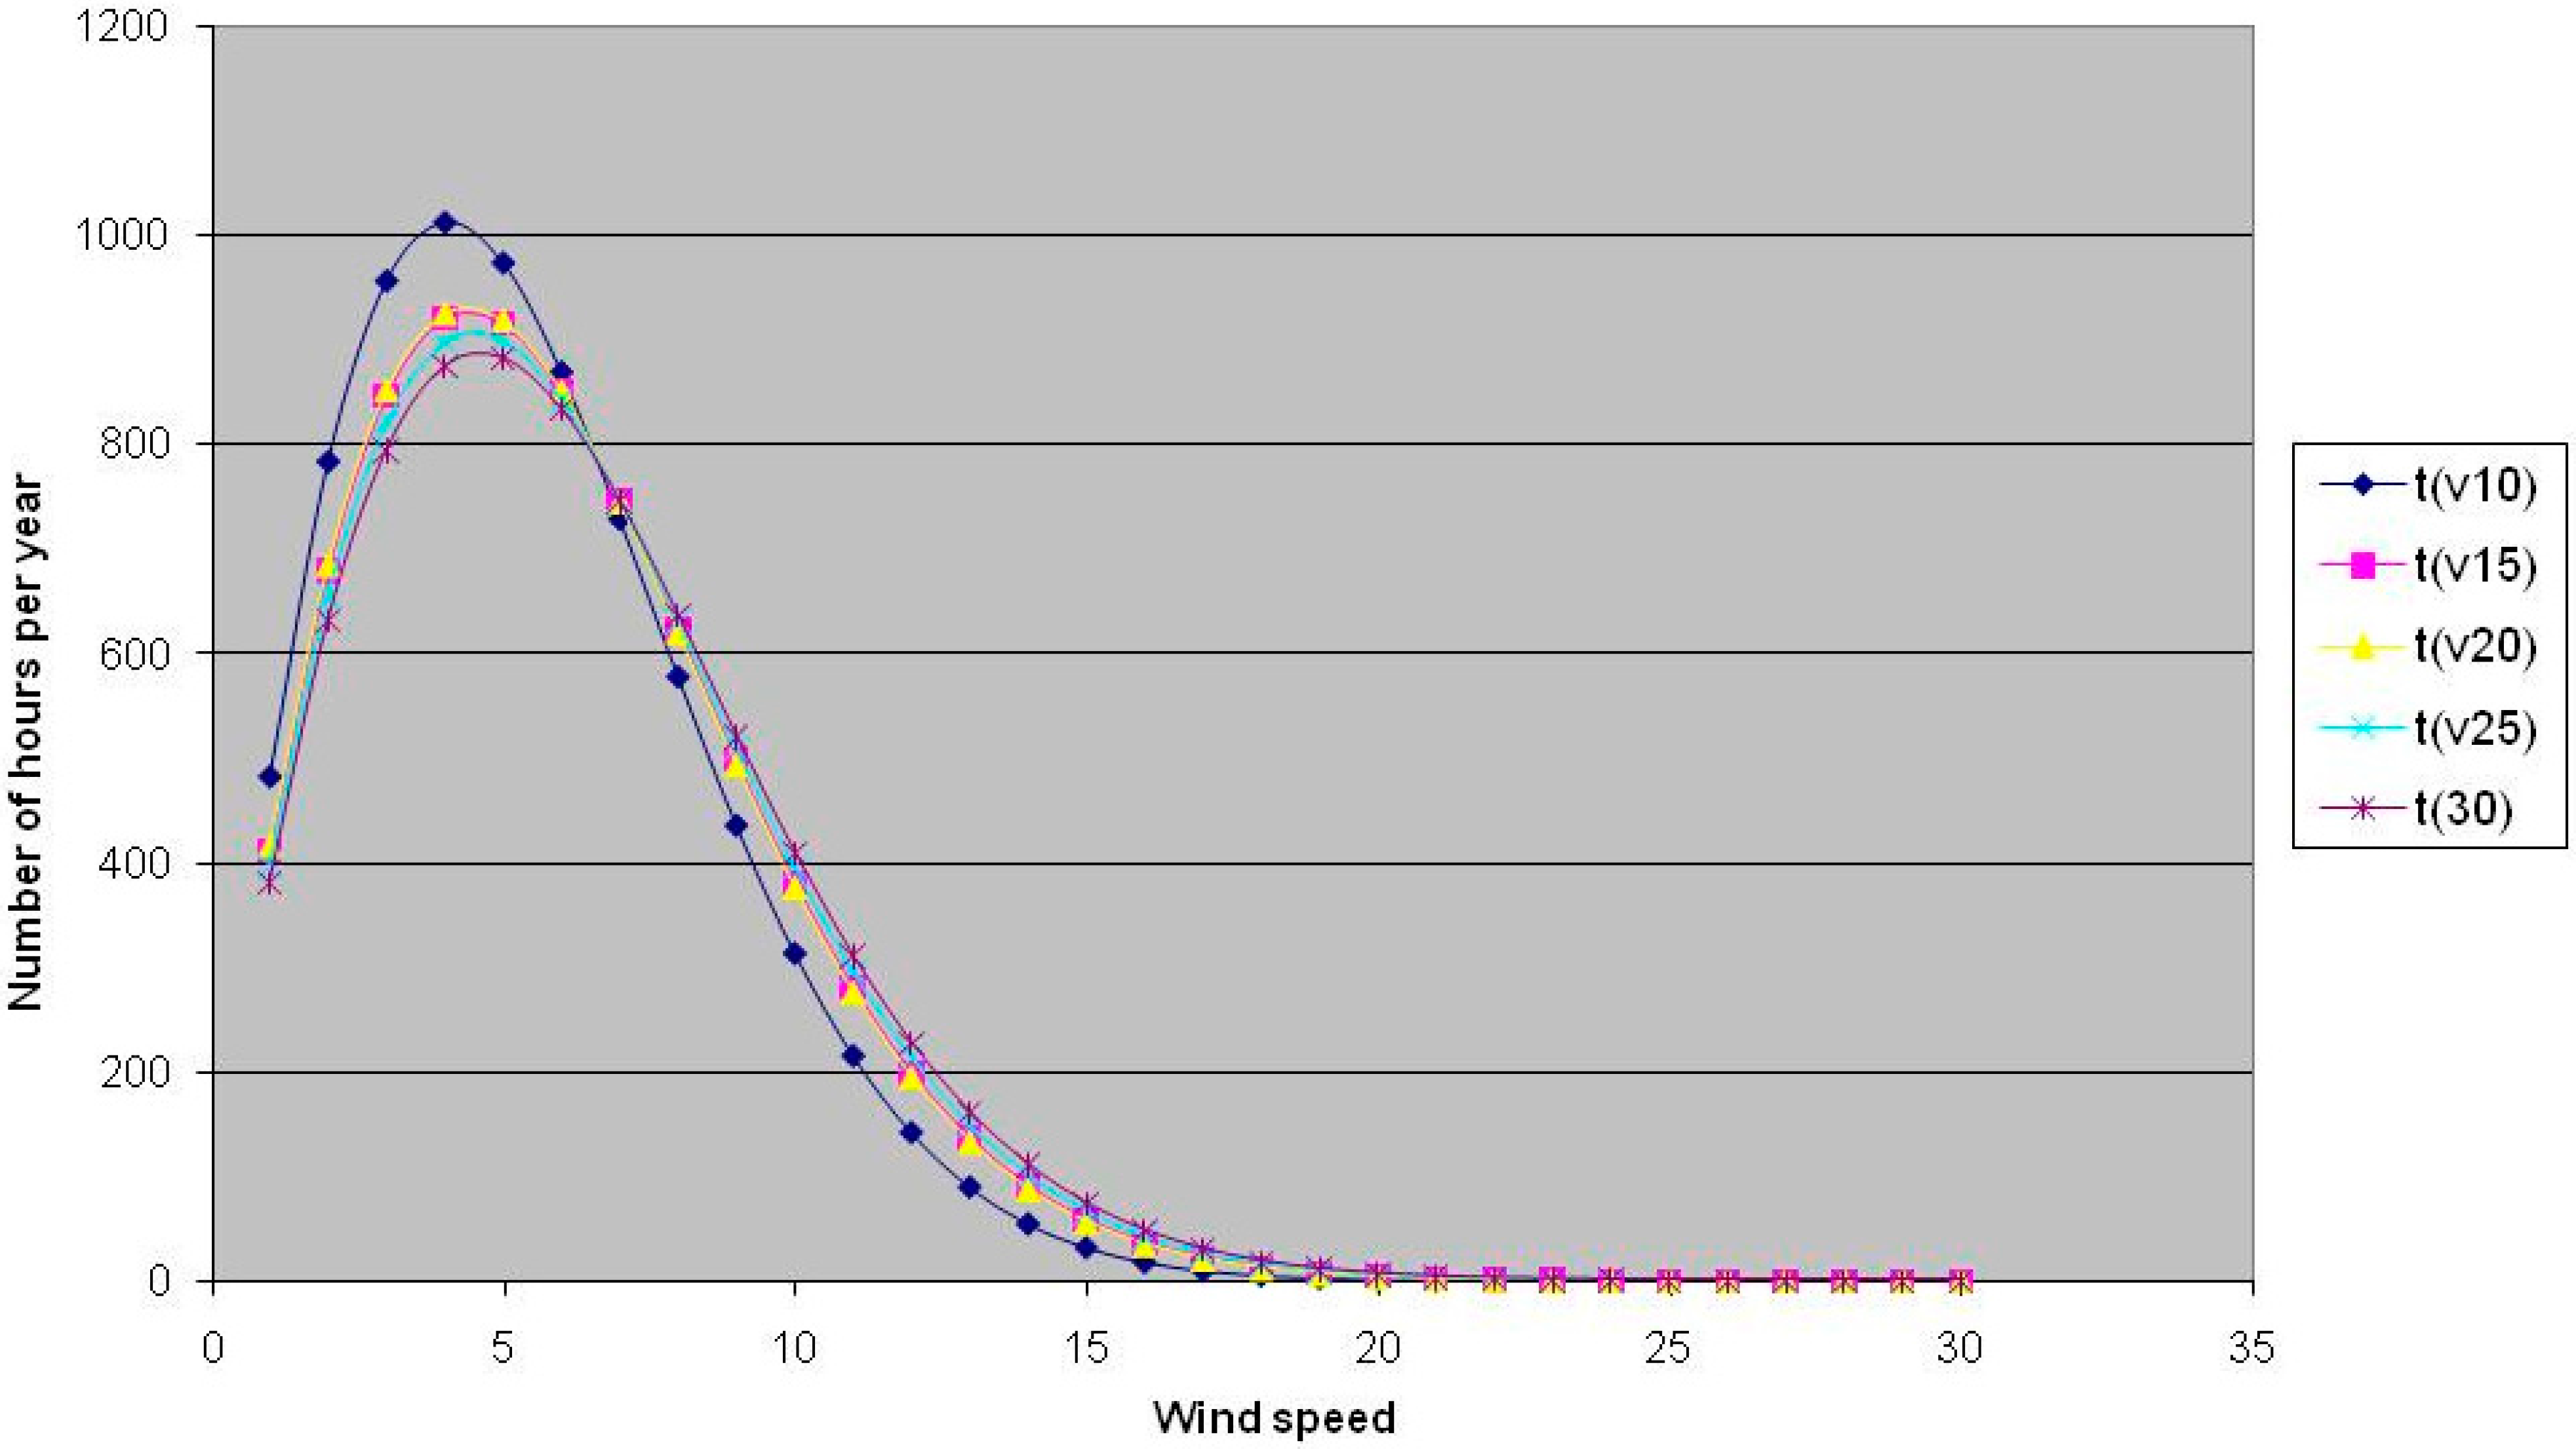
From knowledge of the parameters of the Weibull distribution and of the profile of wind speed at different heights for the two types of terrain the curves
t(
vi), where the index
i is relative to the height for which the curve was plotted (
Figure 6,
Figure 7,
Figure 8 and
Figure 9). The heights considered (10, 15, 20, 25, and 30 m) are those set out by producers, themselves,
s to the towers of the respective turbines.
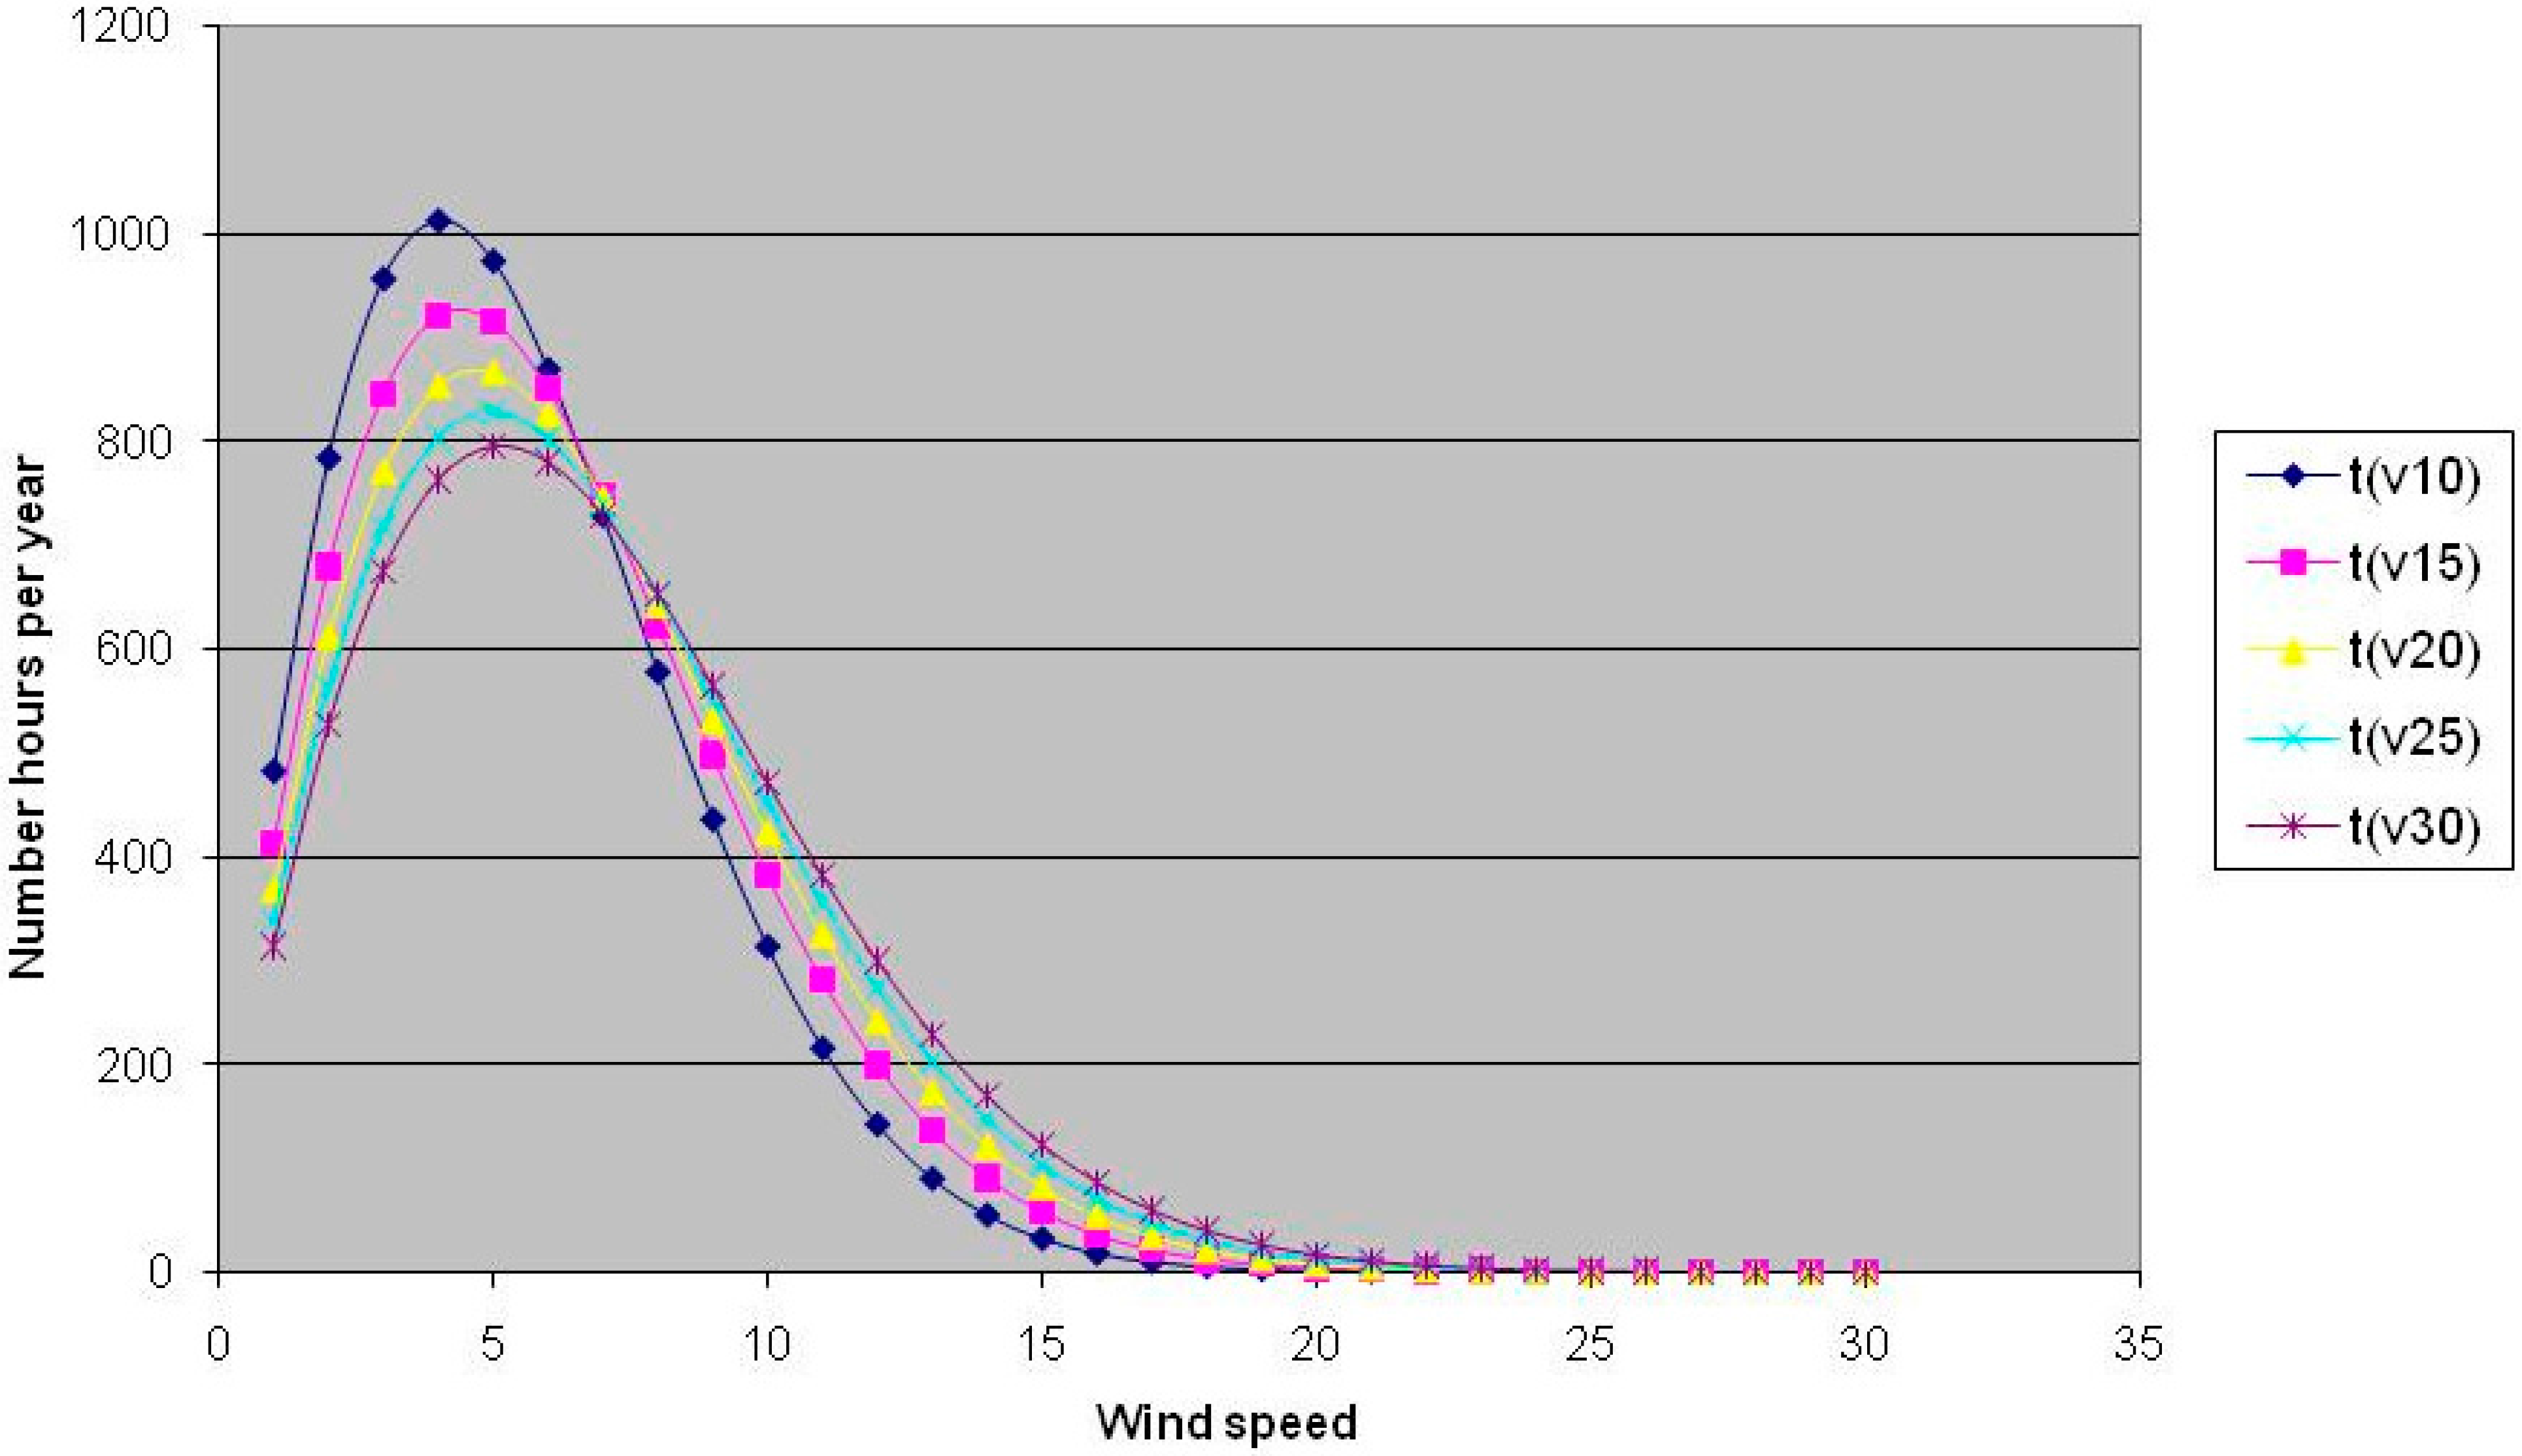
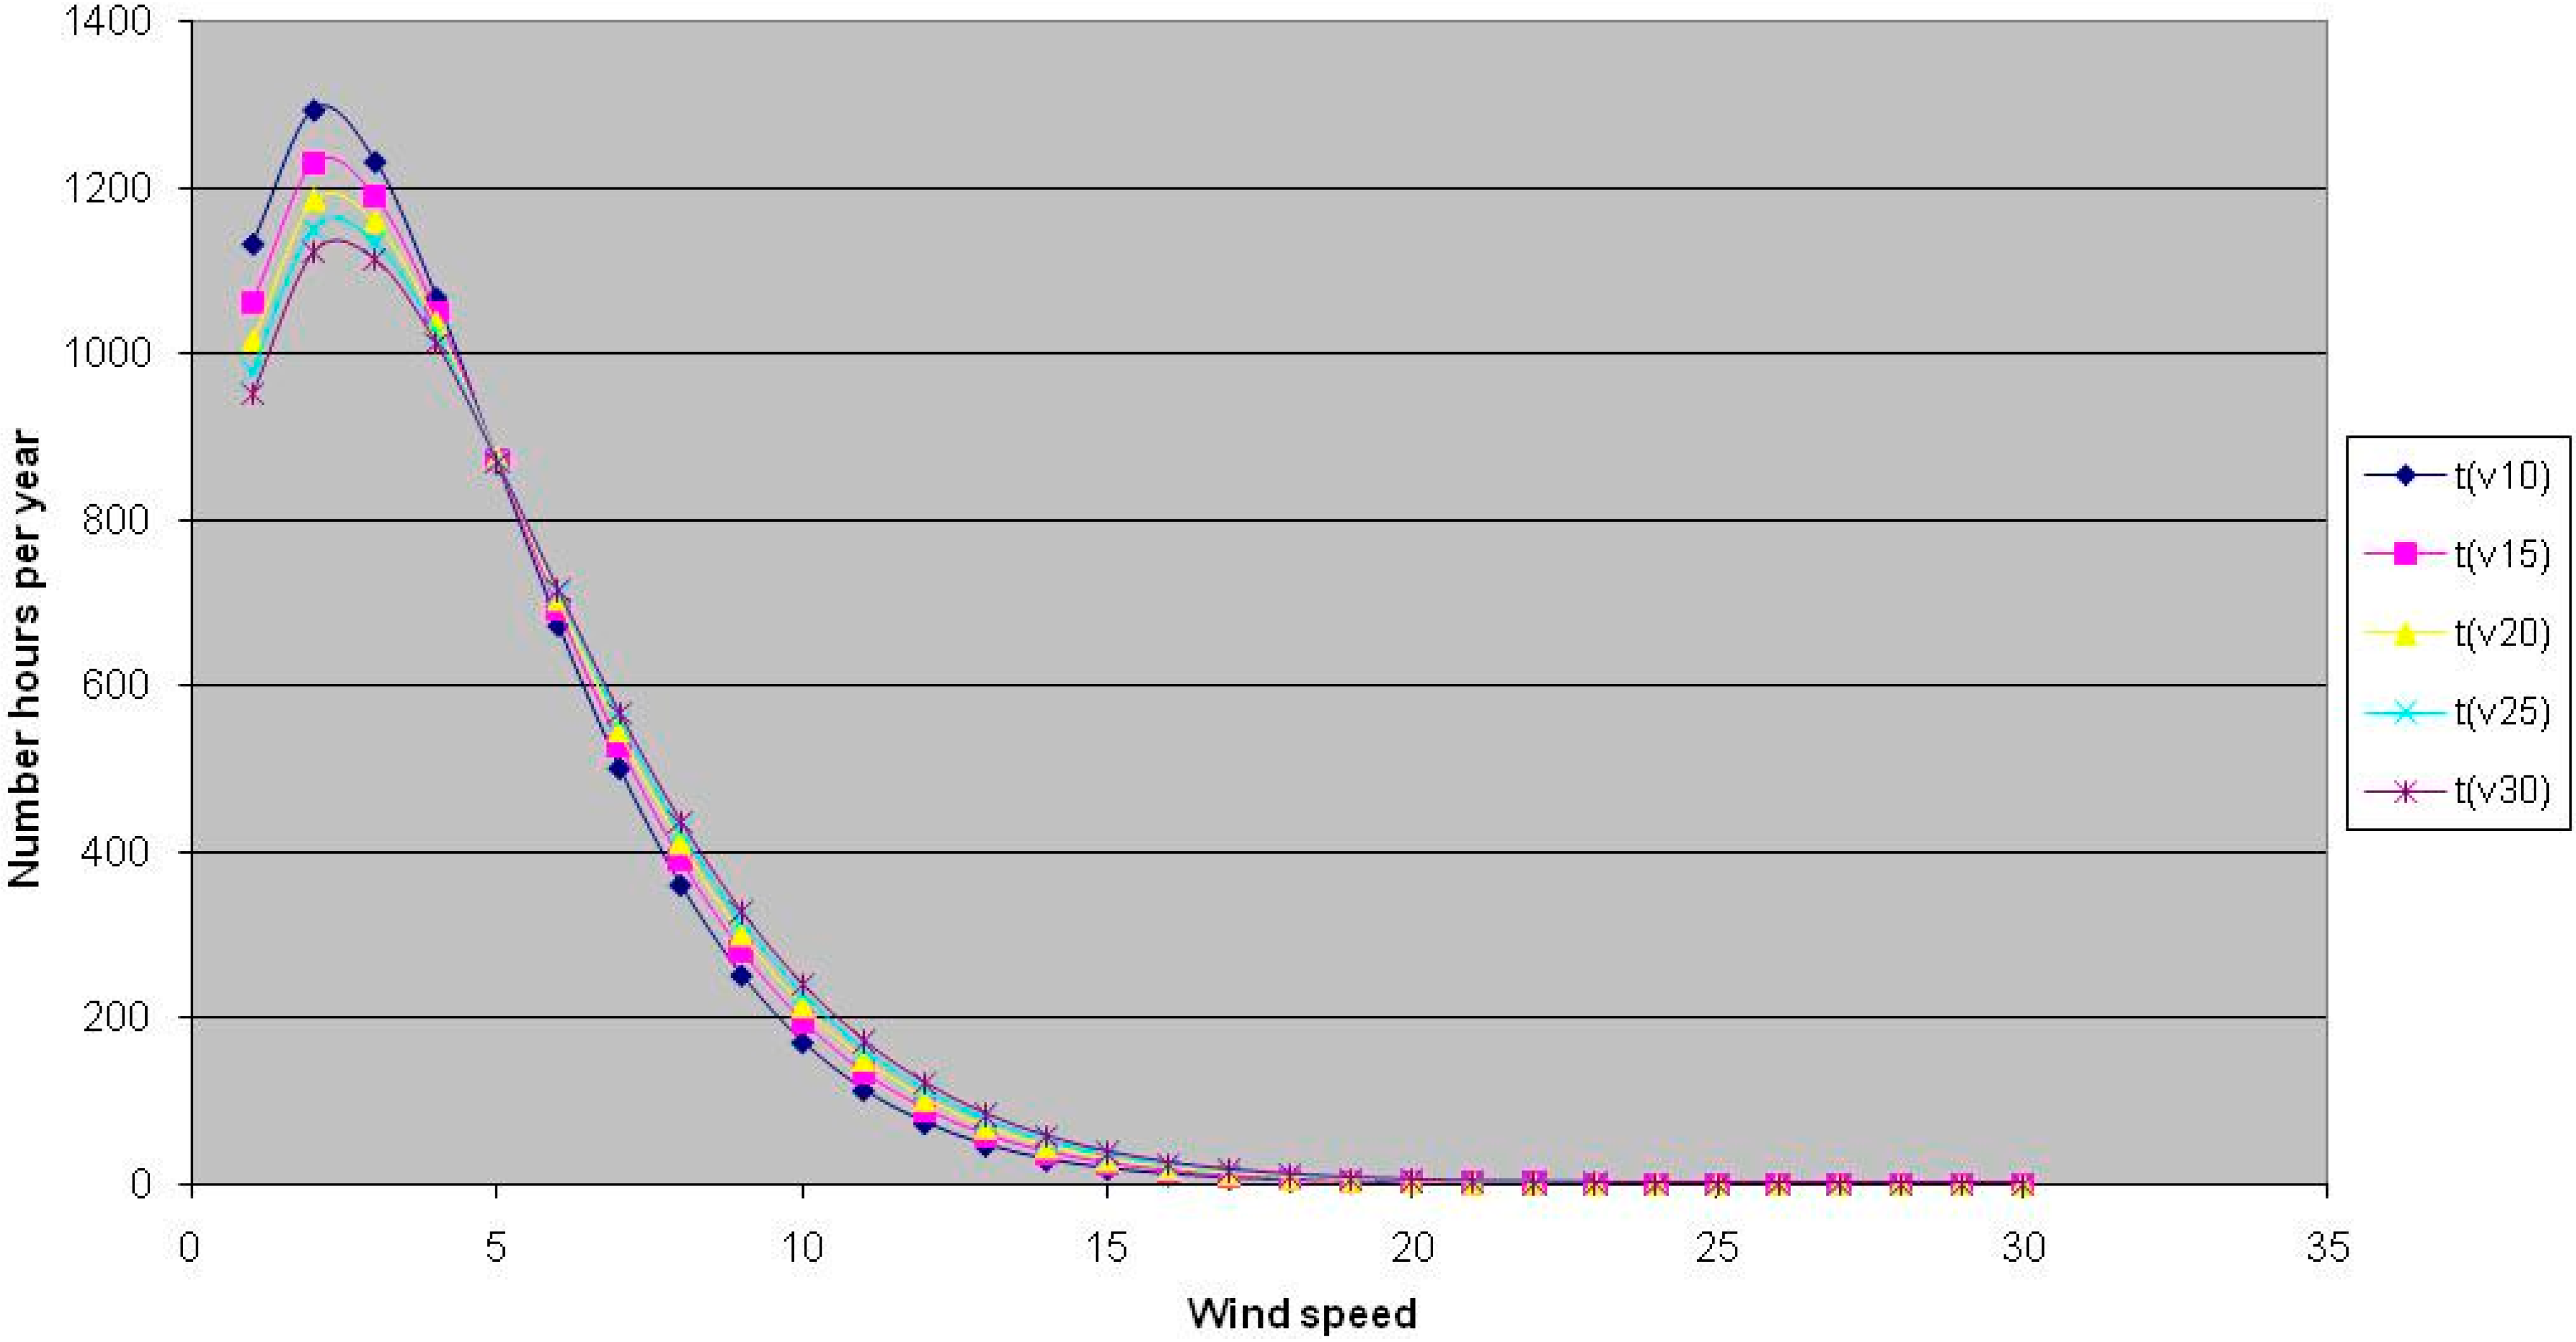
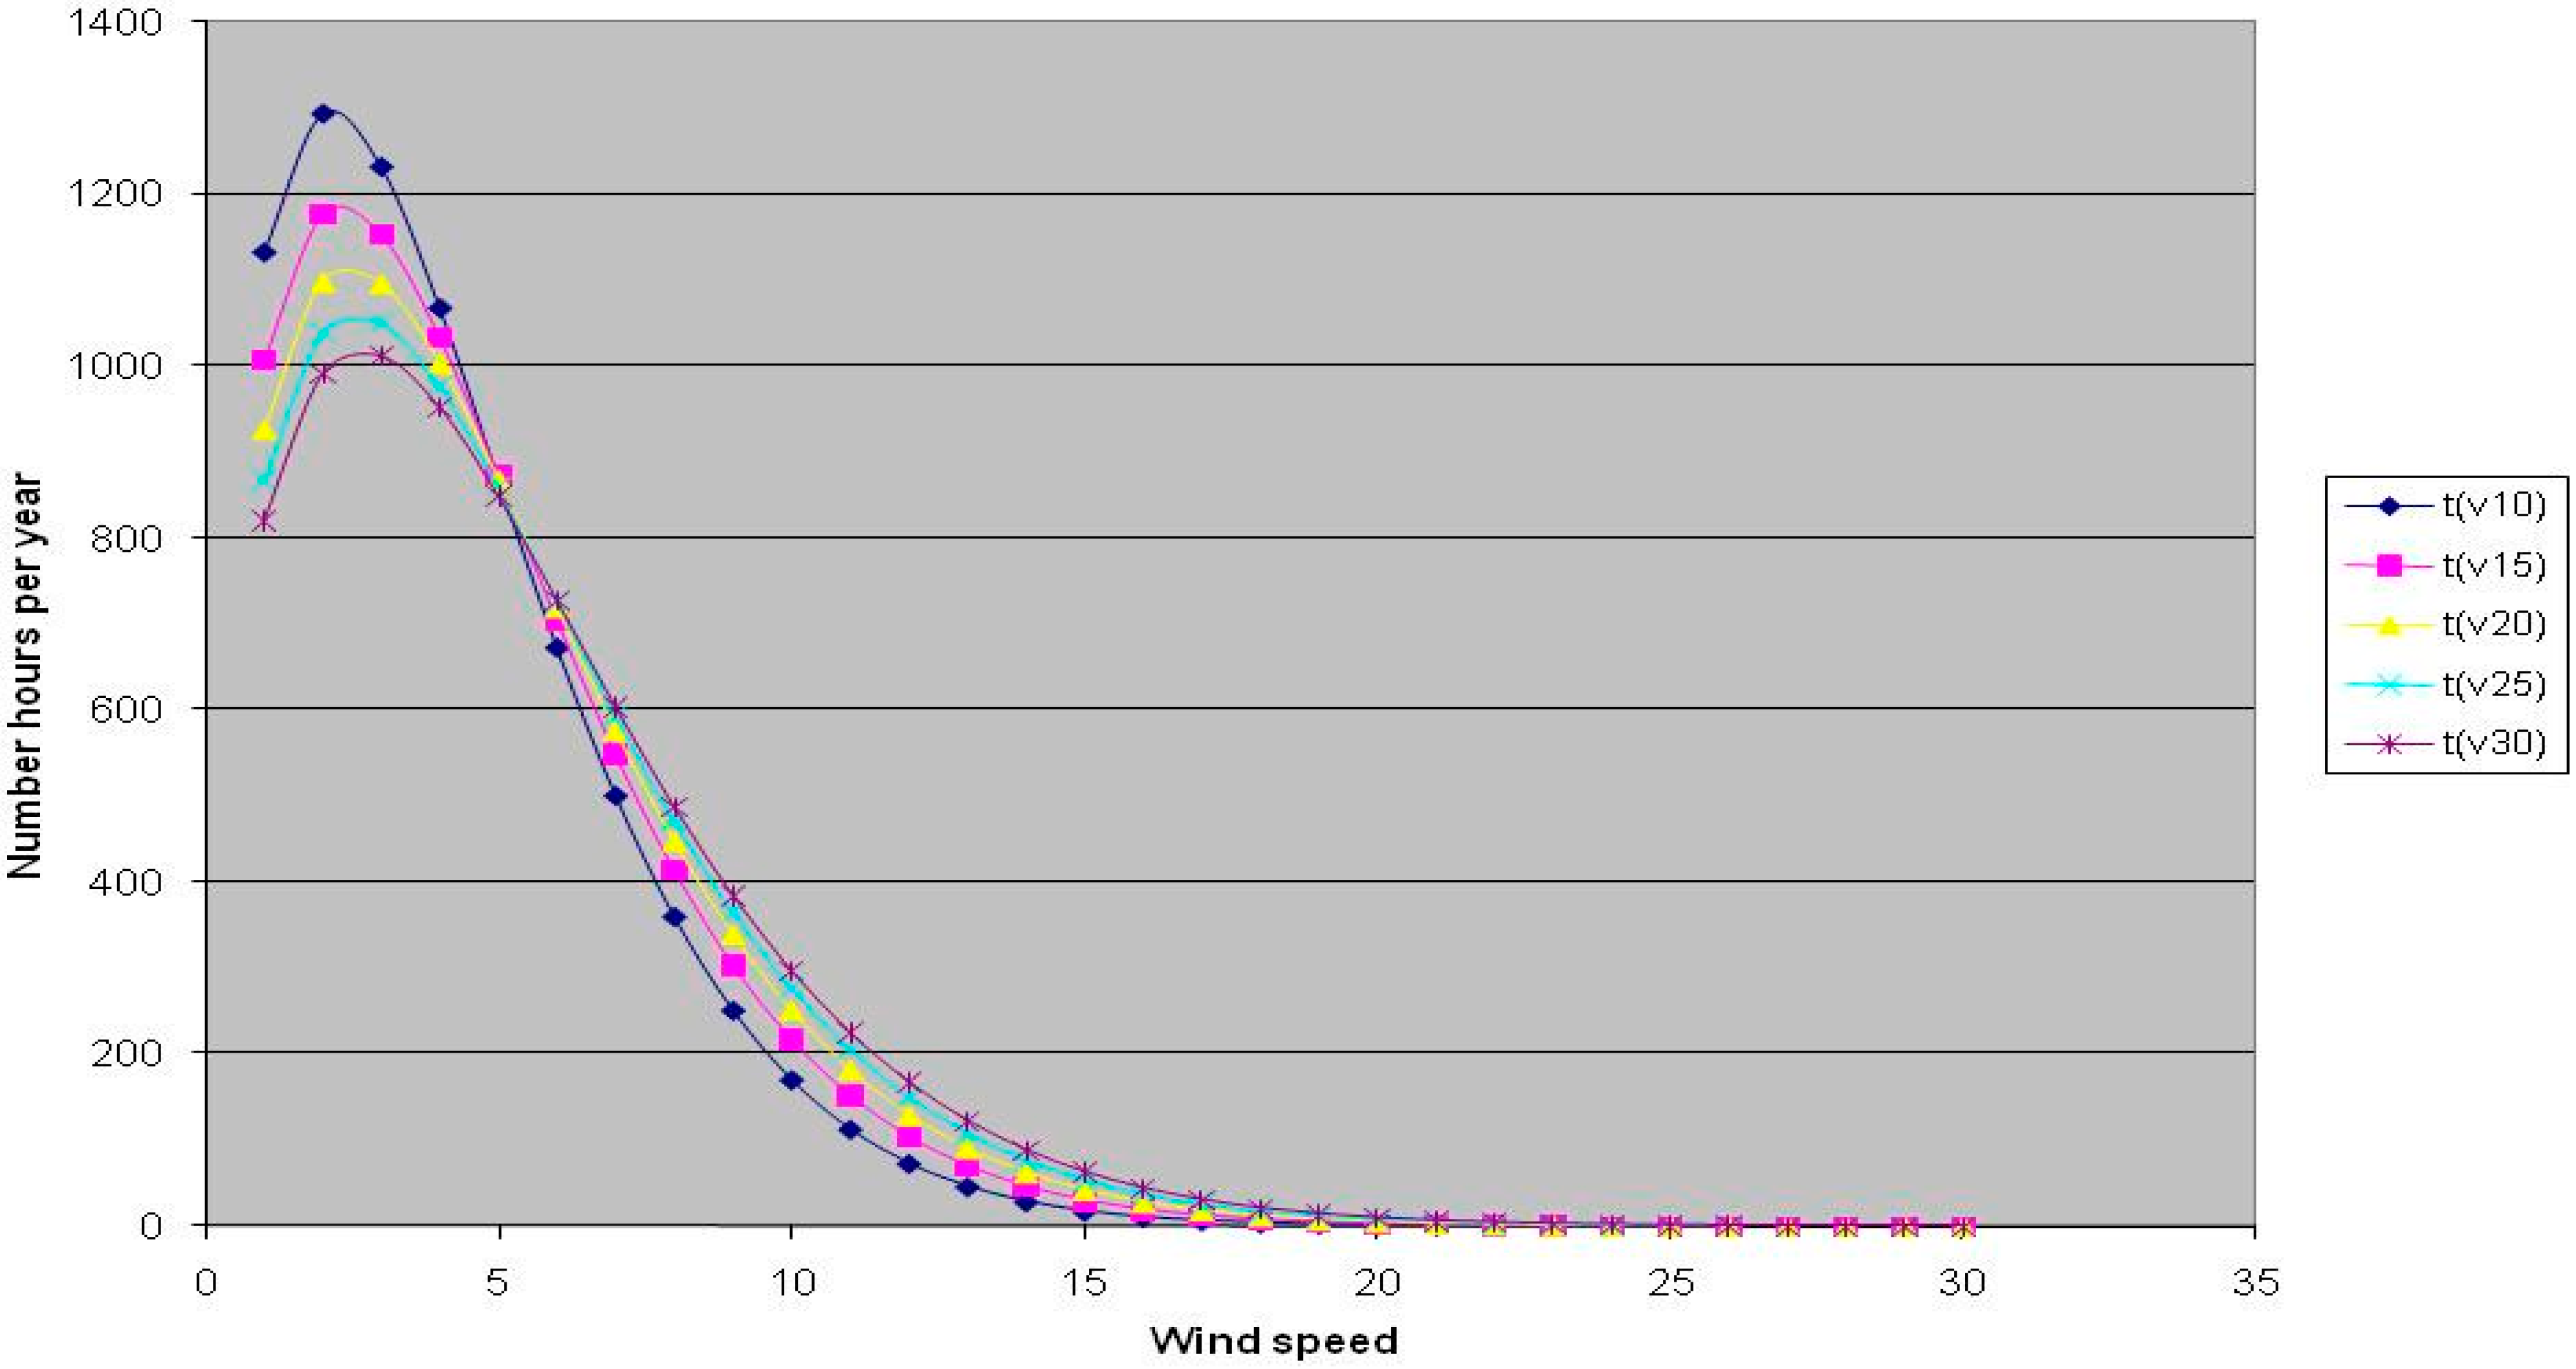
Figure 6 and
Figure 7 (relating the station of Enna) show a flattening with respect to the curves in
Figure 8 and
Figure 9 (relating the station of Gela). This flattening is more important, the higher the shape parameter
k. This is due to an increase in average wind speed according to the quota [
15].
Figure 6.
Wind speed distribution for different heights (Enna rural area).
Figure 6.
Wind speed distribution for different heights (Enna rural area).
Figure 7.
Wind speed distribution for different heights (Enna sub urban area).
Figure 7.
Wind speed distribution for different heights (Enna sub urban area).
Figure 8.
Wind speed distribution for different heights (Gela rural area).
Figure 8.
Wind speed distribution for different heights (Gela rural area).
Figure 9.
Wind speed distribution for different heights (Gela suburban area).
Figure 9.
Wind speed distribution for different heights (Gela suburban area).
Constructed for each site, the curves’ t(v) calculated the electrical production of each turbine, considering for each of them the different heights of the tower, as suggested by the producers.
If the measured site wind speed data is available, then the energy yield of a wind turbine can be estimated by combining the binned wind speed distribution with the power curve:
where
H(
Ui) is the number of hours in wind speed bin
Ui,
P(
Ui) is the power output at that wind speed and there are
n wind speed bins.
Table 4 and
Table 5 show the values of energy production of small systems, subdivided by power rating.
Table 4.
Energy production kWh (Enna).
Table 4.
Energy production kWh (Enna).
| | Enna Sub-Urban Area | Enna Rural Area |
|---|
| Class 0.5–1.8 kW | height (m) | height (m) |
| Turbine | 10 | 15 | 20 | 25 | 10 | 15 | 20 | 25 |
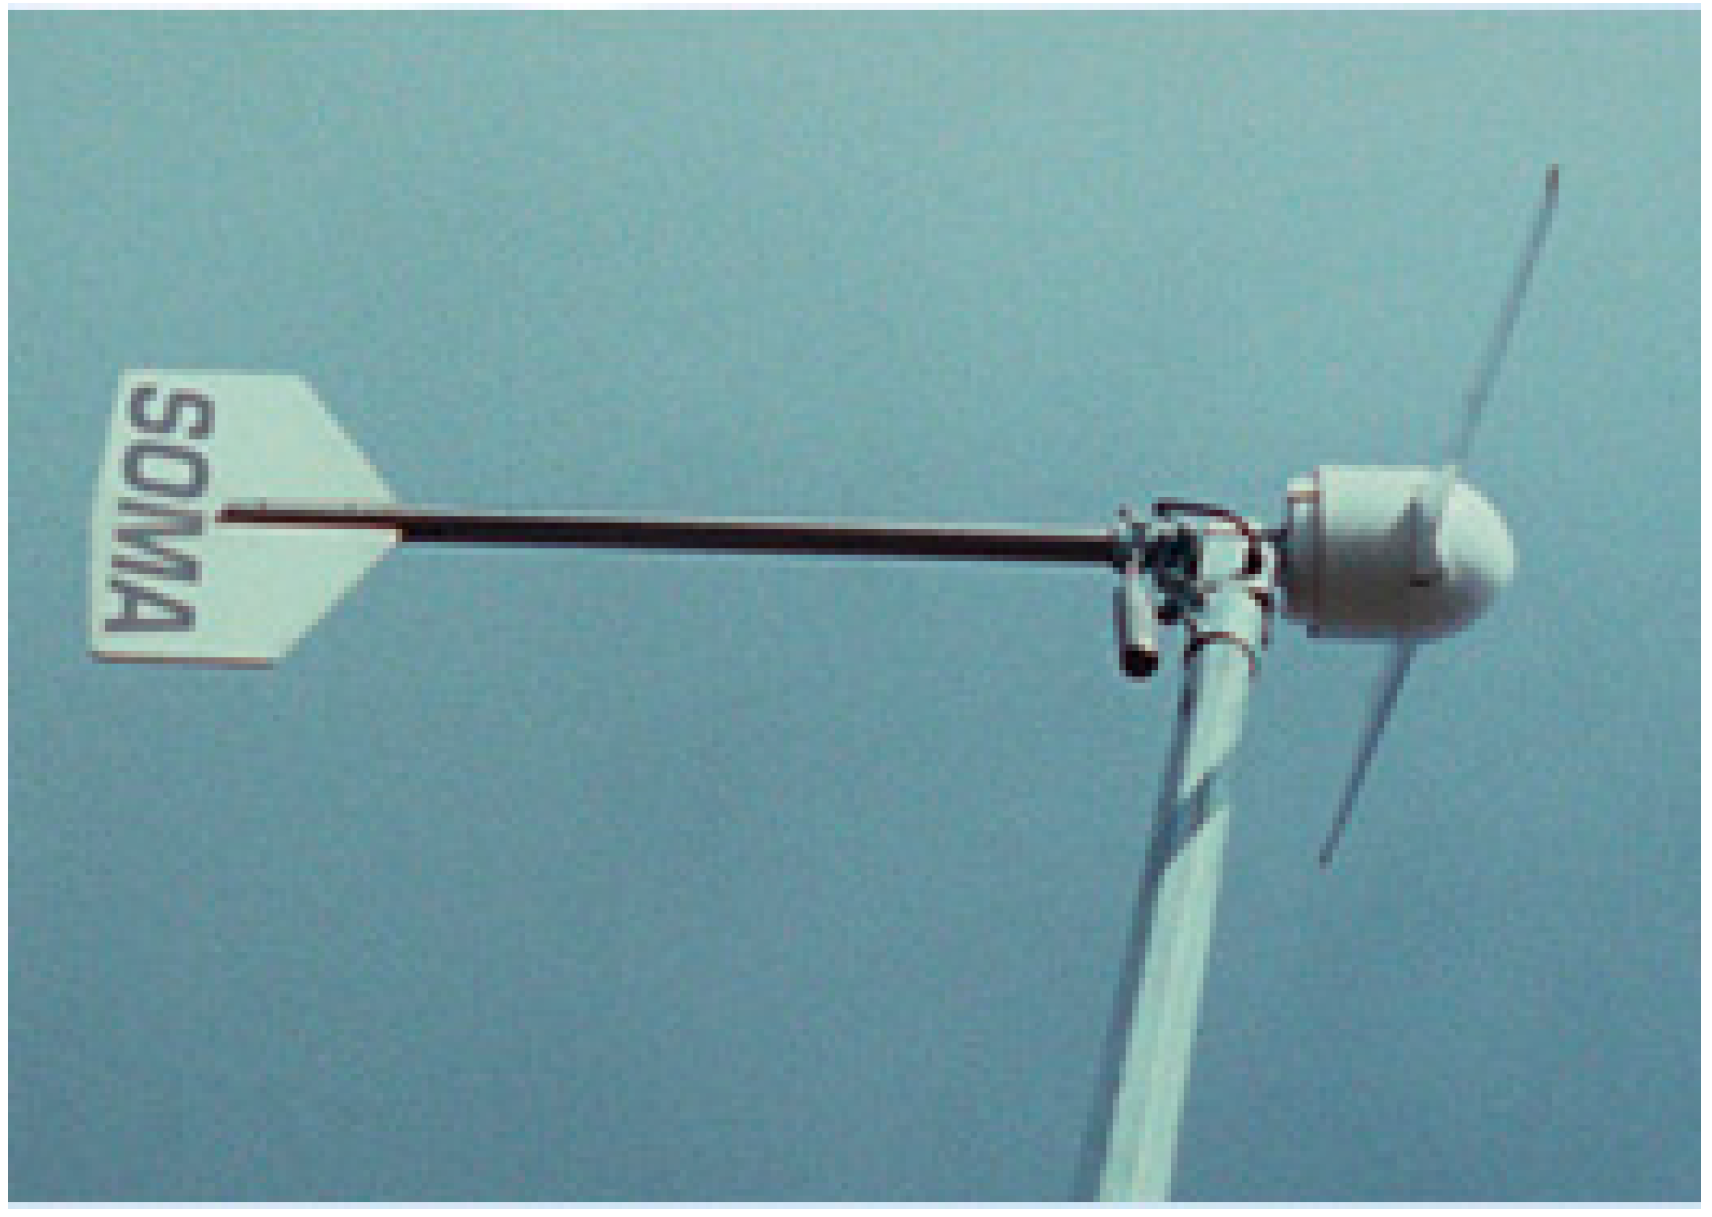
| Soma 1000—1 kW (HAWT) | 2550 | 2957 | 3256 | 3490 | 2550 | 2770 | 2929 | 3055 |
| Windspire 1.2 G—1.2 kW (VAWT) | 1159 | 1459 | 1693 | 1884 | 1159 | 1318 | 1438 | 1534 |
| Class 2–3.5 kW | height (m) | height (m) |
| Turbine | 10 | 15 | 20 | 25 | 10 | 15 | 20 | 25 |
| Inclin 3000—3 kW (HAWT) | 7259 | 8260 | 8999 | 9584 | 7259 | 7798 | 8191 | 8500 |
| Windfox—3 kW (HAWT) | 8540 | 9715 | 10577 | 11259 | 8540 | 9174 | 9634 | 9995 |
| WindRotor WRE.030—3 kW (VAWT) | 2569 | 3186 | 3683 | 4101 | 2569 | 2893 | 3141 | 3343 |
| Cleanfield—3.5 kW (VAWT) | 4327 | 5309 | 6080 | 6716 | 4327 | 4846 | 5238 | 5555 |
| Class 5–6 kW | height (m) | height (m) |
| Turbine | 10 | 15 | 20 | 25 | 10 | 15 | 20 | 25 |
| EasyWind 6 AC—6 kW (HAWT) | 13572 | 15708 | 17247 | 18443 | 13572 | 14730 | 15562 | 16212 |
| Maxy Vertical Wre 0.62—6 kW (VAWT) | 5406 | 6760 | 7861 | 8792 | 5406 | 6115 | 6661 | 7108 |
| Class 10–12.5 kW | height (m) | height (m) |
| Turbine | 15 | 20 | 25 | 30 | 15 | 20 | 25 | 30 |
| BWC Excel-S—10 kW (HAWT) | 9179 | 10807 | 12212 | 13453 | 8243 | 9035 | 9690 | 10253 |
| Windpower Gyro—10 kW (VAWT) | 16123 | 18719 | 20868 | 22702 | 14575 | 15888 | 16951 | 17849 |
| Class 15–17.5 kW | height (m) | height (m) |
| Turbine | 15 | 20 | 25 | 30 | 15 | 20 | 25 | 30 |
| WT 15000—15 kW (HAWT) | 35745 | 39490 | 42418 | 44805 | 33387 | 35392 | 36966 | 38262 |
| Baywinds 24–15—15 kW (HAWT) | 22633 | 26003 | 28773 | 31121 | 20607 | 22325 | 23711 | 24877 |
| Class 20–25 kW | height (m) | height (m) |
| Turbine | 15 | 20 | 25 | 30 | 15 | 20 | 25 | 30 |
| FL—20 kW (HAWT) | 57902 | 63288 | 67381 | 70647 | 54416 | 57385 | 59679 | 61541 |
| Big Star Vertical—20 kW (VAWT) | 24074 | 27756 | 30870 | 33571 | 21920 | 23744 | 25239 | 26512 |
Table 5.
Energy production kWh (Gela).
Table 5.
Energy production kWh (Gela).
| | Gela Sub-Urban Area | Gela Rural Area |
|---|
| Class 0.5–1.8 kW | height (m) | height (m) |
| Turbine | 10 | 15 | 20 | 25 | 10 | 15 | 20 | 25 |
| Soma 1000—1 kW (HAWT) | 1678 | 1982 | 2213 | 2399 | 1678 | 1841 | 1961 | 2057 |
| Windspire 1.2 G—1.2 kW (VAWT) | 689 | 881 | 1037 | 1167 | 689 | 790 | 867 | 931 |
| Class 2–3.5 kW | height (m) | height (m) |
| Turbine | 10 | 15 | 20 | 25 | 10 | 15 | 20 | 25 |
| Inclin 3000—3 kW (HAWT) | 5079 | 5841 | 6419 | 6886 | 5079 | 5486 | 5787 | 6027 |
| Windfox—3 kW (HAWT) | 5830 | 6751 | 7444 | 8002 | 5830 | 6324 | 6687 | 6975 |
| WindRotor WRE.030—3 kW (VAWT) | 1617 | 2017 | 2344 | 2623 | 1617 | 1827 | 1988 | 2120 |
| Cleanfield—3.5 kW (VAWT) | 2759 | 3400 | 3916 | 4351 | 2759 | 3096 | 3353 | 3563 |
| Class 5–6 kW | height (m) | height (m) |
| Turbine | 10 | 15 | 20 | 25 | 10 | 15 | 20 | 25 |
| EasyWind 6 AC—6 kW (HAWT) | 8815 | 10438 | 11657 | 12634 | 8815 | 9685 | 10324 | 10832 |
| Maxy Vertical Wre 0.62—6 kW (VAWT) | 3420 | 4281 | 4991 | 5601 | 3420 | 3870 | 4218 | 4504 |
| Class 10–12.5 kW | height (m) | height (m) |
| Turbine | 15 | 20 | 25 | 30 | 15 | 20 | 25 | 30 |
| BWC Excel-S—10 kW (HAWT) | 5675 | 6716 | 7622 | 8428 | 5080 | 5583 | 6001 | 8428 |
| Windpower Gyro—10 kW (VAWT) | 9917 | 11622 | 13067 | 14324 | 8920 | 9765 | 10457 | 14324 |
| Class 15–17.5 kW | height (m) | height (m) |
| Turbine | 15 | 20 | 25 | 30 | 15 | 20 | 25 | 30 |
| WT 15000—15 kW (HAWT) | 23819 | 26657 | 28950 | 30872 | 22082 | 23557 | 24734 | 30872 |
| Baywinds 24–15—15 kW (HAWT) | 14199 | 16460 | 18362 | 20008 | 12866 | 13995 | 14916 | 20008 |
| Class 20–25 kW | height (m) | height (m) |
| Turbine | 15 | 20 | 25 | 30 | 15 | 20 | 25 | 30 |
| FL—20 kW (HAWT) | 38120 | 42542 | 46042 | 48932 | 35361 | 37706 | 39556 | 48932 |
| Big Star Vertical—20 kW (VAWT) | 15615 | 18020 | 20081 | 21891 | 14219 | 15400 | 16373 | 21891 |
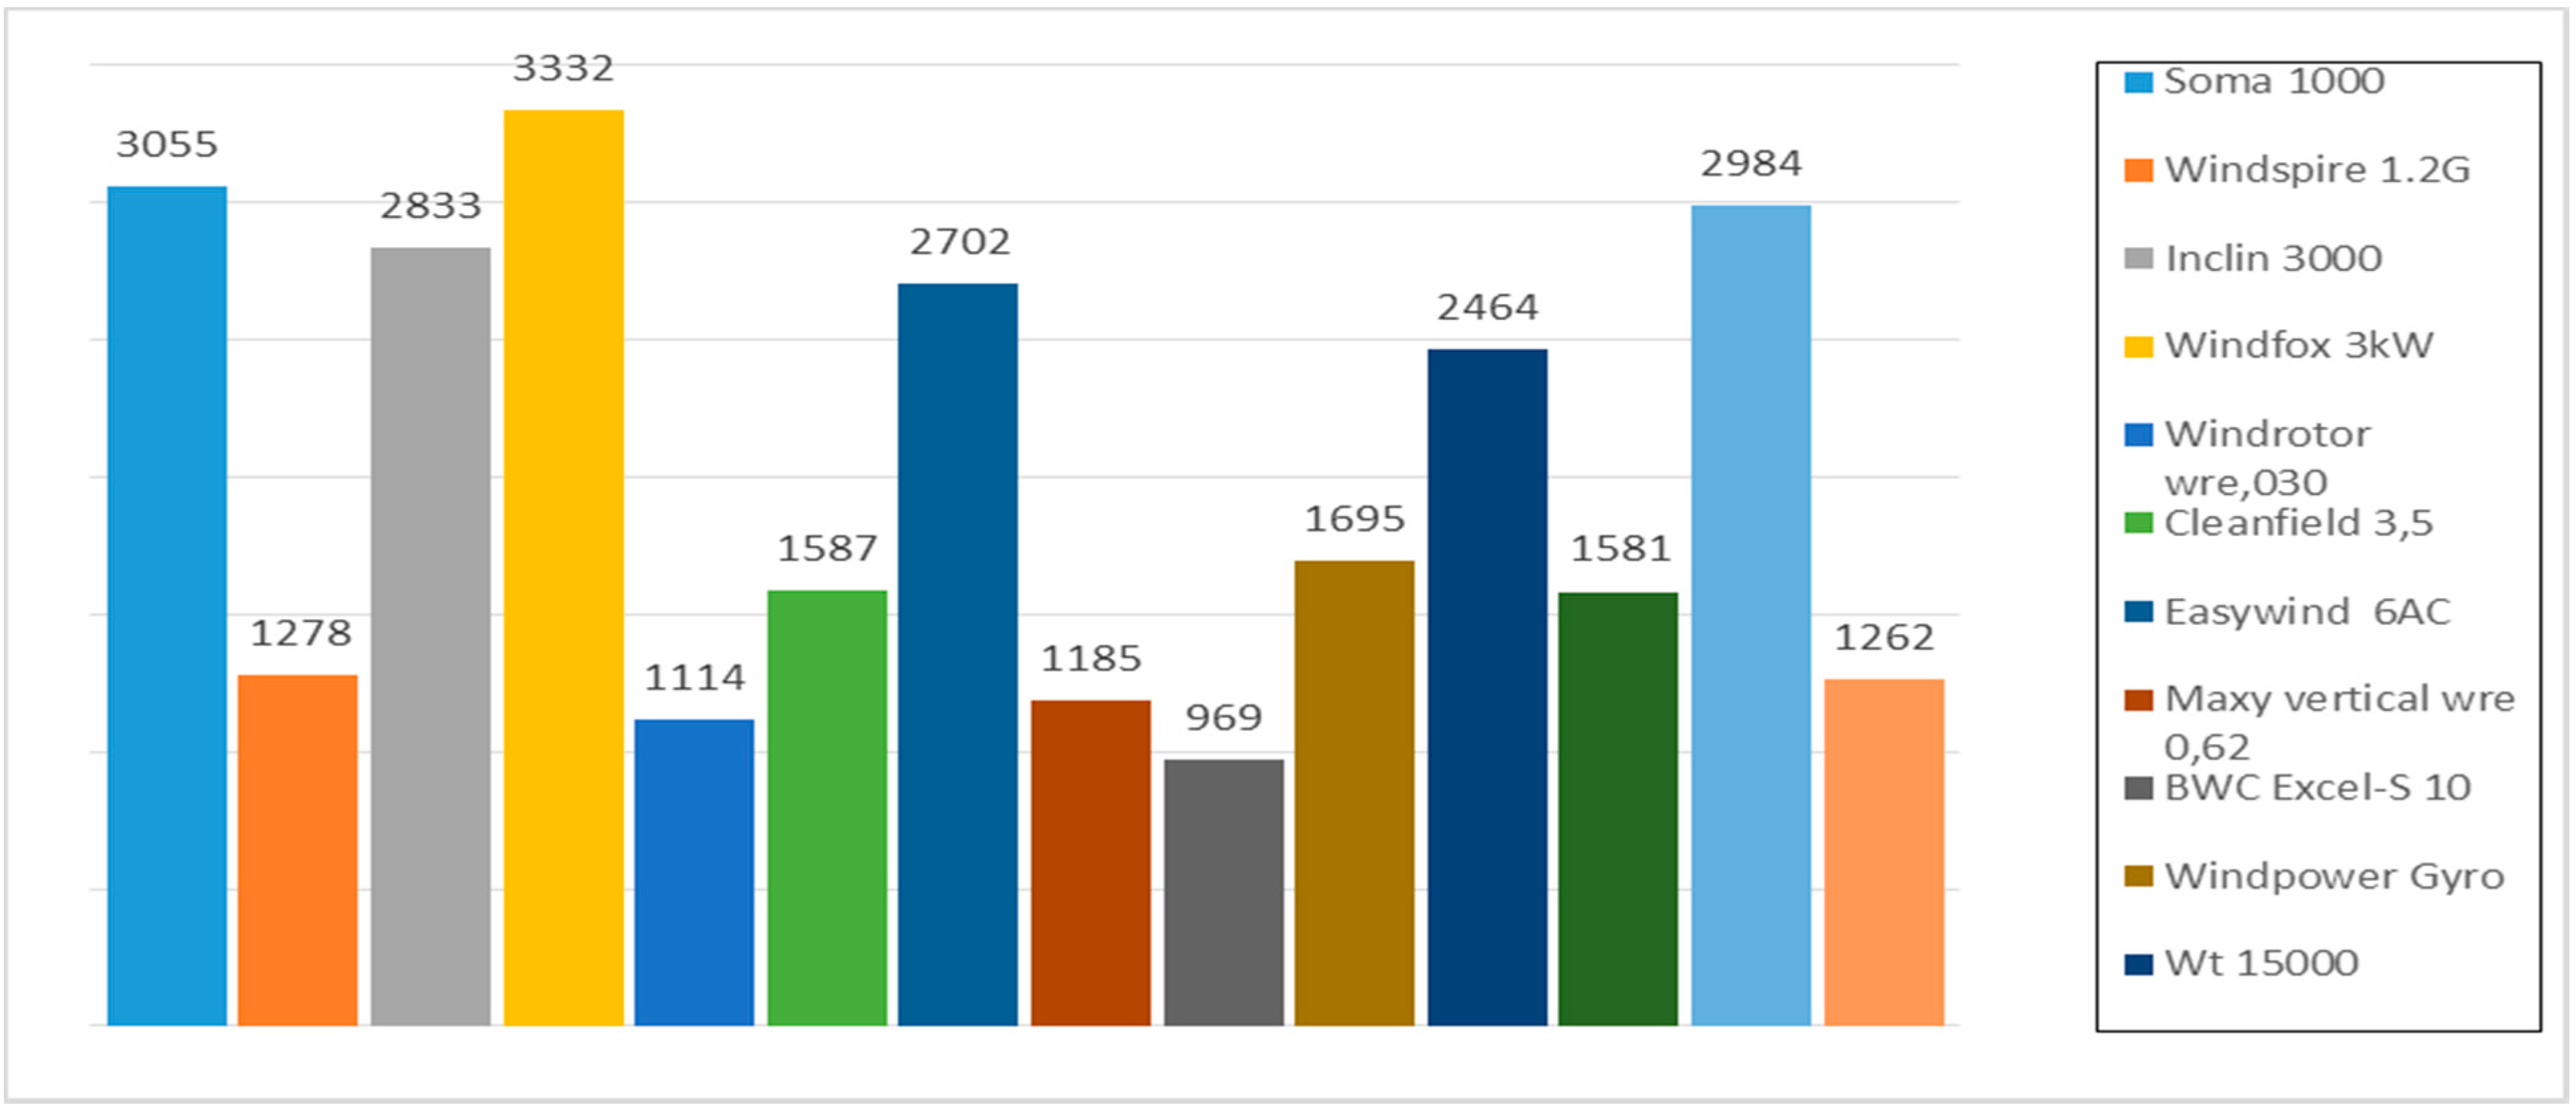
To obtain an additional comparative assessment of the different performance of turbines, the capacity factor will be evaluated. Capacity factor is the energy generated during the year divided by the rated power multiplied by the number of hours in the year.
To calculate the capacity factor has been considered the share of 25 meters for the rural area (
Figure 10 and
Figure 11) and 15 meters in the case of sub-urban area (
Figure 12 and
Figure 13).
Figure 10.
Capacity factor h = 25 m (Enna rural area).
Figure 10.
Capacity factor h = 25 m (Enna rural area).
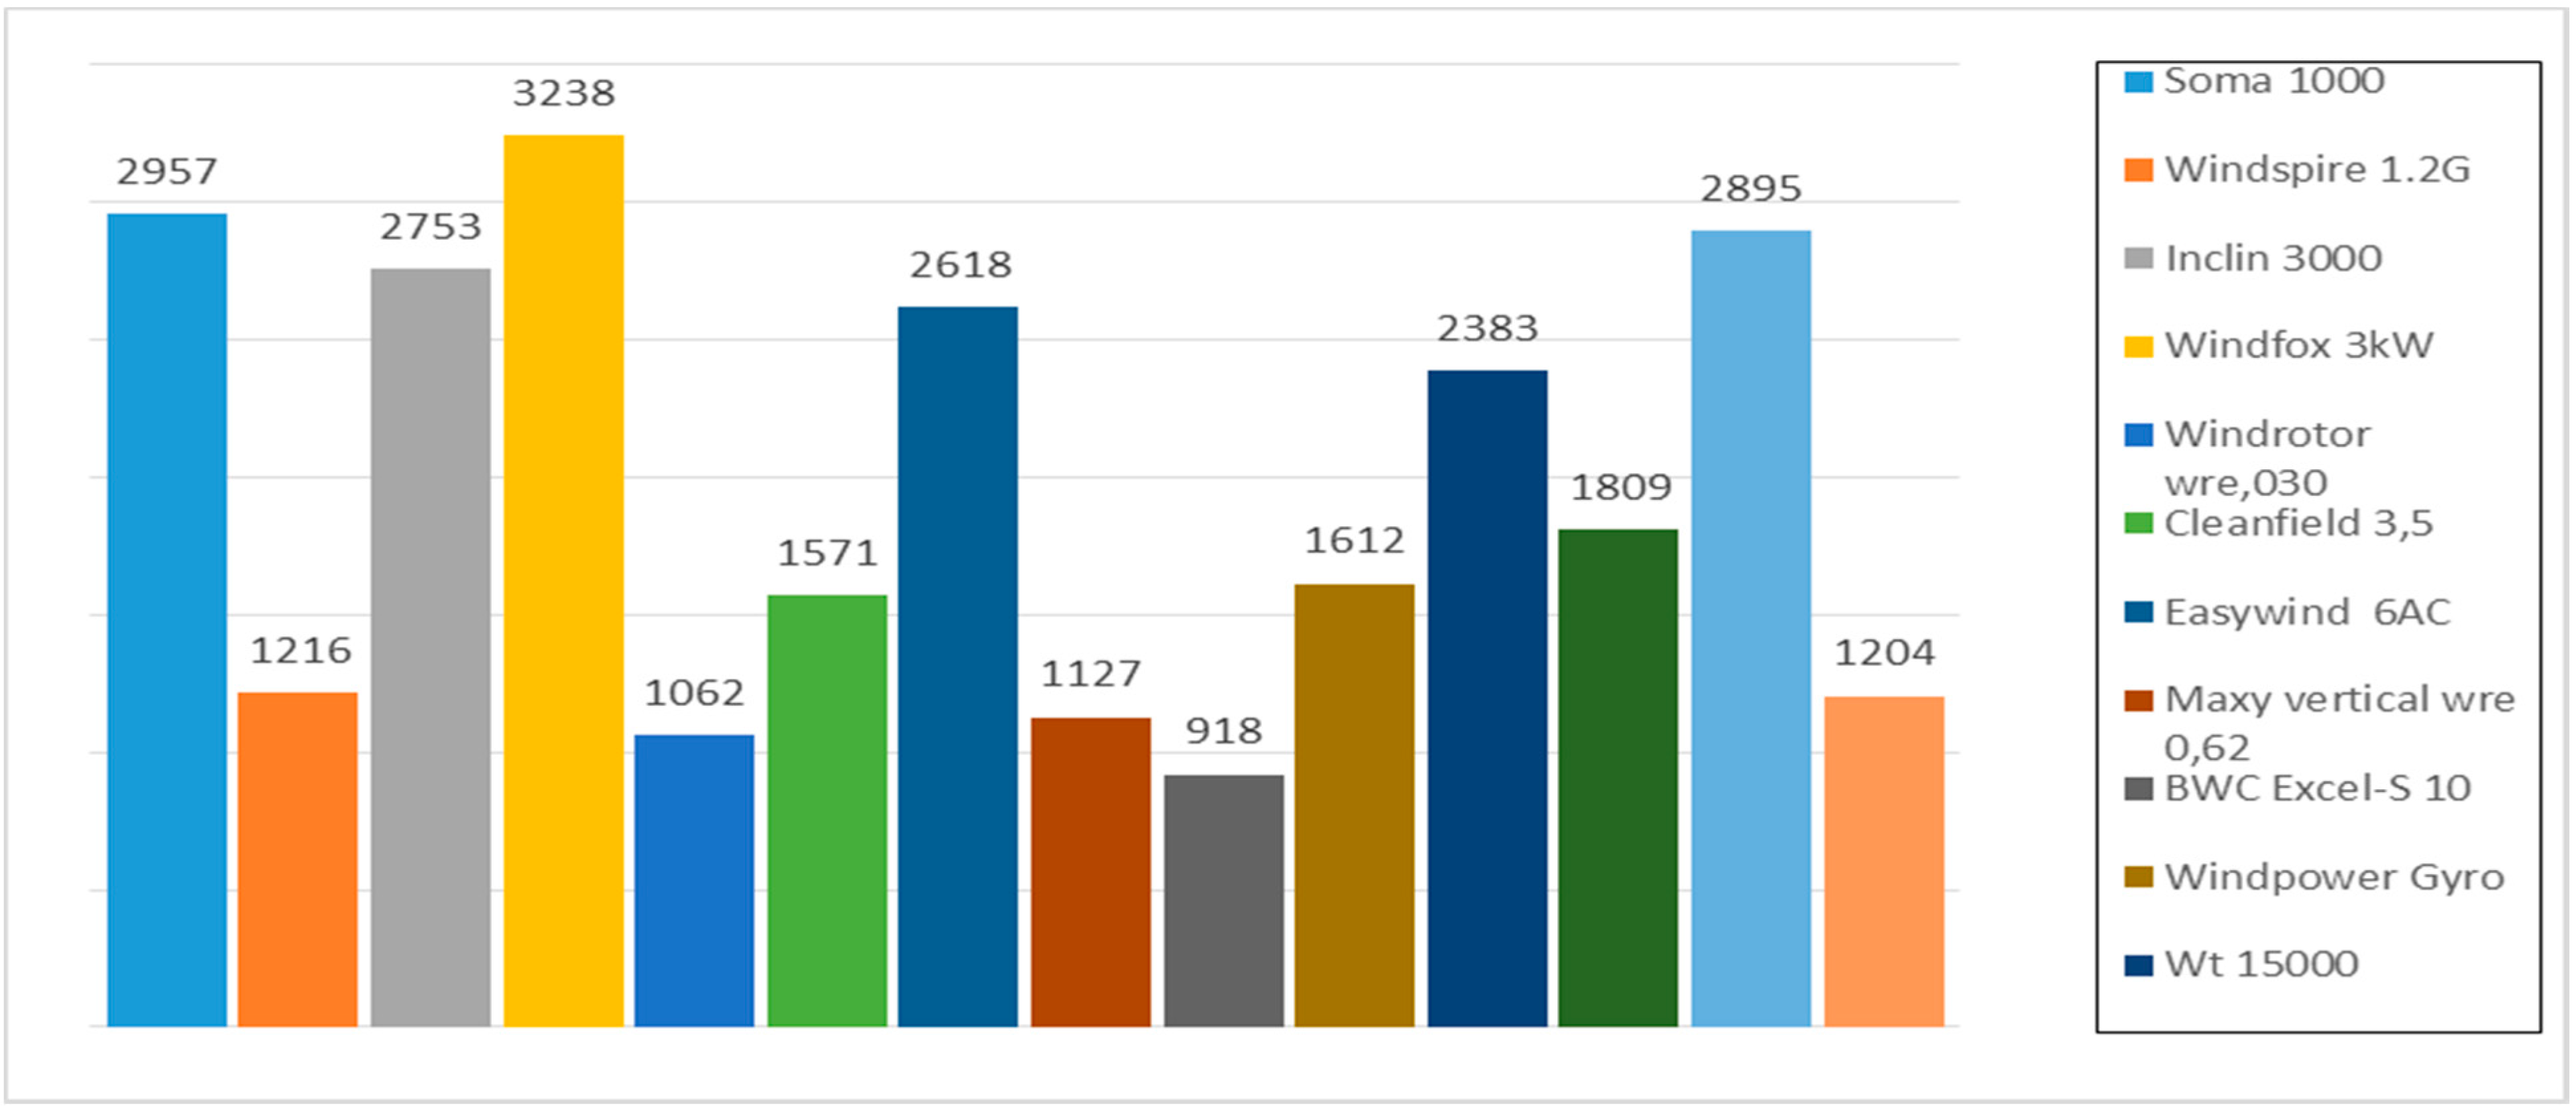
Figure 11.
Capacity factor h = 25 m (Enna suburban area).
Figure 11.
Capacity factor h = 25 m (Enna suburban area).
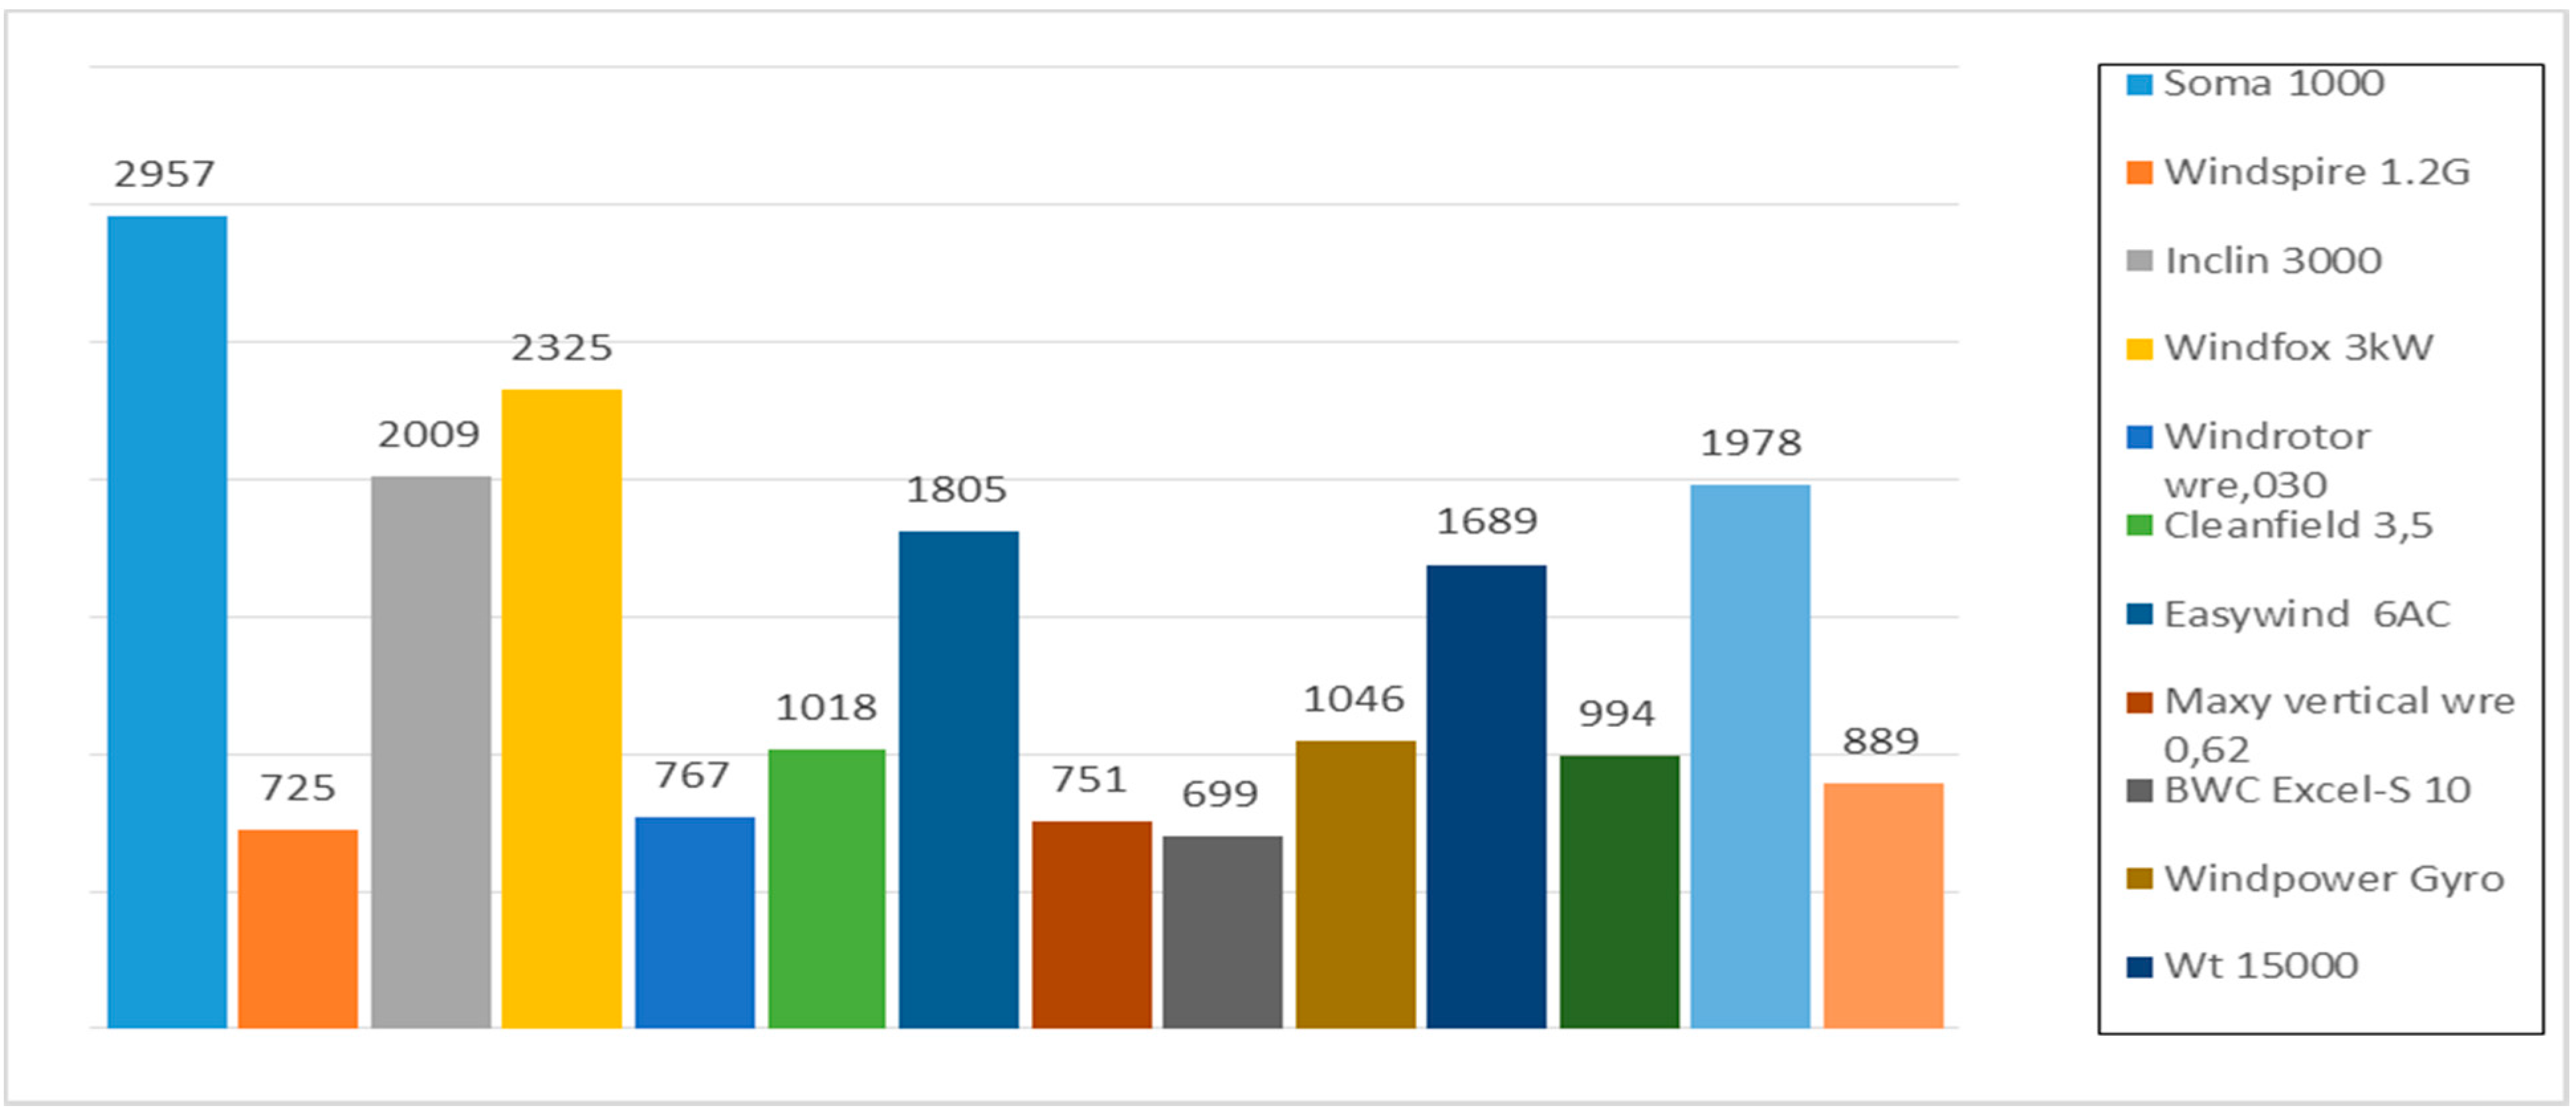
Figure 12.
Capacity factor h = 25 m (Gela rural area).
Figure 12.
Capacity factor h = 25 m (Gela rural area).
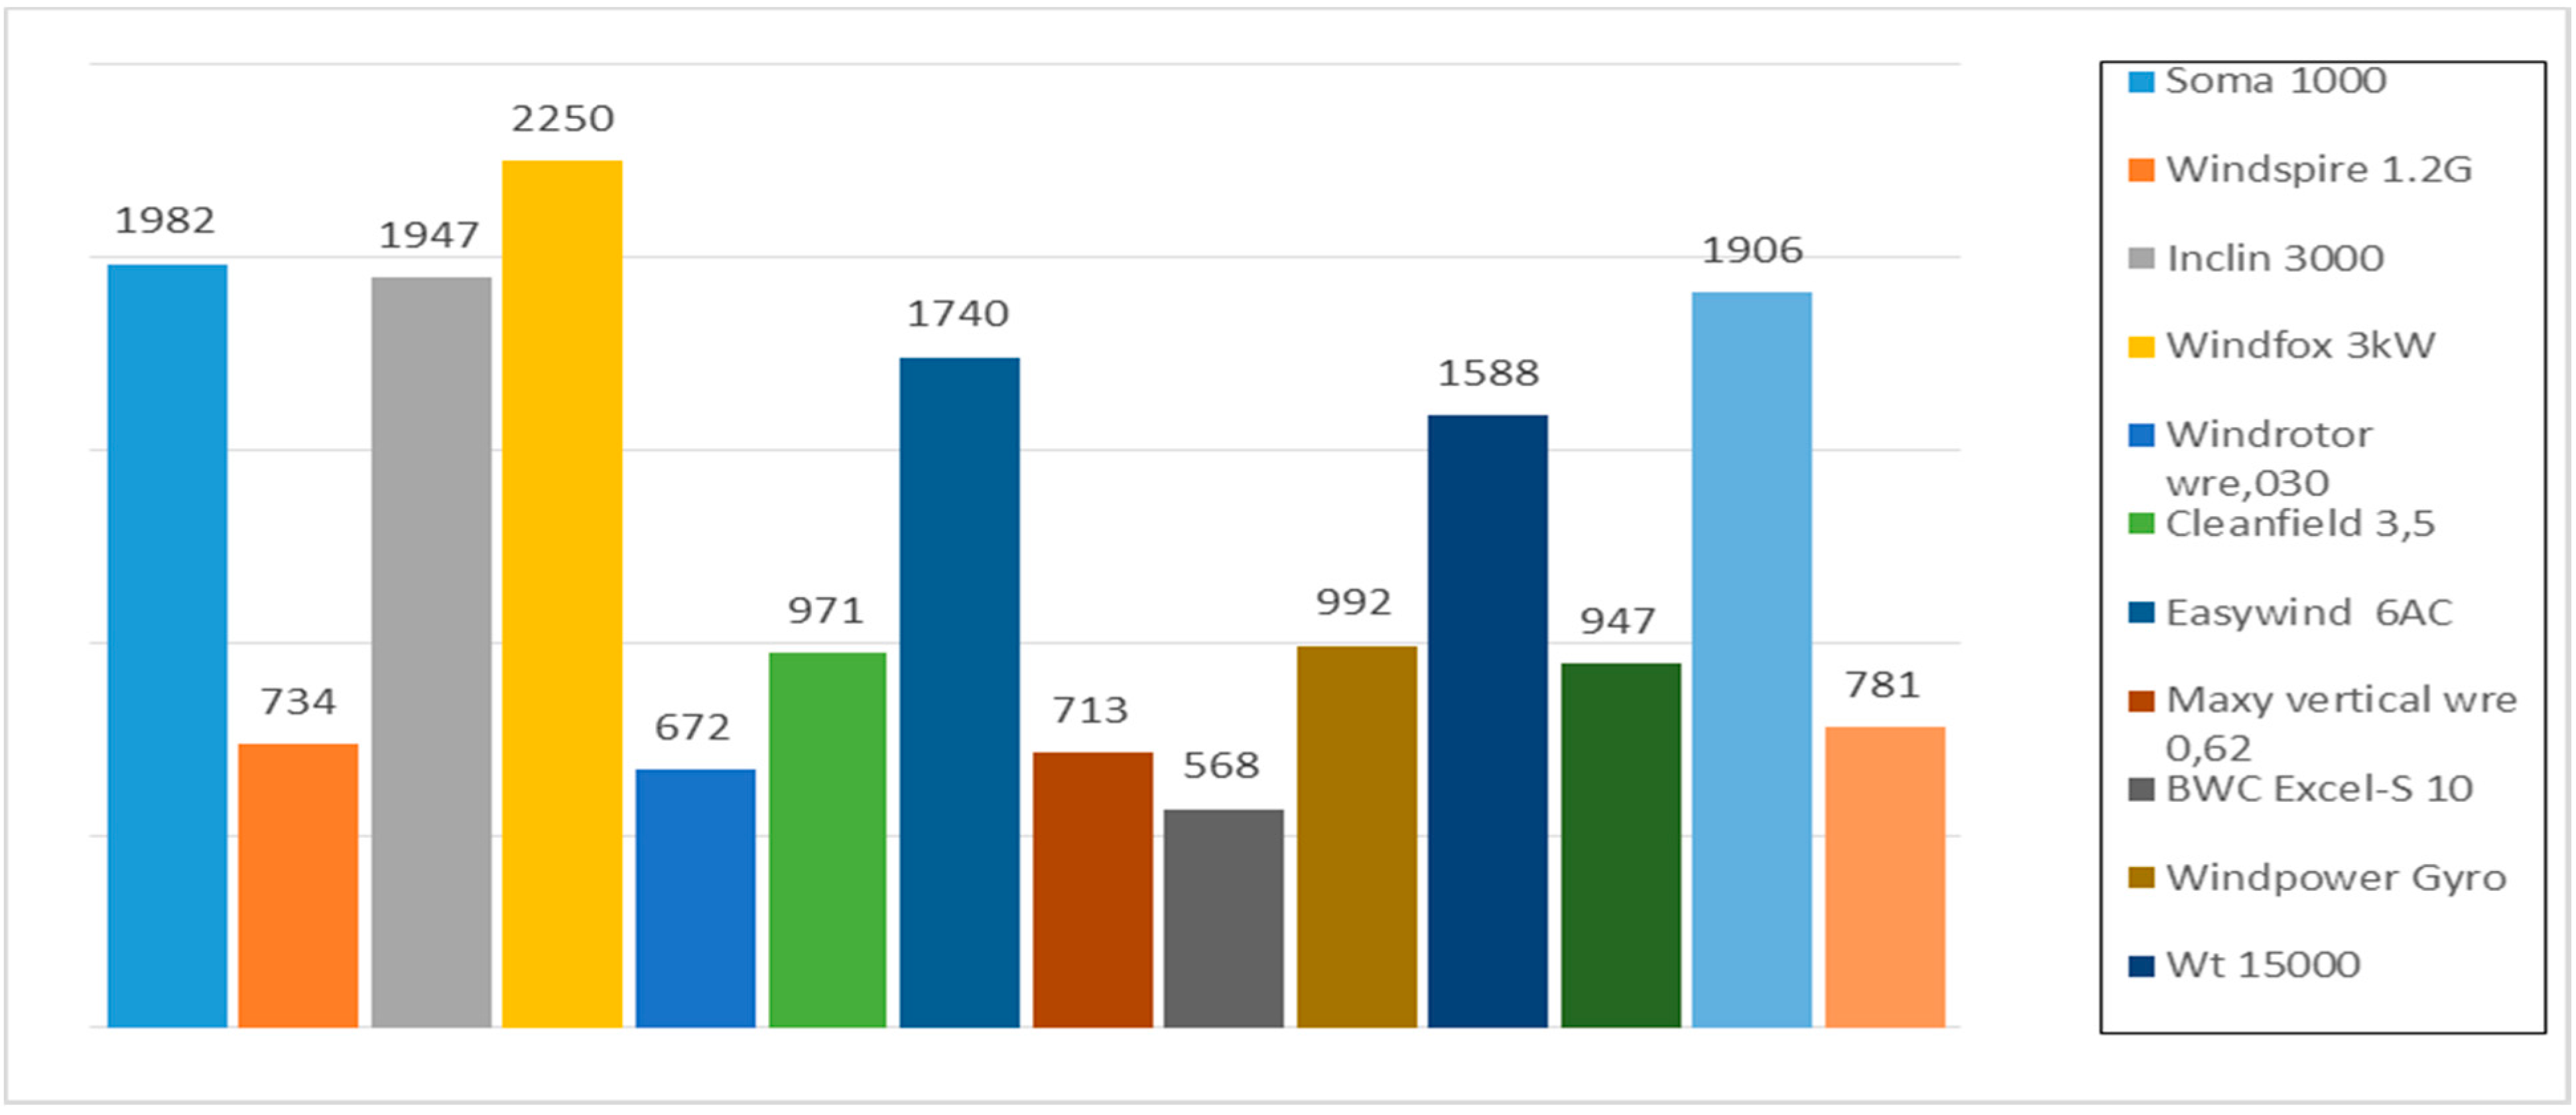
Figure 13.
Capacity factor h = 25 m (Gela suburban area).
Figure 13.
Capacity factor h = 25 m (Gela suburban area).
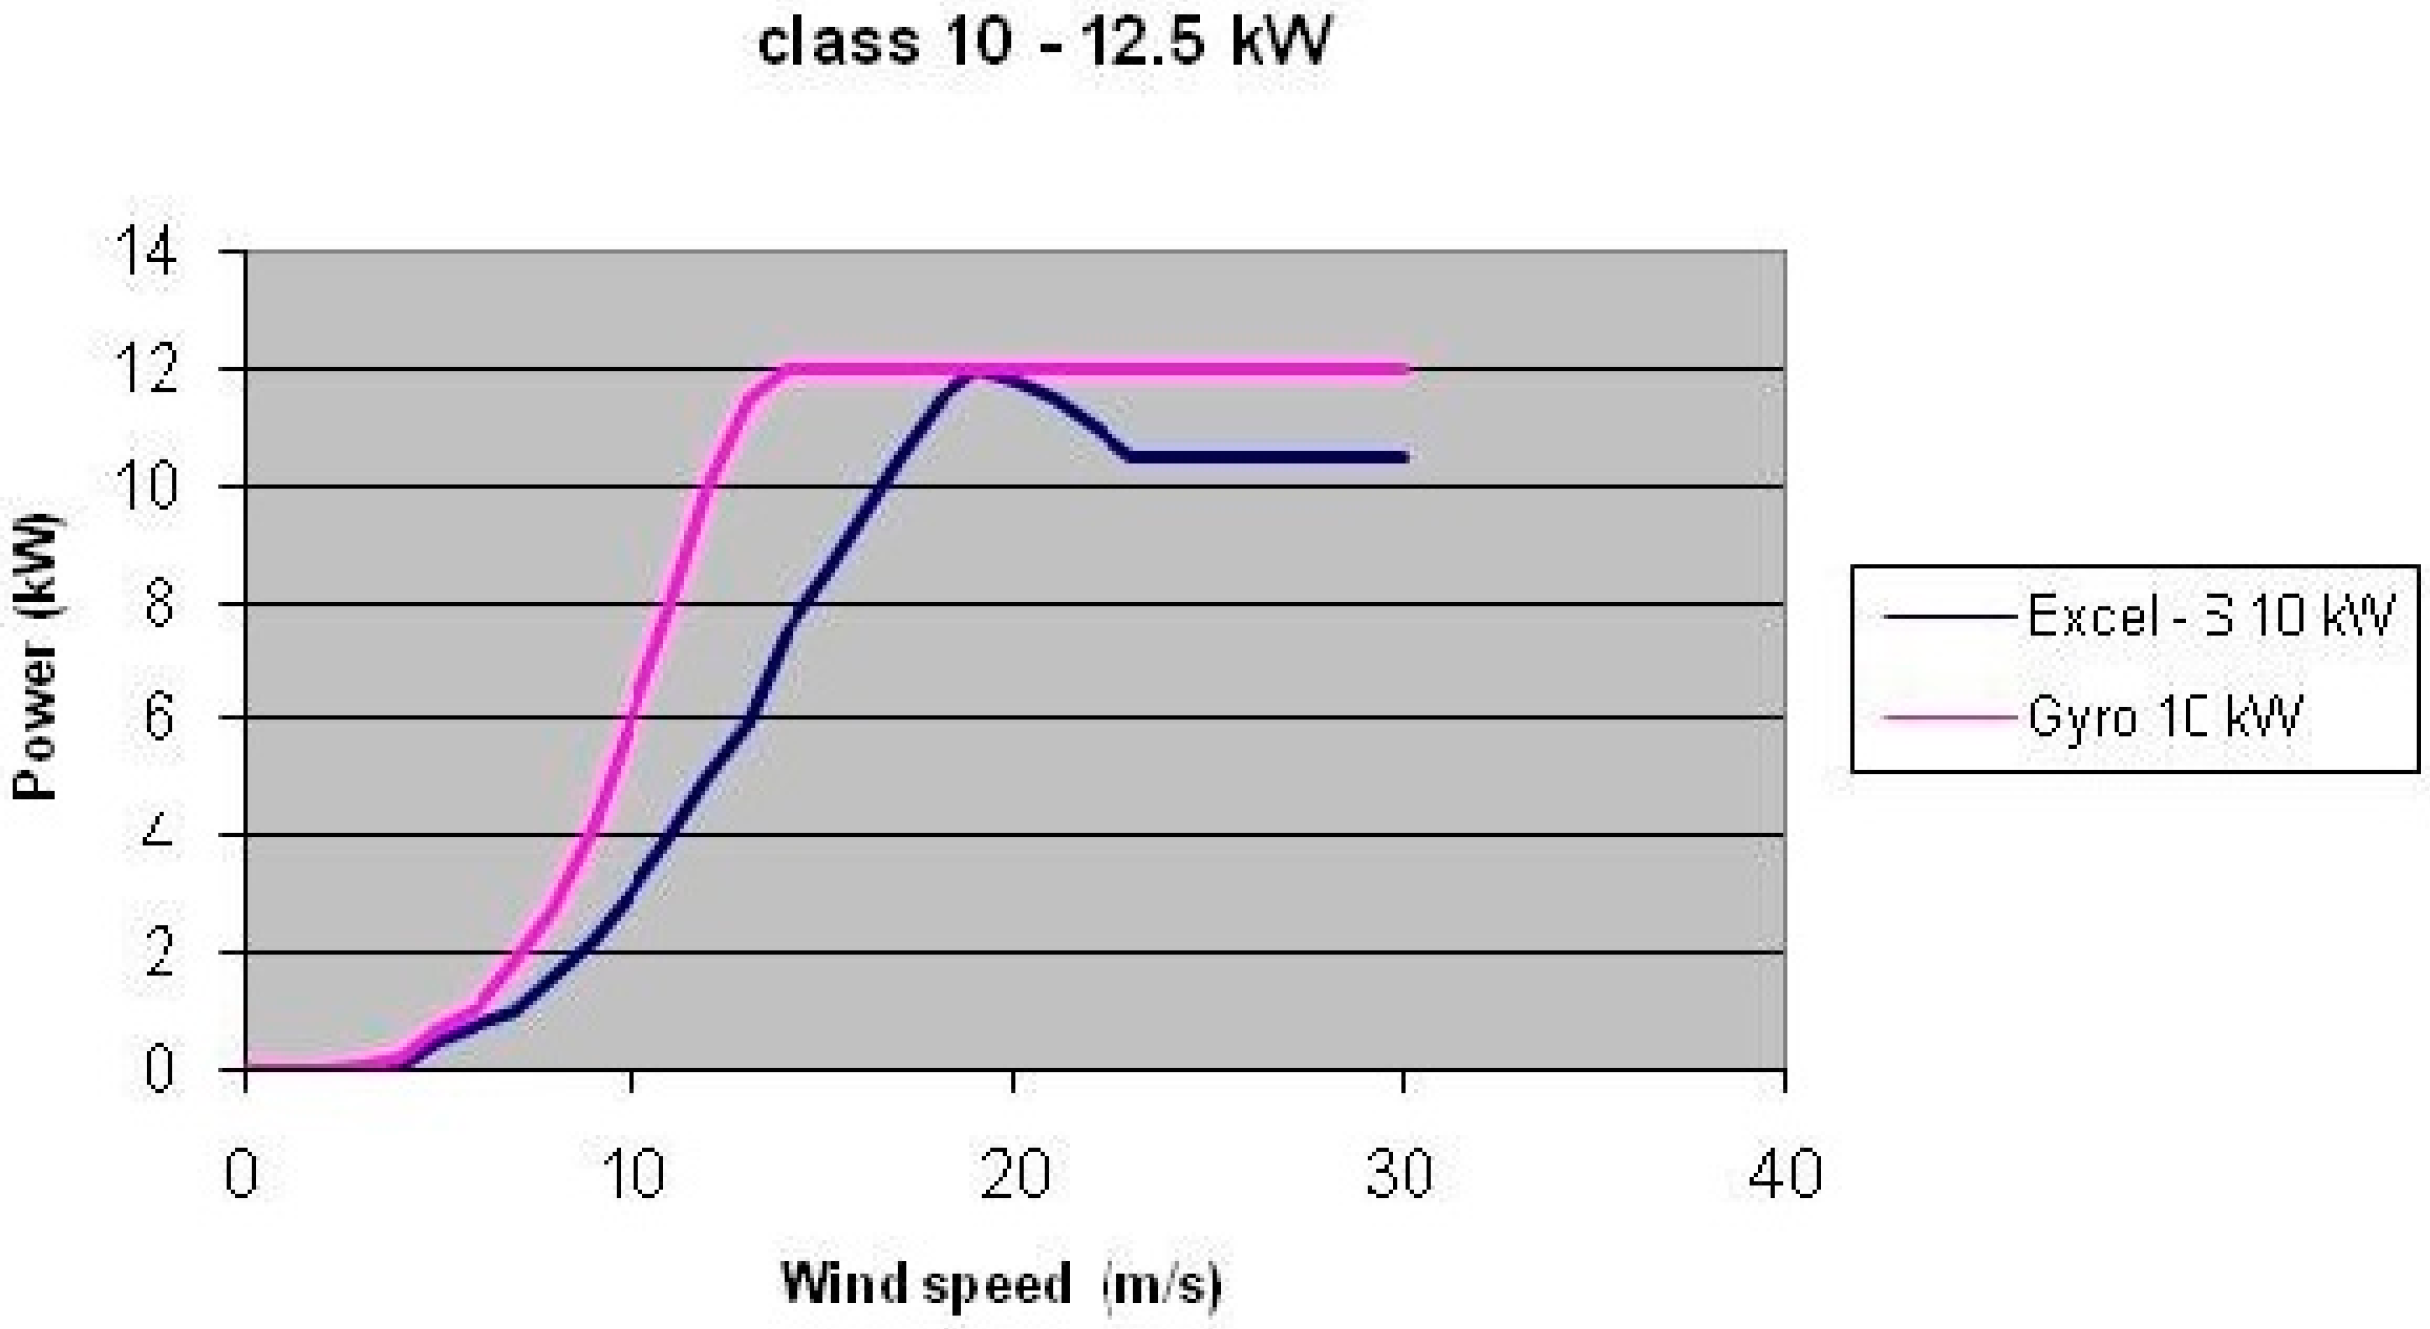
The graphs show that for both stations and for each type of terrain the horizontal axis wind turbines produced more energy than the vertical axis. Only in the class from 10 to 12.5 kW the VAWT produces about10% in more than HAWT (this percentage is reduced at the Gela site).
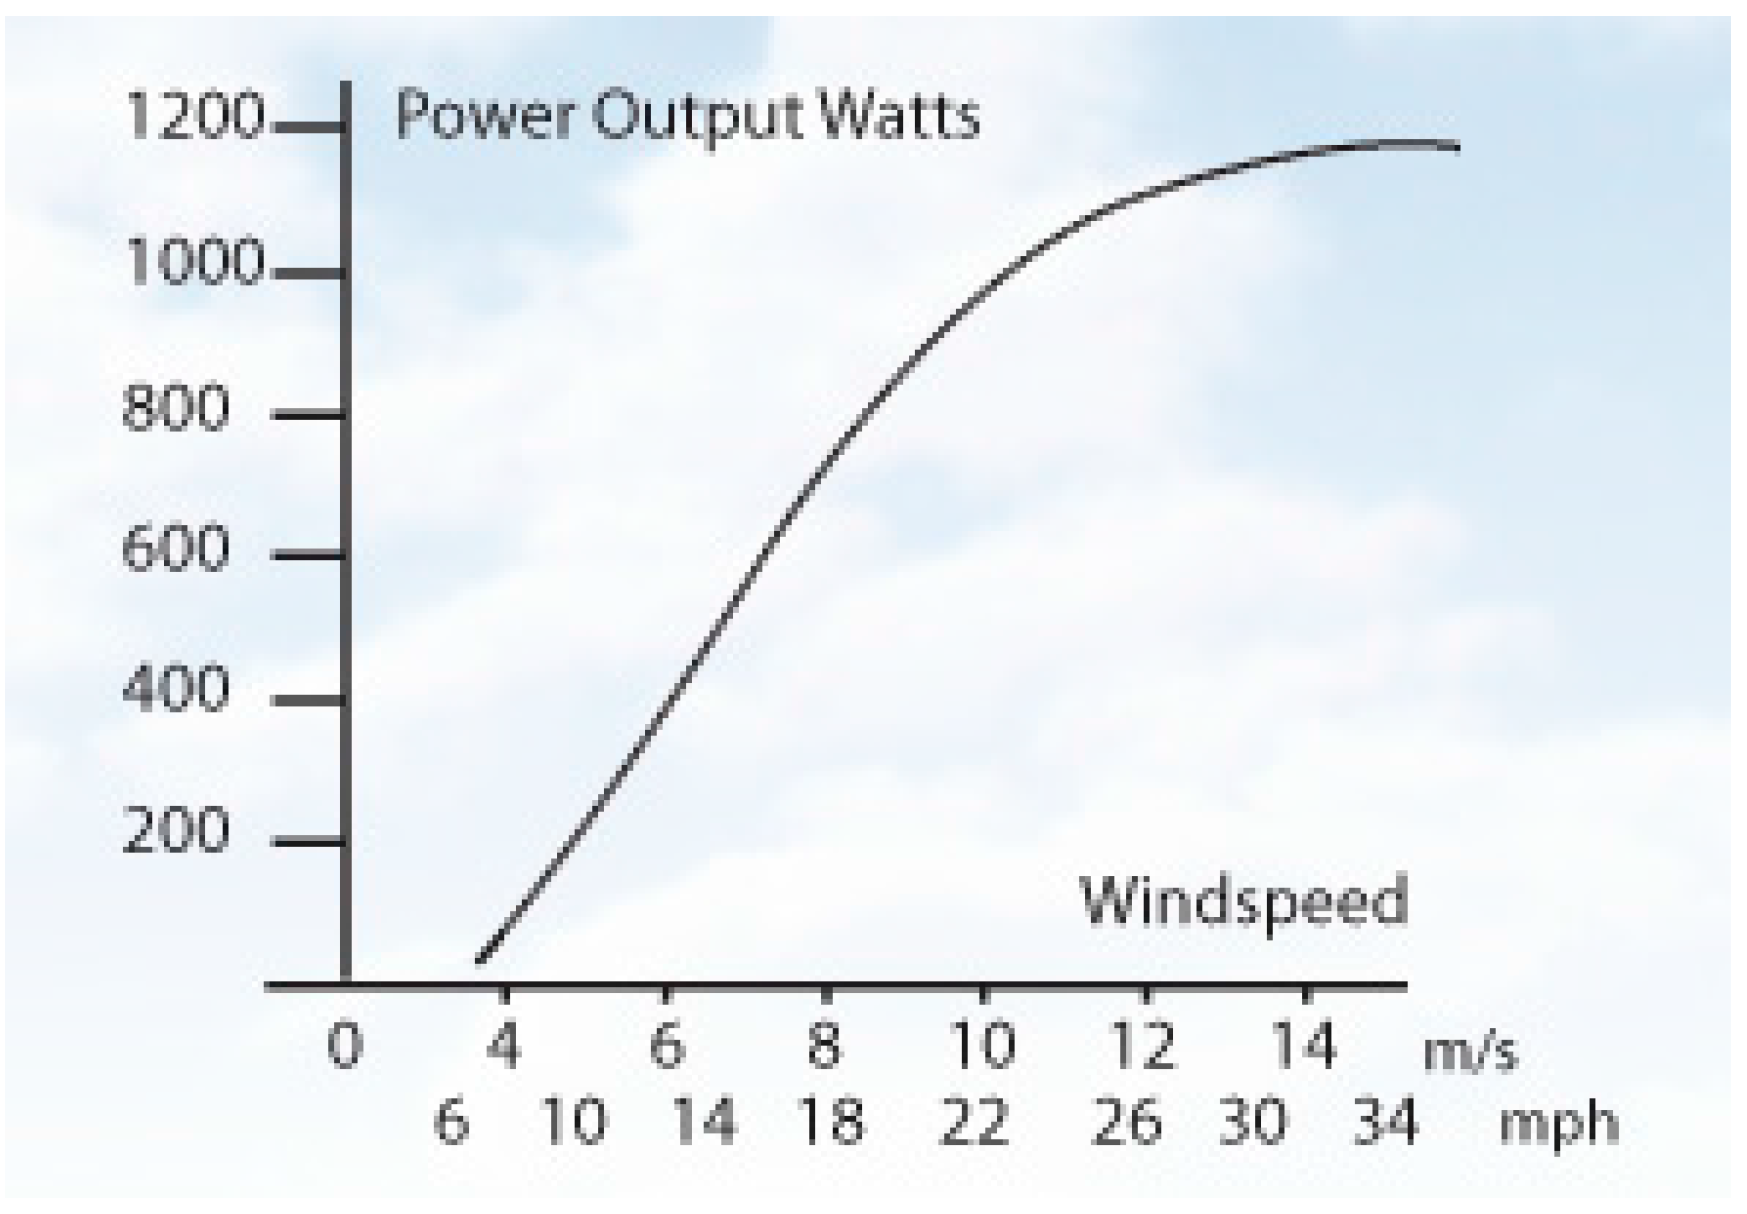
This difference depends from power curves (
Figure 14) of two turbines; in fact Windpower Gyro is characterized by a cut-in wind speed of 3.2 m/s and by a cut-off wind speed of 24 m/s while the BWC Excel-S has a higher starting speed (3.6 m/s) and a smaller stop speed (16.1 m/s).
Comparing all classes it follows that the turbine with the major capacity factor is the Windfox 3 kW; the one that presents a lower capacity is the BWC Excel-S (either with horizontal axis).
4.3. Economic Analysis
The following economic analysis has used values derived from market research on the cost of small turbines previously analyzed, obtained by the companies that work in the sector.
In the first phase the final expenditure commitments for each turbine was computed, given by the sum of the costs of various components (generator, inverter, control panel,
etc.). However, frequently producers do not provide the cost of the accessories and, therefore, it is impossible to do a real evaluation of costs and, in particular, their comparison [
16]. Therefore, in order to make a comparable cost of the turbines, the authors have considered the specific costs for every kW installed.
In order to obtain the payback return the annual revenues obtainable for every value of productivity have been calculated, such as the amount of the tariff that is accessed. In this study an all-inclusive rate was applied that provides an incentive payment of €0.30 per kWh transferred to the electricity grid.
The relationship between the specific cost and revenues allowed to obtain the payback period are found in
Figure 15 and
Figure 16.
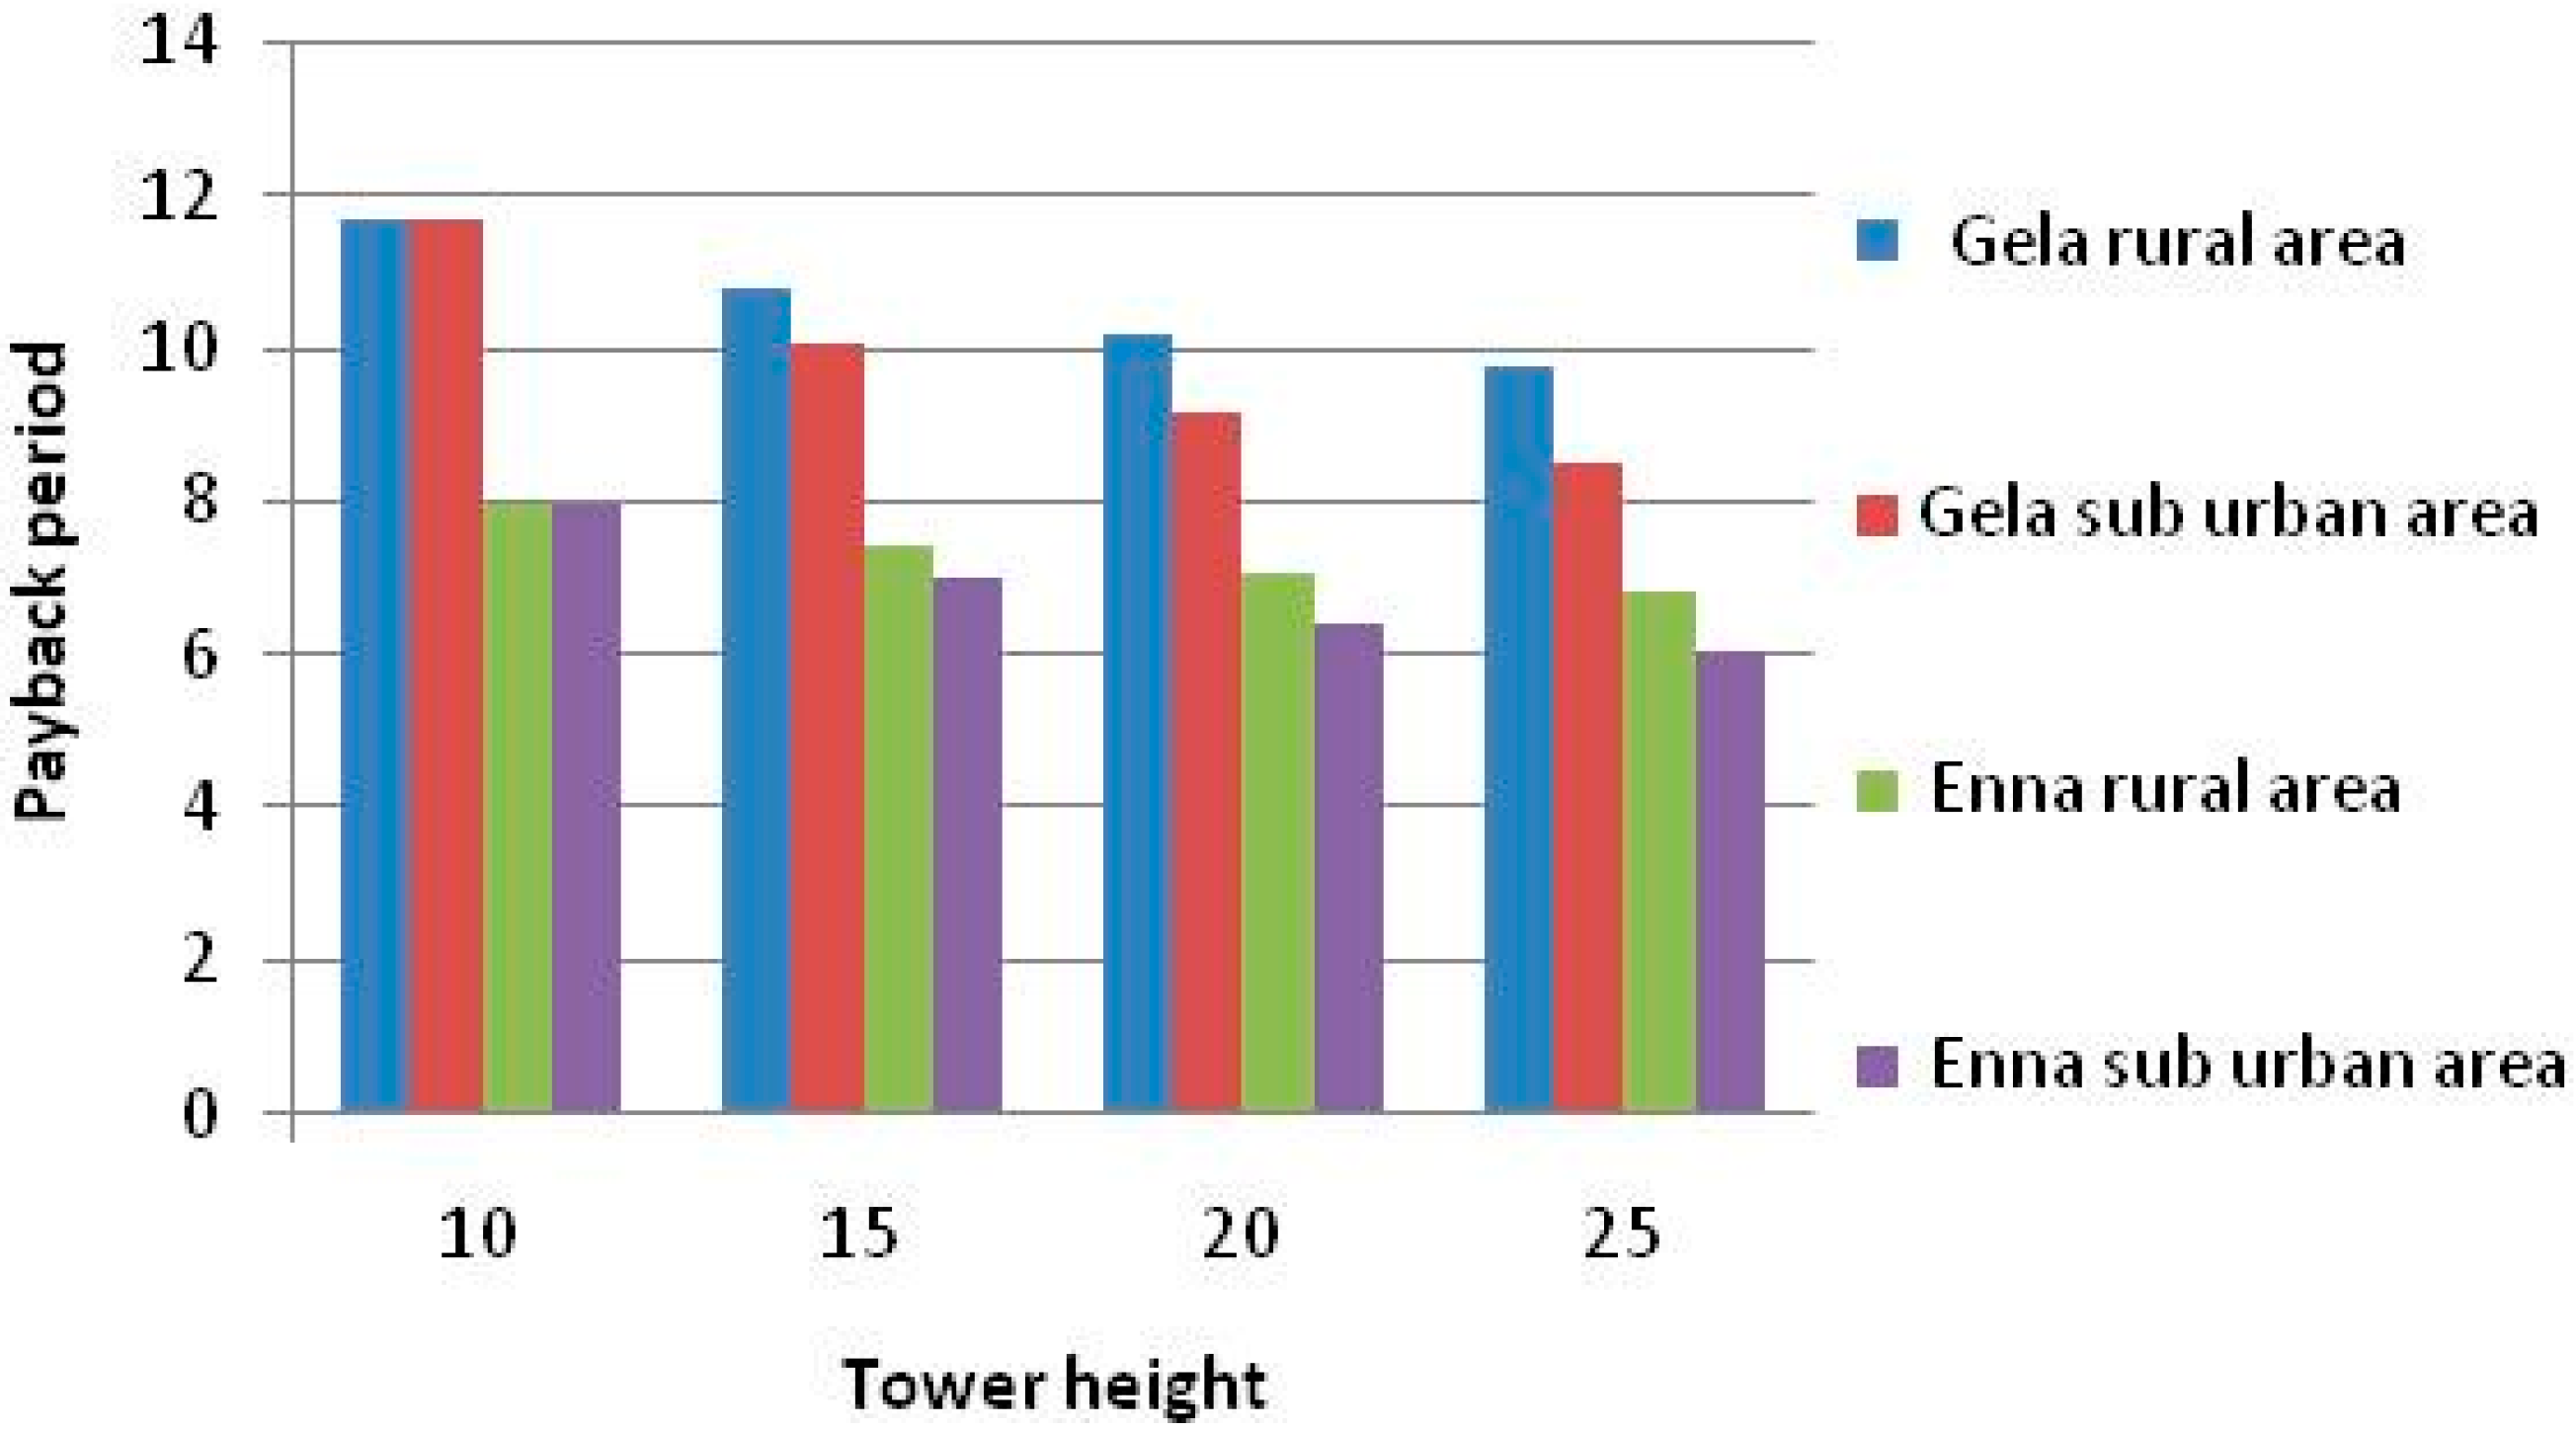
Figure 15 and
Figure 16, respectively, show the payback period for Windfox 3 kW turbines (major capacity factor) and for the BWC Excel-S (lower capacity factor).
Figure 15.
Payback Period Windfox 3 kW.
Figure 15.
Payback Period Windfox 3 kW.
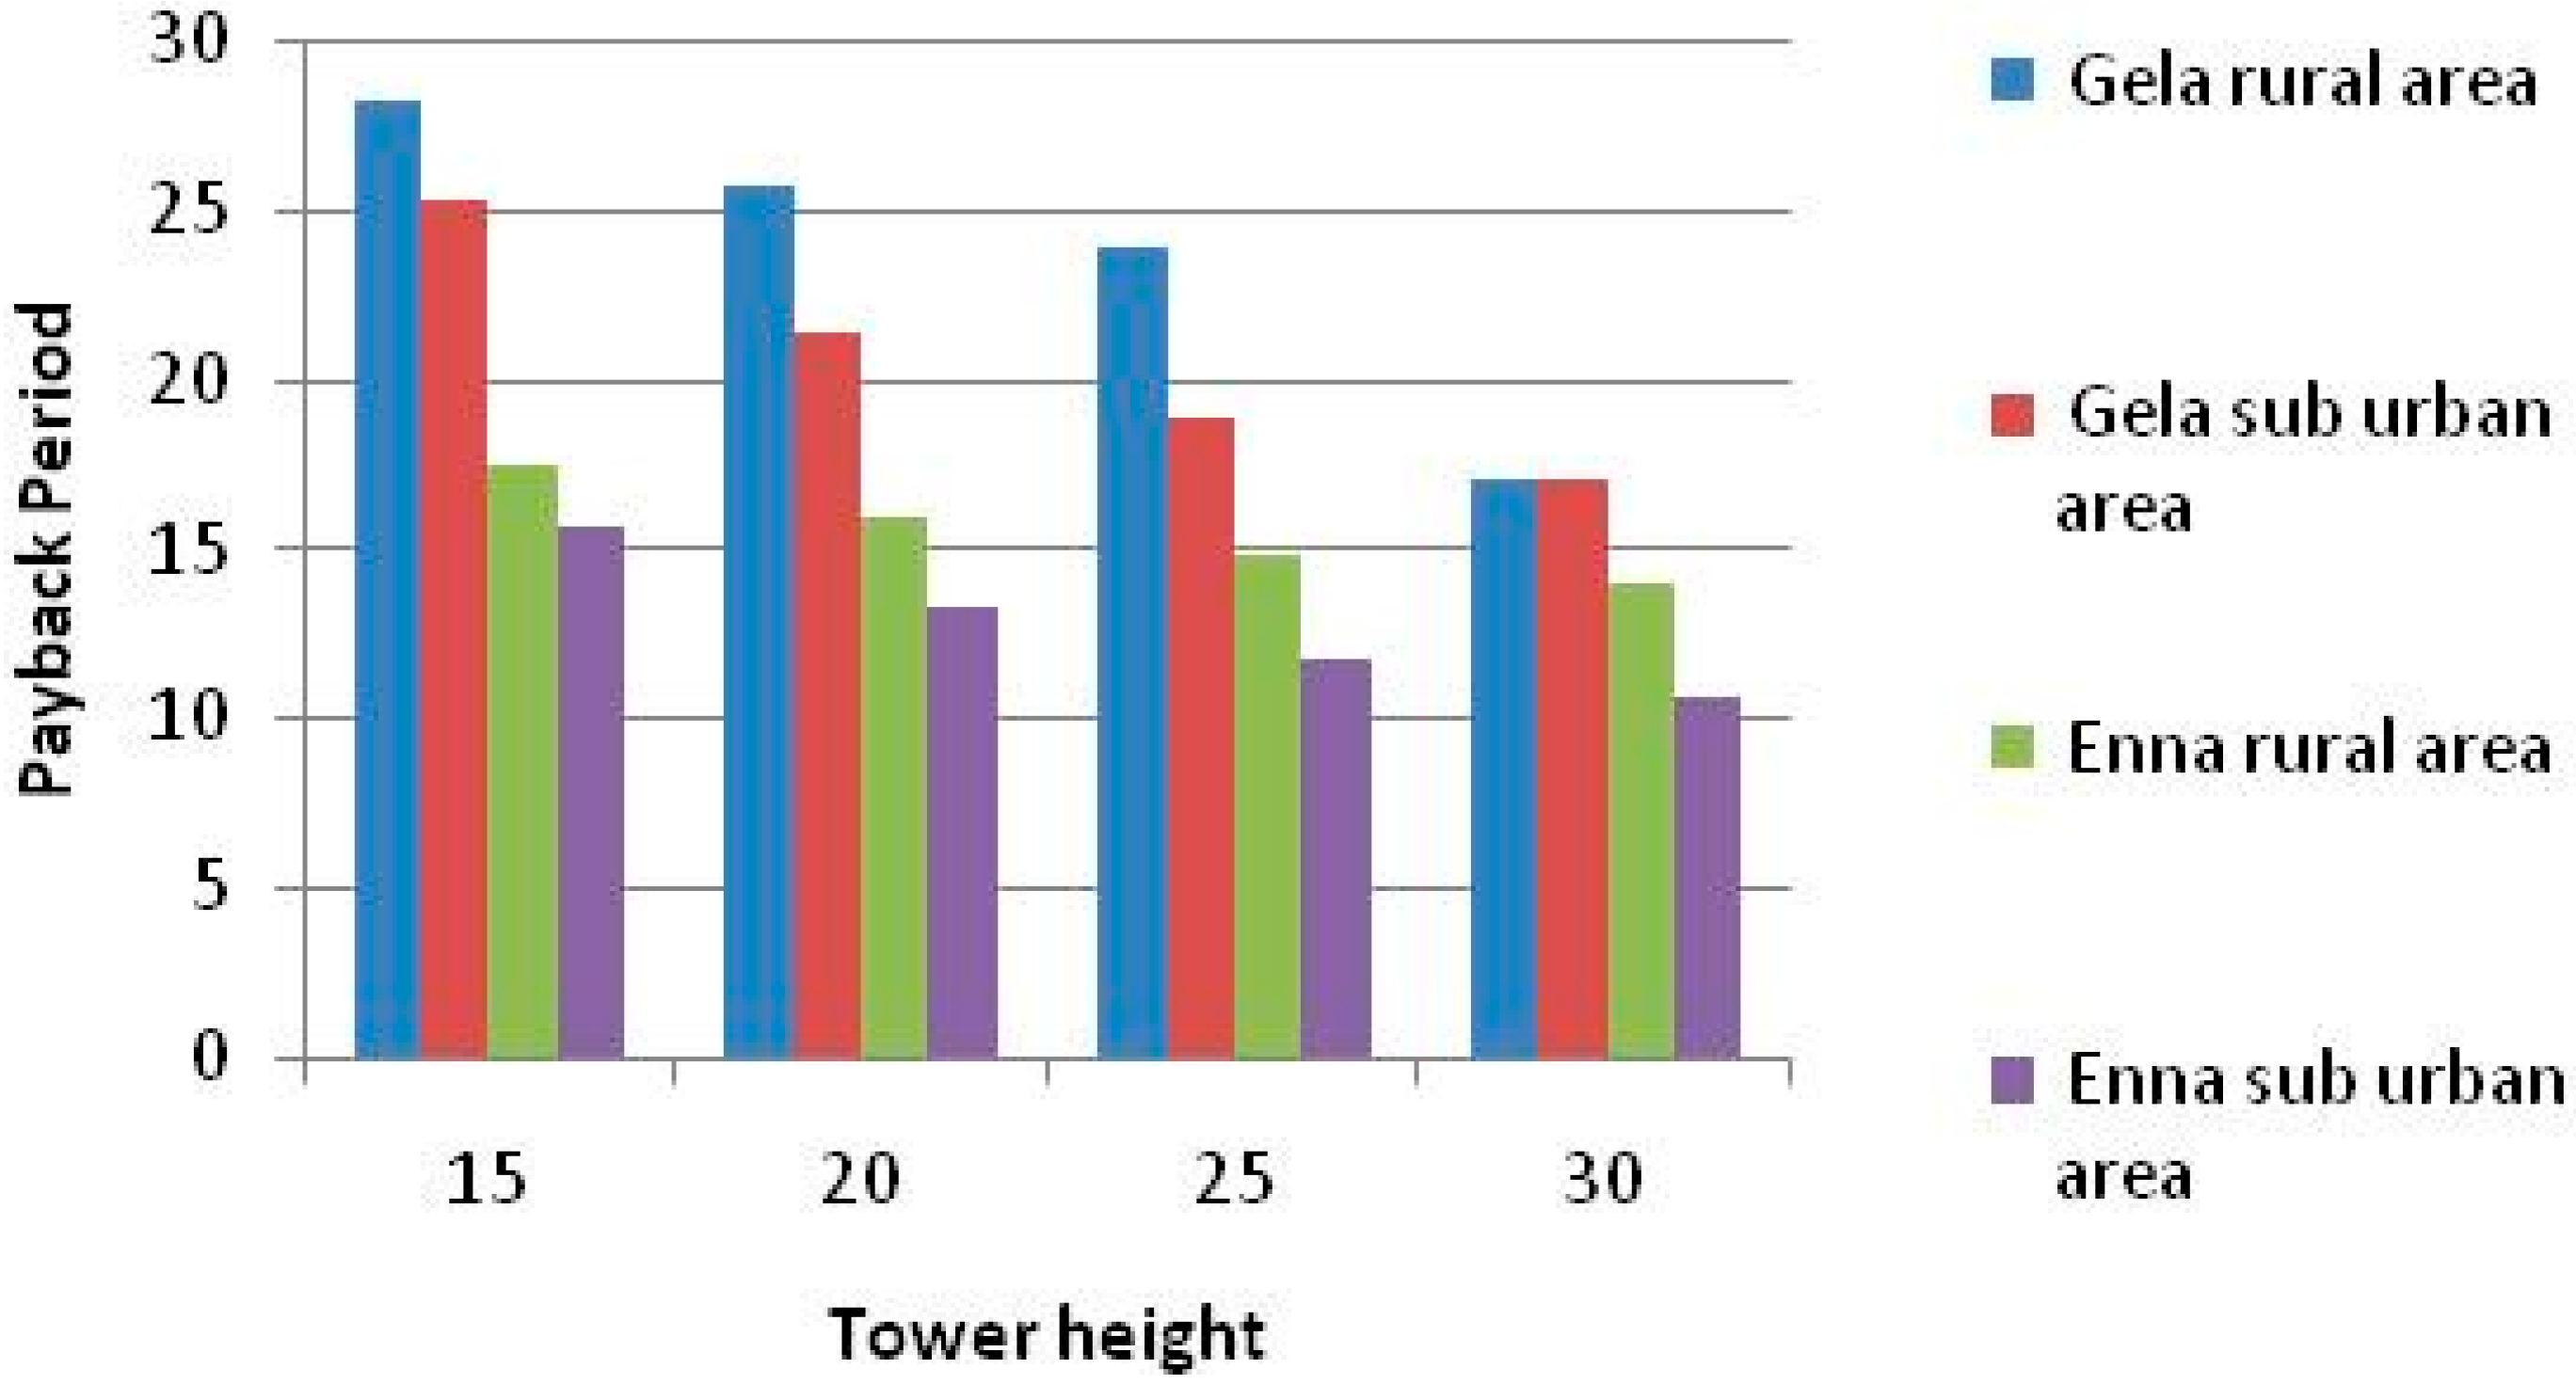
Figure 16.
Payback Period BWC Excel-S.
Figure 16.
Payback Period BWC Excel-S.
Figure 16 (BWC Excel-S) shows an increase in payback period resulting (except for the station of Enna for both terrains) in higher than the maximum period of incentive. In this case after expiry of 15 years, you can continue to sell energy to the grid with the procedures and the prices guaranteed by the simplified purchase and resale arrangements with small producers. Under these arrangements, producers—with plants of a capacity not exceeding 10 MVA or non-schedulable renewable electricity generation plants of any capacity—may sell the electricity injected into the grid to ESM (Energy Services Manager is the publicly-owned company which promotes and supports renewable energy sources in Italy), as an alternative to bilateral (or over-the-counter) contracts or direct trading in the power exchange. The electricity price that ESM pays to these producers is set every hour in the power exchange, in the market zones where their plants are located.


