1. Introduction
The third millennium debuts with profound changes, generated by worldwide crises and also by reform intentions of different international organizations. The collaboration of these organizations is aimed at reviving the economies by transforming the internationalization process into globalization.
Throughout time, the process has undergone many changes, as countries’ economies focus on sustainable development, in which environmental protection and resource regeneration are top priorities. Thus, nations attempt to complete their sustainable development plans with strategies that include the issue of eco-innovation.
In this context, this paper highlights issues surrounding the general study objective of eco-innovation performance evaluation during 2003–2013 and identification of Romania’s place among the major eco-innovation poles set at the 2013 European level. The fulfillment of the pursued goals was aimed at shaping new horizons in eco-innovation development, which lead to the adoption of strategic and management decisions that result in a high share of Romania’s economic growth process and its further integration into the international process of sustainable development.
Romania has always had a favorable framework for eco-innovation, being permanently situated at the merging point of domestic and foreign interests, with influences established between challenges, generated by political and economic global trends; pressure, caused by climate change and resource diminishment processes; opportunities, outlined by the global demand of technologies, environmental products and services; and also by financial resources that can be raised through various European funds.
In addition, the country has the suitable context of designing and developing initiatives for eco-innovation business, considering that (OECD Sustainable Manufacturing Toolkit, 2011) [
1]:
The “green” market is worth trillions of dollars.
Retailers require suppliers to be accountable to “green” consumers.
A “green” reputation leads to financial value.
A small investment in the “green” domain can lead to great savings.
The new workforce generation values sustainability and demands “green” jobs—96% of young people want employers to be environmentally responsible.
This paper represents the results of processing 12 indicators grouped into five thematic areas: eco-innovation inputs, eco-innovation activities, eco-innovation outputs, resource efficiency and socio-economic outcomes for the 27 EU countries, through which aspects of eco-innovation are evaluated and analyzed.
The presented issues outline the reasons underlying the design of the research conducted in this article, which is organized into five sections.
Section 2 covers issues concerning the explanation of the eco-innovation concept by presenting different points of view from specialists in the field and from those concerned about this issue, which were included in the specialty literature.
Next,
Section 3 highlights the methodology and other details regarding the research that will be applied to eco-innovation. This Chapter prepared framework of an index that measures eco-innovation dimensions in 27 countries over the period 2003–2013. The analysis uses 12 individual variables from five thematic areas for the period 2003–2013. The chosen method to explain the variance of the observed data through a few linear combinations of the original data was a specific technique belonging to Multivariate Analysis—the Multiway Principal Components Analysis (MPCA).
The final value given to each country–year observation is rescaled using the percentile rank. Therefore, the ECO-INNOVATION INDEX, as a percentile ranking, indicates how a country–year observation performs compared to the other country–year observations at its position.
The empirical results presented in
Section 4 are highlighted as a consequence of constructing an ECO-INNOVATION INDEX in Romania (
Section 4.1), and also of establishing and evaluating the key eco-innovation poles for the EU Member States in 2013 (
Section 4.2).
The results showed that, in Romania, discussion of performance in terms of eco-innovation cannot be made, as Romania ranks being among the last countries in the EU, established through the composite index of eco-innovation and cluster analysis, determining the poles of eco-innovation from EU countries.
The paper ends, on the one hand, with conclusions, which include a summary of the obtained results, and, on the other hand, with a specification of their present and future impact on the Romanian economy and its sustainable development.
2. The Concept of Eco-Innovation and the Premises of Research Achievement
In a world dominated by climate change, pollution and diminishing natural resources, the key to prosperity is represented by a strong manifestation of sustainability in all areas of activity and in all countries, regardless of development level.
On the background of this framework, the concept of eco-innovation is outlined by innovation itself, which is manifested in close interdependence between technology and the environment, the activities being carried out without exhausting available resources and destroying the environment, thus according to sustainable principles.
In this context, eco-innovation can be considered an aspect of innovation in which the environmental involvement can be observed in shaping the resources, methods, techniques, activities, as well as the results, without compromising the ability to satisfy the needs of future generations.
Eco-innovation is one of the areas of prime interest in EU policies to ensure a sustainable future. In this regard, there are several studies [
2,
3,
4,
5] that identify measures and policies to promote the application and development of environmentally friendly technology.
On the other hand, technological development and application of technologies designed to ensure sustainable development is not only an objective of the EU, but also a global preoccupation [
6,
7,
8].
A clear and complete definition of the eco-innovation concept is very difficult, given the wide range of components and factors that define it, and also their complexity.
The concept of eco-innovation is fairly recent, the first attempts to define it being reported in the book “Eco-Driving Innovation: A Breakthrough for Innovation and Sustainability Courses” by Claude Fussler and Peter James [
9].
A year later, Peter James defines eco-innovation as “new products and processes which provide customer and business value but significantly decrease environmental impacts” [
10].
In 1999, Klemmer states that “Eco-innovations are all measures of relevant actors (firms, politicians, unions, associations, churches, private households) which develop new ideas, behaviours, products and processes, apply or introduce them, and which contribute to a reduction of environmental burden or to ecologically specified sustainability targets” [
11].
Throughout time, the specialty literature has seen many approaches to eco-innovation, in order to shape a more complete and complex notion.
Thus, the concept is seen from multiple points of view, being outlined in close interdependence with the environment (environmental innovation) [
12,
13,
14], as a technological term, using environmental technology (a combination of eco-efficiency, eco-design, and environmental design) [
15,
16], or as a social process [
17].
It is important to note that eco-innovation is a technological term, is usually closely related to eco-efficiency, eco-design and it refers mainly to products and processes that reduce the impact on environment. Although many countries have developed innovative sustainable technologies for industry, these are not always practical, or enforced by policy and legislation. In this context, the decoupling and eco-efficiency issue appears [
18], which “refers to breaking the link between ‘environmental bads’ and ‘economic goods’”.
This phenomenon is based on the idea that the notion that the rate of change of environmental variables are either “coupled”, “weakly decoupled”, or “absolutely decoupled” to economic variables, and assumes
a priori that these variables are causally linked. At the same time, “decoupling is usually conceived as an elasticity focusing on changes in volumes, whereas efficiency is more concerned with the actual values of these ratios” [
19].
Jackson appreciates that “it’s vital to distinguish between ‘relative’ and ‘absolute’ decoupling. Relative decoupling refers to a situation where resource impacts decline relative to the GDP. Impacts may still rise, but they do so more slowly than the GDP. The situation in which resource impacts decline in absolute terms is called ‘absolute decoupling’. Needless to say, this latter situation is essential if economic activity is to remain within ecological limits” [
19].
In some studies, eco-innovation as eco-efficiency has been addressed through the ‘decoupling argument’, the possibility provided by technological innovations to diminish the amount of materials, energy and waste per unit of GDP, while other studies have questioned the eco-efficiency approach to sustainability by highlighting the intrinsic link between economic growth and material consumption [
19].
Franceschini and Pansera [
20] show the interaction between the dynamics of innovations and the evolution of demand as follows: “In the chart innovation can assume essentially three forms: a
non-eco form in which eco-efficiency is not contemplated, on the contrary, it might even decrease; an
eco-efficiency form in which innovation decouples economic growth from the consumption of non-renewable resources through technological progress; finally a
systemic form in which innovation promotes changes in institutions, culture and society in order to create positive feedback between the development of greener technologies and the conservation of non-renewable resources. These three forms of innovation are combined with an
increasing or
decreasing demand. The result is a space composed by six areas, six interpretations of the relationship between innovation and demand that, we could define as
narratives (business as usual, relative decoupling, green growth, limits to growth, absolute decoupling, techno thrift). The area in grey represents the ‘strong sustainability’ zone where natural capital can be preserved in its absolute value by reducing its depletion and/or increasing the efficiency of its exploitation. On the contrary, the white area coincides with the ‘weak sustainability’ zone where human-made capital is considered a legitimate substitute of natural capital”.
This approach was criticized by Hopwood
et al. [
21] and Carrillo-Hermosilla
et al. [
22], who attempted to fill in the shortcomings of eco-efficiency. The contradictory relationship between eco-efficiency and consumption, known as the “rebound effect” is found in the literature [
23]. Study of the “rebound effect” demonstrated that the increase of the efficiency of extraction and utilization of natural resources might lead to an increase in their consumption [
24,
25,
26,
27,
28].
Considering that the size of the “rebound effect” changes mainly in relation to price elasticity, exceeding the value of 100% compared to initial efficiency gains, results in the “Jevons Paradox” [
29].
In economics, the “Jevons paradox” occurs when technological progress increases the efficiency with which a resource is used (reducing the amount necessary for any one use), but the rate of consumption of that resource rises because of increased demand [
30]. This paradox is named by the English economist, William Stanley Jevons, who in 1865 observed that technological improvements that increased the efficiency of coal-use led to increased consumption of coal in a wide range of industries. He argued that, contrary to common intuition, technological progress could not be relied upon to reduce fuel consumption. This paradox occurs when the effect from increased demand predominates, causing resource use to increase [
29], or in other words, the gains in efficiency produced by technological innovation can be minimized or even neutralized by increasing demand [
25,
27,
31].
Rebound effects have been described as behavioral responses to technical improvements [
32], which have determined that the relationship between innovation and consumption constitute the general basis of crossing technology. In this direction, eco-efficiency solutions can reduce psychological commitment to sustainable behaviors [
33,
34,
35].
The conceptual approaches have one thing in common regarding the need for the sustainability process to involve a compulsory limitation of demand or consumption: a demand reduction is not supported by an increase in eco-efficiency; however, consumption models facing the natural limits of the planet and demand/consumption levels inevitably shrink, and eventually collapse [
36]. This scenario can have either pleasant or unpleasant consequences [
20]:
The pleasant case occurs if societies develop a keener attitude towards frugality and the awareness about the ecological limits in which humanity lives.
The unpleasant one occurs when the encounter with the limits happens in societies that encourage consumption.
Jackson “argues compellingly that such‚ decoupling is a myth. A key area of argument, as with so much else in the current world, involves climate change. If we keep growing GNP, Jackson explains, then we fail to cut greenhouse gases deeply. This means we stoke destruction of prosperity beyond the short-term horizons—next quarter’s growth figures’ and all the rest—on which we routinely put such emphasis today” [
19]. The author presents a solution to the problem as a global sustainable economy supported by actions of governments with the aim of developing macro-economic capability, investing in public assets and infrastructures, increasing financial and fiscal prudence, and reforming macro-economic accounting.
In 2002, Andersen states that “Eco-innovation is innovation which is able to attract green rents on the market” [
36], and in 2008, Kemp, R. and Pearson, P. consider that eco-innovation “is the production, assimilation or exploitation of a product, production process, service or management or business method that is new to the organisation (developing or adopting it) and which results, throughout its life cycle, in a reduction of environmental risk, pollution and other negative impacts of resource usage (including energy usage) compared to relevant alternatives [
37]”.
In the same year, OECD defines eco-innovation as “the
creation of new or significantly improved products (goods and services), processes, marketing methods, organisational structures and institutional arrangements which—with or without intent—lead to environmental improvements compared to relevant alternatives” [
38].
Anthony Arundel and René Kemp do not fully adopt this definition because it conflicts with the Oslo Manual definition of innovation, which includes the implementation of a new technology that was first developed by a different firm or institution [
39].
In most developing countries outside the EU and OECD, economic development through eco-innovation is a priority. There are two main reasons for this [
40]:
Developing countries are often most vulnerable to the impacts of environmental problems (for example, India and China use development to access eco-innovations relevant to both adapting to the impacts of climate change and reducing emissions of greenhouse gases to mitigate against future climate change).
Access to technology is a key determining factor of economic development levels (increased access to technology is one of the prerequisites of economic growth, self-reliant development and poverty alleviation).
By accessing eco-innovations, developing nations therefore open up the potential for technological change within existing industries, thus improving their competitive advantage through increased factor productivity and/or the development of new, competitive products and broadening the industrial base of a country via the establishment of new industry sectors with associated employment benefits, profits and public income through taxes [
41,
42]. Access to new technology not only offers the possibility of moving up the value chain, it also provides opportunities to diversify into new products similar to the ones originally imported [
43].
China, like other OECD countries, has focused on eco-innovation policy by including public investment in Research &Development (R&D), mobilizing financing from multiple sources, government procuring environmentally friendly products, adopting prescriptive measures, adopting market-based instruments, awareness raising and capacity building, and acting globally.
The report [
44] drafted by Wanxin Li reflects Chinese national priorities on energy security, energy efficiency, and a more environment-friendly model of development. Accordingly, it is focused on technologies for renewable energy, for energy efficiency and for pollution prevention and control; initiatives taken to promote a circular economy are also highlighted as they illustrate (sometimes non-technological) eco-innovations. Eco-cities projects are particularly emphasized. A short section presents selected information on measures to support the deployment of technologies to abate pollution. The report is not comprehensive: policies to support clean production, climate change mitigation and adaptation, and a low-carbon economy are not systematically covered, although they may support eco-innovation.
The introduction of eco-innovations in developing countries is an important factor in effectively tackling global environmental challenges, for eco-innovation markets and sustainable economic development. Policies need to be improved to better respond to technological and cultural requirements of eco-innovation, at both national and international levels [
45].
Eco-innovations are a key area where developing countries might access new technologies with the support of international policy incentives. However, it must be acknowledged that this is a source of concern for industrialized country firms, which sometimes fear that this will result in them losing their competitive advantage, the centrality of information flows and indigenous innovation capabilities [
23].
An important contribution to the specialty literature is represented by Könnölä et al. [
46], which present and clearly justify in a complex fashion that eco-innovation consists of three key dimensions: design, user, product service and governance. It is stated that “the capacity of eco-innovations to provide new business opportunities and contribute to the transformation towards a sustainable society depends on the interplay of those dimensions (design, user, product service and governance) and the engagement of key stakeholders in the innovation process”. It is also noted that in the interaction between the three dimensions mentioned, the crucial role of eco-innovation is highlighted in:
The design components through the simultaneity between the optimization of process expansion, cost reduction and harmful impacts of the environment.
The design related to system changes through the potential of creating new alternatives for system reshaping and sustainable transaction management.
In the dimension “product service” in the direction of creating a new product, by redesigning a value from product chain and also at the level of building a logistic system, causing significant changes for delivered goods and services.
In the governance through cooperation, partnerships within and between elements of the public, private, academic, and business communities related to eco-innovation.
Eco-innovation can also be seen as a process that includes three essential elements: the product (seen in its entire life cycle, from conception, design and implementation, to use, reuse, and recycling), the company and the relations between product, company, customers and the environment.
Eco-innovation must not be seen only as a strategy to solve serious environmental problems, but also as a competitive source for firms and the emergence of new fields that can identify the determinants of economic development [
47] oriented towards sustainable development.
Bryson and Lombardi [
48] state that “The rise of the importance of sustainability leads to the inclusion of green growth in the agendas of corporate managers. Firms try to integrate non-financial objectives into their decision-making processes, to revisit the concepts of value and profitability that drive their business models, and to reevaluate the equilibrium between the objectives of short-term profitability and long-term sustainability [
48]”.
In this context, a study presented Romania as a country with significant potential in the field of eco-innovation and with a basic role in the sustainable development process, both nationally and internationally.
The eco-innovation process, including all innovation that benefits the environment, can be regarded as a bridge between policymakers at the microeconomic and macroeconomic level with interconnected perspectives on Romania’s sustainable development.
The implementation of some policies and European requirements on the issue of eco-innovation it is related to the studies on the perception and implementation of eco-innovations in Romanian Small and Medium Enterprises (SMEs) [
49,
50,
51,
52].
The European Commission considers eco-innovation the key to Europe’s future competitiveness, stressing that “Eco-innovation refers to all forms of innovation—technological and non-technological—that create opportunities to develop economic activities that have a positive environmental impact through prevent or reduce the impact of these activities, or by optimizing the use of resources. Eco-innovation is closely linked to how we use our natural resources, the way we produce and consume and also to the concepts of “eco-efficiency” and “eco-industry”. It encourages businesses to shift from solutions such as “end-of-pipe” to approaches “closed-loop” who reduce raw material and energy flows by changing products and production methods—creating a competitive advantage for many” enterprises and sectors [
53].
In this context, the practical approach, which includes Eco-innovation Action Plan (EcoAP), the European Commission’s flagship initiative “Resource efficient Europe in terms of resource use”, eco-innovation Observatory,
etc., which outlines the directions of action in the sustainable development plan can be highlighted. [
54,
55,
56].
Arundel and Kemp [
39] mention that “An alternative version developed by the OECD follows the Oslo Manual by dividing eco-innovations into product, process, organizational marketing and institutional innovation [
57]. It also includes how firms introduce eco-innovations, for instance through modifying existing technology or creating entirely new solutions” [
38]. Moreover, they state that the need to measure eco-innovation derives, on the one hand, from the expected environmental benefits, and on the other hand, from the fact that faced with rising costs for producing goods and managing waste products, the competitiveness of firms, countries and even regions is increasingly linked to their ability to “eco-innovate” [
39].
The impact of eco-innovation through the course of sustainable economic activities therefore falls upon:
The economy, through the emergence of new services, products, markets, and business methods, namely by reducing material and energy costs.
The environment, by improving biodiversity and ecosystems, reducing the negative effects of climate change, through sustainable management of natural resources, etc.
Society, by creating new and sustainable jobs, and by raising the quality of life.
Politics, through a fair capacity of resource allocation and by fulfilling the goal of “security of materials”.
It is also important to mention the eco-innovation capacity to stimulate the employment process in shaping a green economy with direct impact on the economic growth, highlighting the formation of significant connections presented below [
39]:
Cost-saving eco-innovations generate wealth that will be spent on goods and services that can have negative environmental impacts, creating second order environmental burdens.
Cost-increasing eco-innovations are likely to contribute more to an absolute decoupling but at the expense of lower economic growth.
Many normal innovations are de facto eco-innovations (by being more environmentally benign than relevant alternatives), but overall environmental gains will be impaired by economic growth produced by those innovations.
To assess the impacts of eco-innovation, one should look at what happens within and across value chains from resource extraction to waste management.
21) Micro-behavior is affected by macro-factors (taxes, regulations, etc.).
Considering that each approach to eco-innovation has certain priority characteristics, it is further stated the existence of an eco-innovation classification developed by OECD in relation to environmental products ((A) pollution management; (B) cleaner technologies and products; and (C) resource management group). In this context, in 2008, OECD prepared and presented a methodology for developing composite indices, which is presented and used in the fulfillment of our purpose. The goal involved the construction of a composite index for assessing the performance of eco-innovation and the identification of the main eco-innovation poles at the European level, using panel analysis over the time (2003–2013) and space (27 EU countries).
If an indicator represents a single variable, a composite index aggregates multiple individual indicators to provide a synthetic measure (a summary statistic) of a complex, multidimensional, and meaningful issue.
The power of the composite index approach is in its ability to portray the results of an integrated analytical framework. While individual indicators can be informative, a well-designed and rigorous composite index has the potential to capture “the bigger picture” and the multidimensionality of complex systems.
Kaufmann and Kraay [
58] assert that indicator aggregation has the potential to reduce the influence of measurement error associated with any individual indicator. On the other hand, others warn that indicator aggregation tends to amplify the influence of measurement error and that the problems referenced above that are associated with individual indicators are propagated in the process of aggregation into a composite index. Notwithstanding, building composite indices implies losing a certain amount of information and produce results that are less transparent. Furthermore, composite indices have been criticized because, in a way, they reintroduce unidimensionality.
Maggino and Zumbo [
59] argue that a potential advantage of developing composite indices is that they can help to overcome problems concerning precision, reliability, accuracy, and validity that are associated with using individual indicators, a variable that is not directly observable through an individual indicator may require integration of multiple indicators, each corresponding to a particular aspect of the variable. Composite indices have the advantage of allowing the ranking of countries (or periods), because they represent the overall development level in one number [
60].
The utility of such an aggregate measure resides in the opportunity to make comparison simultaneously over space and time, illustrating the eco-innovation performance across the EU member states over time. Thus, if we want to know which countries are making more progress toward the overall eco-innovation level and which countries are making less progress, we need to build a composite index.
The issues related to the concept of eco-innovation, from definition to measurement represent the premises for the processing of eco-innovation indicators. They have represented the basis of the research carried out in the article, allowing the construction of the composite index, in order to highlight the performances and to identify the main poles of eco-innovation at the European level, as well as mentioning the rank of Romania.
3. Methodology and Data
The central objective of this paper is to construct a composite index of Romanian eco-innovation performance during the period 2003–2013 and also to highlight main eco-innovation poles at the European level for the year 2013 using principal component analysis (PCA) based on panel data and a clustering technique.
The entirety of this paper has in the spotlight the composite index. The quality of a composite indicator, as well as the soundness of the messages it conveys, depend not only on the methodology used in its construction but also, primarily, on the quality of the framework and the data used (OECD, 2008) [
21].
According to the Handbook of on Constructing Composite Indicators published by OCED in 2008 [
21], the main ten steps that need to be followed in order to build a composite index are: theoretical framework, data selection, imputation of missing data, multivariate analysis, normalization, weighting and aggregation, uncertainty and sensitivity analysis, back to the data, links to other indicators, and visualization of the results.
After the identification of the theoretical framework, it is time to find the equivalent variables and to select data. The range of twelve variables was selected considering their use in the cited literature, analytical soundness, measurability, country coverage, relevance to the phenomenon being measured and relationship to each other.
The study aims to evaluate and to analyze different aspects of eco-innovation by applying 12 indicators grouped into five thematic areas: eco-innovation inputs, eco-innovation activities, eco-innovation outputs, resource efficiency and socio-economic outcomes for 27 EU countries over the period 2003–2013. Croatia was eliminated from the analysis due to the lack of data. Some specific variables were dropped from the analysis due to a large number of missing values.
The variables included in the analysis conducted in this research paper are presented in the following five thematic areas:
- (1)
Eco-innovation inputs
Researchers, % of total employment
R&D personnel, % of total employment
Total intramural R&D expenditure
Total Government budget appropriations or outlays on R&D (GBAORD)
- (2)
Eco-innovation activities
- (3)
- (4)
Resource efficiency outcomes
Greenhouse Gas emissions
Energy productivity
Material productivity
- (5)
A detailed description of the variables used in the analysis is presented in the
Appendix. The main source of data used for all these indicators is Eurostat, Science, Technology and Innovation database, Eco-Innovation Observatory database and Eurostat, National Accounts database (GDP) and Environment database.
Missing data often hinder the development of robust composite indicators. There are three general methods for dealing with missing data: (i) case deletion; (ii) single imputation; or (iii) multiple imputation. In this paper, we have used the multiple imputation technique that considers the missing data as part of the analysis and try to impute values through regression imputation.
When there are many variables to be combined into one posterior indicator, Nardo
et al. [
61] write metaphorically that the researcher must avoid “adding up apples and oranges”. Normalization is required prior to any data aggregation as the indicators in a data set often have different measurement units. From several methods of normalization presented by [
62] and [
37], standardization (or z-scores) converts indicators to a common scale with a mean of zero and standard deviation of one.
This preliminary step is helpful in assessing the suitability of the data set and will provide an understanding of the implications of the methodological choices, e.g., weighting and aggregation, during the construction phase of the composite indicator. To avoid the common criticism, “indicator rich but information poor”, the data were observed through multivariate analysis.
The method used in this study to explain the variance of the observed data through a few linear combinations of the original data was a specific technique belonging to Multivariate Analysis—the Multiway Principal Components Analysis (MPCA).
MPCA represents a generalization of Principal Components Analysis (PCA). PCA is a dimensionality reduction technique.
Even though there are Q variables, much of the data’s variation can often be accounted for by a small number of variables—principal components, or linear relations of the original data that are uncorrelated. The next step is to select the first principal components (factors) that preserve a “high” amount of the cumulative variance of the original data.
PCA is a useful technique for transforming a large number of variables in a data set into a smaller and more coherent set of uncorrelated (orthogonal) factors, the principal components. The principal components account for much of the variance among the set of original variables. Each component is a linear weighted combination of the initial variables. The weights for each principal component are given by the eigenvectors of the correlation matrix or the covariance matrix, if the data were standardized. The variance for each principal component is represented by the eigenvalue of the corresponding eigenvector. The components are ordered so that the first component accounts for the largest possible amount of variation in the original variables. The second component is completely uncorrelated with the first component, and accounts for the maximum variation that is not accounted for by the first. The third accounts for the maximum that the first and the second did not account for, and so on [
63].
An alternative way to investigate the degree of correlation among a set of variables is to use the Cronbach coefficient alpha (c-alpha), which is the most common estimate of internal consistency of items in a model or survey. Coefficient alpha (c-alpha) measures the internal consistency in the set of individual indicators, how well they describe a unidimensional Construct (OECD, 2008).
C-alpha is not a statistical test, but a coefficient of reliability based on the correlation between individual indicators. That is, if the correlation is high, then there is evidence that the individual indicators are measuring the same underlying construct. Nunnally [
64] suggests 0.7 as an acceptable reliability threshold. Yet some authors use 0.75 or 0.80 as a cut-off value, while others are as lenient as 0.6.
PCA was first used to combine socioeconomic indicators into a single index [
65].
When the process involves more than two dimensions (variables observed for some countries in various periods), the PCA method generates the Multiway Principal Components Analysis (MPCA).
As Nomikos and MacGregor [
66] stated, MPCA is equivalent to performing ordinary
PCA on a large two-dimensional matrix constructed by unfolding the three-way data matrix, considering the data to be organized as panel data (Mourao, 2007) [
67].
Hierarchical clustering (HC) is an unsupervised method of clustering that creates a hierarchy of classes (i.e., clusters), frequently used after a PCA or other data mining techniques. The purpose is to find a partition in r classes that maximizes the between-classes inertia or, equivalently, minimizes the within-classes inertia. This clustering criterion based on inertia allows creating classes homogeneous in their composition and heterogeneous between them.
Cluster analysis is another tool used in the development of composite indicators to group information on countries based on their similarity on different individual indicators. Cluster analysis (CLA) is a collection of algorithms to classify objects such as countries, species, and individuals (OECD, 2008) [
37]. The classification aims to reduce the dimensionality of a data set by exploiting the similarities/dissimilarities between cases.
Cluster analysis serves as: (i) a purely statistical method of aggregation of the indicators; (ii) a diagnostic tool for exploring the impact of the methodological choices made during the construction phase of the composite indicator; (iii) a method of disseminating information on the composite indicator without losing that on the dimensions of the individual indicators; and (iv) a method for selecting groups of countries for the imputation of missing data with a view to decreasing the variance of the imputed values (OECD, 2008) [
21,
37].
Frequently, PCA is carried out together with then a clustering algorithm on the object scores on the first few components, called “tandem analysis”. These multivariate analysis techniques are useful for gaining insight into the structure of the data set of the composite.
When used in a benchmarking framework, weights can have a significant effect on the overall composite indicator and the country rankings. Weights may also be chosen to reflect the statistical quality of the data. Higher weights could be assigned to statistically reliable data with broad coverage.
The main problem in the construction of composite indices of development is how to aggregate the information. The aggregation problem concerns two interrelated aspects: the assignment of weights to the components when combining them [
68] and the choice of the synthetic function. Most composite indicators rely on equal weighting (EW), where all variables are given the same weight.
From the all possible aggregation strategies presented in OCED handbook, we have chosen in our study the weights from principal component analysis, using the proportion of recovered variance by each principal component in the total variance recovered as weights on the factor score coefficients to compute a non-standardized index.
Apparently, this approach seems more “objective” because the weights are not assigned by the researcher but rather by a statistical technique and seems less arbitrary and more “scientific”, because they are extracted from the data.
This index measures the eco-innovation status of one year relative to the others on a linear scale. The value of the index can be positive or negative, making it difficult to interpret.
Furthermore, the index is transformed using the percentile rank to take values between 0 and 100. The best performing country for each indicator takes the value 100, and the worst, 0. The percentile rank is classified as a categorical scale normalization method.
The percentile rank of a country-year observation (it) of variable
is:
where
is the cumulative frequency for all scores lower than the country-year score of interest;
is the frequency of the score of interest; and
the number of country–year observations (
) is the product between the number of countries and the number of annual observations).
In this case, the top 1% received a score of 1, the top 2% received a score of 0.99 and so on. This method is very useful in economic and social research because it supplies results that allow a kind of lecture pointing out the effort of convergence among the cases, from the worst (year–case observation) to the best, rewarding the best performing countries and penalizing the worst [
67].
The difference between two countries with respect to an indicator is usually measured on the vertical axis as the difference between values of that indicator at a point in time. There is also a complementary measure of difference, which takes time into account, measuring the difference between two countries for a given indicator on the horizontal axis as time distance between those countries.
Trends in country performance, as revealed through a composite indicator, can be presented through trend diagram. When a composite indicator is available for a set of countries for at least two different time points, changes or growth rates can be depicted. The ECO-INNOVATION INDEX is used to track relative performance of European countries on eco-innovation indicators.
4. Empirical Results
4.1. Constructing an ECO-INNOVATION INDEX for Romania and Other EU Countries
The first objective of this section is to construct a composite index of Romanian eco-innovation performances for the period 2003–2013, as well as for other EU countries using principal component analysis (PCA) based on panel data for 12 specific eco-innovation indicators.
In the process of building a composite index for eco-innovation performances at the European level, the first step is the imputation of missing data. The missing values were treated using multiple imputation based on regression analysis using SPSS 18 [
69].
In order to treat the problem of different measurement units of the individual variables, a normalization technique is required. From several normalization techniques, we choose to standardize the data and thus to avoid potential bias resulting from the inclusion of data with different scales and data ranges. Standardization is generally acknowledged as a necessary step before proceeding to an aggregation process. This is important to avoid giving variables with different measurement units and disproportionate ranges undue importance at the expense of others [
70]. According to Gilthorpe, transformation of constituent variables and removal of skewness, however, are critical when generating a composite index.
In order to identify the eco-innovation dimensions at the European level and then to compute a composite index of eco-innovation, the Multiway PCA combined with the cluster analysis were used in order to highlight the main poles of eco-innovation in the EU member states.
First, the Cronbach Coefficient Alpha was used to assesses how well a set of items measures a single unidimensional object, because estimates the internal consistency of items in a model.
It is important to point out that because the variances of the individual indicators vary widely, we have standardized the individual indicators to a standard deviation of 1 before computing the coefficient alpha.
Table 1.
The empirical results of Cronbach’s Alpha.
Table 1.
The empirical results of Cronbach’s Alpha.
| Cronbach’s Alpha | Cronbach’s Alpha Based on Standardized Items | N of Items |
|---|
| 0.721 | 0.721 | 12 |
The c-alpha is 0.721 for the data set of the 27 countries, which is equal to Nunnally’s cut-off value.
Pairwise correlation tests were applied in an attempt to reduce the initial set of metrics to a smaller subset of non-highly correlated metrics. As none of the twelve metrics were highly correlated, all metrics were retained in the PCA analysis.
Information on quality adjustment is expressed using the variance explained with the help of the eigenvalues (presented in
Table 1) and the matrix of correlations. The table presents the variance explained by the initial solution (components), the extracted components and also the rotated components. Therefore, the analysis of the quality of the cloud of points adjustment (in our case the countries) is performed using the eigenvalues.
The first six principal components from the extracted solution explain nearly 84.22% of the variability in the original twelve variables and they are the only ones with eigenvalues almost 1. One of the most commonly used techniques is Kaiser’s criterion, or the eigenvalue rule. Regarding the entire process, step by step, we notice that adjusting the points’ cloud by a single factorial axis (accepting only the first synthetic indicator), explains 32.88% of total variance; then, adjusting the points’ cloud by the first two factorial axes (accepting two synthetic indicators), we recover an additional 16.05% of the total variance (a total of 49.26% of the initial variance). The last four principal components explain almost the same amount of the remaining variance, about 10% each.
In order to explain the significance of the principal components obtained through our analysis, one has to analyze the correlation coefficients calculated between the three main components (the extracted components) and the original indicators. By applying such a methodology, the process of explaining the principal components becomes relatively simple. As a first step, one has to use a rotation technique in order to obtain components on orthogonal axes. The most common rotation technique used for this purpose is the “Varimax” method.
Loading results from an orthogonal rotation are correlation coefficients of each variable with the factor, so they naturally range from –1 to +1. A negative loading simply means that the results need to be interpreted in the opposite direction from the way it is worded.
The second step involves finding which initial variables are most correlated with each principal component. Afterwards, each of the principal components needs to be renamed so that it can be regarded as a new dimension, a new class that needs to include the significance of all the initial variables. Therefore, each component can be “explained” by the initial variables for which the correlation coefficients have the highest values (the results are presented in
Table 2).
Table 2.
The component Eigenvalues.
Table 2.
The component Eigenvalues.
| Component | Initial Eigenvalues | Extraction Sums of Squared Loadings |
|---|
| Total | % of Variance | Cumulative % | Total | % of Variance | Cumulative % |
|---|
| Dimension | 1 | 3.946 | 32.884 | 32.884 | 3.946 | 32.884 | 32.884 |
| 2 | 1.966 | 16.383 | 49.267 | 1.966 | 16.383 | 49.267 |
| 3 | 1.230 | 10.253 | 59.520 | 1.230 | 10.253 | 59.520 |
| 4 | 1.106 | 9.219 | 68.740 | 1.106 | 9.219 | 68.740 |
| 5 | 0.954 | 7.949 | 76.689 | 0.954 | 7.949 | 76.689 |
| 6 | 0.904 | 7.531 | 84.220 | 0.904 | 7.531 | 84.220 |
| 7 | 0.500 | 4.167 | 88.387 | | | |
| 8 | 0.461 | 3.841 | 92.229 | | | |
| 9 | 0.449 | 3.738 | 95.966 | | | |
| 10 | 0.324 | 2.701 | 98.667 | | | |
| 11 | 0.120 | 1.004 | 99.671 | | | |
| 12 | 0.040 | 0.329 | 100.000 | | | |
Table 2 revealed the Rotated Factor Loadings for eco-innovation variables, a powerful suggestion of the weights that will calibrate each variable in the aggregate index. These results were achieved through the Principal Components Extraction Method with Varimax normalized variation.
Table 3.
The rotated Component Matrix.
Table 3.
The rotated Component Matrix.
| Variable Name | Component |
|---|
| 1 | 2 | 3 | 4 | 5 | 6 |
|---|
| Zscore: Researchers, % of total employment (numerator in full time equivalents) | 0.952 | –0.051 | 0.087 | –0.102 | –0.100 | 0.069 |
| Zscore: R&D personnel, % of total employment (numerator in full time equivalents) | 0.920 | 0.034 | 0.163 | –0.096 | –0.092 | 0.091 |
| Zscore: Total GBAORD (% GDP) | 0.933 | 0.120 | 0.106 | 0.033 | –0.024 | 0.048 |
| Zscore: Total intramural R&D expenditure (%GDP) | 0.800 | 0.284 | –0.112 | 0.167 | 0.141 | 0.004 |
| Zscore: Organizations and sites with EMAS registration (number) | 0.119 | 0.814 | –0.120 | 0.053 | 0.075 | –0.018 |
| Zscore: Ecolabel licenses (number) | 0.021 | 0.758 | 0.302 | –0.173 | –0.122 | 0.116 |
| Zscore: Greenhouse Gas emissions (thousand tons) | 0.095 | 0.810 | –0.223 | 0.074 | –0.019 | –0.030 |
| Zscore: Total environmental taxes (%GDP) | 0.130 | –0.152 | 0.888 | 0.172 | 0.057 | –0.031 |
| Zscore: Energy productivity (GDP/Gross inland energy consumption) | 0.429 | 0.413 | 0.436 | –0.373 | 0.084 | 0.139 |
| Zscore: Material productivity (GDP/Domestic material consumption) | 0.125 | 0.030 | –0.008 | –0.024 | 0.022 | 0.986 |
| Zscore: Exports of products from eco-industries (% of total exports) | –0.063 | –0.021 | 0.060 | –0.070 | 0.977 | 0.022 |
| Zscore: Turnover in eco-industries (% of total GDP) | 0.003 | 0.019 | 0.134 | 0.941 | –0.064 | –0.014 |
The factors are interpreted using the data from rotated component matrix presented in
Table 3. The first factor has high positive coefficients (loadings) with researchers, % of total employment (0.952); Total Government budget appropriations or outlays on R&D (GBAORD) (0.933); and R&D personnel, % of total employment (0.92), indicating the factor 1 may be due to eco-innovation inputs.
Factor 2 is mainly dominated by eco-innovation activities: number of organizations and sites with EMAS registration (0.814). The third factor can be explained in terms of total environmental taxes, as eco-innovation output.
Factors 4 and 5 can be interpreted in terms of turnover in eco-industries and exports of products from eco-industries as indicators of socio-economic outcomes. The last factor is mainly subject to material productivity, as resource efficiency outcomes.
In order to evaluate the quality of the results derived from the PCA, the KMO and Bartlett’s test of sphericity were applied. The Kaiser–Meyer–Olkin (KMO) measures the sampling adequacy, which should be greater than 0.5 for a satisfactory factor analysis to proceed.
The KMO measure of sampling adequacy is a statistic for comparing the magnitudes of the observed correlation coefficients to the magnitudes of the partial correlation coefficients. The concept is that the partial correlations should not be very large if distinct factors are expected to emerge from factor analysis. A KMO statistic is computed for each individual indicator, and their sum is the KMO overall statistic. KMO varies from 0 to 1.0. An overall KMO should be 0.60 or higher to proceed with factor analysis (Kaiser and Rice, 1974), though realistically it should exceed 0.80 if the results of the principal components analysis are to be reliable. If not, it is advisable to drop the individual indicators with the lowest individual KMO statistic values, until overall KMO rises above 0.60.
The Bartlett’s test of sphericity is used to test the null hypothesis that the individual indicators in a correlation matrix are uncorrelated,
i.e., that the correlation matrix is an identity matrix. The statistic is based on a chi-squared transformation of the determinant of the correlation matrix. However, as Bartlett’s test is highly sensitive to sample size [
71], Tabachnick and Fidell suggest implementing it with the KMO measure [
72].
Looking at the related table (available under request), the KMO measure is 0.749. From the same table, we can see that the Bartlett’s test of sphericity is significant. That is, its associated probability is less than 0.05 (Approximate Chi-Square = 1902.83) (
Table 4). This means that the correlation matrix is not an identity matrix.
Table 4.
The empirical results.
Table 4.
The empirical results.
| Kaiser-Meyer-Olkin Measure of Sampling Adequacy | Bartlett’s Test of Sphericity |
|---|
| Approx. Chi-Square | df | Sig. |
|---|
| 0.749 | 1902.835 | 66 | 0.000 |
In the last step of the production of the ECO-INNOVATION INDEX, it is time to deal with the construction of the weights from the matrix of factor loadings after rotation, given that the squares of factor loadings represent the proportion of the total unit variance of the indicator, which is explained by the factor [
73]. The approach used is that each normalized variable with a significant factor loading (the six principal components) will have a weight equal to its proportion of the variance explained by all the factors.
A non-standardized ECO-INNOVATION INDEX is:
The final value given to each country–year observation is rescaled using the percentile rank, but considering all weighted values. Therefore, the ECO-INNOVATION INDEX as a percentile ranking indicates how a country–year observation performs compared to other country–year observations at its position. The ECO-INNOVATION INDEX ranges from a low of 0 (lowest level of eco-innovation) to a high of 100 (highest level of eco-innovation). A 50 ranking is an average performance.
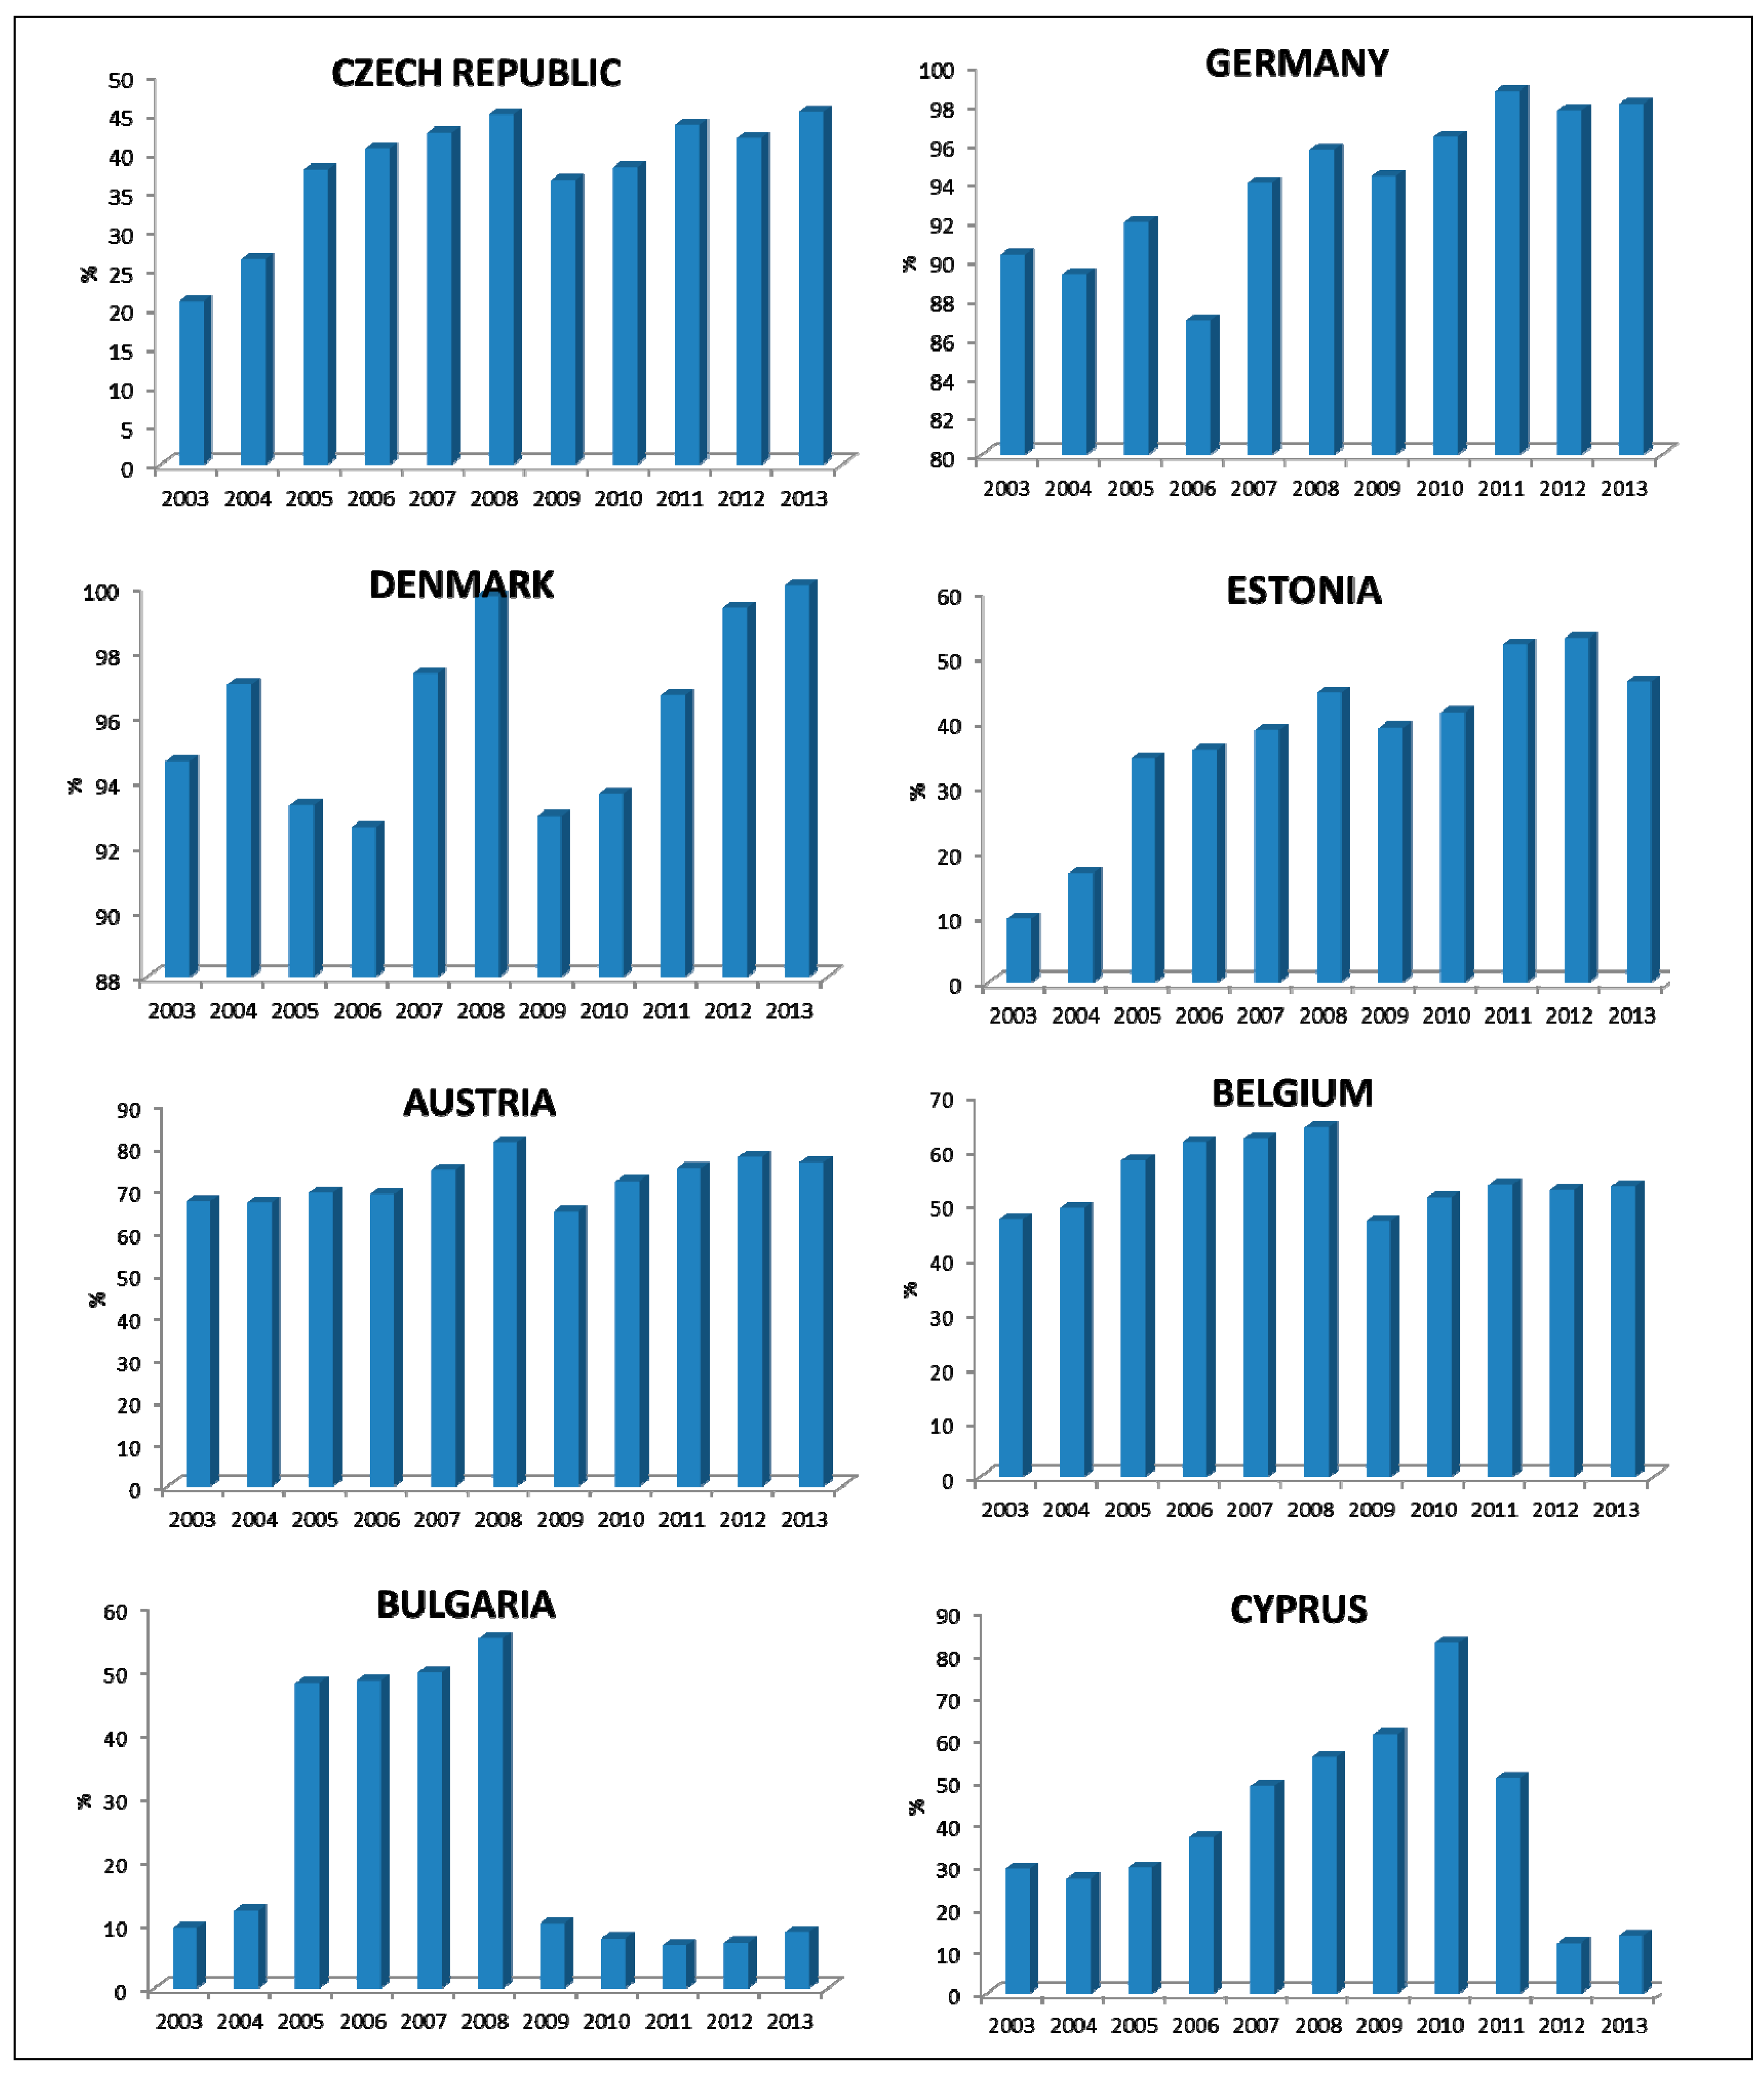
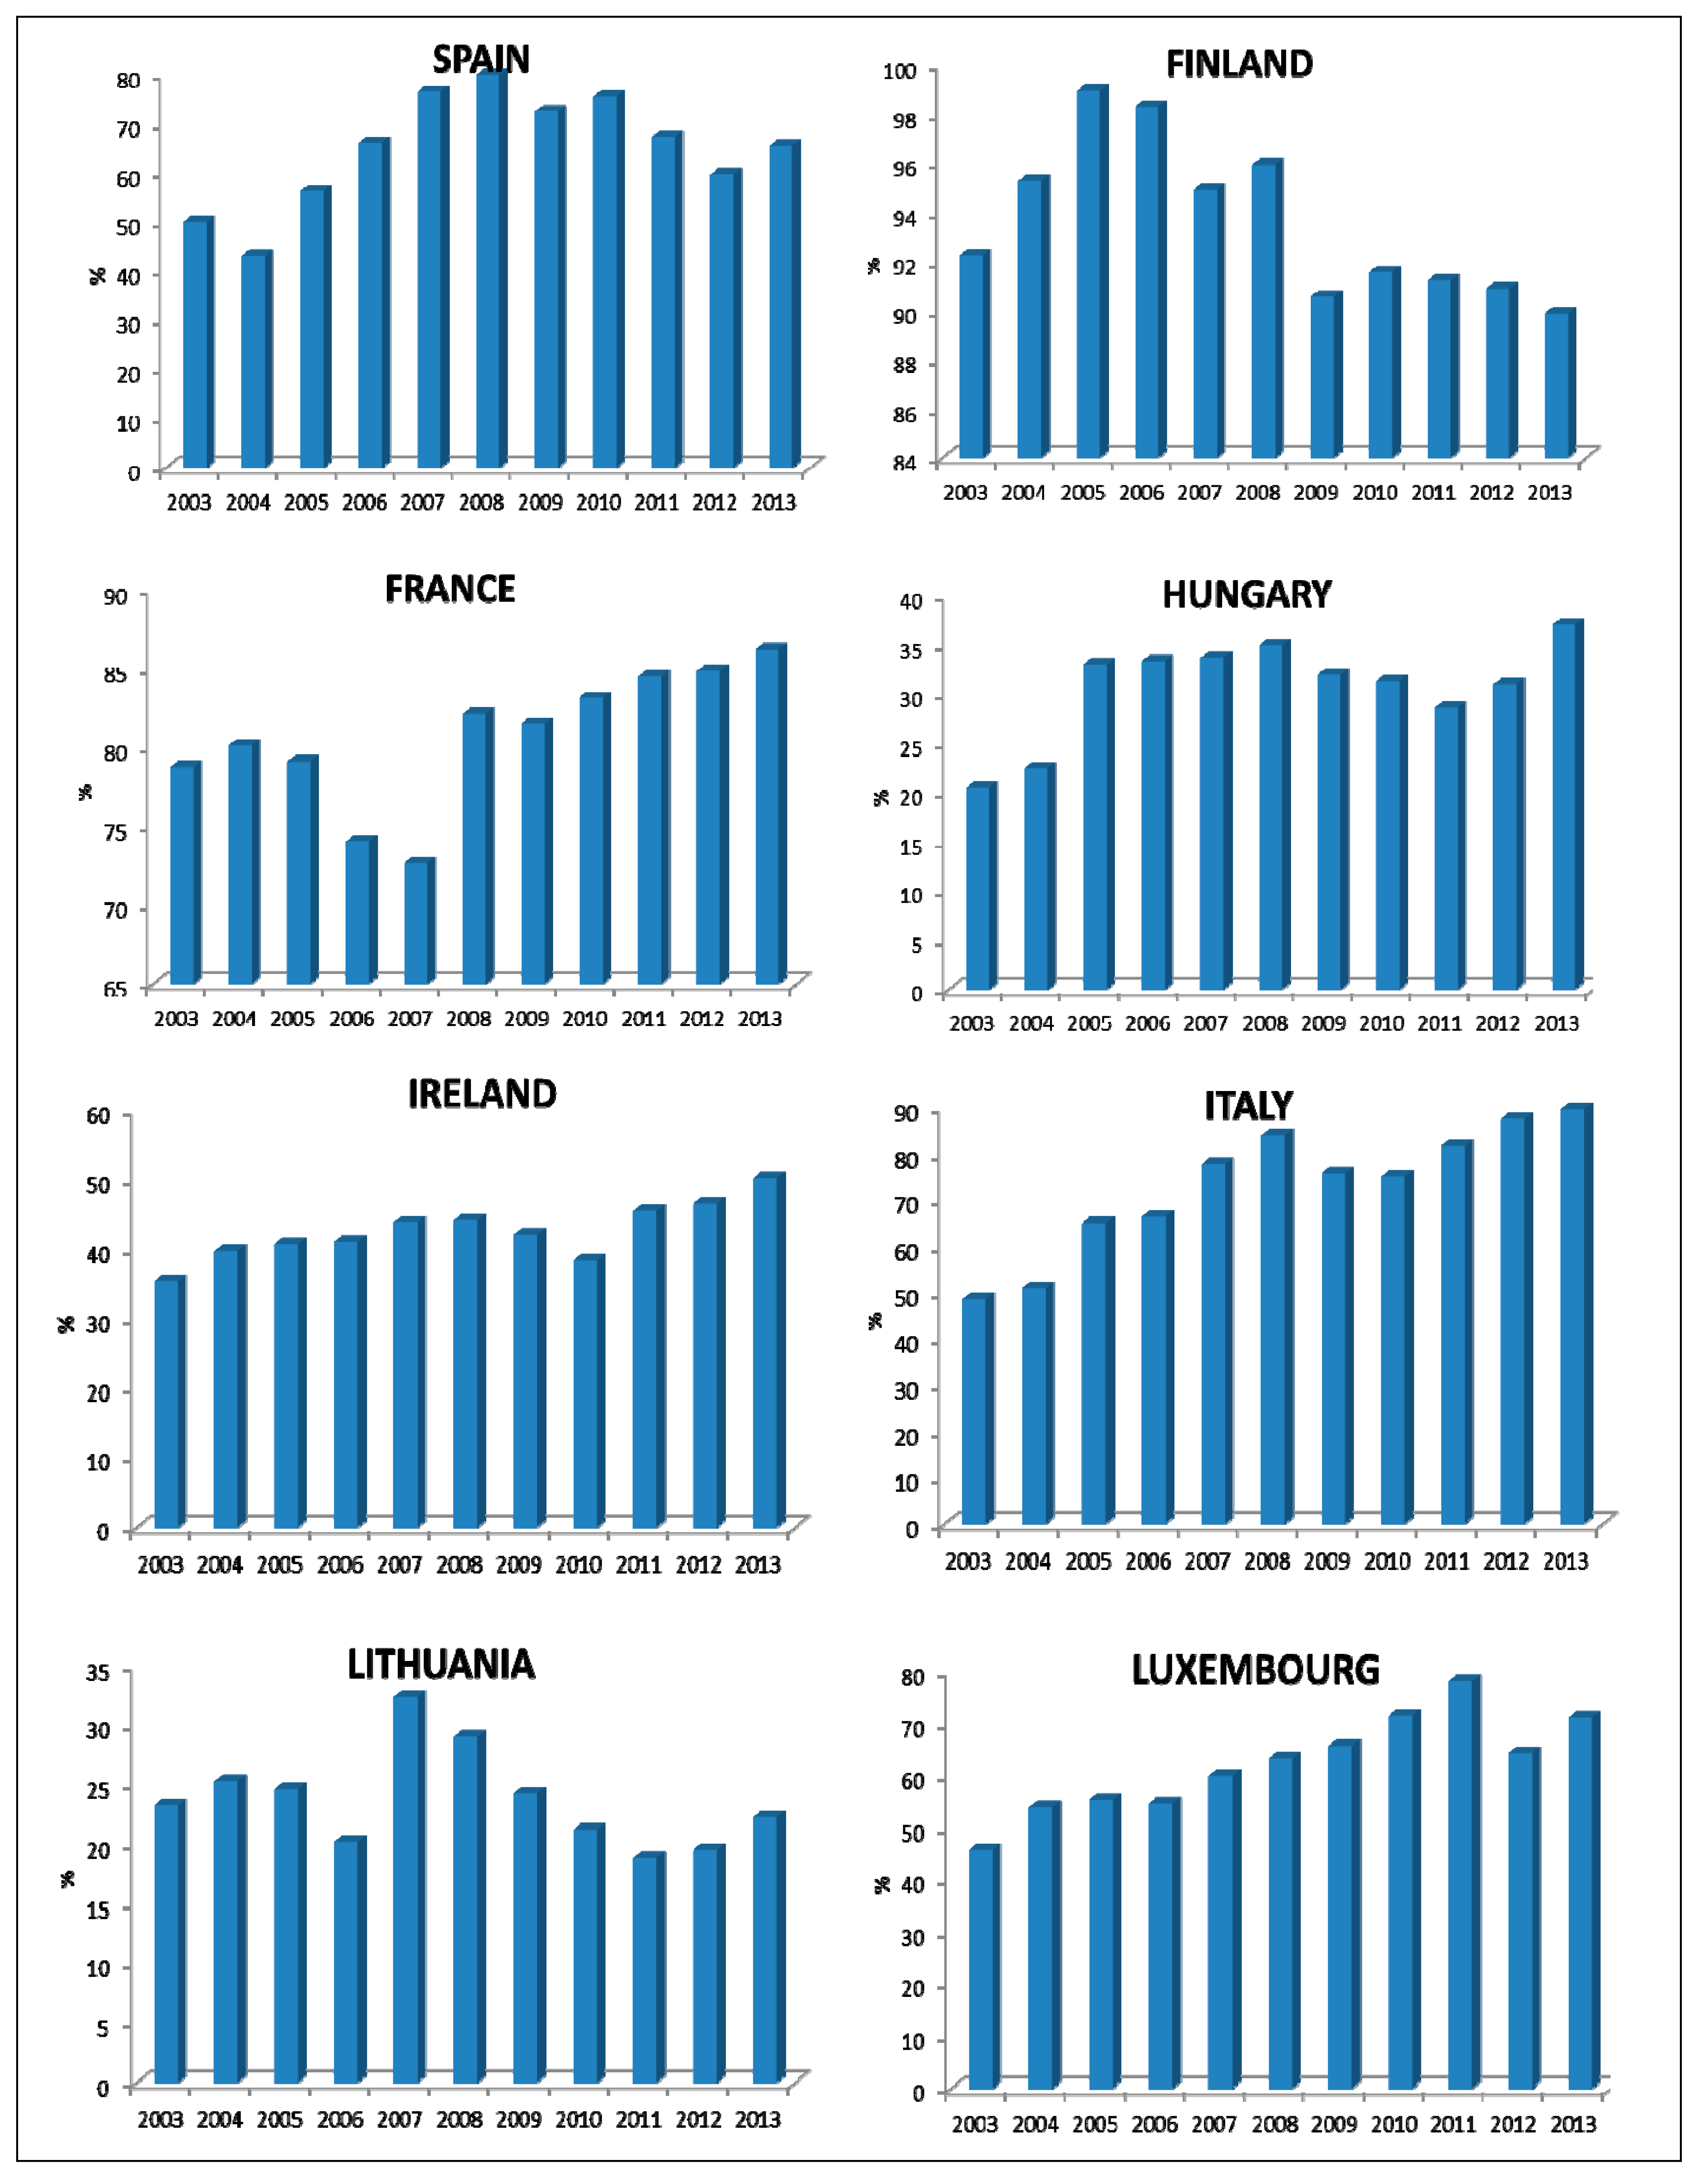
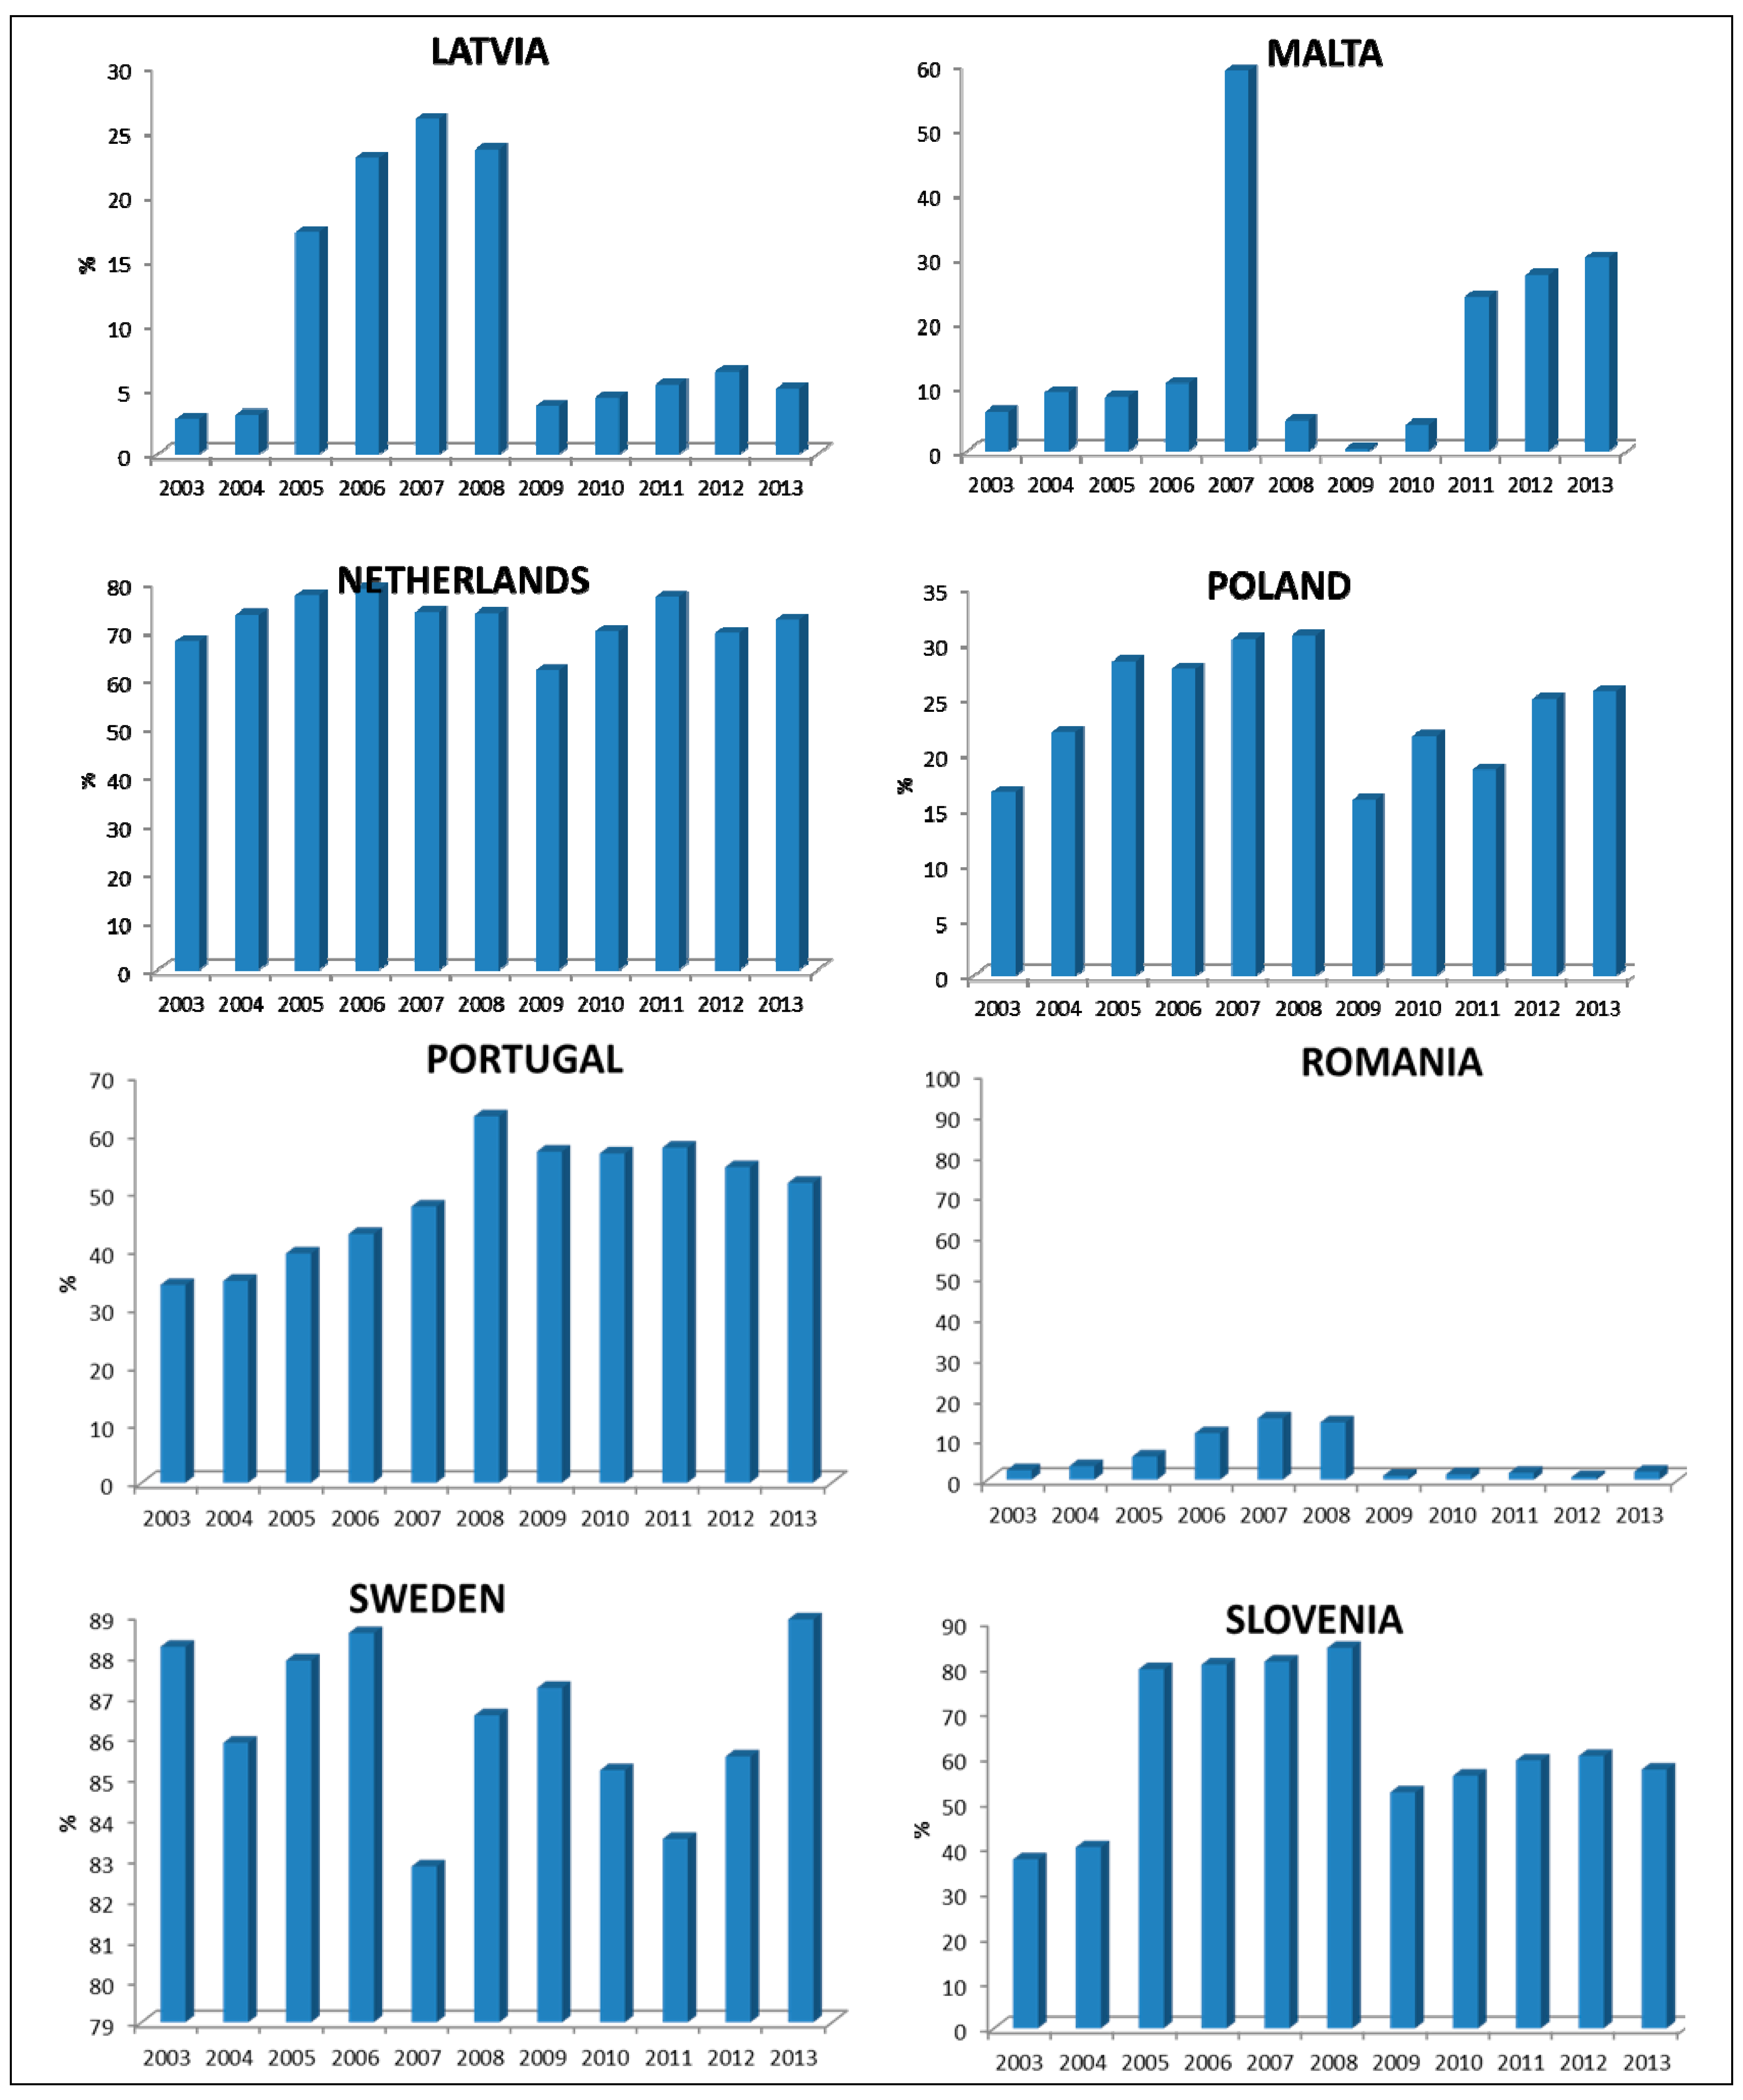
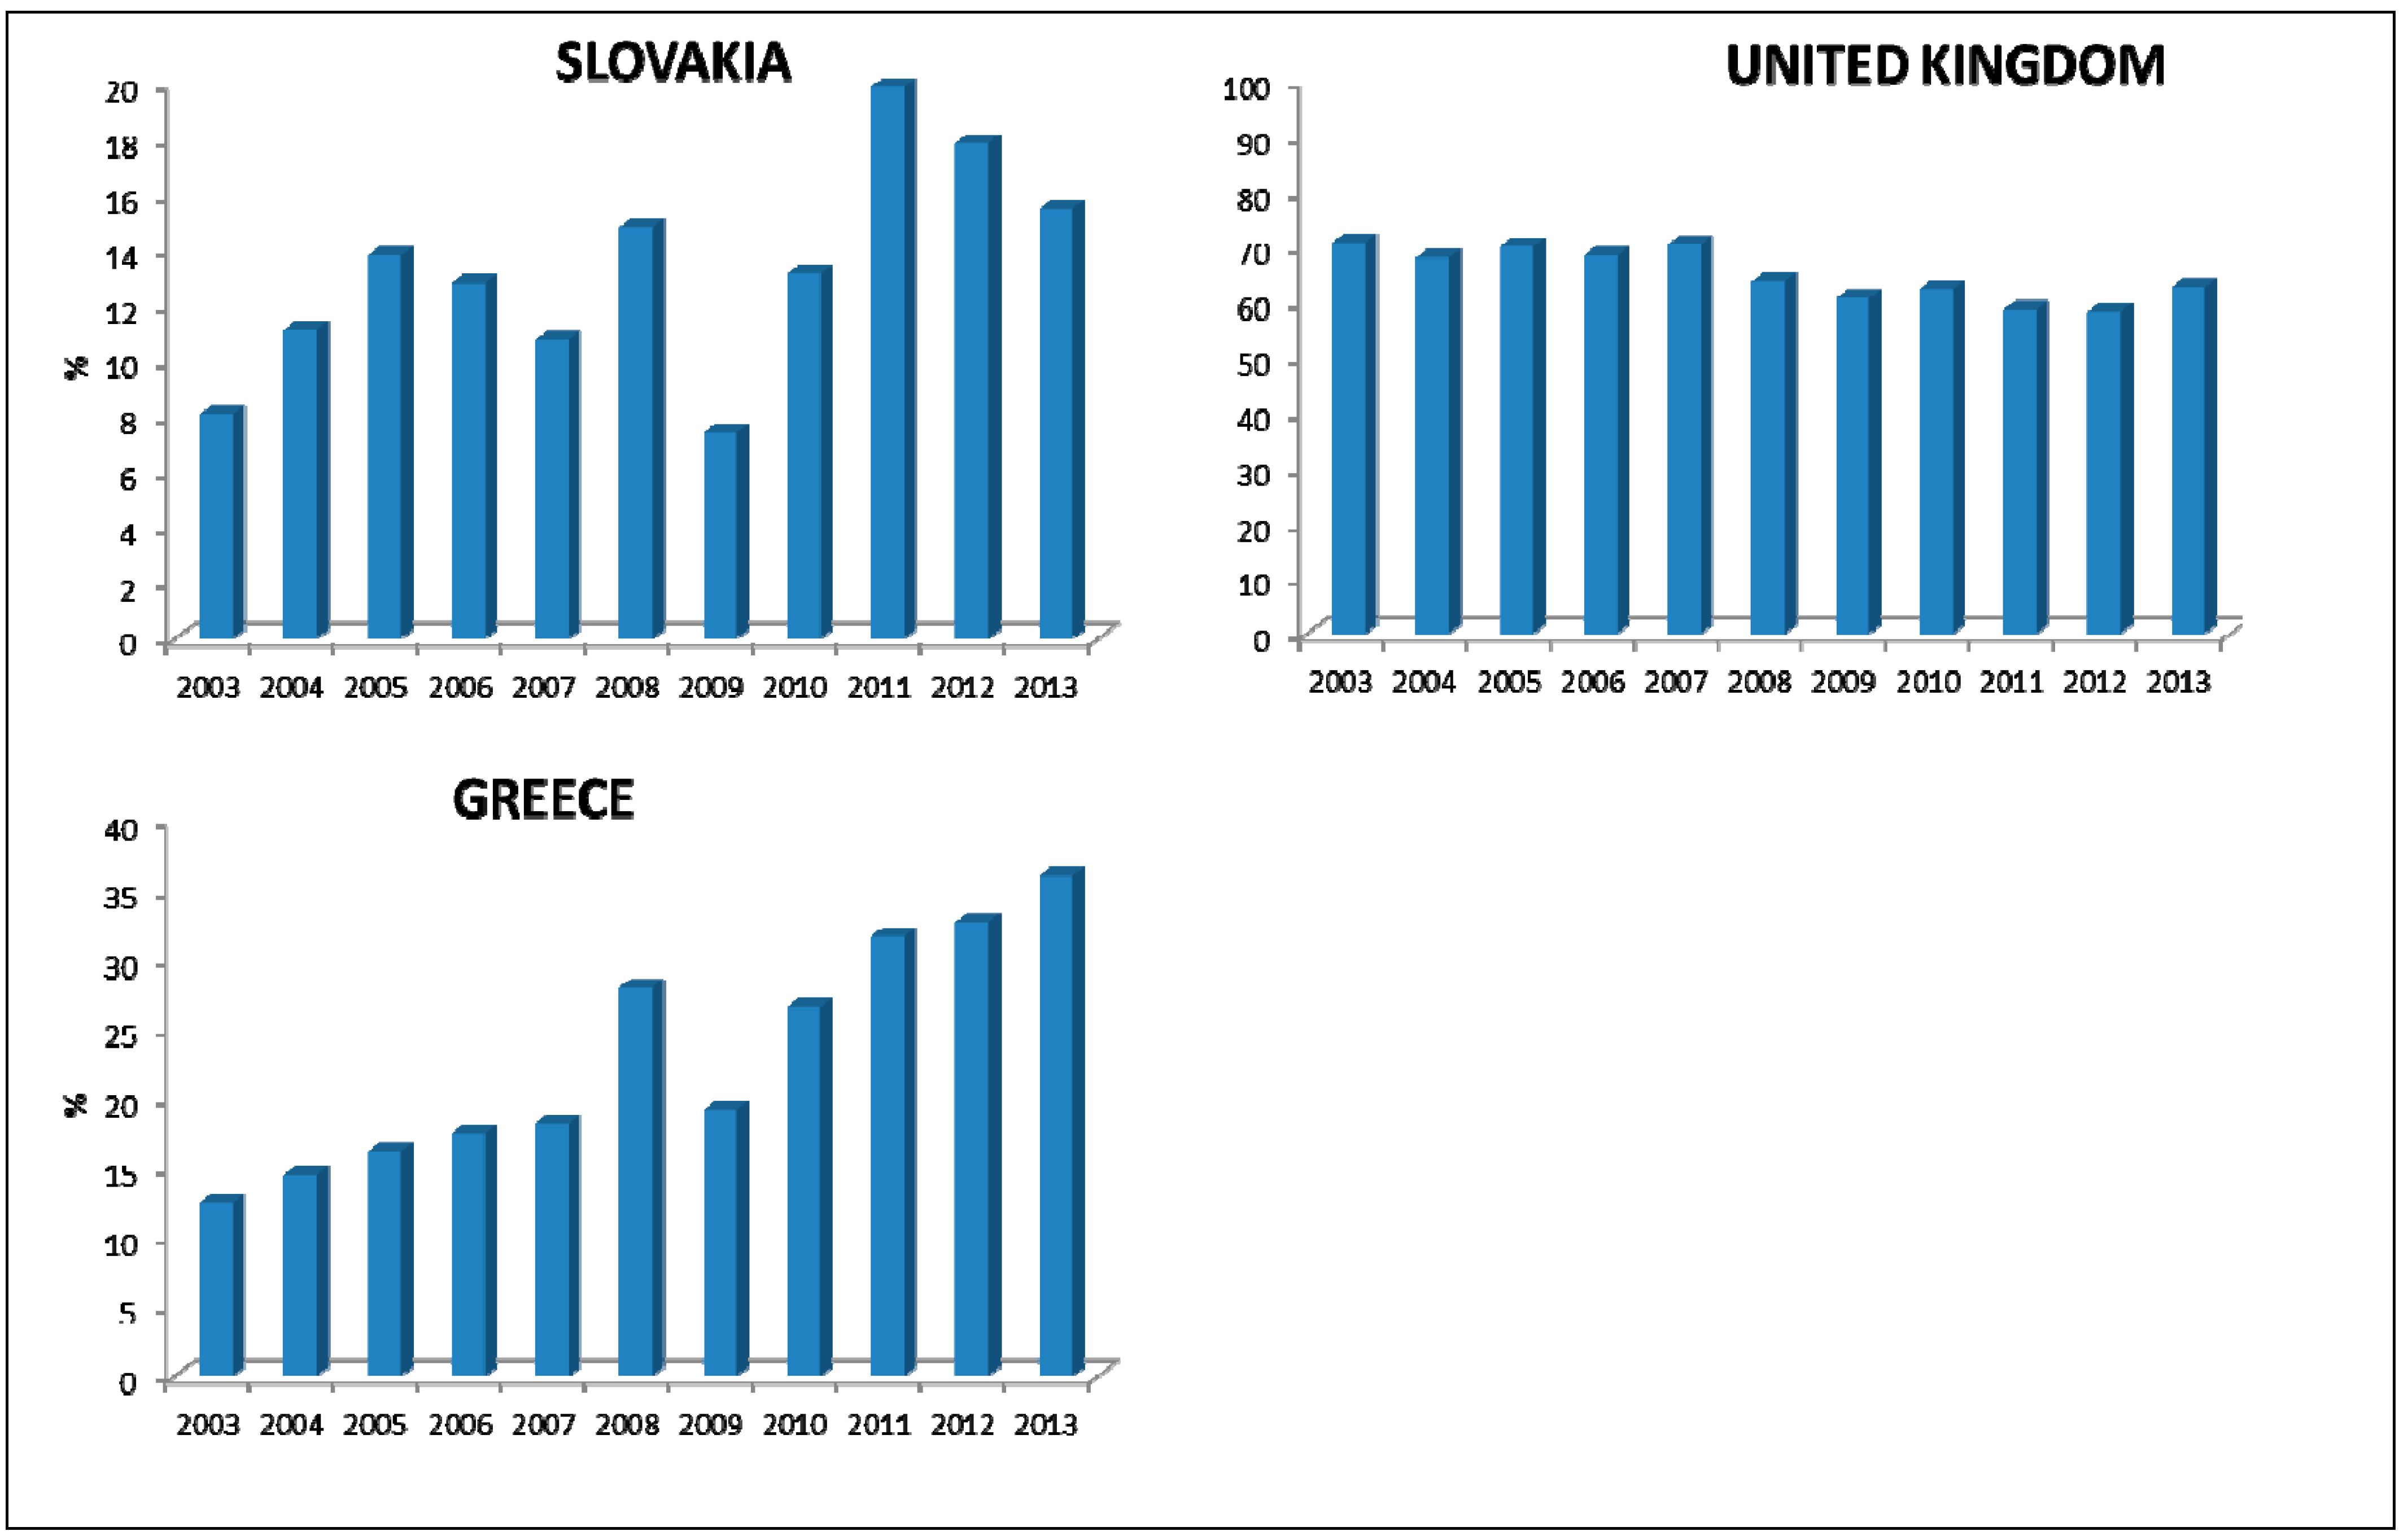
Figure 1 shows the values of the ECO-INNOVATION INDEX for each one of the studied countries over the period 2003–2013. Analyzing the pattern over time, we can conclude that there are several types of countries:
- (1)
Countries with a very high value of the index during the whole period are the benchmark countries (Germany, Denmark, Sweden, Finland, Netherlands and France).
- (2)
Countries with improvements over the time in the field of eco-innovation (Czech Republic, Estonia, Spain, Italy, Luxembourg, Portugal and Greece).
- (3)
Countries with low performances in the field of eco-innovation (Bulgaria, Hungary, Lithuania, Latvia, Romania and Slovakia).
Figure 1.
The ECO-INNOVATION INDEX during the period 2003–2013 in the 25 EU countries.
Figure 1.
The ECO-INNOVATION INDEX during the period 2003–2013 in the 25 EU countries.
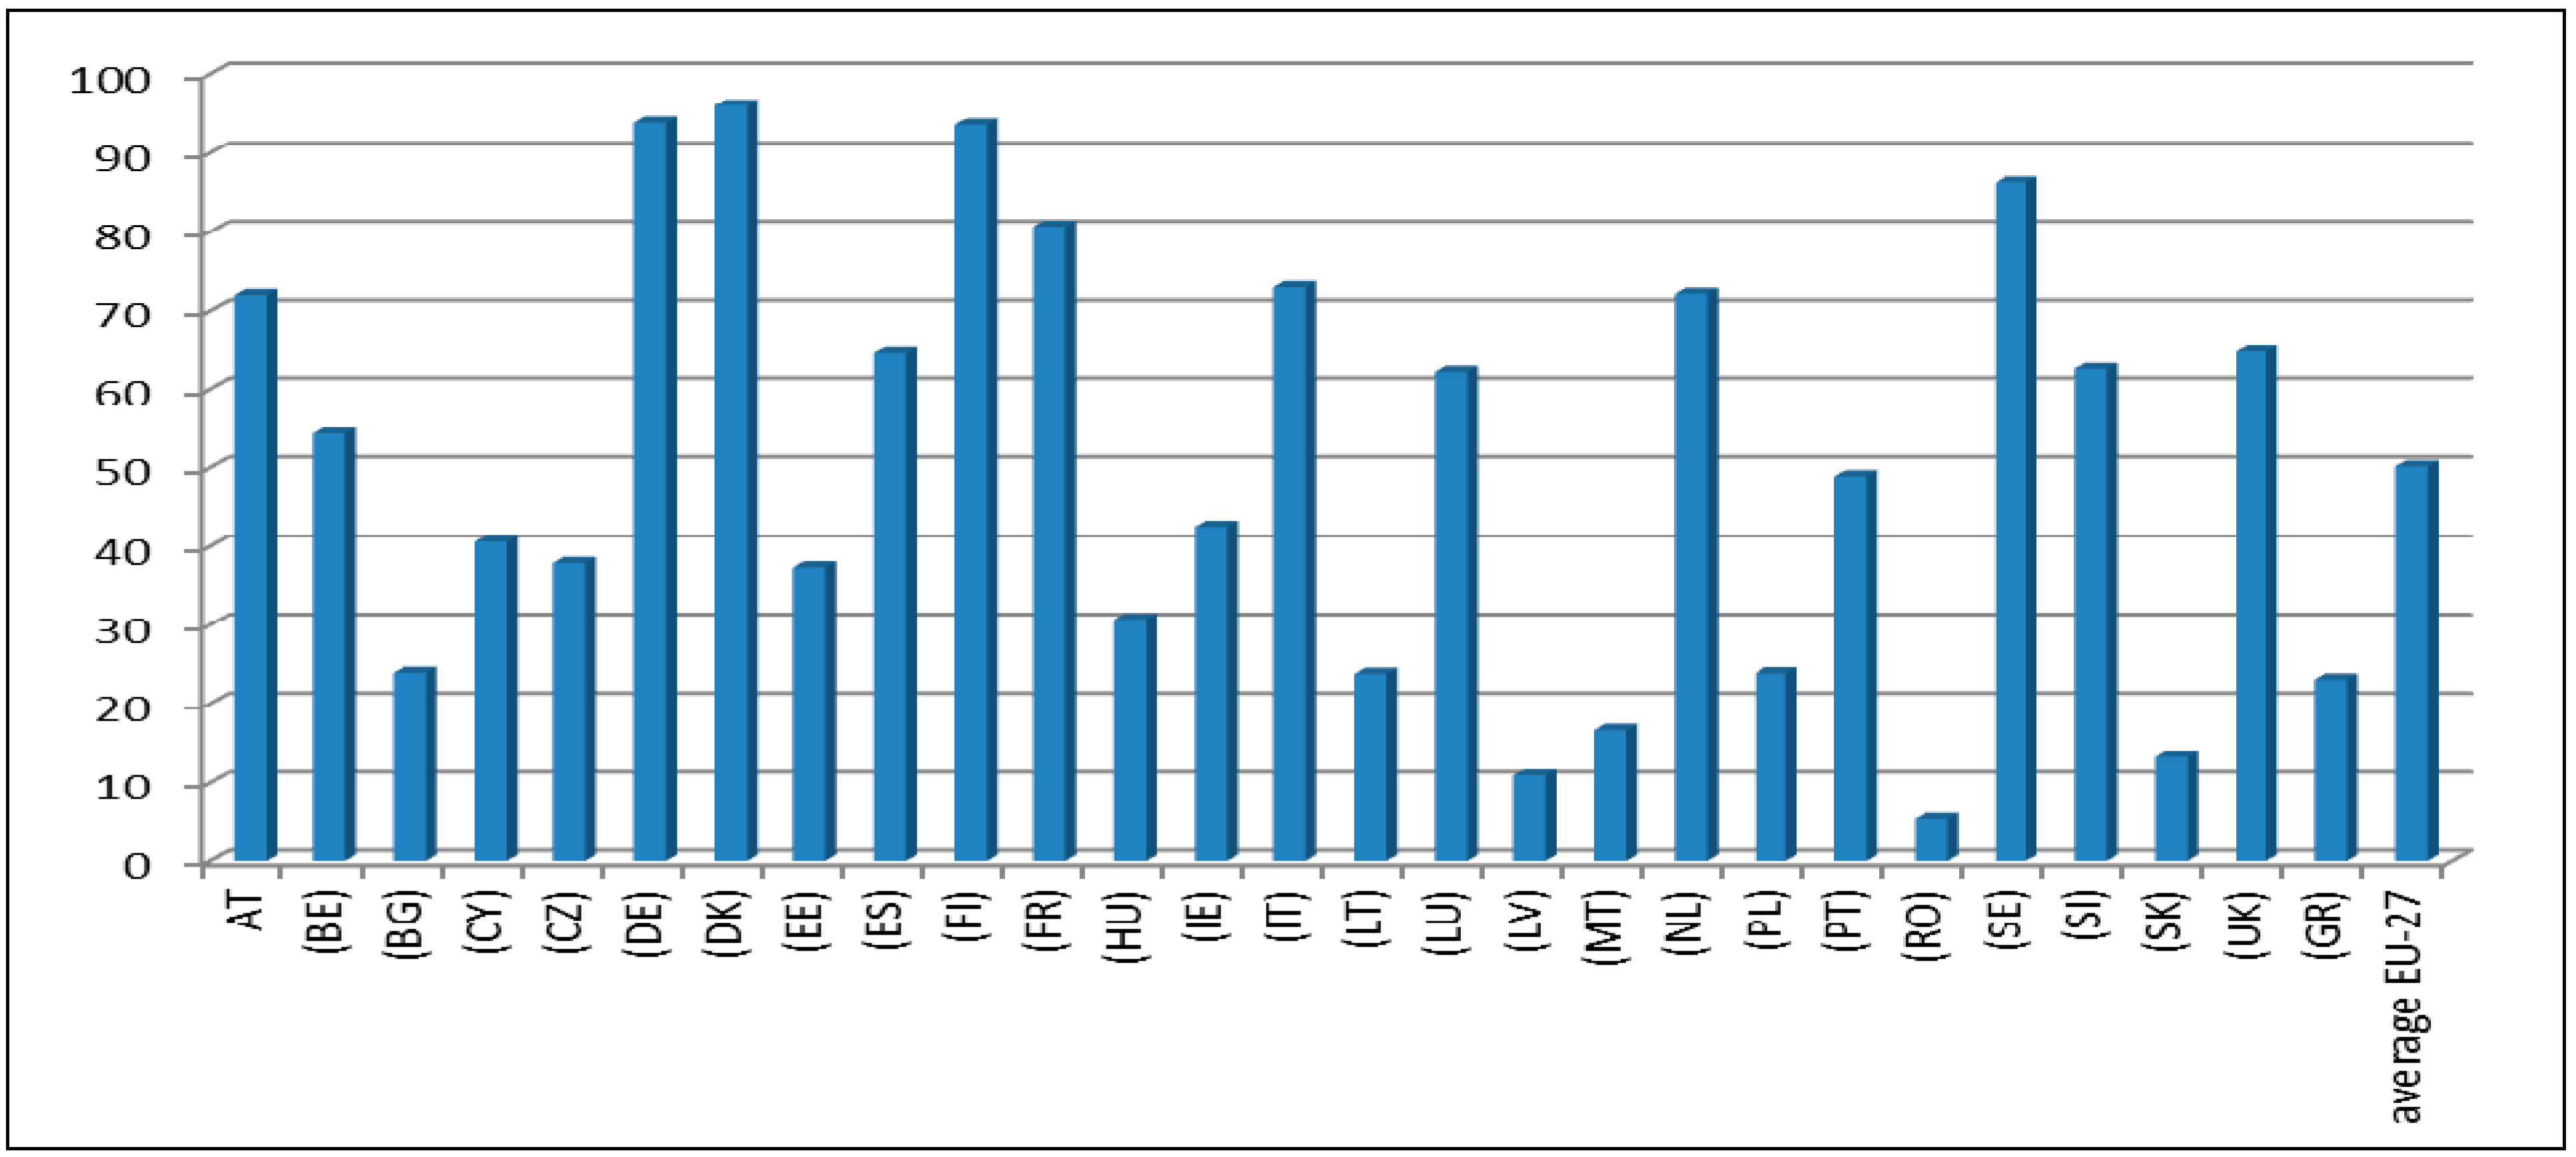
Analyzing the values of mean scores of ECO-INNOVATION INDEX for the period 2003–2013, we can conclude that the countries with the highest average values are Denmark, Germany, Finland, Sweden and France. Conversely, Romania, Latvia and Slovakia are the countries with the lowest average values (
Figure 2).
Figure 2.
The mean score of ECO-INNOVATION INDEX in the EU-27 countries.
Figure 2.
The mean score of ECO-INNOVATION INDEX in the EU-27 countries.
It is very important to point out that there are several differences between our index of eco-innovation and the ECO-INNOVATION INDEX proposed by eco-innovation observatory. The index of eco-innovation covers only the period 2010–2013 and it is not constructed using panel data, while our index is computed for the period 2003–2013.
In order to compute our index, we used 27 EU countries and 12 individual indicators for five thematic areas.
In the normalization process, we have used standardization, unlike the Observatory who used the “Distance-to-reference” method, with the EU average being defined as the reference and set as a value of 100.
We have used multiple imputation for missing data, while the Observatory do not replaced the missing data by estimations; countries for which data is not available do not get a result for the respective indicator.
According to ECO-INNOVATION OBSERVATORY, the score of the index in each of the five areas is calculated by the unweighted mean of the underlying indicators. Consequently, each indicator has the same weighting in the five areas. The overall scoreboard of an EU Member State is calculated by the unweighted mean of the 16 sub-indicators. In the process of building our index, we have decided to use the weights obtained from principal component analysis, because this approach appears to be more “objective” as the researcher does not assign the weights but rather the weights are extracted from the data using a statistical technique, which seems less arbitrary and more “scientific”.
4.2. Evaluating the Main Eco-Innovation Poles for EU Member States in 2013
The second objective of this section is to identify important synthetic indicators of eco-innovation at the level of EU member states using principal component analysis technique and to highlight the main poles of eco-innovation performance using aggregate data at the level of the year 2013.
It is very important to highlight that our essential contribution is reflected by the opportunity to take simultaneously into consideration the evolution in time of eco-innovation performances for several EU countries. Thus, in such a manner, the eco-innovation phenomenon can be seen at the European level over the time 2003–2013.
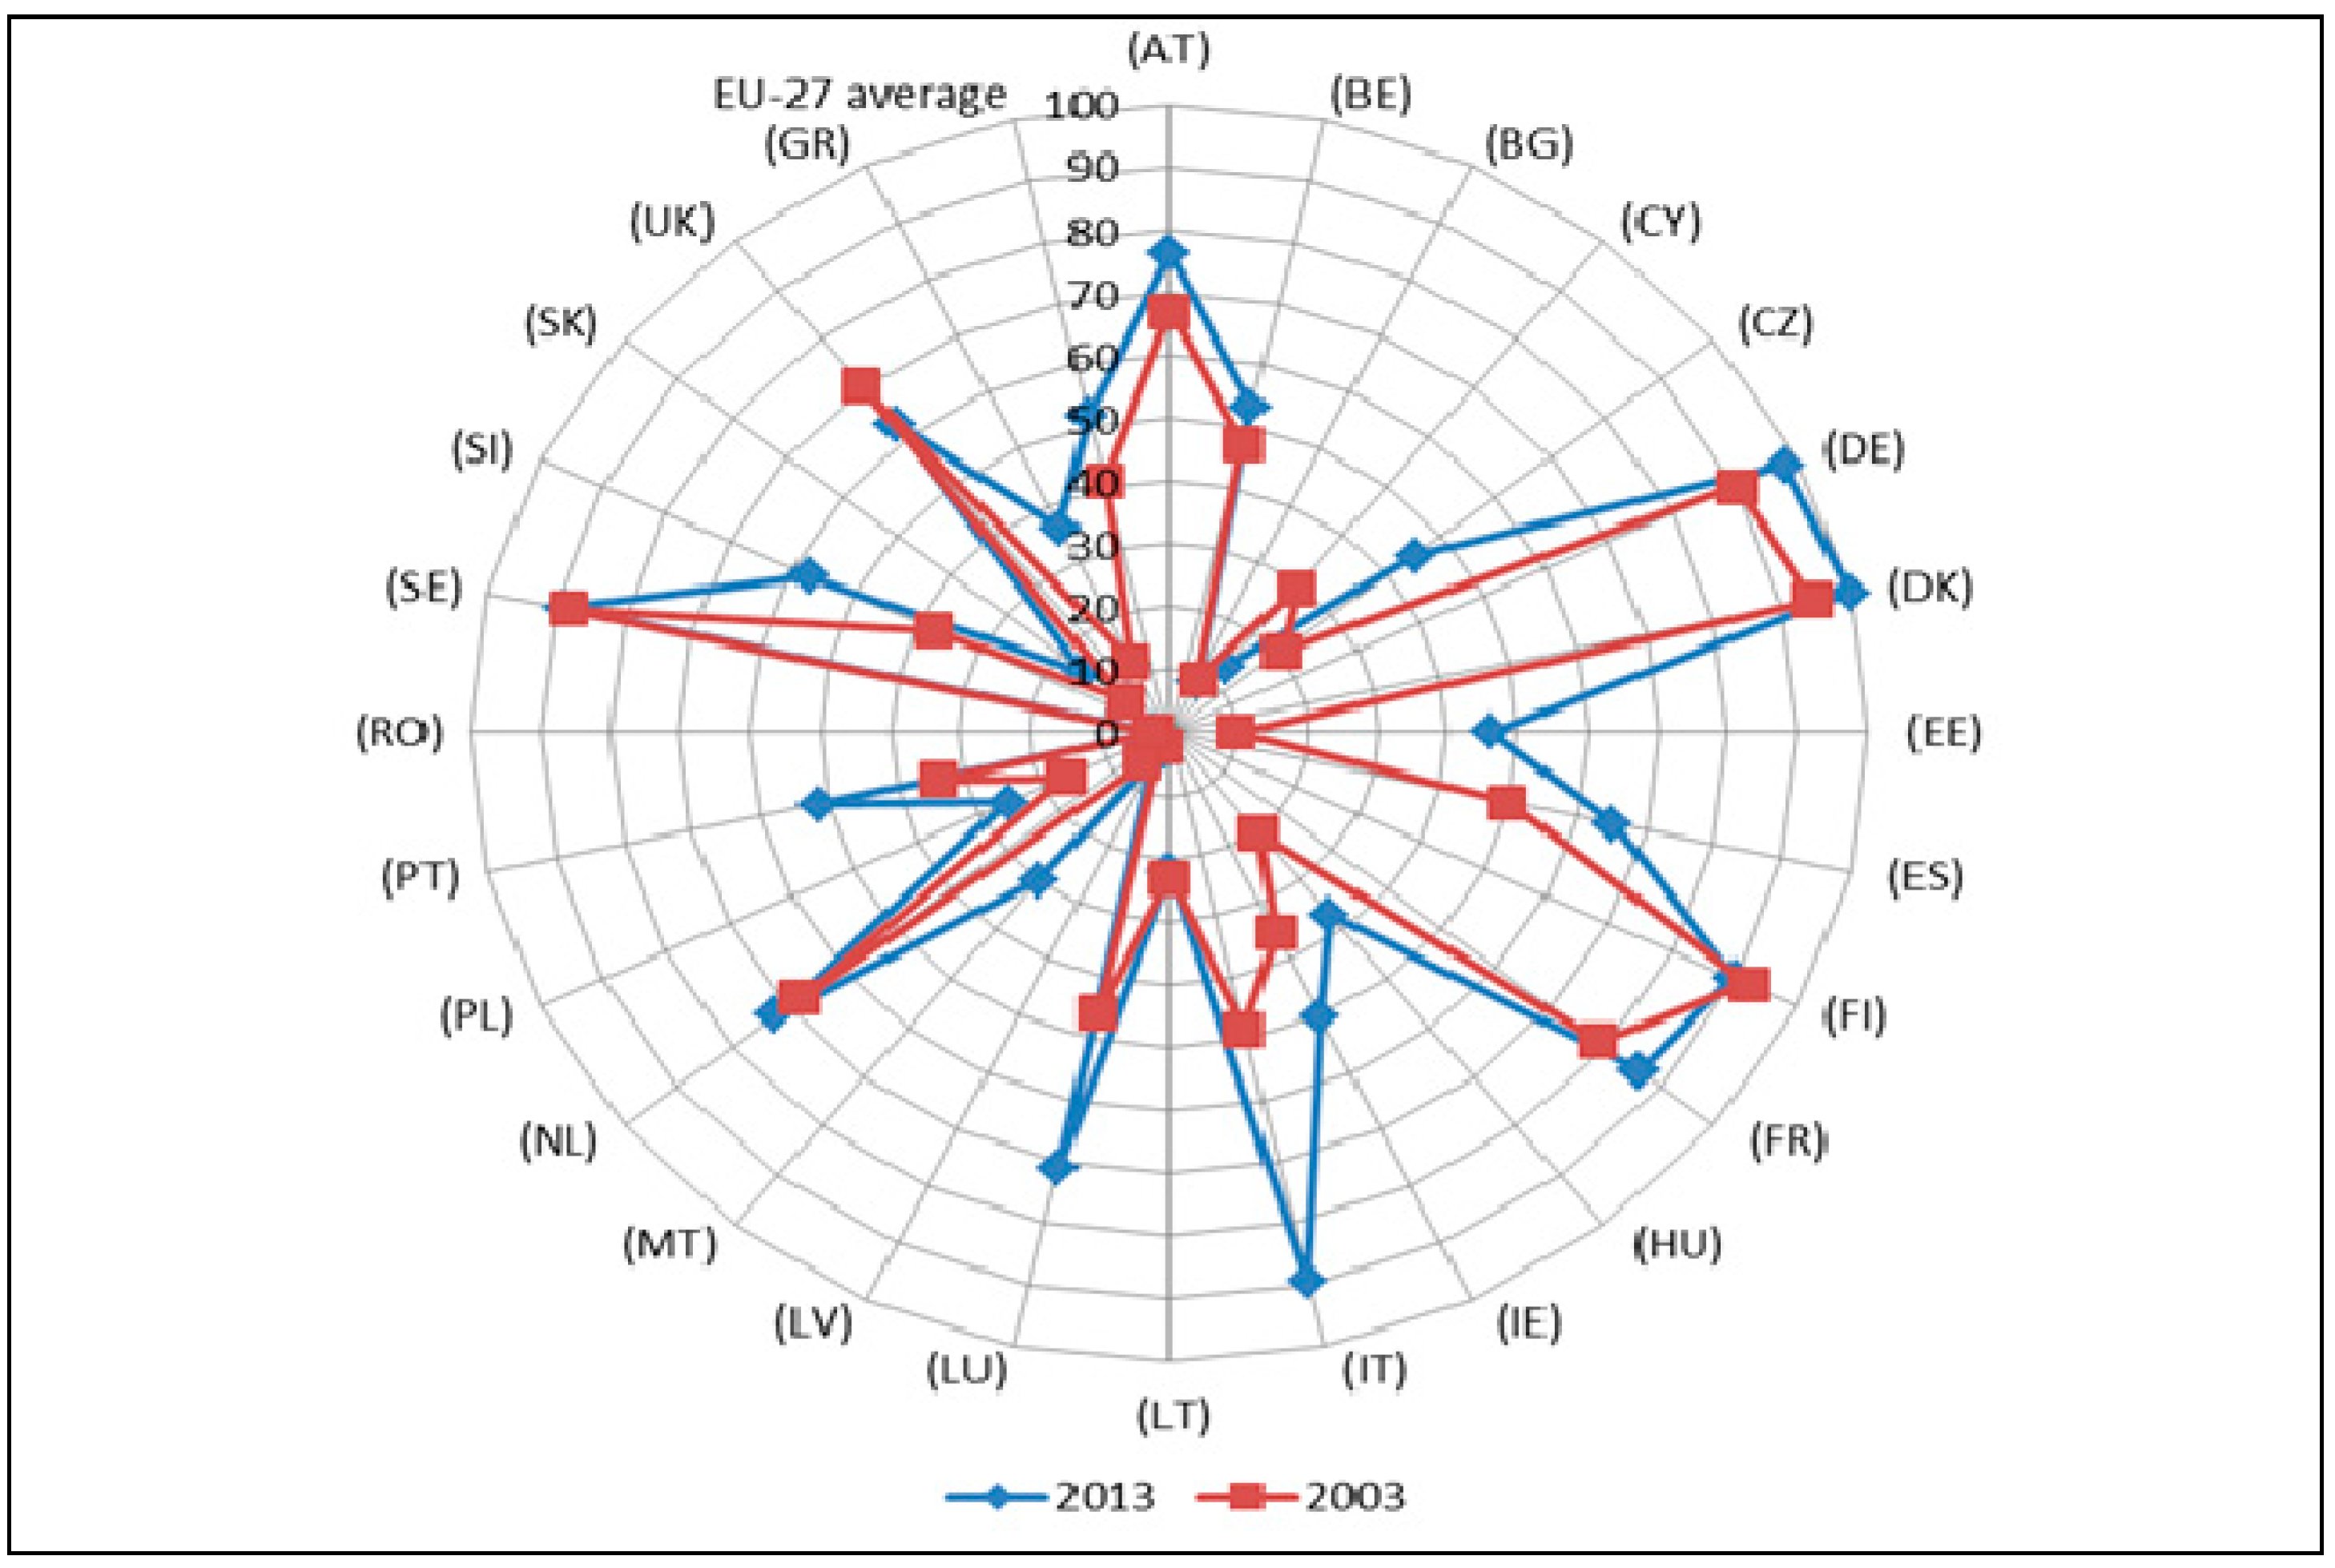
The ECO-INNOVATION INDEX shows how well individual Member States perform in different dimensions of eco-innovation compared to the EU average. It currently covers a time series from 2003 to 2013. Analyzing the values of ECO-INNOVATION INDEX in 2013 compared with 2003, we can observe that Germany and Denmark have increased their performance, but not by much, considering the fact that they have been at a very high level since 2003. Italy and Luxembourg are the countries with the most improvement in the field of eco-innovation from 2003 to 2013. Romania is the country with the largest decline in eco-innovation from 2003 to 2013, which is even more problematic as the level of performance in the field of eco-innovation was extremely low in 2003 (
Figure 3).
Similarly to the indices of the last years, the majority of EU-15 countries can be found at the top, particularly Scandinavian countries, while values for EU-12 countries are all below the average. A few member states have changed their ranking considerably; Italy, Estonia, Czech Republic, Malta and Greece have improved while Cyprus, UK, Lithuania, Bulgaria and Romania have fallen.
Figure 3.
The level of ECO-INNOVATION INDEX in 2003 and 2013 for EU countries.
Figure 3.
The level of ECO-INNOVATION INDEX in 2003 and 2013 for EU countries.
In
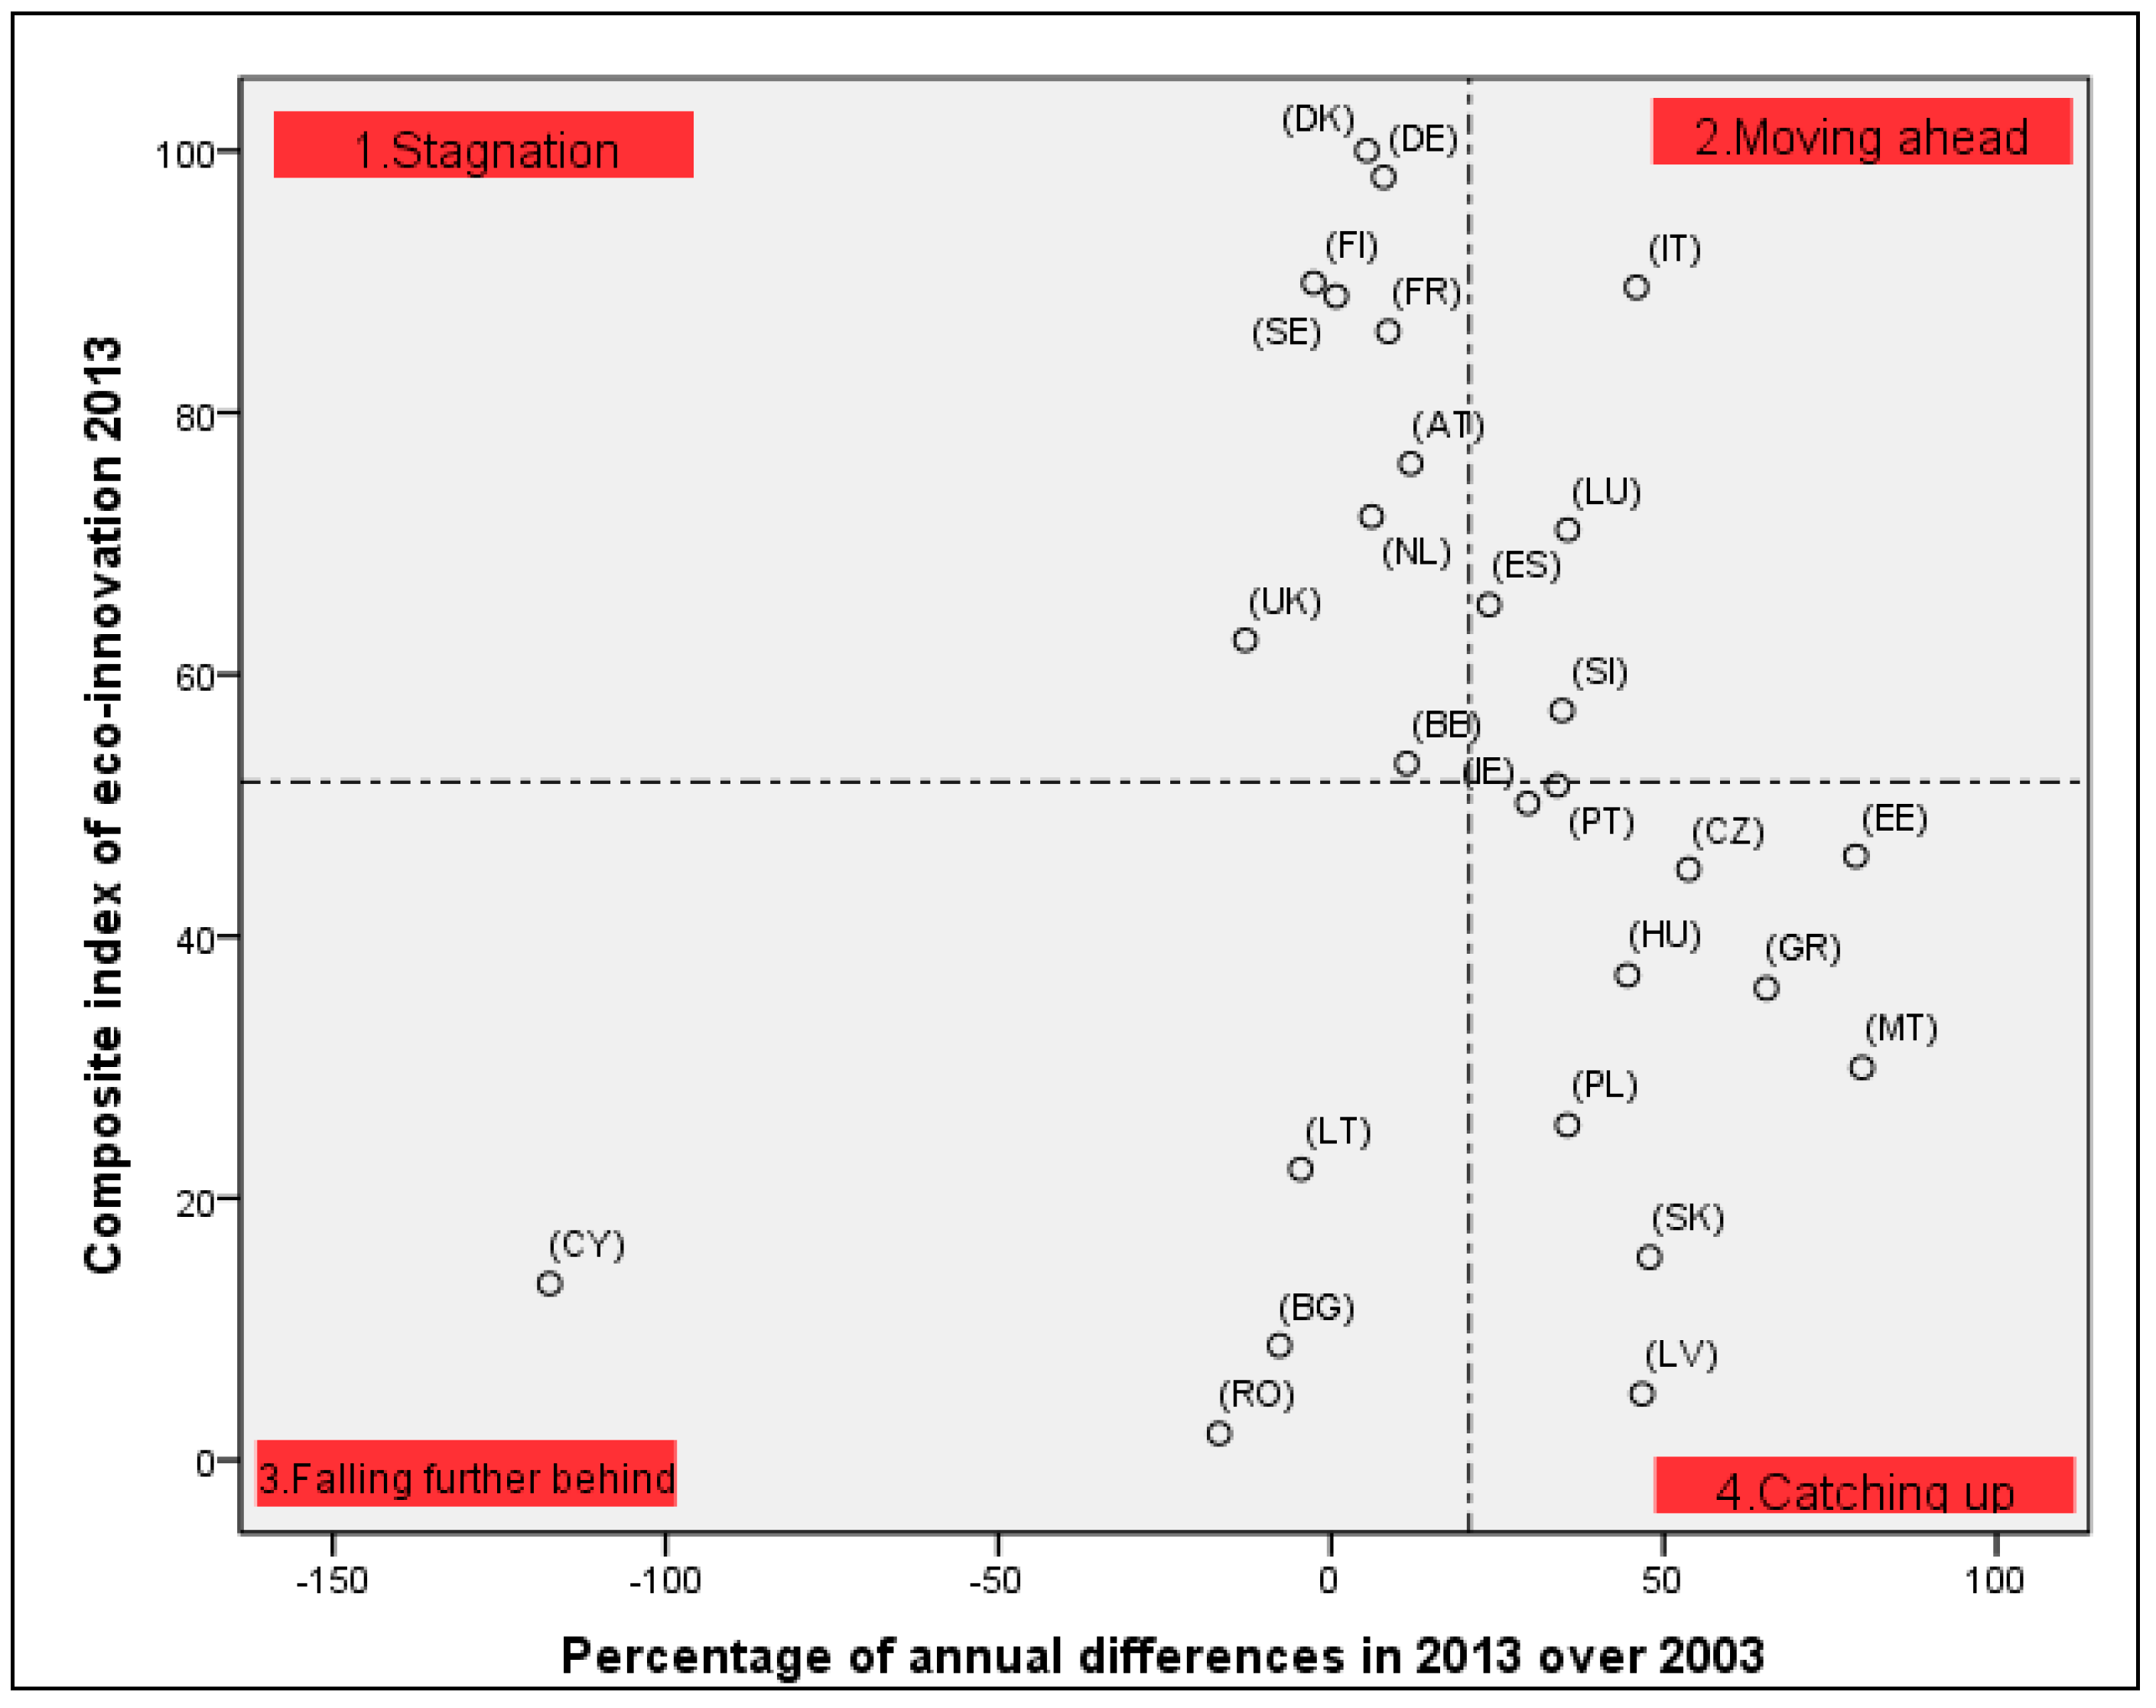
Figure 4, the horizontal axis gives the EU average value and the vertical axis shows the EU trend. The two axes divide the area into four quadrants. Countries in the upper quadrant are “moving ahead”, because both their value and their trend are above the EU average. Countries in the bottom left quadrant are “falling further behind” because they are below the EU average for both variables.
Figure 4.
Overall country trends by ECO-INNOVATION INDEX.
Figure 4.
Overall country trends by ECO-INNOVATION INDEX.
Poland, Slovakia and Latvia are the best examples of countries catching up from low current values.
Poland is particularly weak in R&D and innovation investments and early stage investments in green technologies as well as in economic outcomes related to eco-innovation. Although the overall picture is rather challenging, the trends indicate a considerable economic opportunity in modernizing the production processes, notably in the most energy- and resource-intensive sectors. The development and implementation of eco-innovative technologies in Poland are supported by the key national and regional strategies.
For the Slovak economy, the concept of “eco-innovation” is dominated by such terms as “green procurement”, “energy transition”, “enforcement of energy efficiency”, “environmental labeling”, and “small- and medium-sized enterprises”. The focus is on economic growth and its relation to the knowledge economy.
Latvia belongs to a group of countries with modest eco-innovation performance. Latvia has a series of environmental issues to be solved. Latvia has no specific eco-innovation policy strategy, neither has it environmental technology action plan.
Italy, Luxembourg and Spain are moving ahead, with above average current and trend performance. Innovation in general in Italy and eco-innovation processes in particular has shown a significant growth trend over the last decade, stimulated by public finance and EU funding and EU R&D projects. Italy has good achievements in improving energy efficiency, expanding renewable energy (solar, hydro, and geothermal), material recycling, as well as in greening transportation and eco-innovations in industrial biotechnology.
Luxembourg has a strong and comprehensive set of environmental and innovation laws, based largely on European legislation, which have been an effective tool for implementing relevant policies, and a main driver for the promotion of eco-technologies and eco-innovation.
Spain has a high recognition of green certification among companies. The country also has a large set of eco-labeled products. Governmental allocation for environmental R&D is higher than in most EU countries.
Denmark, Germany, Finland, Sweden and France are in danger of losing momentum, being in a process of stagnation.
Although their current performance is above the EU average, they did not register significant increases due to the high level of eco-innovation. More likely, we can speak of a stability process of eco-innovation.
Denmark historically has been one of the leaders in the EU in promotion of sustainable economies and eco-innovation. In Denmark, a wide range of public institutions are involved in supporting eco-innovation, either through policy-making (setting standards, creating strategies, and running programs), or through direct funding or co-financing programs for development and demonstration of new technologies and green business plans.
Germany is one of the highest performing countries of the EU in eco-innovations. The country hosts a large number of companies with environmental certificates. Germany’s eco-innovation policy covers action plans (such as the High Tech Strategy) and funding for research (innovation alliances).
Eco-innovation needs and challenges of Finland are strongly associated with material efficiency.
Finland has an explicit policy for developing a national innovation system, and eco-innovation is a part of this system, as seen by a strong emphasis on specific R&D programs. The country also implements a large number of relevant strategies and measures such as environmental taxation.
Sweden is positioned in a group of eco-innovation leader countries. It has especially high performance in eco-innovation inputs and outputs explained by high R&D human resources and generous clean tech investment and high eco-patenting. Eco-innovation is an important component of Sweden’s national environmental policy strategy.
In eco-innovation performance, France displays good levels in terms of environmental (material productivity of the economy) and socio-economic outcomes (jobs and turnover), and underperforms in terms of eco-innovation activities and capturing company level eco-innovative performance. The French government showed its dedication to eco-innovation agenda by launching an ambitious program aimed at further developing the national eco-industrial potential.
Cyprus, Romania, Bulgaria and Lithuania are the best examples of countries falling further behind. In terms of eco-innovation performance, Cyprus underperforms in 2013 compared with 2003, remaining much lower than the EU average.
Although some positive trends are observed in the eco-industry, which shows growing employment and turnover, Romania faces various environmental challenges and is falling further behind the average of the 27 EU countries.
Eco-innovation needs and challenges in Bulgaria are associated with the country’s poor state of the environment (a result of intensive agricultural and industrial activities), energy inefficient buildings stock, growing prices for natural resources, intensified industrialization and urbanization, growing volumes of waste, and climate change.
Promotion of eco-innovations in Lithuania is covered under the general innovation policy agenda; it is understood that environmental considerations are an organic part of innovations nowadays.
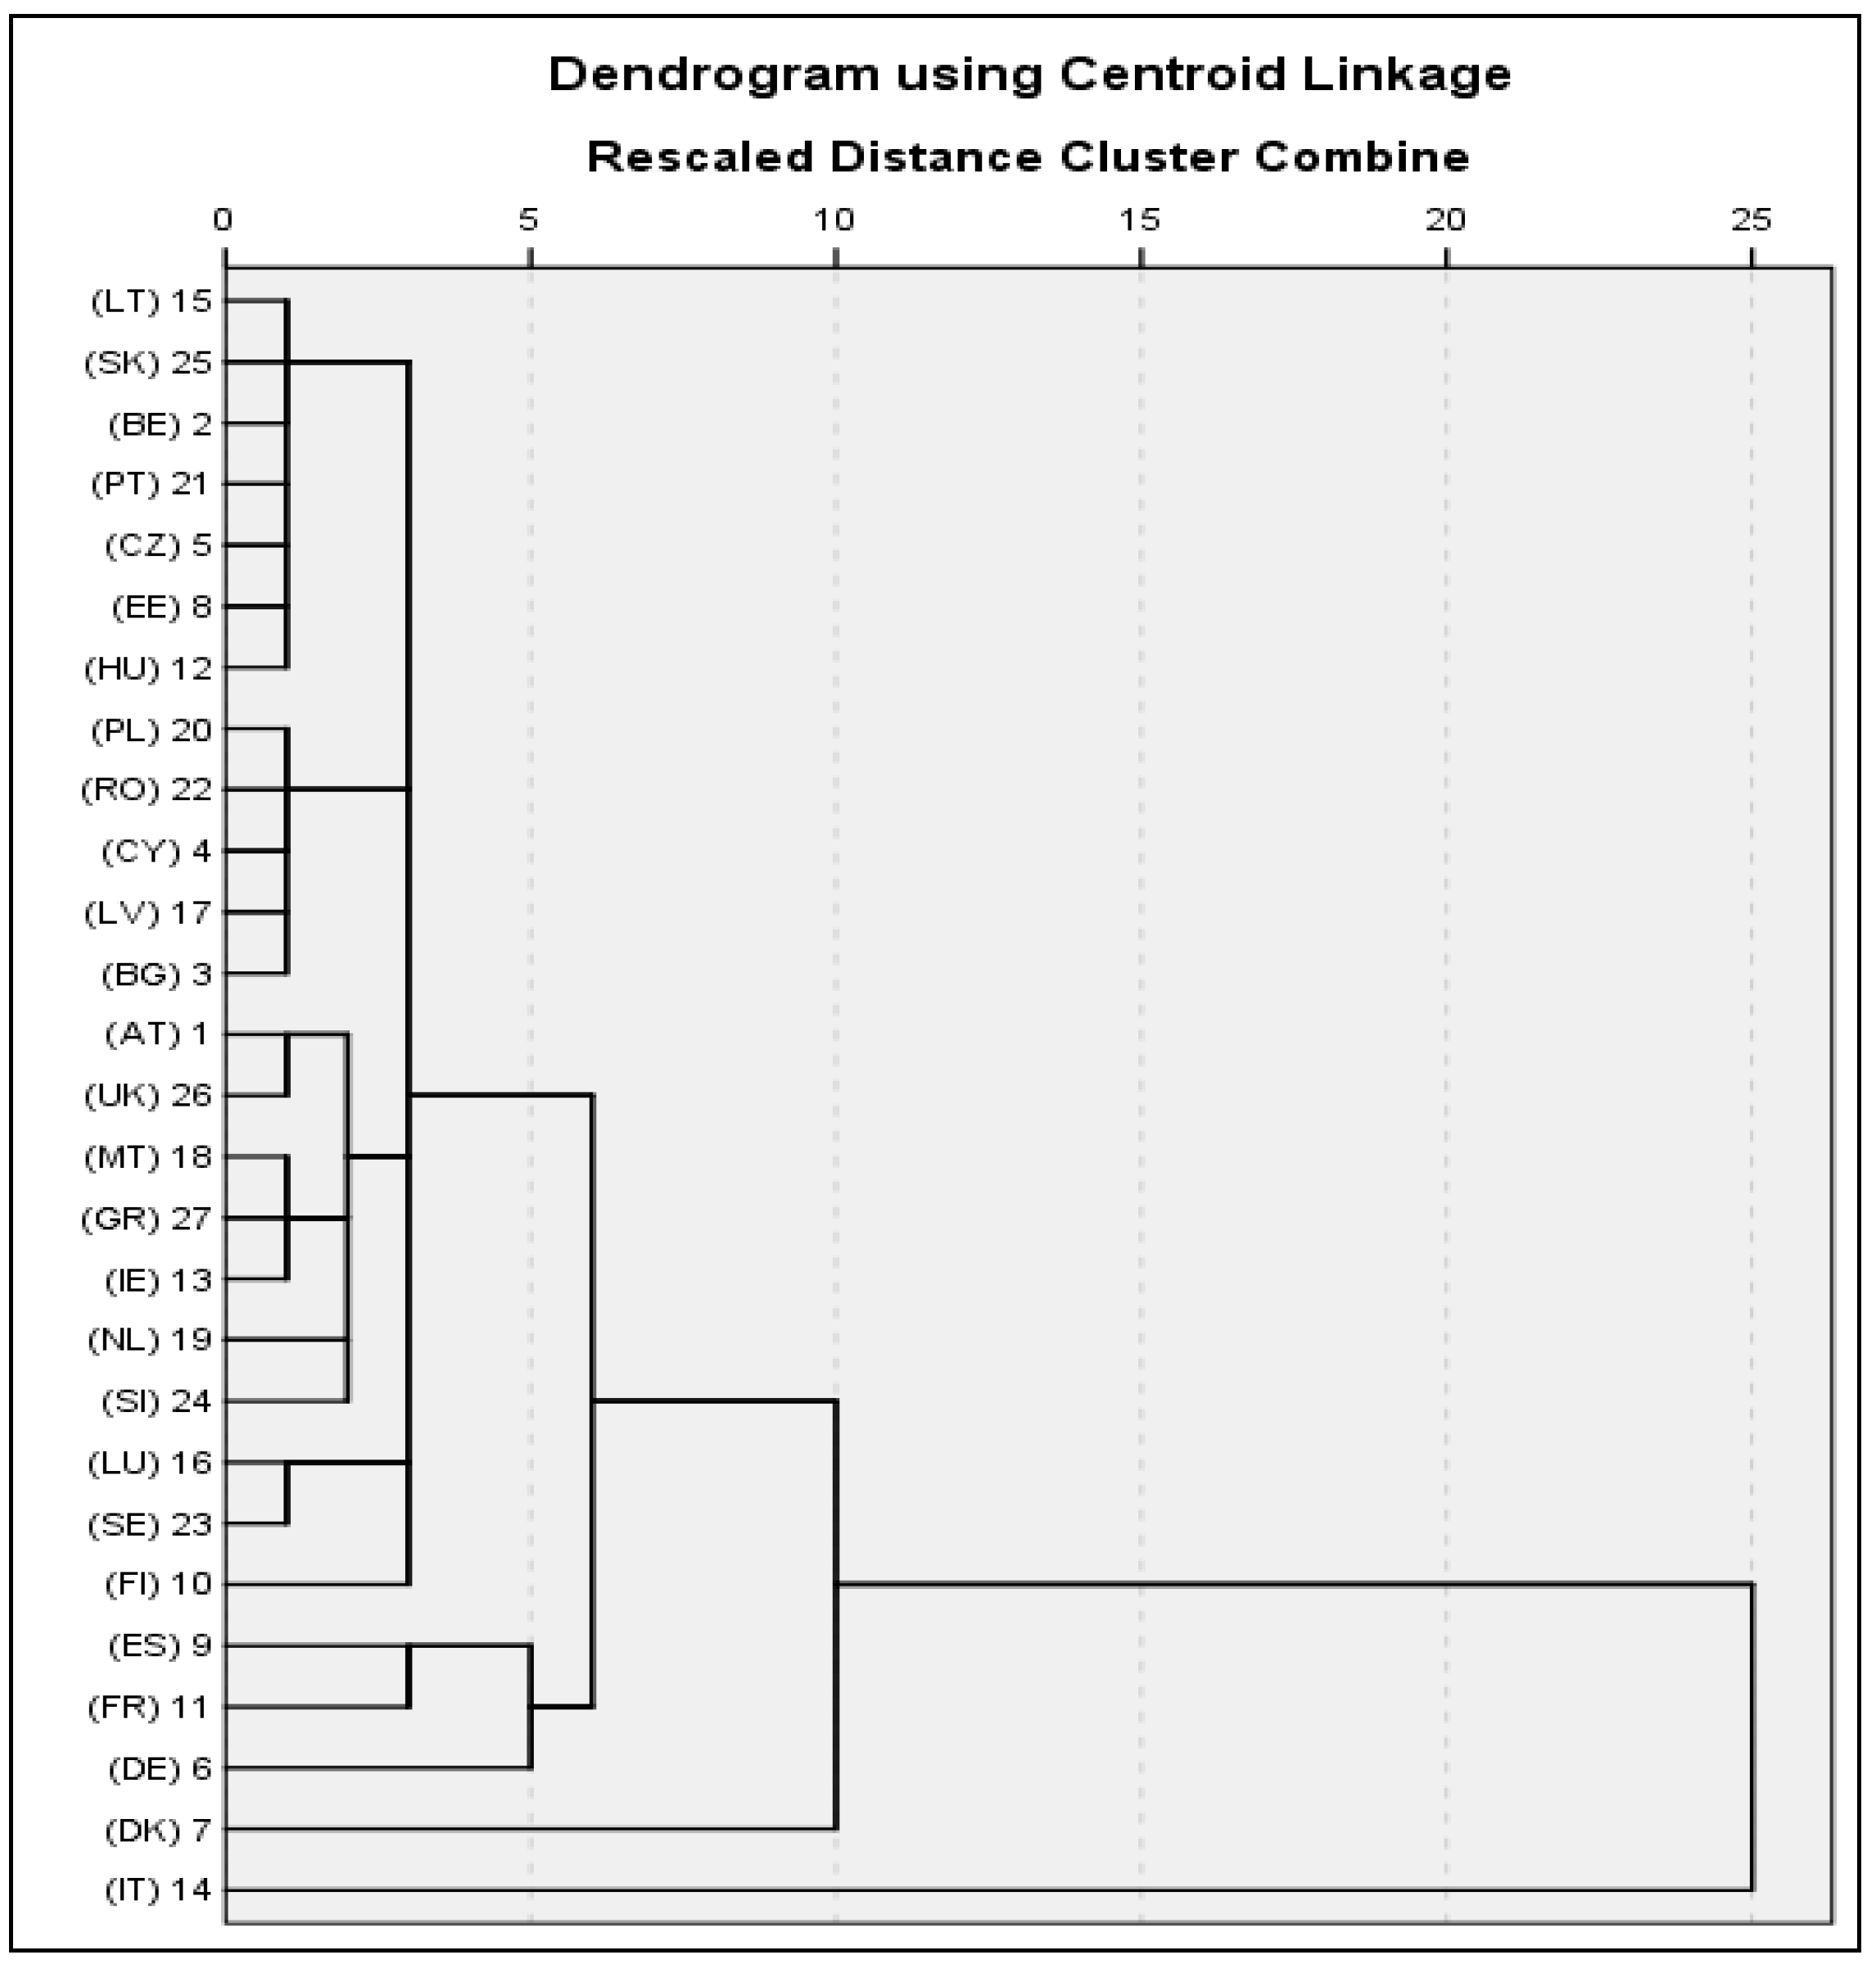
Figure 5.
The dendogram of EU countries eco-innovation performances in 2013.
Figure 5.
The dendogram of EU countries eco-innovation performances in 2013.
Applying the hierarchical method of clustering to the six principal components obtained from MPCA for the year 2013, we can identify the main poles of eco-innovation at European level in 2013 (
Figure 5).
Figure 5 shows the country clusters based on the individual ECO-INNOVATION INDEX indicators using tree clustering (hierarchical) with centroid clustering and squared Euclidean distances. Similarity between countries belonging to the same cluster decreases as the linkage distance increases.
Analyzing the dendogram of countries, we point out the existence of four classes in 2013:
It is necessary to point out that this result does not fully correspond to the division into stagnation, moving ahead, catching up and falling behind countries resulting from the trend diagram, but is relatively similar to it. It is important to mention one particular sub-group of countries, the countries related with the Romania (Poland, Cyprus, Bulgaria, and Latvia), which is very similar to the initial one, with the only difference being the countries Poland and Latvia, who have no joined this group.
5. Conclusions
The aim of the paper was to evaluate the Romanian eco-innovation performances during the period 2003–2013 by constructing a composite index and also to identify the main eco-innovation poles at European level using multivariate analysis techniques based on the eco-innovation specific indicators.
The paper was divided into two main analysis phases and has used 12 variables considered to be relevant from five thematic areas (researchers, % of total employment; R&D, personnel % of total employment; total intramural R&D expenditure; total Government budget appropriations or outlays on R&D; organizations and sites with EMAS registration; ecolabel licenses; Greenhouse Gas emissions; total environmental taxes; energy productivity; material productivity; exports of products from eco-industries; and turnover in eco-industries), in highlighting the importance of eco-innovation at national and international level, towards sustainable development.
The methodology used and data processing for 27 EU countries in the period 2003–2013 revealed the existence of six principal components from the total of 12 original variables, which were used in the construction of the composite index, those being significant for all the member states with a significant influence on eco-innovation, with a high impact in each economy.
The policy adopted by every state in the EU towards developing eco-innovation has resulted in different effects from one country to another. This is, on the one hand, the result of understanding the necessity and the usefulness of eco-innovation, and, on the other hand, the result of the design and implementation of the policy. Thus, the results of the composite resulted highlighted the following hierarchy: countries with a very high value of the index during the whole period-are the benchmark countries (Germany, Denmark, Sweden, Finland, Netherlands and France); countries with improvements over the time in the field of eco-innovation (Czech Republic, Estonia, Spain, Italy, Luxembourg, Portugal and Greece); and countries with low performances in the field of eco-innovation (Bulgaria, Hungary, Lithuania, Latvia, Romania and Slovakia).
The values of the composite index in 2013 compared to 2003, for all the 27 EU member states have produced the following results:
- (1)
A total of 15 countries, mostly Scandinavian, in both 2013 and 2003 had a high level of eco-efficiency, given by the value of the composite index placed above average, thanks to the policy implemented within these states who considered eco-innovation as a key element in the sustainable development of the country’s economy.
- (2)
In 2013, the composite index was situated below the average for 12 countries, which were not able to maintain the eco-innovation policy at a level applicable to the corresponding needs and requirements.
- (3)
For five countries (Italy, Estonia, Czech Republic, Malta and Greece) in 2013 compared to 2003, the composite index was amended to growth, which means that at the national level the awareness of the needs and importance of using eco-innovation in the sustainable development plan was managed.
- (4)
Besides Romania, four other countries (Cyprus, UK, Lithuania, and Bulgaria) faced a reduction in the composite index in 2013 compared to 2003, assuming either that this process of eco-innovation has not received the due attention over these 10 years or that the policy adopted in respect to eco-innovation was not well defined or applied at the national level.
The empirical results of cluster analysis revealed the following countries: Italy; Denmark; Germany, France and Spain; and the last class, which includes the rest of the countries divided into four sub-groups. Romania is included in this fourth cluster.
As a final conclusion, the position of Romania in tackling eco-innovation is insignificant compared to the benchmark countries, which have a significant contribution of eco-innovation to economic growth. Therefore, Romania as failed to discuss eco-innovation performance at the national level.
The utility of this study is reflected in the outcome research highlighting Romania’s position among the lowest countries in the adoption of eco-innovation, which allows new perspectives for research towards the design and adoption of measures to remedy the current situation.
For future research, the index provides a relative measure of eco-innovation performance over time and it can be used for comparisons across areas and over time. In addition, in the future, Romania should adopt a policy of eco-innovation to solve problems that arise in relation to: the failure of market prices (prices should reflect significant cost and environmental benefits), obstructionist behavior regarding the introduction of eco-innovation, rigid economic structures towards the adoption of eco-innovation, harmful incentives and subsidies, and infrastructure.
The return on investments of environment protection, the uncertain market demand due to low awareness of the significant impact of eco-innovation on employment and economic growth are barriers that must be solved by applying and implementing an action plan addressing eco-innovation by development of skills oriented to eco-innovation issues, design and implementation of legislation on the relationship between environment and innovation, implementation of projects that aim to introduce eco-innovation in various sectors, deepening of European and international cooperation to promote eco-innovation internally and externally, internal and international mobilization of financial instruments to stimulate eco-innovation, etc.
However, taking into account the results obtained, due to the influence of the most significant factors influencing eco-innovation can be considered. This is a phenomenon that is leading to significant progress in achieving the objective of sustainable development. This approach relies on the measurement and statistical analysis, used to obtain high performance sustainable development at both the EU level and globally.


 ,
, 


