
Optimal Sizing of a Hybrid Grid-Connected Photovoltaic–Wind–Biomass Power System

Abstract
:1. Introduction
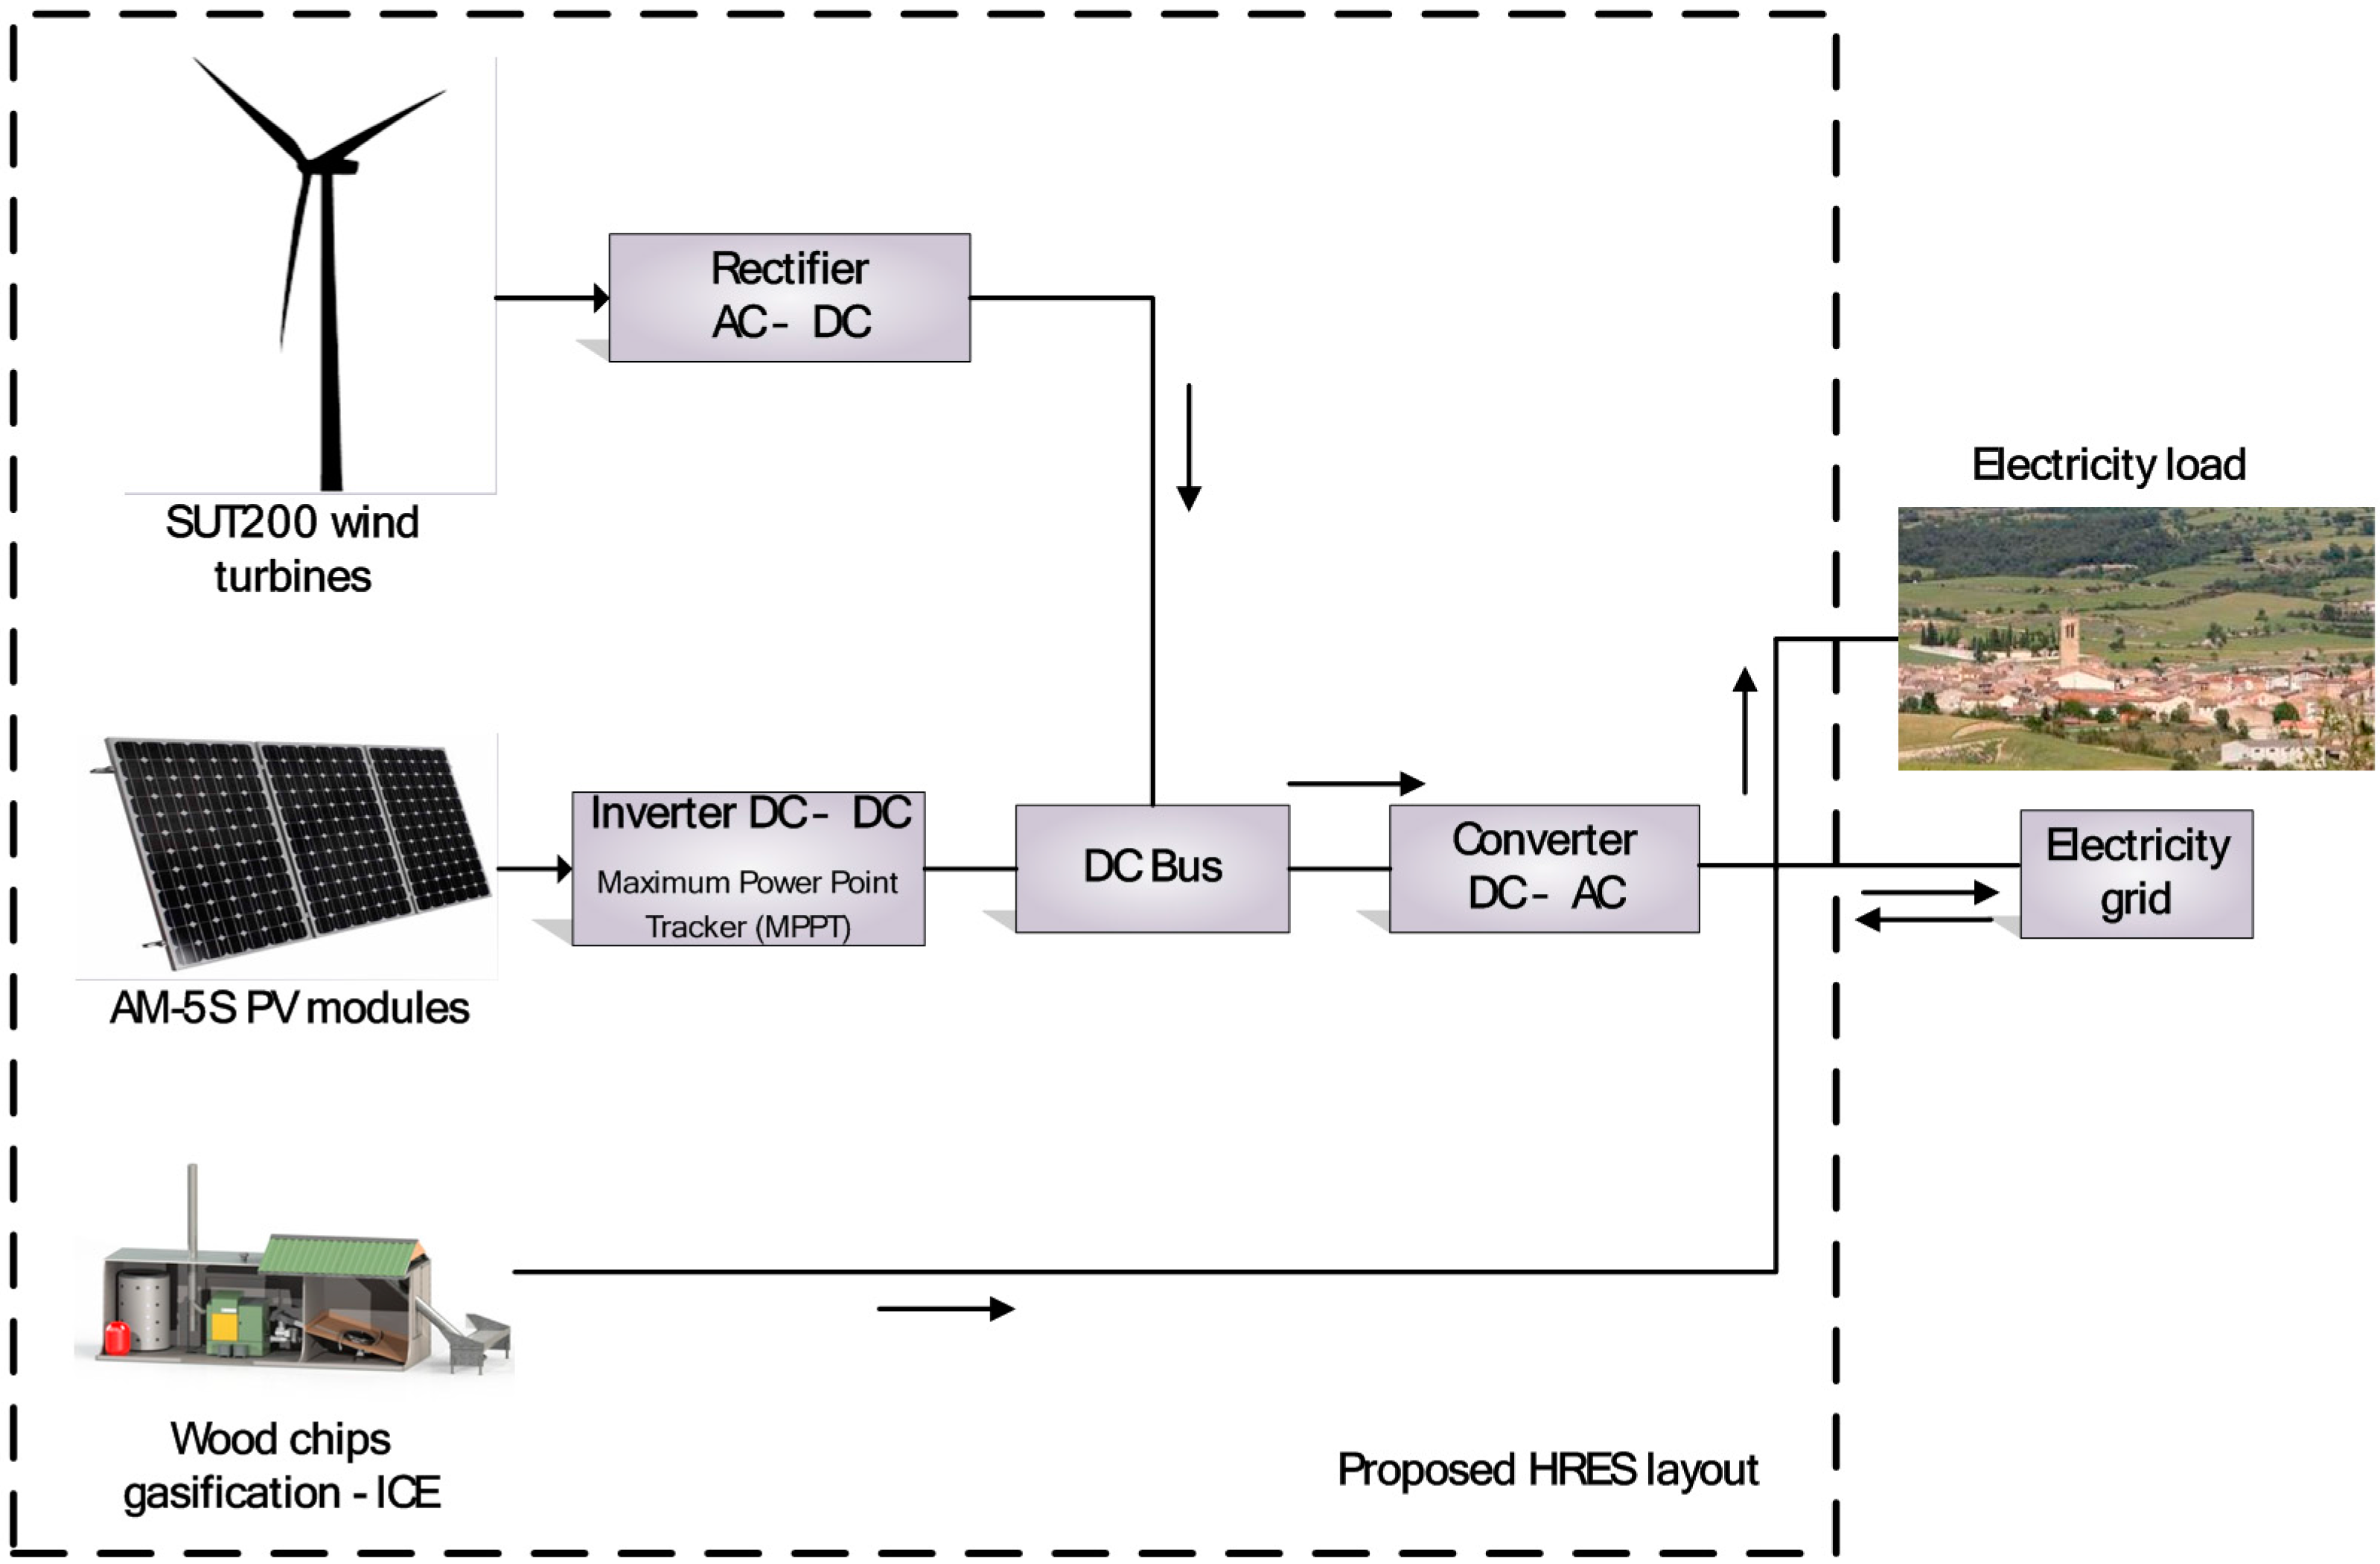
2. System Description

3. Methodology Description
3.1. Sample Selection
3.2. Input Data
3.2.1. Stochastic Variables

| Data | Value | Source |
|---|---|---|
| Solar irradiation (W/m2) | Vector of 8760 points (365 days × 24 h) | [46] |
| Wind speed at 6 m (m/s) | Vector of 8760 points (365 days × 24 h) | [46] |
| Electricity demand profile (kWh) | Vector of 8760 points (365 days × 24 h) | [47] |
3.2.2. Cost and Financial Variables
| Data | Variable Name | Value | Source |
|---|---|---|---|
| System lifetime | 25 years | [49,50,51] | |
| PV modules lifetime | 25 years | [36] | |
| Biomass equipment (gasifier-ICE) lifetime | 25 years | [52] | |
| Wind turbine lifetime | 20 years | [51] | |
| Solar PV DC-DC converter lifetime | 15 years | [19,20,21,22,23,24,25,26,27,28,29,30,31,32,33,34,35,36,37,38,39,40,41,42,43,44,45,46,47,48,49,50,51] | |
| Interest rate | 3.5% | [53] | |
| Spain’s Value Added Tax (VAT) rate | 21% | [54] | |
| General inflation rate | 3% | [51] | |
| Electricity selling price inflation rate | 3% | [51] | |
| Wind turbines selling price inflation rate | −5% | [51] | |
| Converter selling price inflation rate | −5% | [51] | |
| Cost reduction limit due to technological maturity for wind turbines | −25% | [51] | |
| Cost reduction limit due to technological maturity for converters | −25% | [51] | |
| PV capital cost | 3800 $/kW | [55] | |
| Wind capital cost | 2700 $/kW | [56] | |
| Converter capital cost | 250 $/kWPV | [51] | |
| Biomass equipment capital cost | 4000 $/kW | [52,57,58] | |
| PV fixed O&M costs | 32.64 $/kW | [59] | |
| Wind fixed O&M costs | 32.15 $/kW | [59] | |
| PV variable O&M costs | 0 $/kW | [59] | |
| Wind variable O&M costs | 0.01475 $/kW | [59] | |
| Fuel (wood chips) cost | 173 €/t | [7] | |
| Electricity market price | Vector of 8760 points; 24 h per 365 days | [60] | |
| Electricity retail price | Peak—0.101406 €/kWh Flat—0.078289 €/kWh Off-peak—0.052683 €/kWh | [47] | |
| Time periods | Peak: 17–23 winter/10–16 summer Flat: 8–17, 23–24 winter/8–10, 16–24 summer Off-peak: 0–8 winter time/summer time | [61] |
3.2.3. Efficiency and Performance Variables
| Data | Value | Source |
|---|---|---|
| Module reference efficiency | 15.0% | [36] |
| Model nameplate de-rate | 95.0% | [64] |
| Converter efficiency | 92.0% | [64] |
| Module mismatch factor | 98.0% | [64] |
| Connections efficiency | 99.5% | [64] |
| DC wiring losses factor | 98.0% | [64] |
| AC wiring losses factor | 99.0% | [64] |
| Soiling de-rate factor | 95.0% | [64] |
| System availability O&M | 98.0% | [64] |
| Gasifier ideal efficiency | 71% | [57] |
| Gasifier operation efficiency | 95% | [52] |
| Biomass syngas-fired ICE | 37% | [25,52] |
| Biomass lower heating value (LHV) | 15.5 GJ/t | [52,65] |
3.3. Algorithm Description
3.3.1. Variables
3.3.2. Objective Function
4. Results

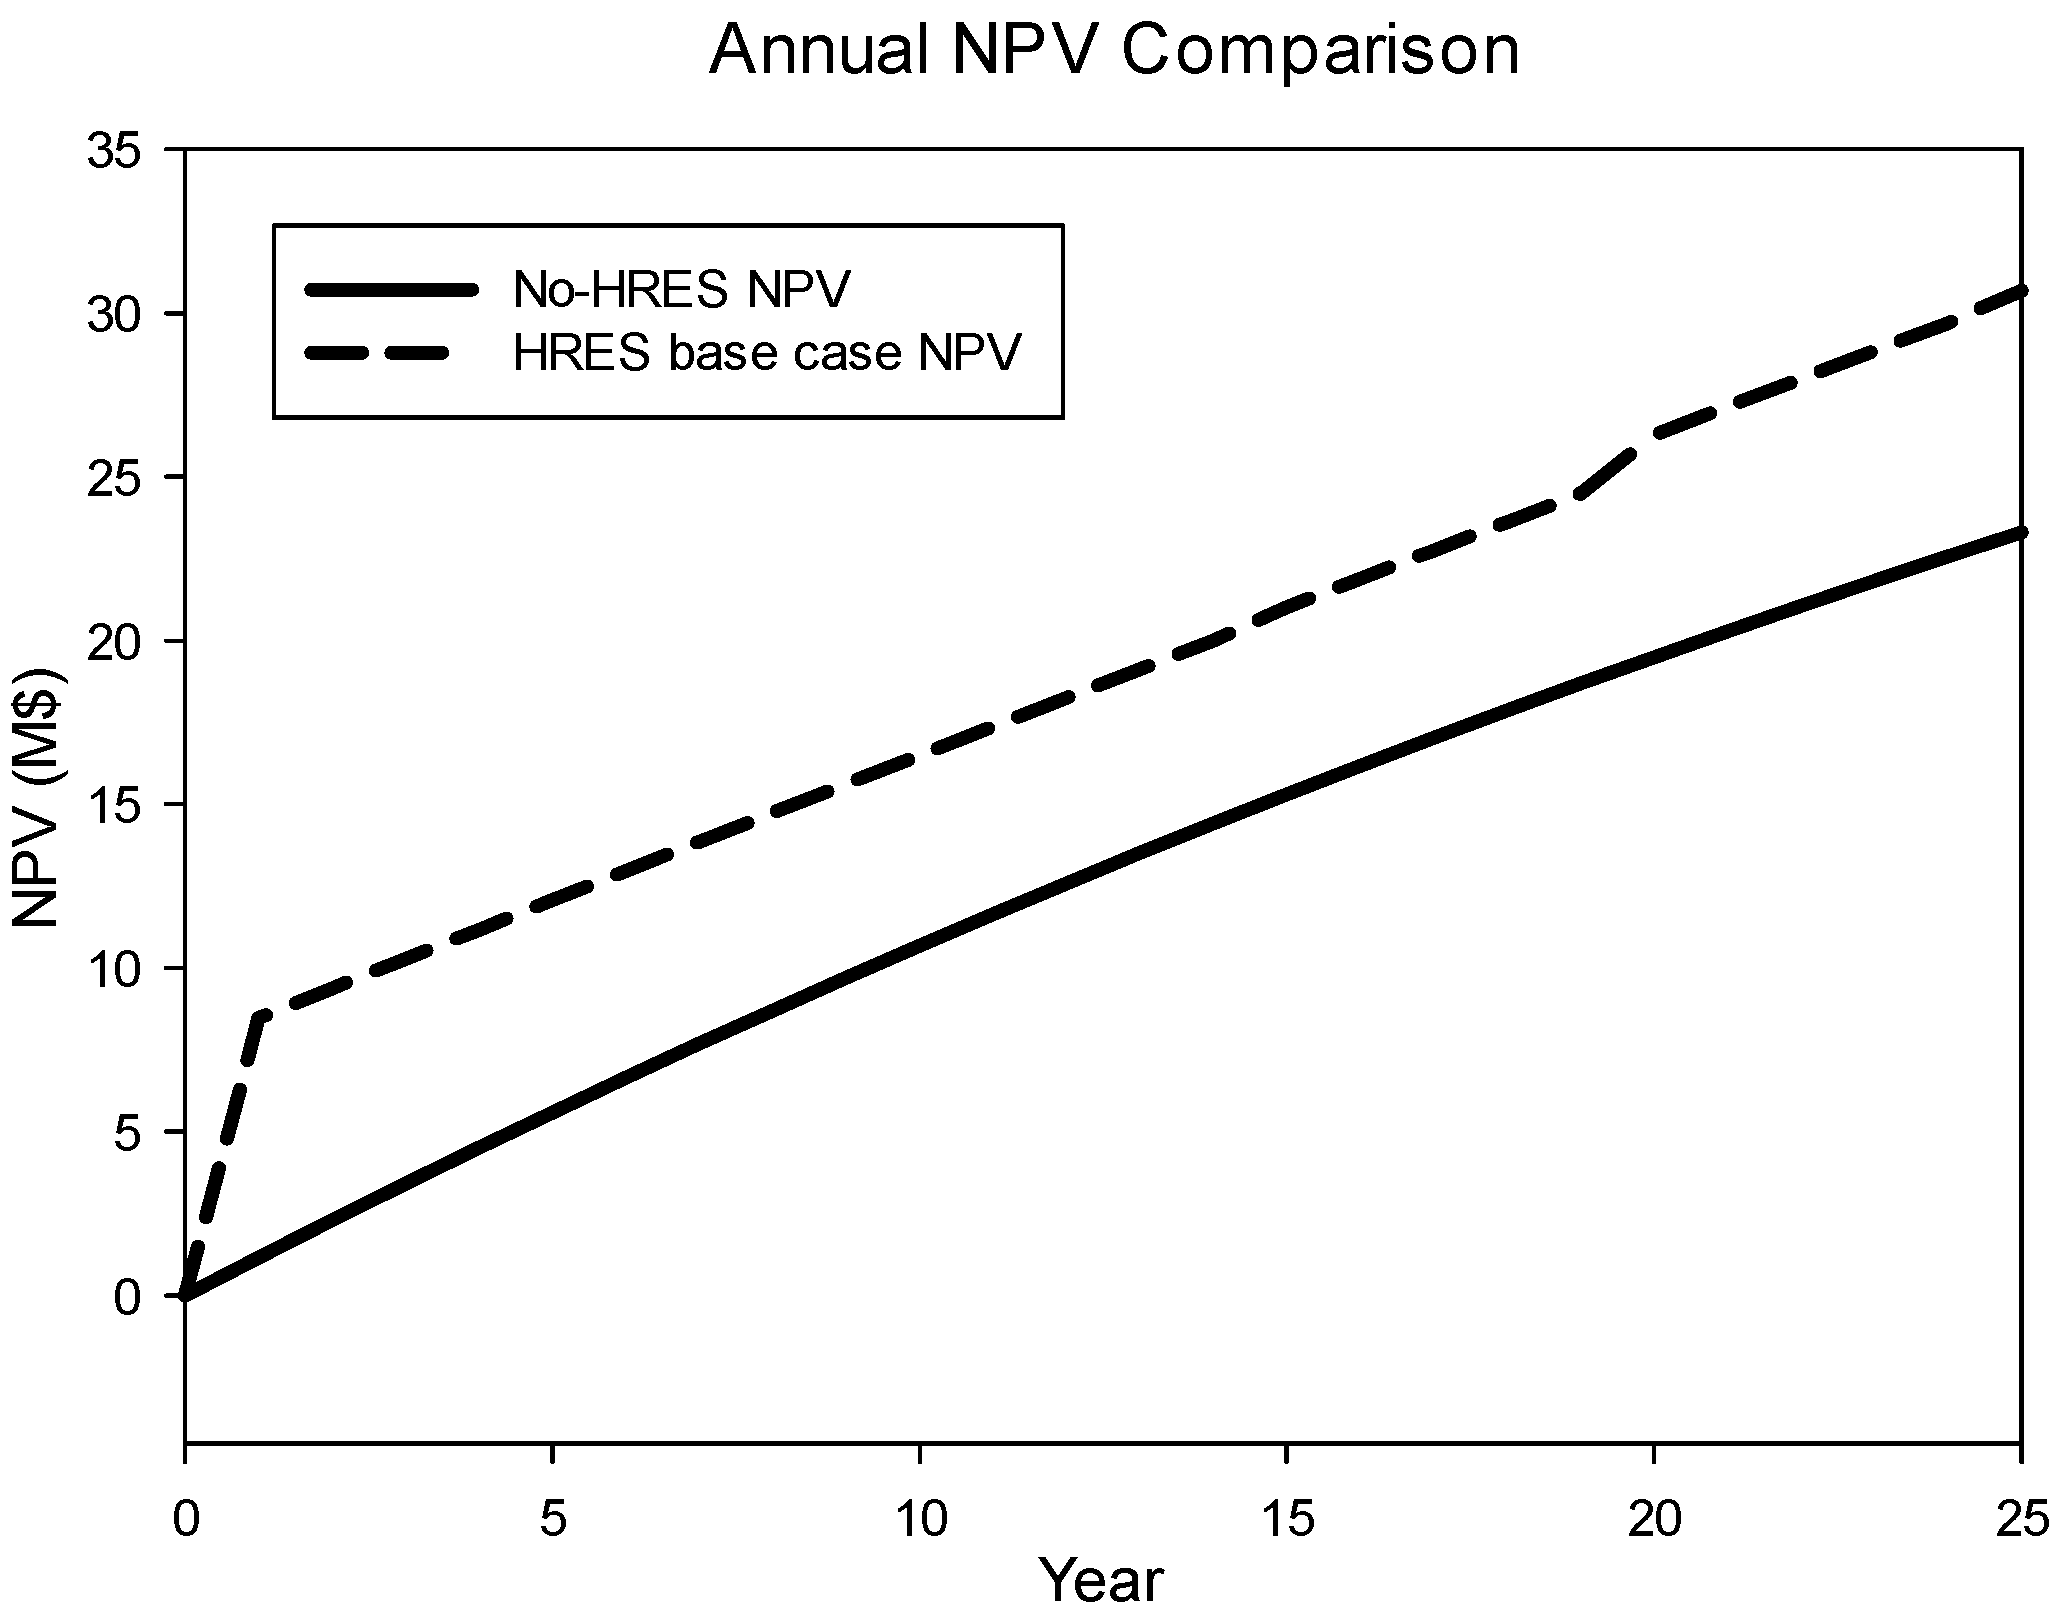
4.1. Base Case


4.2. Sensitivity Analysis
| Variable | Variation | NPV Change |
|---|---|---|
| PV capital cost | +10% | +1.055% |
| Wind capital cost | +10% | +0.773% |
| Fuel cost | +10% | +1.629% |
| Biomass capital cost | +10% | +0.652% |
| Electricity price | +10% | +3.808% |
| General inflation rate (g) | +10% | +0.764% |
| Interest rate | +10% | −3.264% |
| Module reference efficiency | +10% | −1.457% |
| Wind turbine reference efficiency | +10% | −1.075% |
| Biomass gasifier-ICE efficiency | +10% | −1.557% |
| Biomass LHV | +10% | −1.531% |
5. Conclusions
Acknowledgments
Author Contributions
Conflicts of Interest
References
- Deshmukh, M.K.; Deshmukh, S.S. Modeling of hybrid renewable energy systems. Renew. Sustain. Energy Rev. 2008, 12, 235–249. [Google Scholar] [CrossRef]
- Passey, R.; Spooner, T.; MacGill, I.; Watt, M.; Syngellakis, K. The potential impacts of grid-connected distributed generation and how to address them: A review of technical and non-technical factors. Energy Policy 2011, 39, 6280–6290. [Google Scholar] [CrossRef]
- Pearce, J.M. Limitations of Nuclear Power as a Sustainable Energy Source. Sustainability 2012, 4, 1173–1187. [Google Scholar] [CrossRef]
- Montuori, L.; Alcázar-Ortega, M.; Álvarez-Bel, C.; Domijan, A. Integration of renewable energy in microgrids coordinated with demand response resources: Economic evaluation of a biomass gasification plant by Homer Simulator. Appl. Energy 2014, 132, 15–22. [Google Scholar] [CrossRef]
- Zhao, B.; Zhang, X.; Li, P.; Wang, K.; Xue, M.; Wang, C. Optimal sizing, operating strategy and operational experience of a stand-alone microgrid on Dongfushan Island. Appl. Energy 2014, 113, 1656–1666. [Google Scholar] [CrossRef]
- Herran, D.S.; Nakata, T. Design of decentralized energy systems for rural electrification in developing countries considering regional disparity. Appl. Energy 2012, 91, 130–145. [Google Scholar] [CrossRef]
- Esteban, B.; Riba, J.R.; Baquero, G.; Rius, A. Comparative cost evaluation of heating oil and small-scale wood chips produced from Euro-Mediterranean forests. Renew. Energy 2015, 74, 568–575. [Google Scholar] [CrossRef]
- Carneiro, P.; Ferreira, P. The economic, environmental and strategic value of biomass. Renew. Energy 2012, 44, 17–22. [Google Scholar] [CrossRef] [Green Version]
- Ma, T.; Yang, H.; Lu, L.; Peng, J. Pumped storage-based standalone photovoltaic power generation system: Modeling and techno-economic optimization. Appl. Energy 2015, 137, 649–659. [Google Scholar] [CrossRef]
- Ma, T.; Yang, H.; Lu, L. A feasibility study of a stand-alone hybrid solar-wind-battery system for a remote island. Appl. Energy 2014, 121, 149–158. [Google Scholar] [CrossRef]
- Bekele, G.; Tadesse, G. Feasibility study of small Hydro/PV/Wind hybrid system for off-grid rural electrification in Ethiopia. Appl. Energy 2012, 97, 5–15. [Google Scholar] [CrossRef]
- Bekele, G.; Palm, B. Feasibility study for a standalone solar-wind-based hybrid energy system for application in Ethiopia. Appl. Energy 2010, 87, 487–495. [Google Scholar] [CrossRef]
- Rehman, S.; Alam, M.M.; Meyer, J.P.; Al-Hadhrami, L.M. Feasibility study of a wind-pv-diesel hybrid power system for a village. Renew. Energy 2012, 38, 258–268. [Google Scholar] [CrossRef]
- Kumar, Y.V.P.; Bhimasingu, R. Optimal sizing of microgrid for an urban community building in South India using HOMER. In Proceedings of the 2014 IEEE International Conference on Power Electronics, Drives and Energy Systems (PEDES), Mumbai, India, 16–19 December 2014; pp. 1–6.
- Chen, H.C. Optimum capacity determination of stand-alone hybrid generation system considering cost and reliability. Appl. Energy 2013, 103, 155–164. [Google Scholar] [CrossRef]
- Perera, A.T.D.; Attalage, R.A.; Perera, K.K.C.K.; Dassanayake, V.P.C. A hybrid tool to combine multi-objective optimization and multi-criterion decision making in designing standalone hybrid energy systems. Appl. Energy 2013, 107, 412–425. [Google Scholar] [CrossRef]
- Ma, T.; Yang, H.; Lu, L.; Peng, J. Optimal design of an autonomous solar-wind-pumped storage power supply system. Appl. Energy 2014. [Google Scholar] [CrossRef]
- Fadaee, M.; Radzi, M.A.M. Multi-objective optimization of a stand-alone hybrid renewable energy system by using evolutionary algorithms: A review. Renew. Sustain. Energy Rev. 2012, 16, 3364–3369. [Google Scholar] [CrossRef]
- Abbes, D.; Martinez, A.; Champenois, G. Life cycle cost, embodied energy and loss of power supply probability for the optimal design of hybrid power systems. Math. Comput. Simul. 2014, 98, 46–62. [Google Scholar] [CrossRef]
- An, L.N.; Quoc-Tuan, T.; Seddik, B.; van-Linh, N. Optimal sizing of a grid-connected microgrid. In Proceedings of the 2015 IEEE International Conference on Industrial Technology (ICIT), Seville, Spain, 17–19 March 2015; pp. 2869–2874.
- Sansa, I.; Villafafila, R.; Bellaaj, N.M. Optimal sizing design of an isolated microgrid using loss of power supply probability. In Proceedings of the IREC2015, 6th International Renewable Energy Congress, Sousse, Tunisia, 24–26 March 2015; pp. 1–7.
- Logenthiran, T.; Srinivasan, D.; Khambadkone, A.M.; Raj, T.S. Optimal sizing of an islanded microgrid using Evolutionary Strategy. In Proceedings of the 2010 IEEE 11th International Conference on Probabilistic Methods Applied to Power Systems, Singapore, 14–17 June 2010; pp. 12–17.
- Yazdani, A.; Bhuiyan, F.A.; Primak, S.L. Optimal sizing approach for islanded microgrids. IET Renew. Power Gener. 2015, 9, 166–175. [Google Scholar]
- González, A.; Riba, J.R.; Rius, A.; Puig, R. Optimal sizing of a hybrid grid-connected photovoltaic and wind power system. Appl. Energy 2015, 154, 752–762. [Google Scholar] [CrossRef] [Green Version]
- González, A.; Riba, J.R.; Puig, R.; Navarro, P. Review of micro- and small-scale technologies to produce electricity and heat from Mediterranean forests' wood chips. Renew. Sustain. Energy Rev. 2015, 43, 143–155. [Google Scholar] [CrossRef]
- Zhao, H.; Guo, S. External Benefit Evaluation of Renewable Energy Power in China for Sustainability. Sustainability 2015, 7, 4783–4805. [Google Scholar] [CrossRef]
- Moreira, F.; Viedma, O.; Arianoutsou, M.; Curt, T.; Koutsias, N.; Rigolot, E.; Barbati, A.; Corona, P.; Vaz, P.; Xanthopoulos, G.; et al. Landscape—Wildfire interactions in southern Europe: Implications for landscape management. J. Environ. Manag. 2011, 92, 2389–2402. [Google Scholar] [CrossRef] [PubMed] [Green Version]
- Williams, J. Exploring the onset of high-impact mega-fires through a forest land management prism. For. Ecol. Manag. 2013, 294, 4–10. [Google Scholar] [CrossRef]
- Riera, P.; Mogas, J. Evaluation of a risk reduction in forest fires in a Mediterranean region. For. Policy Econ. 2004, 6, 521–528. [Google Scholar] [CrossRef]
- Román, M.V.; Azqueta, D.; Rodrígues, M. Methodological approach to assess the socio-economic vulnerability to wildfires in Spain. For. Ecol. Manag. 2013, 294, 158–165. [Google Scholar] [CrossRef]
- Butry, D.T.; Mercer, D.E.; Prestemon, J.P.; Pye, J.M.; Holmes, T.P. What is the price of catastrophic wildfire? J. For. 2001, 99, 9–17. [Google Scholar]
- Girardin, M.P.; Ali, A.A.; Carcaillet, C.; Gauthier, S.; Hély, C.; le Goff, H.; Terrier, A.; Bergeron, Y. Fire in managed forests of eastern Canada: Risks and options. For. Ecol. Manag. 2013, 294, 238–249. [Google Scholar] [CrossRef]
- Baquero, G.; Esteban, B.; Riba, J.R.; Rius, A.; Puig, R. An evaluation of the life cycle cost of rapeseed oil as a straight vegetable oil fuel to replace petroleum diesel in agriculture. Biomass Bioenergy 2011, 35, 3687–3697. [Google Scholar] [CrossRef] [Green Version]
- Fernandes, P.M. Fire-smart management of forest landscapes in the Mediterranean basin under global change. Landsc. Urban Plan. 2013, 110, 175–182. [Google Scholar] [CrossRef]
- Bhandari, B.; Lee, K.T.; Lee, C.S.; Song, C.K.; Maskey, R.K.; Ahn, S.H. A novel off-grid hybrid power system comprised of solar photovoltaic, wind, and hydro energy sources. Appl. Energy 2014, 133, 236–242. [Google Scholar] [CrossRef]
- Amerisolar, AmeriSolar AS-5M. 2013. Available online: http://www.weamerisolar.com/ (accessed on 14 September 2015).
- Generation Wind Ltd. SUT200 Wind Turbine. 2014. Available online: http://www.generationwindturbines.com/en/our-turbines/product-range/sut-200 (accessed on 14 September 2015).
- Ahrenfeldt, J.; Henriksen, U.; Jensen, T.K.; Gøbel, B.; Wiese, L.; Kather, A.; Egsgaard, H. Validation of a Continuous Combined Heat and Power (CHP) Operation of a Two-Stage Biomass Gasifier. Energy Fuels 2006, 20, 2672–2680. [Google Scholar] [CrossRef]
- Arena, U.; di Gregorio, F.; Santonastasi, M. A techno-economic comparison between two design configurations for a small scale, biomass-to-energy gasification based system. Chem. Eng. J. 2010, 162, 580–590. [Google Scholar] [CrossRef]
- Alanne, K.; Saari, A. Sustainable small-scale CHP technologies for buildings: The basis for multi-perspective decision-making. Renew. Sustain. Energy Rev. 2004, 8, 401–431. [Google Scholar] [CrossRef]
- Esteban, B.; Riba, J.R.; Baquero, G.; Puig, R.; Rius, A. Environmental assessment of small-scale production of wood chips as a fuel for residential heating boilers. Renew. Energy 2014, 62, 106–115. [Google Scholar] [CrossRef]
- Gómez, A.; Rodrigues, M.; Montañés, C.; Dopazo, C.; Fueyo, N. The potential for electricity generation from crop and forestry residues in Spain. Biomass Bioenergy 2010, 34, 703–719. [Google Scholar] [CrossRef]
- IDESCAT. Santa Coloma de Queralt—The Township in Figures. 2011. Available online: http://www.idescat.cat/emex/?id=431397#h40000 (accessed on 14 September 2015).
- IDAE. Análisis del Consumo Energético del Sector Residencial en España. Available online: http://www.idae.es/uploads/documentos/documentos_Informe_SPAHOUSEC_ACC_f68291a3.pdf (accessed on 14 September 2015).
- Eurostat. Electricity and Natural Gas Price Statistics. 2014. Available online: http://epp.eurostat.ec.europa.eu/statistics_explained/index.php/electricity_and_natural_gas_price_statistics (accessed on 14 September 2015).
- Meteorological Service of Catalonia (Meteocat). Hourly Data of UJ Automatic Weather Station; Generalitat de Catalunya: Barcelona, Spain, 2012. [Google Scholar]
- Elèctrica de Santa Coloma. High Voltage Price 3.0 Fare. 2014. [Google Scholar]
- Blumsack, S.; Richardson, K. Cost and emissions implications of coupling wind and solar power. Smart Grid Renew. Energy 2012, 3, 308–315. [Google Scholar] [CrossRef]
- Dufo-López, R.; Bernal-Agustín, J.L. Design and control strategies of PV-Diesel systems using genetic algorithms. Sol. Energy 2005, 79, 33–46. [Google Scholar] [CrossRef]
- Hernández-Moro, J.; Martínez-Duart, J.M. Analytical model for solar PV and CSP electricity costs: Present LCOE values and their future evolution. Renew. Sustain. Energy Rev. 2013, 20, 119–132. [Google Scholar] [CrossRef]
- Dufo-López, R.; Bernal-Agustín, J.L.; Mendoza, F. Design and economical analysis of hybrid PV-wind systems connected to the grid for the intermittent production of hydrogen. Energy Policy 2009, 37, 3082–3095. [Google Scholar] [CrossRef]
- Metalúrgica Riba, S.L.; Santpedor, Spain. Personal communication, 2015.
- INE. Spain: Economic and Financial Data. 2014. Available online: http://www.ine.es/dynt3/FMI/en/ (accessed on 14 September 2015).
- Agencia Tributaria. Impuesto Sobre el Valor Añadido. 2014. Available online: http://www.agenciatributaria.es/AEAT.internet/Inicio_es_ES/La_Agencia_Tributaria/Normativa/Normativa_tributaria_y_aduanera/Impuestos/Impuesto_sobre_el_valor_anadido__IVA_/Impuesto_sobre_el_valor_anadido__IVA_.shtml (accessed on 14 September 2015).
- Goodrich, A.; James, T.; Woodhouse, M. Residential, Commercial, and Utility-Scale Photovoltaic (PV) System Prices in the United States: Current Drivers and Cost-Reduction Opportunities; National Renewable Energy Laboratory: Golden, CO, USA, 2012. [Google Scholar]
- Wiser, R.; Bolinger, M. 2012 Wind Technologies Market Report; US Department of Energy: Washington, DC, USA, 2013. [Google Scholar]
- Wickwire, S. Biomass Combined Heat and Power Catalog of Technologies. Available online: http://www.epa.gov/chp/documents/biomass_chp_catalog.pdf (accessed on 16 September 2015).
- Brandin, J.; Tunér, M.; Odenbrand, I. Small Scale Gasification: Gas Engine CHP for Biofuels; Linnaeus University: Växjö, Sweden, 2011. [Google Scholar]
- OpenEI. Transparent Cost Database. 2012. Available online: http://en.openei.org/apps/TCDB/ (accessed on 14 September 2015).
- OMIE. Resultados del Mercado Diario. 2011. Available online: http://www.omie.es/inicio (accessed on 14 September 2015).
- Endesa. High Voltage Time Periods. 2014. Available online: https://www.endesaonline.com/ES/empresas/luz/tarifas_electricas_empresas_alta_tension/optima/horas/index.asp (accessed on 14 September 2015).
- Prislan, P.; Nike, K.; Jemec, T.; Piskur, M. Wood Fuel Prices—Report No.6; Biomass Trade Center: Ljubljana, Slovenia, 2014. [Google Scholar]
- OMIE. Precio Final Anual de Demanda Nacional. 2014. Available online: http://www.omie.es/files/flash/ResultadosMercado.swf (accessed on 14 September 2015).
- Alliance for Sustainable Energy. PV Watts Calculator; National Renewable Energy Laboratory (NREL): Golden, CO, USA, 2013. [Google Scholar]
- Quaak, P.; Knoef, H.; Stassen, H.E. Energy from Biomass: A Review of Combustion and Gasification Technologies; World Bank Publications: Washington, DC, USA, 1999; Volume 23–422. [Google Scholar]
- Energy Research Centre of the Netherlands (ECN). Phyllis, data base for biomass and waste. 2009. Available online: https://www.ecn.nl/phyllis2/ (accessed on 1 June 2015).
- Luna-Rubio, R.; Trejo-Perea, M.; Vargas-Vázquez, D.; Ríos-Moreno, G.J. Optimal sizing of renewable hybrids energy systems: A review of methodologies. Sol. Energy 2012, 86, 1077–1088. [Google Scholar] [CrossRef]
- Koutroulis, E.; Kolokotsa, D.; Potirakis, A.; Kalaitzakis, K. Methodology for optimal sizing of stand-alone photovoltaic/wind-generator systems using genetic algorithms. Sol. Energy 2006, 80, 1072–1088. [Google Scholar] [CrossRef]
- Bernal-Agustín, J.L.; Dufo-López, R. Efficient design of hybrid renewable energy systems using evolutionary algorithms. Energy Convers. Manag. 2009, 50, 479–489. [Google Scholar] [CrossRef]
- Gracia, C.; Burriel, J.Á.; Ibàñez, J.J.; Mata, T.; Vayreda, J. Inventari Ecològic i Forestal de Catalunya; CREAF: Bellaterra, Spain, 2000. [Google Scholar]
© 2015 by the authors; licensee MDPI, Basel, Switzerland. This article is an open access article distributed under the terms and conditions of the Creative Commons Attribution license (http://creativecommons.org/licenses/by/4.0/).
Share and Cite
González, A.; Riba, J.-R.; Rius, A. Optimal Sizing of a Hybrid Grid-Connected Photovoltaic–Wind–Biomass Power System. Sustainability 2015, 7, 12787-12806. https://0-doi-org.brum.beds.ac.uk/10.3390/su70912787
González A, Riba J-R, Rius A. Optimal Sizing of a Hybrid Grid-Connected Photovoltaic–Wind–Biomass Power System. Sustainability. 2015; 7(9):12787-12806. https://0-doi-org.brum.beds.ac.uk/10.3390/su70912787
Chicago/Turabian StyleGonzález, Arnau, Jordi-Roger Riba, and Antoni Rius. 2015. "Optimal Sizing of a Hybrid Grid-Connected Photovoltaic–Wind–Biomass Power System" Sustainability 7, no. 9: 12787-12806. https://0-doi-org.brum.beds.ac.uk/10.3390/su70912787