1. Introduction
The ambition of the Passivhaus concept is to provide appropriate indoor air quality (IAQ) and thermal comfort with minimum energy demand. The basic premise is to address thermal comfort requirements and to create an environment whereby the performance of the building fabric will be such that it permits space heating using the minimum fresh air supply required in order to maintain hygiene [
1].
For the purposes of certification, the Passivhaus Standard requires the Space Heating Demand to be <10 W/m2 of Treated Floor Area (which equates to roughly <15 kWh/(m2 a)) and the Primary Energy Demand must be <120 kWh/(m2a). This paper is concerned with factors that contribute to a building satisfying the Space Heating Demand, namely superinsulation and airtightness. The in situ performance of Mechanical Ventilation Heat Recovery systems is not a part of this study. Major features of Passivhaus buildings include:
1.1. Superinsulation
Transmission losses are limited though the provision of a high performance building envelope. The U-value of the external walls is typically in the range 0.1 to 0.15 W/(m2 K). When the building fabric is so well insulated, the proportional impact of thermal bridging becomes more pronounced. For this reason, emphasis is placed upon limiting the impact of thermal bridging. The Passivhaus Standard calculates heat loss through the use of external dimensions (unlike the England and Wales where internal dimensions are used). This means there is a tendency to overestimate heat loss providing that a visual inspection confirms the insulation is suitably continuous. The result is that Passivhaus buildings can be said to achieve zero thermal bridging. Where a visual inspection identifies significant thermal bridging, calculations are required. Visual inspection cannot be used to predict heat loss when using internal dimensions.
Windows are also superinsulated. In order to provide appropriate thermal comfort under design conditions, Passivhaus Certified windows are required to have a U-value < 0.8 W/m2K. In order to make use of passive solar gains, windows are required to have a minimum g-value of 50%.
1.2. Airtightness
Once the external envelope is superinsulated, a large proportion of the heat loss can arise from background (unintended) ventilation heat losses. For this reason, as well as reasons relating to comfort and moisture control, the Passivhaus Standard requires that air leakage (n50) be limited to <0.6 ach @ 50 Pa. This is roughly 16 times less air leakage than is permitted under the Building Regulations for England and Wales.
1.3. Mechanical Ventilation Heat Recovery
Within the heating season air quality and comfort are maintained, and ventilation heat losses minimized, through the use of heat recovery ventilation.
Typical characteristics of buildings that satisfy the Passivhaus Standard are contained in
Table 1 [
1].
Table 1.
Typical characteristics of Passivhaus buildings.
Table 1.
Typical characteristics of Passivhaus buildings.
| Requirements for the Passive House Standard | Recommended | Best Practice |
|---|
| Heating energy demand Qh (kW h/(m2a)) | <15 | ≤10 |
| Primary energy demand, PE (kW h/(m2a)) | <120 | ~72/0 |
| Volume related air leakage at 50 Pa, n50 (h-1) | <0.6 | ≤0.2 |
| Component or Construction | | |
| Insulation of opaque envelope, U-value (W/m2 K) | <0.15 | 0.06 |
| Thermal bridge free construction, i.e., | | |
| Linear thermal transmittance, ye (W/(m K)) | <0.01 | <0 |
| Glazing with low U-value and high g-value, i.e., | | |
| Thermal transmittance, Ug (W/(m2 K)) | <0.8 | 0.51 |
| Total solar energy transmittance, g-value (%) | >50 | 58 |
| Window, thermal bridge free construction, insulated frame, Uw (W/(m2 K)) | <0.8 | 0.75 (with Ug = 0.7 W/(m2 K)) |
| Air leakage | <0.6 h−1 at 50 Pa | <0.2 h−1 at 50 Pa |
| Heat recovery with | | |
| Net efficiency, hHE (%) | >75 | 92 |
| Heat loss through casing | <5 W/K | |
| Internal and external leakages (%) | <3 | <1 |
| Electric energy demand for ventilation (including control), pel (W/(m3/h)) | <0.45 | 0.3 |
| Largely reduced losses in the heating installation (including DHW) | | |
| Energy efficient electric appliances (e.g., highest EU appliance energy-label class) | Class A | <60% of Class A average |
| Recommended limit for primary energy use for household electricity (part of PE requirement), PE (kW h/(m2 a)) | <55 | 27 (assuming European electricity mix) |
The CEPHEUS (Cost Efficient Passive Houses as European Standards) project was used to investigate the potential for introducing the Passivhaus Standard to the European market. Evaluation of the houses in these projects primarily focused upon the in-use energy and internal environmental performance of the occupied buildings [
2]. Questions regarding other aspects of the
in situ thermal performance of the building fabric were not addressed. One of the only published sources available are the results obtained from a coheating test undertaken on a dwelling situated in Heusden-Zolder, Belgium which was tested between March and April 2004 (see [
3,
4]). However, this test suffered from a number of issues, such as uneven distribution of heat within the dwelling, temperature stratification and experimental overheating.
In order to address the lack of published data, this paper presents one of the most comprehensive sets of results available on the in situ whole dwelling building fabric performance of Passivhaus dwellings.
2. A UK Context
Research in the UK has recognised that designs (theoretical practices) once built are not delivering the actual energy savings that have been predicted. One significant cause of this has been attributed to thermal bypass [
5,
6]. Thermal bypass is described as heat transfer that bypasses the conductive or conductive radiative heat transfer between two regions [
7].
In preparation for the construction of the Racecourse Development, Siddall [
8] observed that because the Passivhaus Standard only directly addresses one form of convective thermal bypass (airtightness) two remaining forms were unaddressed; namely wind tightness and closed loop bypass.
“Open loop” convection arises when one air mass is replaced by another. In this situation air gaps permit airflow, and thus heat transfer, between two regions. Theoretically, poor wind tightness need not result in infiltration of the air barrier. In the case of wind tightness, Deseyve and Bednar [
9] established that in one property the
U-value fluctuated by 660% as a result of bulk air movement through the insulation. This impacts upon thermal comfort and energy demand. Uvsløkk [
10] examined the impact of wind tightness upon thermal performance and proposed a wind tightness standard whereby the infiltration of external air should be limited so that the
in situ U-value does not exceed the notional
U-value by more than 5%.
“Closed loop” convection may occur when temperature differences exist at the boundaries and air gaps permit re-circulatory air flow. This phenomenon may not always contribute to the net exchange of indoor air with the outside,
i.e. it does not constitute air infiltration. With regard to closed loop bypass, Lecompte [
11] used cavity wall construction (notional
U-value was 0.34 W/m
2 K) to demonstrate that heat loss increased by 193% when there was a 10 mm gap between the insulation and the warm side of the internal leaf of blockwork, a 40 mm gap between the insulation and the external masonry and gaps at the head and foot of the insulation. Under similar conditions, it was also established that a 3 mm gap resulted in a 158% increase in heat loss. As the notional (design)
U-value is improved, the proportional impact of these air gaps can be expected to increase.
Research reported by Wingfield
et al. [
12] raised concerns about significant thermal bypass occurring at the party wall (the measured party wall
U-value was roughly 0.6 W/m
2 K; compared to the regulatory assumption of 0 W/m
2 K). An experimental remedial measure using a cavity sock resulted in an amended party wall
U-value of 0.1 to 0.2 W/m
2 K. Clearly, in the context of Passivhaus dwellings (or the performance gap), this extent of heat loss remains unacceptable. For this reason, at the Racecourse Development, Siddall experimented with using a membrane to close the party wall cavity [
8].
Based upon the above, it can be appreciated that these heat loss mechanisms do not constitute air infiltration. This means that pressurisation tests, conducted in accordance with BS EN 13829, are an unsuitable means of determining the acceptability of performance.
Protokollband 18 [
13] forms the basis for the quality assurance requirements of Passivhaus buildings. The Protokollband discusses factors often associated with convective thermal bypass, however, it specifically addresses external wall insulation technology and does not consider party wall conditions, timber-frame or cavity wall systems, all of which are common in the UK. (It should also be noted that Protokollband 18 is only available in the German language).
The Passivhaus Planning Package (PHPP) is the principle design tool for Passivhaus buildings. As a steady-state predictive model, it is unable to consider the full implications of thermal bypass mechanisms.
Within the context of the UK construction industry, two questions arise:
- (1)
Without directly addressing thermal bypass on all counts, can the Passivhaus Standard provide a credible level of Quality Assurance?
- (2)
By making efforts to address heat loss arising from the three modes of thermal bypass, as well as conduction, is it possible to close the energy performance gap?
3. Methods
In order to assess whether the thermal performance of the building fabric as-designed has been achieved in practice, this paper has compared the steady-state predicted heat loss of a small number of Certified Passivhaus dwellings located in the UK with their corresponding in situ measured heat loss.
The steady-state predicted heat loss associated with each of the Passivhaus Certified dwellings has been obtained from the Passive House Planning Package (PHPP) predictions. PHPP is a planning tool that enables a number of energy balance calculations to be undertaken for a proposed building. As part of the Passivhaus Certification process, it is a mandatory requirement that each Passivhaus dwelling is modelled and verified using PHPP.
The measured
in situ heat loss of each of the Passivhaus Certified dwellings has been obtained by undertaking an electric coheating test (see [
14,
15,
16,
17]. An electric coheating test is quasi steady-state aggregate test method that has been developed to measure the whole dwelling heat loss (both transmission and infiltration) attributable to an unoccupied dwelling
in situ. It is termed a “quasi-steady-state” or a “quasi-static” test method as the internal conditions within the tested dwelling are artificially held at a predetermined static state, whilst the external conditions are allowed to vary naturally (dynamically) in response to the external climatic conditions.
Alternatives to the quasi steady-state electric coheating test do exist. A small number of dynamic aggregate test methods have been devised. These include: ISABELE [
18], the Primary and Secondary Terms-Analysis and Renormalization (PSTAR) method [
19,
20,
21] and the Quick U-value of Buildings (QUB) method [
22]. Although the dynamic methods offer the advantage of much shorter test durations than is required by the quasi steady-state coheating test method, the analysis of the data obtained from these test methods tends to be significantly more complex. In addition, the results obtained from using the PSTAR method have been questioned [
23] and the ISABELE and QUB methods are currently under development, so their use has been primarily limited to research and development purposes. Consequently, the only method that has been utilised in any significant numbers in the UK is the electric coheating test method.
In 2010, electric coheating became recognised as an established test method in the UK when the protocol developed by Wingfield
et al. [
17] was incorporated within the Post Construction and Initial Occupation studies undertaken under the Technology Strategy Boards (now Innovate UK’s) Building Performance Evaluation Programme [
24]. The main aim of this programme was to understand the key factors that influence the in-use performance of buildings [
24]. Another advantage associated with undertaking an electric coheating test is that the heat loss figure obtained from the test is directly comparable to the steady-state heat loss figure that is predicted using the appropriate national calculation methodology. In the UK, for domestic buildings, the national calculation methodology is the Government’s Standard Assessment Procedure (SAP) [
25].
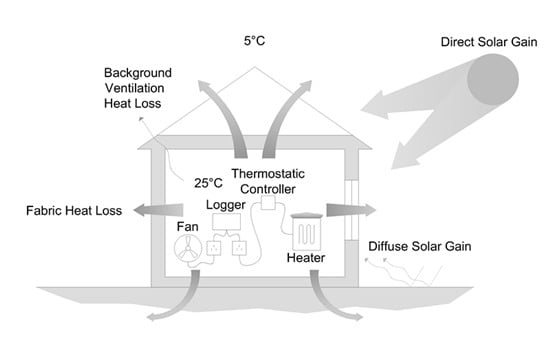
The electric coheating test method involves artificially heating all of the interior spaces contained within the thermal envelope of an unoccupied dwelling to a mean elevated and homogeneous internal temperature. It does so by using strategically positioned, thermostatically controlled, electric resistance point heaters. To ensure that the internal air is appropriately mixed, and to minimise any potential temperature stratification, electrically powered air circulation fans are also strategically positioned within the dwelling (see
Figure 1). Once the building fabric is fully heat saturated and is in thermal equilibrium with the indoor conditions, the mean internal temperature is maintained constant for a specified period of time, typically between 7 to 21 days. In the UK, the mean elevated internal temperature is normally set at 25 °C for new build dwellings, although lower temperatures are often used in existing dwellings prior to refurbishment, particularly those that have poor levels of airtightness and thermal insulation.
A mean elevated temperature of 25 °C is often used for a number of reasons. First of all, it ensures that there is sufficient temperature difference between the inside and the outside of the dwelling (ΔT) throughout the test period. Normally, at least a 10 K ΔT or more is recommended. Secondly, it ensures that the direction of the heat flow is predominantly monodirectional from the inside to the outside of the dwelling. By undertaking the tests during the winter heating season (October/November to March/April), monodirectional heat flow is also ensured. Thirdly, it reduces the potential for midday overheating to occur within the dwelling and the subsequent impact that this may have on heat storage effects. Fourthly, it enables the heating season to be artificially extended beyond the period that would normally be experienced within the dwelling. Finally, the adoption of 25 °C as the internal set point temperature also ensures that the mean internal temperature of the dwelling lies within the range of temperatures that would normally be expected to be experienced within the dwelling during occupation. This avoids the occurrence of non-representative heat loss mechanisms and avoids placing any unnecessary thermal stresses on the building that may cause undue degradation of the building fabric.
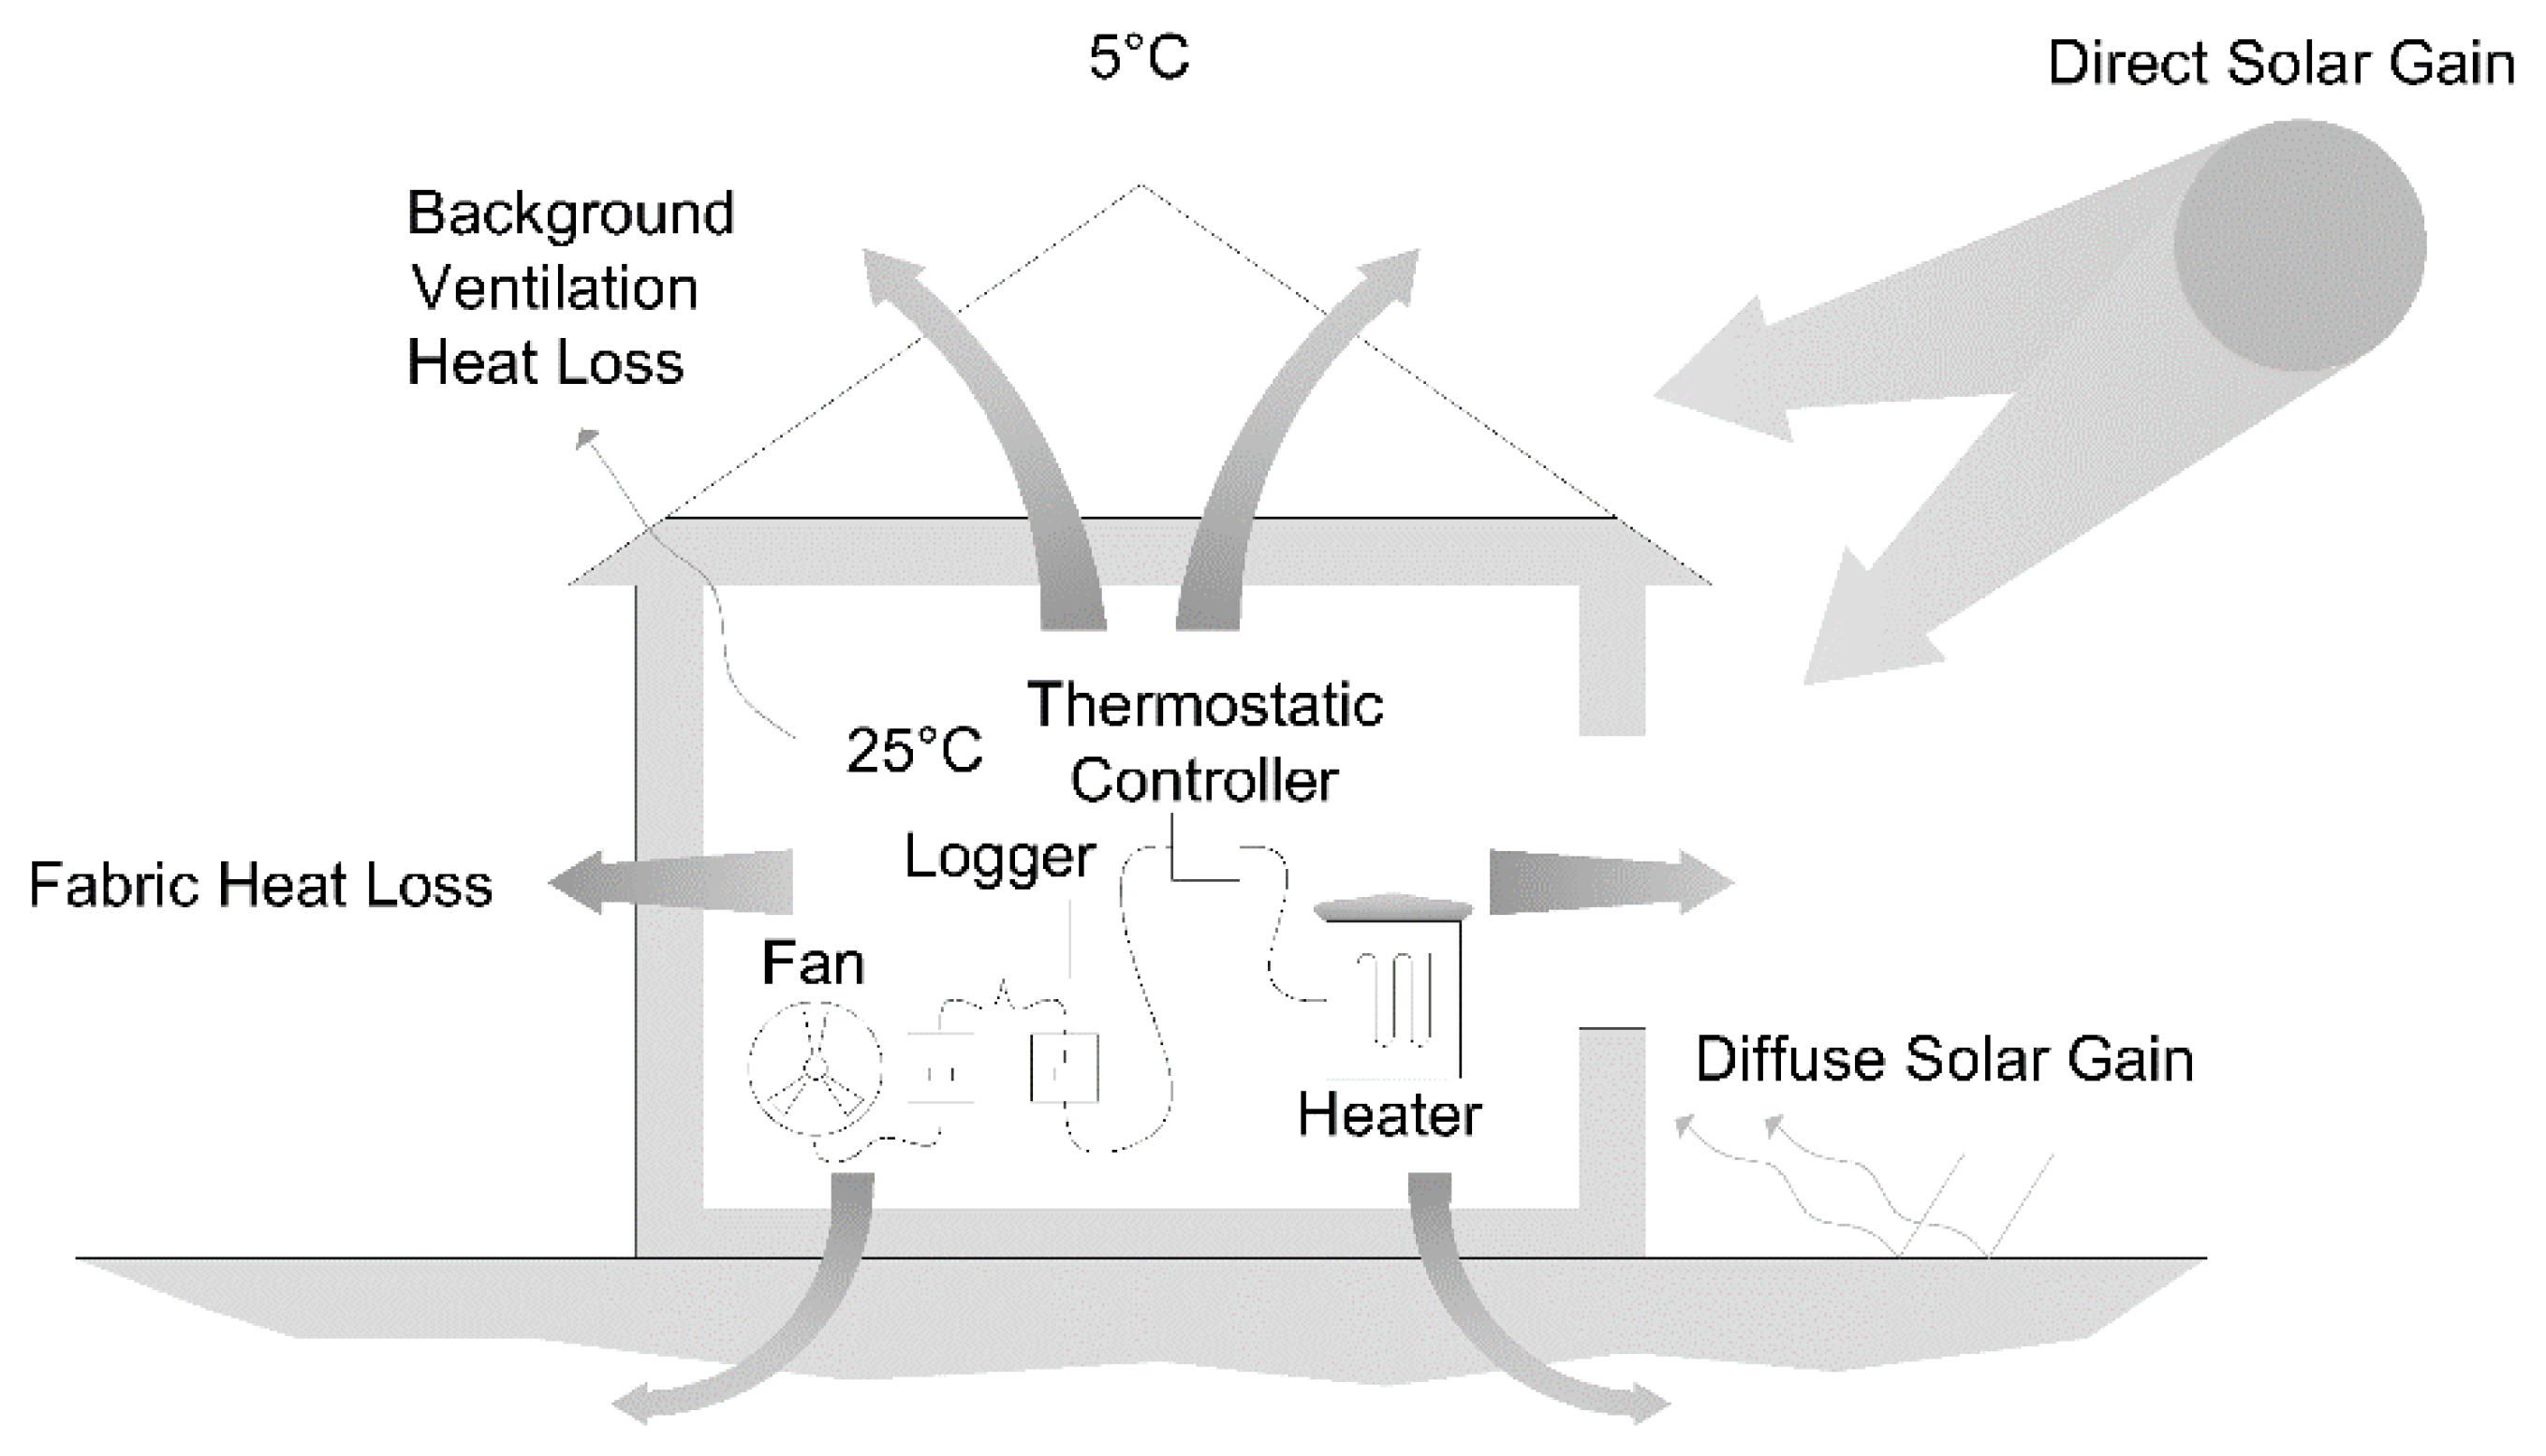
During the electric coheating test, numerous internal and external parameters are measured. These include: internal and external air temperatures, solar radiation and the total electrical power input to the dwelling. By measuring these various parameters, the total daily heat input to the dwelling in Watts, that is required to obtain a particular ΔT in K, can be established. If the daily heat input (W) is plotted against the daily mean temperature difference between the inside and outside of the dwelling (ΔT), then the raw uncorrected heat loss coefficient (HLC) is determined (W/K) from the resultant gradient of the plotted trend line (see
Figure 2). The raw uncorrected heat loss coefficient can then be corrected using multiple linear regression analysis techniques to take into account external environmental effects, such as solar radiation. Further details regarding the analysis techniques that can be used along with a description of the latest version of the electric coheating test method can be found within Johnston
et al. [
26].
Figure 1.
Diagrammatic representation of an electric coheating test [
27].
Figure 1.
Diagrammatic representation of an electric coheating test [
27].
Figure 2.
Example plot of the raw uncorrected data obtained from an electric coheating test.
Figure 2.
Example plot of the raw uncorrected data obtained from an electric coheating test.
4. Case Study Dwellings
In the UK, only a small number of Certified Passivhaus dwellings have been the subject of an electric coheating test. In total, tests have been undertaken on seven dwellings across five separate Passivhaus developments. On two of these developments, the Racecourse Development and Future Works, two separate dwellings have been tested. All of the dwellings, apart from Ford Close, were tested as part of the Technology Strategy Board’s Building Performance Evaluation Programme [
24].
The dwellings that have been tested vary in terms of their size, form and main construction type. In addition, they have been constructed in a diverse range of geographic locations by different clients, designers and construction teams. Details of the individual dwellings and their main form of construction are contained within
Table 2 and
Table 3.
Table 2.
Details of the tested dwellings.
Table 2.
Details of the tested dwellings.
| Dwelling | Form | No. of Storeys | Main External Wall Construction | Gross Floor Area (m2) |
|---|
| Racecourse Development Dwelling 1 | End-terrace bungalow | 1 plus mezzanine plant area | Pre-fabricated timber-frame cassette | 66 |
| Racecourse Development Dwelling 2 | Mid-terrace bungalow | 1 plus mezzanine plant area | Pre-fabricated timber-frame cassette | 66 |
| Lancaster Co-housing | End-terrace | 2 | Full fill masonry cavity | 65 |
| Future Works Passivhaus Larch house | Detached | 2 | Timber-frame | 99 |
| Future Works Passivhaus Lime house | Detached | 2 | Timber-frame | 76 |
| Ford Close | Mid-terrace | 2 | Pre-fabricated timber-frame cassette | 91 |
| Camden Passivhaus | Detached | 2 | Pre-fabricated timber-frame | 118 |
Table 3.
Main form of construction for the tested dwellings.
Table 3.
Main form of construction for the tested dwellings.
| Dwelling | Ground Floor | External Walls | Roof |
|---|
| Racecourse Development Dwellings 1 and 2 | Reinforced concrete ground bearing floor slab, with 300 mm insulation above the slab and 50 mm screed. Design U-value of 0.08 W/m2K. | Pre-fabricated timber-frame cassettes filled with 300 mm insulation and clad externally with 15 mm bitroc and brick or render. Internally, a 47 mm insulated service void lined with 25 mm plasterboard. Design U-value of 0.10 W/m2K. | Pre-fabricated timber-frame cassette filled with 450 mm insulation and clad in clay roof tiles. Design U-value of 0.08 W/m2K. |
| Lancaster Co-housing | 22 mm thick tongue and grooved softwood floating floor over 150 mm reinforced concrete ground bearing floor slab on 250 mm of EPS insulation. Design U-value of 0.12 W/m2K. | Two coat wet plaster internal wall finish, 100 mm blockwork, 300 mm cavity fully-filled with mineral wool insulation, 100 mm blockwork and an 8–10 mm render. Design U-value of 0.12 W/m2K. | Bobtail trussed rafter pitched roof construction insulated at ceiling level with 500 mm of mineral wool insulation quilt. Design U-value of 0.09 W/m2K. |
| Future Works Passivhaus Larch house | 480 mm expanded polystyrene under a concrete ground floor slab and screed. Design U-value of 0.07 W/m2K. | Timber-frame with 225 mm insulation between the studs and clad externally with 100 mm rigid wood fibre insulation and clad in larch. Internally, a 100 mm insulated service void lined with 15 mm plasterboard. Design U-value of 0.10 W/m2K. | Cold pitched roof with 560 mm glass wool insulation laid horizontally within loft space. Design U-value of 0.06 W/m2K. |
| Future Works Passivhaus Lime house | 480 mm expanded polystyrene under a concrete ground floor slab and screed. Design U-value of 0.07 W/m2K. | Timber-frame with 225 mm insulation between the studs and clad externally with 100 mm rigid wood fibre insulation and lime render. Internally, a 100 mm insulated service void lined with 15 mm plasterboard. Design U-value of 0.10 W/m2K. | Cold pitched roof with 560 mm glass wool insulation laid horizontally within loft space. Design U-value of 0.06 W/m2K. |
| Ford Close | Beam-and-block floor with 150 mm PIR insulation above the floor and screed finish. Design U-value of 0.15 W/m2K. | Pre-fabricated timber-frame cassette clad externally with 9 mm wood fibre board and rendered. Design U-value of 0.10 W/m2K. | Trussed rafter pitched roof Insulated at rafter level with 500 mm+ blown insulation. Design U-value of 0.08 W/m2K. |
| Camden Passivhaus | Ground bearing floor slab with 380 mm wood fibre insulation in the floor. Design U-value of 0.10 W/m2K. | Concrete retaining lower walls to rear and side elevations of dwelling. Pre-fabricated timber framed cassette upper walls filled with 280 mm mineral wool, clad externally in European larch and internally lined with 100 mm wood fibre insulation. Design U-value of 0.13 W/m2K retaining walls and 0.12 W/m2K upper walls. | Flat and sloping green roof containing 380 mm mineral wool in sloping section and 280 mm PUR and 120 mm mineral wool in flat section. Design U-value of 0.08 W/m2K flat roof and 0.12 W/m2K sloping roof. |
Further details regarding the dwellings that have been tested can be obtained from Cambridge Architectural Research Ltd. [
28,
29], Guerra-Santin
et al. [
30], Johnston and Fletcher [
31], Johnston and Stevenson [
32], Randall Simmonds [
33] and Stamp [
34].
In terms of the electric coheating tests, all of the electric coheating tests were undertaken during the winter of 2011/12. The specific time periods associated with each test and the total number of days incorporated within the electric coheating analysis are as follows:
Racecourse Development Dwellings 1 and 2—November/ December 2011, 33 days.
Future Works Passivhaus Larch house—February/March 2012, 15 days.
Future Works Passivhaus Lime house—February/March 2012, 18 days.
Ford Close—February/March 2012, 11 days.
Camden Passivhaus—March 2012, 8 days.
5. Results and Discussion
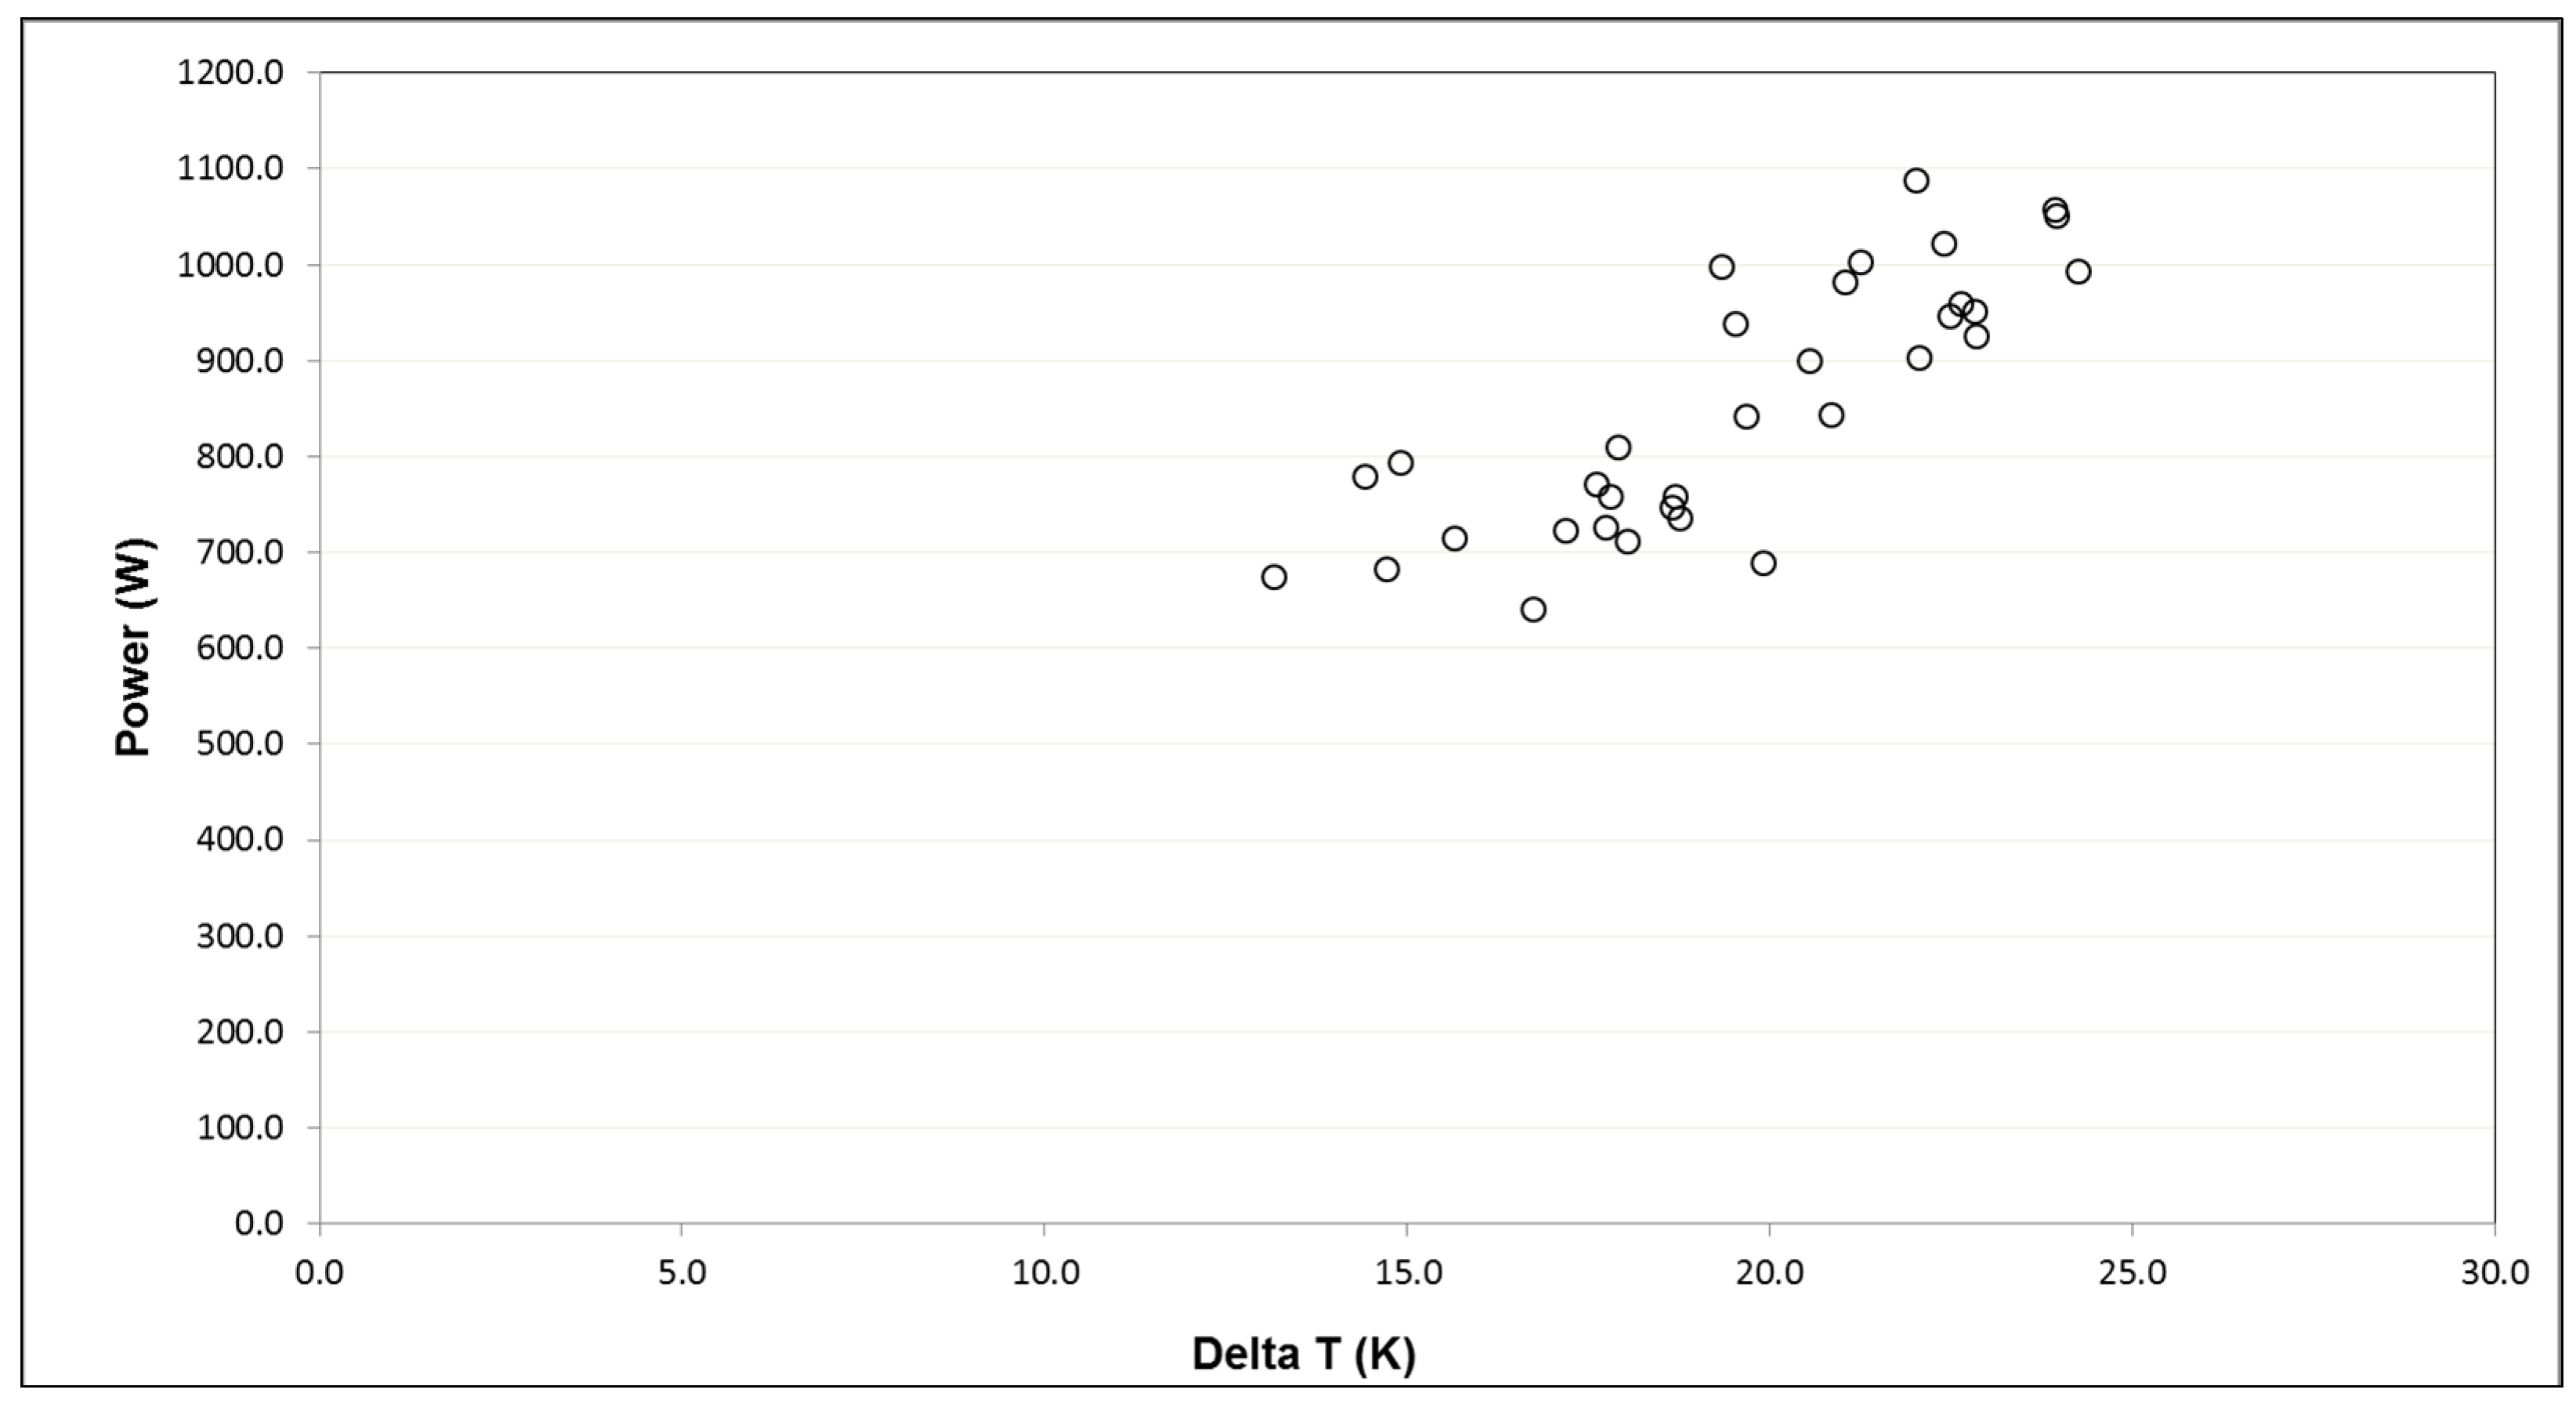
The electric coheating test results for all seven tested case study dwellings are illustrated in
Table 4 and
Figure 3. For comparative purposes, the measured heat loss coefficient (HLC) obtained from the coheating test has been compared against the predicted steady-state HLC. The predicted steady-state HLC has been obtained from the PHPP assessments that were submitted for certification purposes and represent the original design intent for each of the case study dwellings. For all of the measured HLC values, the standard error associated with the regression analysis has also been included within the figure. Unfortunately, no standard error has been published for the Ford Close result, so it has not been possible to include this error bar within
Figure 3.
Table 4.
Coheating Test results for the UK Passivhaus case study dwellings.
Table 4.
Coheating Test results for the UK Passivhaus case study dwellings.
| Dwelling | Predicted HLC in W/K | Measured HLC in W/K | Difference in HLC in W/K (%) |
|---|
| Racecourse Development Dwelling 1 | 40.3 | 46.7 ± 0.5 | 6.3 (15.7) |
| Racecourse Development Dwelling 2 | 35.8 | 38.1 ± 0.5 | 2.2 (6.2) |
| Lancaster Co-housing | 40.0 | 47.3 ± 0.5 | 7.3 (18.3) |
| Future Works Passivhaus Larch house | 57.6 | 62.0 ± 4.0 | 4.4 (7.6) |
| Future Works Passivhaus Lime house | 37.2 | 45.0 ± 2.0 | 7.8 (21.0) |
| Ford Close | 45.6 | 50.4 | 4.8 (10.5) |
| Camden Passivhaus | 66.0 | 56.0 ± 5.0 | −10.0 (−15.2) |
Figure 3.
Measured and predicted HLC for each of the case study dwellings.
Figure 3.
Measured and predicted HLC for each of the case study dwellings.
It should be noted that although all of the electric coheating tests have been undertaken in accordance with the 2010 version of the Leeds Beckett University (formerly Leeds Metropolitan University) test method [
17], the tests were not all undertaken by the same testing team. Instead, four separate teams undertook the electric coheating tests, all with varying degrees of electric coheating testing experience. For some of the teams, the test represented the first electric coheating test undertaken by the team, whilst at the other end of the spectrum, one of the teams had undertaken in excess of 30 electric coheating tests prior to testing these dwellings. Consequently, there is a potential risk that this inconsistency in testing experience may lead to some uncertainty with regard to the results that have been obtained and their interpretation. This needs to be considered when interpreting the results derived from any comparisons that are made between the test results. These matters notwithstanding, recent work undertaken by the NHBC Foundation [
35] which reviewed the coheating test methodology found that broadly similar results were obtained by six different teams, from both academia and industry, when they sequentially tested the same dwelling over a different two week measurement period using their own version of the coheating test method. The HLC measured by the teams varied between 56.7 W/K and 77.1 W/K, compared to a calculated steady-state value of 68.4 W/K. These results suggest that the electric coheating test method is relatively robust.
The results contained within
Table 4 and
Figure 3 illustrate that not only were the case study dwellings predicted to vary in terms of their building fabric performance, which is understandable given the different sizes and forms of the dwellings, but most importantly, in all but one of the cases (Camden Passivhaus) the measured performance obtained from the electric coheating test exceeded the predicted performance obtained from PHPP. This indicates the presence of a building fabric “performance gap” in all but one of the Passivhaus Certified case study dwellings.
In terms of the Camden Passivhaus dwelling, it is not entirely clear why this is the only case study dwelling where the measured HLC from the electric coheating test was lower than the predicted HLC. However, closer examination of this case study dwelling reveals that there are a number of factors that may have acted in combination that may have contributed to the result obtained. First of all, the ground floor of the dwelling is partially excavated, resulting in a large proportion of the side and rear ground floor external walls being retaining walls. Consequently, a significant proportion of the dwellings thermal envelope is in direct thermal contact with the surrounding ground, rather than the surrounding air, complicating the analysis of the data. Secondly, the external air temperature sensor was located in a sheltered position for the duration of the test, which may have artificially suppressed the ΔT measured, potentially resulting in an underestimation of the measured HLC. Finally, there may have been some errors in the predicted HLC, particularly with respect to the U-value of the retaining external wall, which may have led to a potential “prediction gap”. Given the above reasons, the coheating test results obtained for the Camden Passivhaus are considered to be an outlier and have been excluded from any further analysis.
Closer analysis of the data contained within
Figure 3 reveals that the size of the gap in percentage terms varies significantly between the dwellings, from just over 6% for Dwelling 1 at the Racecourse Development to just over 20% for the Lime House at Future Works. However, considerable caution should be exercised when using such a metric, as this metric tends to unfairly penalise those that have a very low predicted steady-state HLC to begin with, such as Passivhaus dwellings.
A more appropriate metric for comparative purposes would be to use the absolute difference in HLC between the predicted and the measured performance. Using such a metric results in a very small absolute difference in HLC for all of the tested dwellings, ranging from just over 2.0 W/K for Dwelling 2 at the racecourse Development to just under 8.0 W/K for the Lime House at Future Works.
If one also takes into account the various uncertainties associated with undertaking an electric coheating test, then the size of the building fabric “performance gap” measured for the case study Passivhaus dwellings is very small in absolute terms and is significantly smaller than the size of the building fabric “performance gap” measured in non-Passivhaus dwellings (see
Section 6 below). Therefore, from this very limited study, it would appear that the
in situ performance of the building fabric associated with the case study dwellings is more or less as predicted, suggesting that in terms of building fabric performance, Certified Passivhaus dwellings can in fabric performance terms deliver “what is says on the tin”.
6. Results in Context
As previously discussed in the introduction, there is a distinct absence of
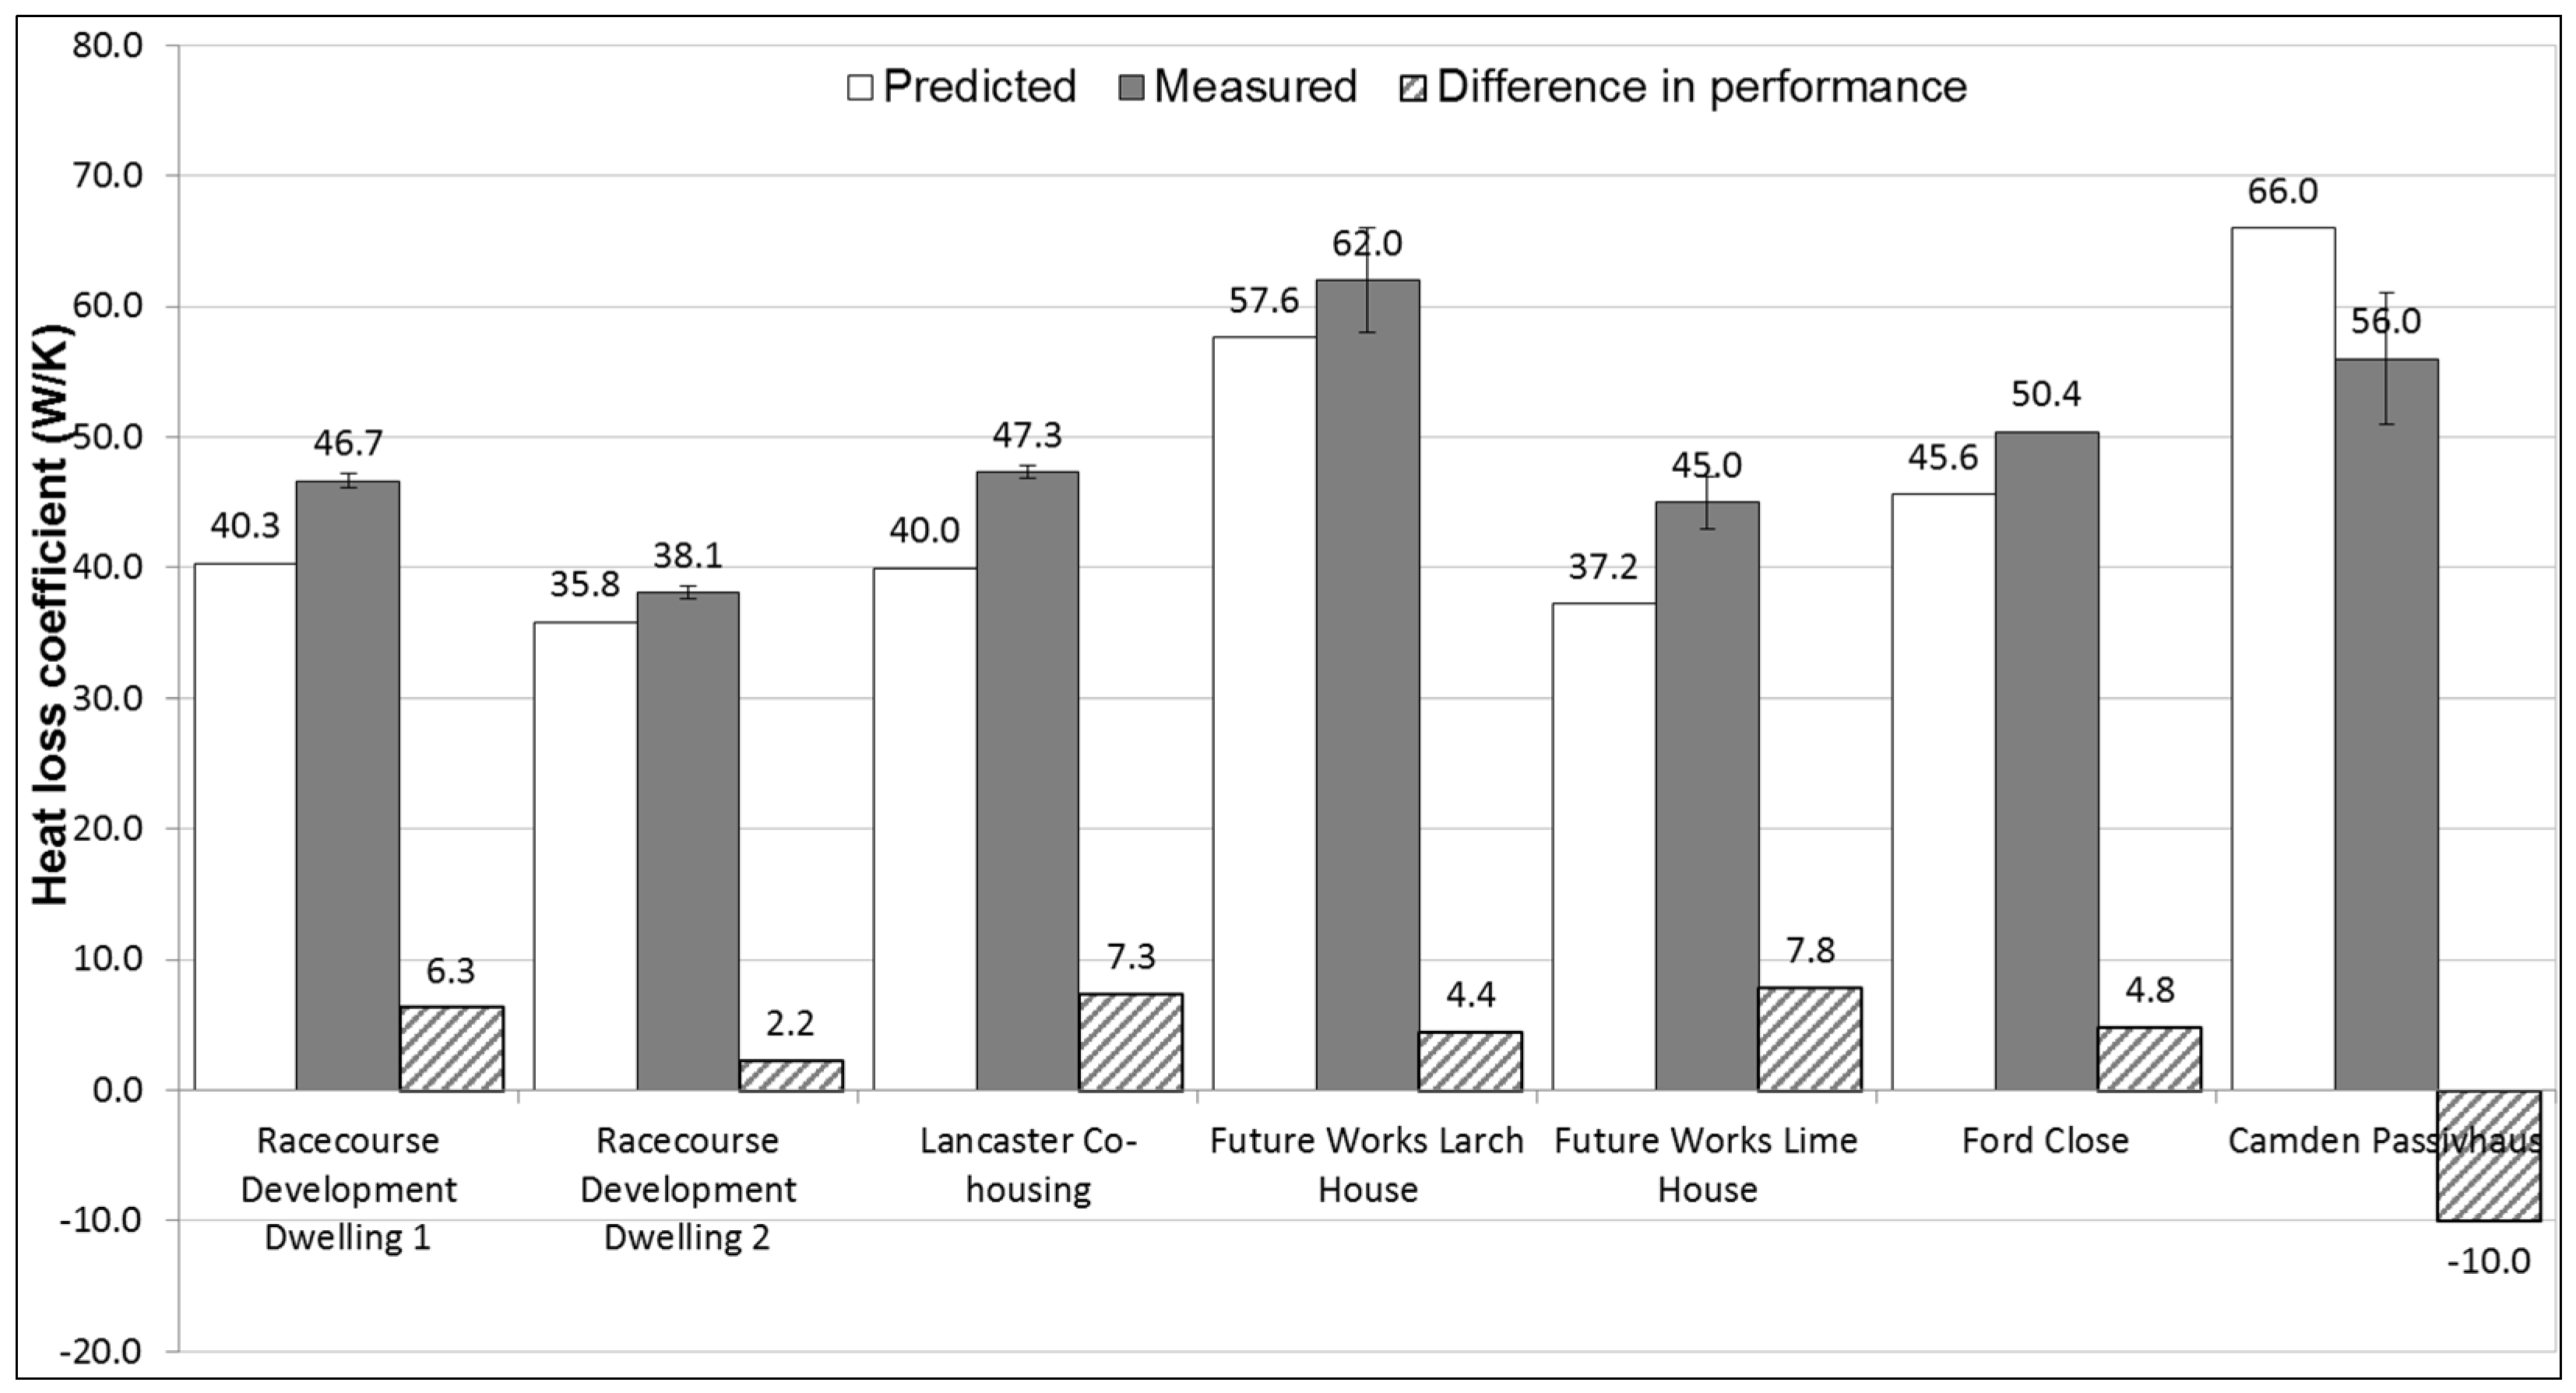
in situ building fabric performance data on Passivhaus Certified dwellings, both in the UK and abroad. Therefore, in order to be able to set the results obtained from the case study dwellings in context, the electric coheating test results have been compared against the electric coheating test results of 27 other new build dwellings (see
Figure 4 and
Figure 5), all of which were originally designed to meet, or in some cases significantly exceed, the building fabric thermal performance requirements contained within Part L1A of the UK Building Regulations 2006 [
36]. These results have been obtained from one of the largest and most comprehensive databases of electric coheating data currently available in the UK, the Leeds Beckett Coheating Database (see
Table 5).
Figure 4.
Measured HLC versus steady-state predicted HLC of the Passivhaus case study dwellings and the Leeds Beckett new-build coheating database.
Figure 4.
Measured HLC versus steady-state predicted HLC of the Passivhaus case study dwellings and the Leeds Beckett new-build coheating database.
Figure 5.
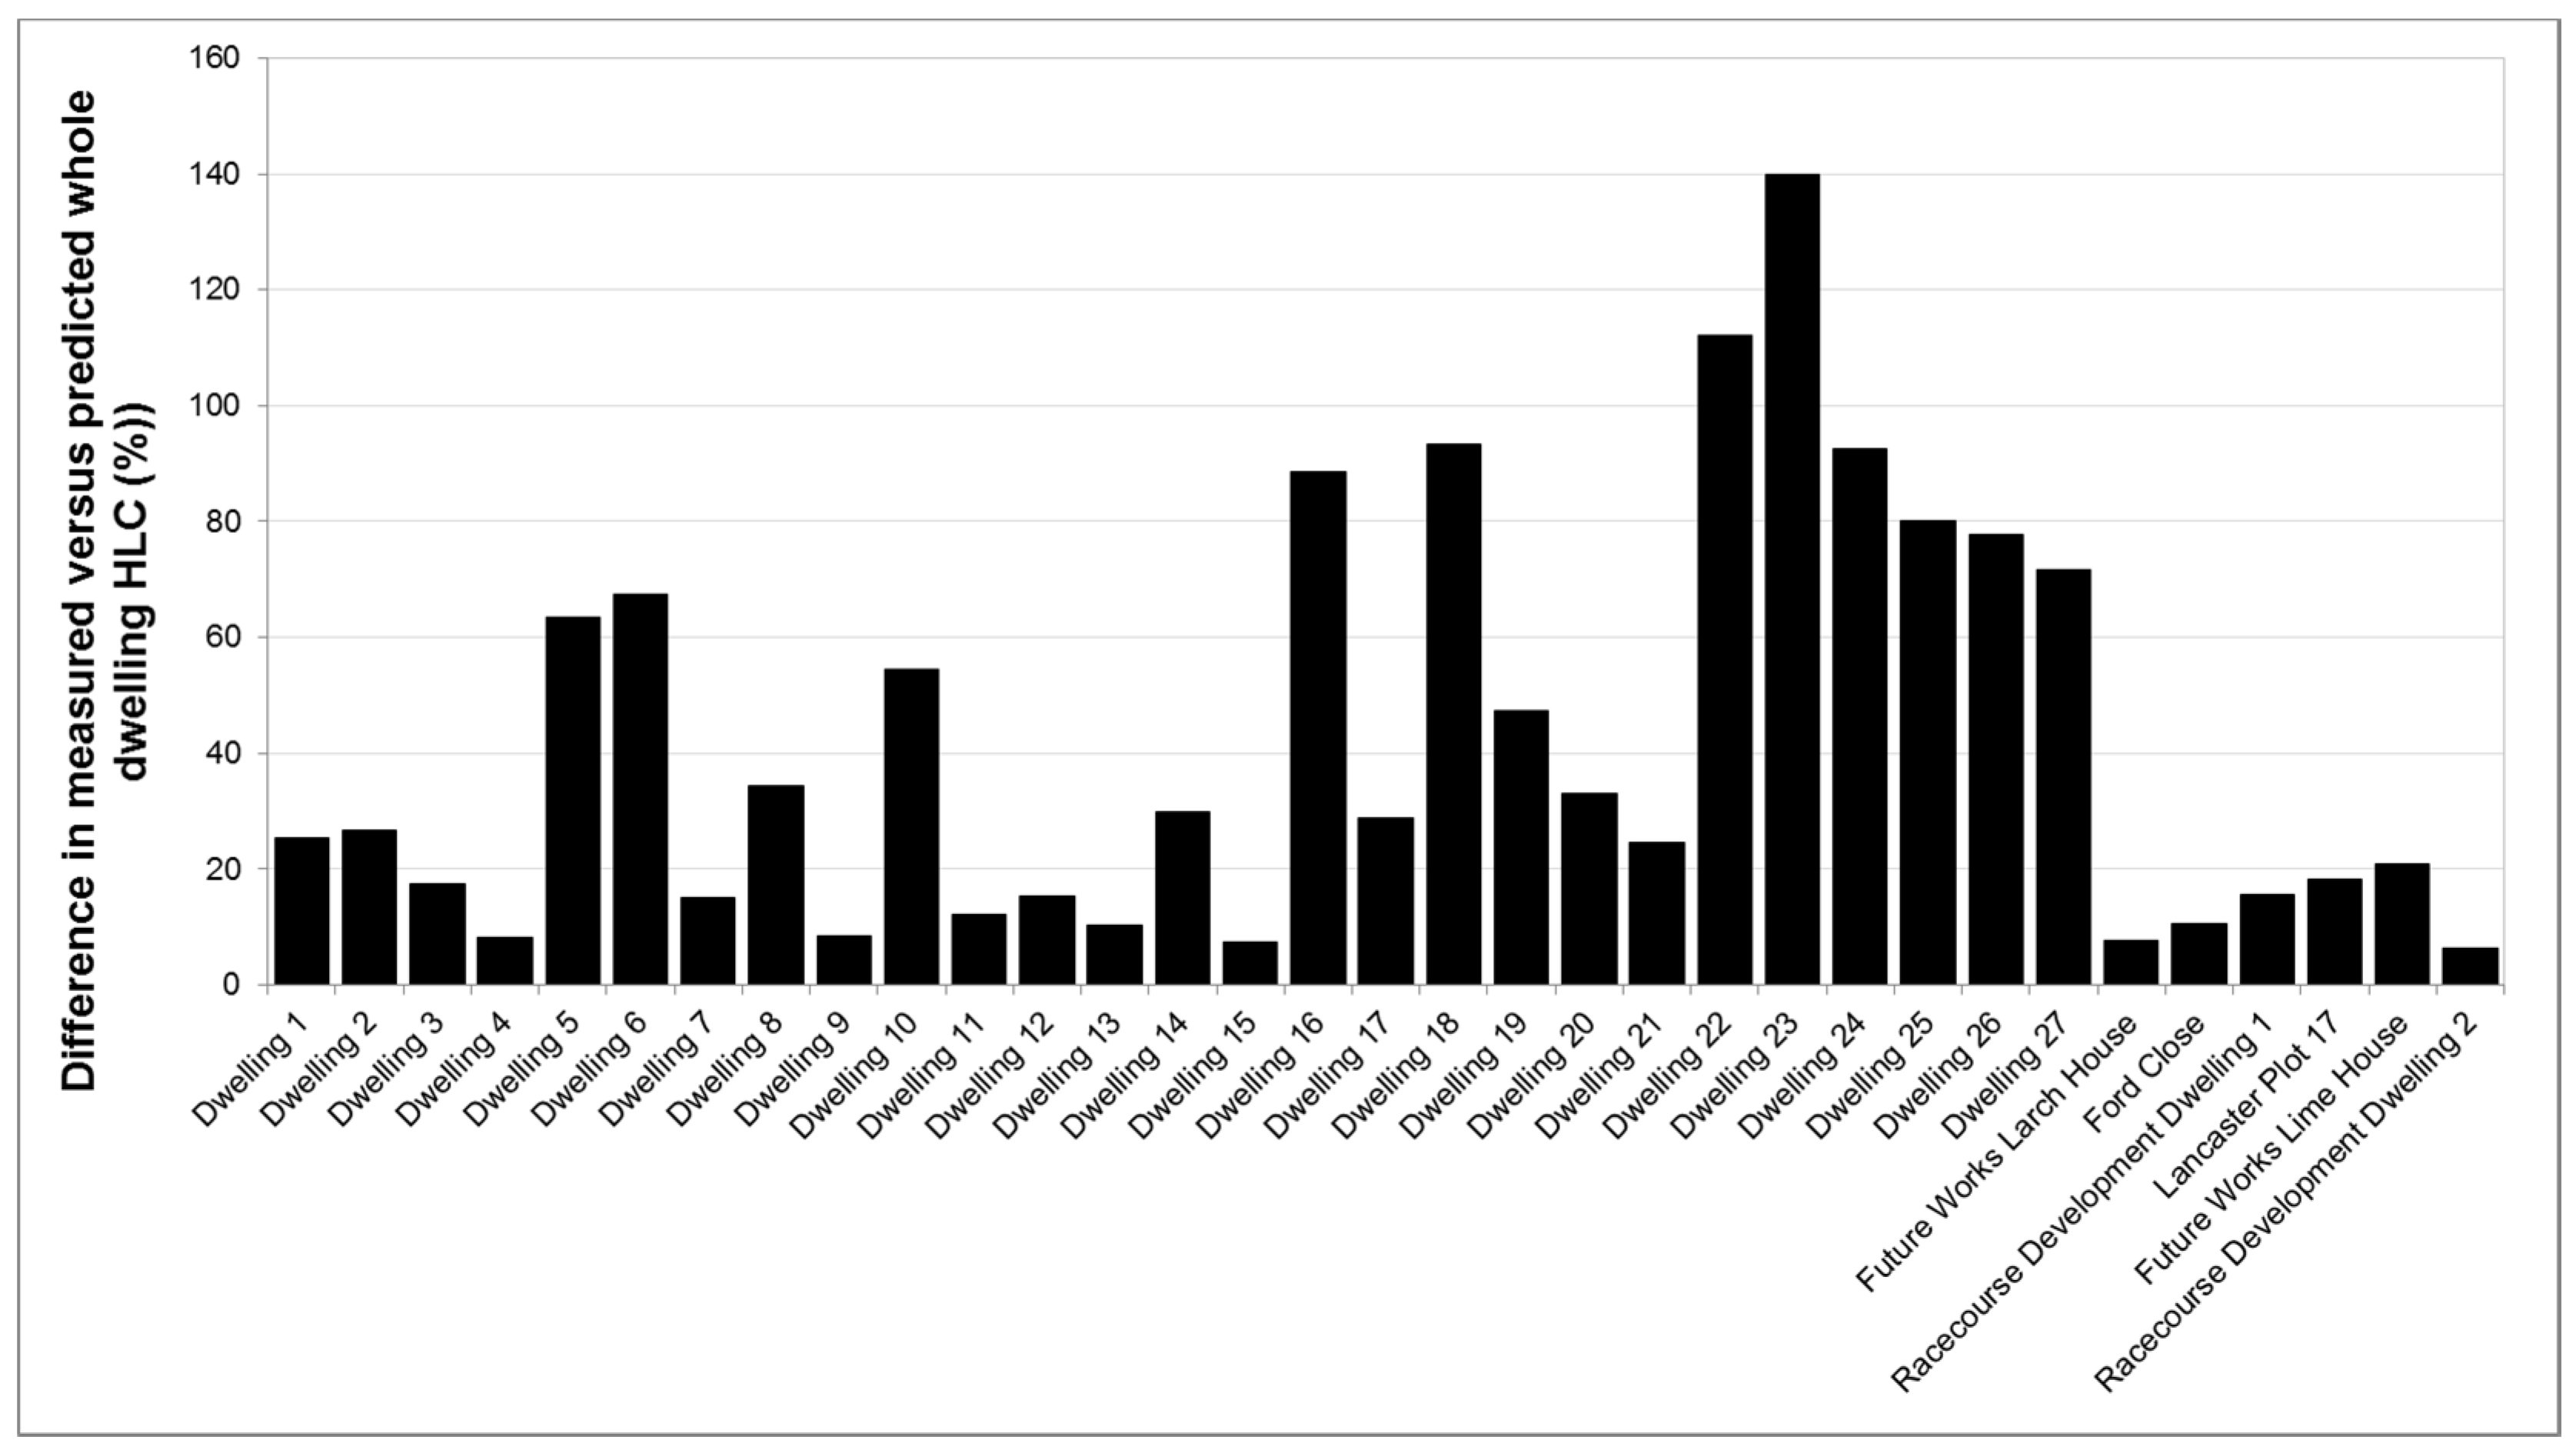
Difference in the measured versus steady-state predicted HLCs of the case study dwellings and the Leeds Beckett new-build coheating database.
Figure 5.
Difference in the measured versus steady-state predicted HLCs of the case study dwellings and the Leeds Beckett new-build coheating database.
Table 5.
Size, built form and main construction type of the new build dwellings contained within the Leeds Beckett coheating database.
Table 5.
Size, built form and main construction type of the new build dwellings contained within the Leeds Beckett coheating database.
| Dwelling | Main External Wall Construction | Form Factor | Gross Floor Area (m2) |
|---|
| Dwelling 1 | partial fill masonry | detached | 167.5 |
| Dwelling 2 | full-fill masonry | detached | 108.9 |
| Dwelling 3 | partial fill masonry | end-terrace | 101.0 |
| Dwelling 4 | timber-frame | semi-detached | 86.7 |
| Dwelling 5 | other | detached bungalow | 157.0 |
| Dwelling 6 | partial fill masonry | end-terrace | 102.2 |
| Dwelling 7 | thin joint masonry | detached | 151.8 |
| Dwelling 8 | full-fill masonry | end-terrace | 107.5 |
| Dwelling 9 | timber-frame | semi-detached | 86.4 |
| Dwelling 10 | timber-frame SIPS panel | end-terrace | 117.0 |
| Dwelling 11 | timber-frame SIPS panel | detached | 154.5 |
| Dwelling 12 | full-fill masonry | end-terrace | 94 |
| Dwelling 13 | full-fill masonry | end-terrace | 94 |
| Dwelling 14 | thin joint masonry | end-terrace | 141 |
| Dwelling 15 | thin joint masonry | end-terrace | 141 |
| Dwelling 16 | partial fill masonry | end- terrace | 83.4 |
| Dwelling 17 | thin joint masonry | mid-terrace | 141 |
| Dwelling 18 | full-fill masonry | end-terrace | 141.0 |
| Dwelling 19 | thin joint masonry | semi-detached | 90.4 |
| Dwelling 20 | full-fill masonry | semi-detached | 92.6 |
| Dwelling 21 | full-fill masonry | semi-detached | 92.6 |
| Dwelling 22 | full-fill masonry | mid-terrace | 137.0 |
| Dwelling 23 | partial fill masonry | mid-terrace | 83.4 |
| Dwelling 24 | full-fill masonry | mid-terrace | 106.0 |
| Dwelling 25 | full-fill masonry | semi-detached | 73.0 |
| Dwelling 26 | full-fill masonry | semi-detached | 73.0 |
| Dwelling 27 | full-fill masonry | semi-detached | 73.0 |
This database, which represents the compilation of over ten years’ experience of undertaking electric coheating tests, contains the results from almost 50 dwellings (in excess of 60 tests), all of which have been tested by the same testing organisation. In a number of instances, the same dwelling has been tested multiple times, enabling the impact of various fabric interventions to be quantified and evaluated. Although the database represents a wide range of both new build and existing dwellings of different size, age, form factor and construction type, the sample size of the database is still small, and the dwellings that are contained within the database are not the result of random sampling. Consequently, the data contained within the database cannot be qualified as being representative of the UK housing stock as a whole. In fact, as a significant proportion of the new build dwellings contained within the database were built to more stringent thermal performance requirements than those that were in force when they were constructed, the new build portion of the database is likely to be biased towards dwellings that had much greater levels of insulation and airtightness than those which would normally have been required for compliance purposes alone. This should be taken into consideration when interpreting the results discussed below. The small number of dwellings contained within the data base also highlights the practical difficulties associated with obtaining aggregate whole dwelling performance data on dwellings in the UK.
An analysis of the data contained within
Figure 4 and
Figure 5 indicates that a very wide range of performance exists within the database of new build electric coheating test results, with the measured performance exceeding the steady-state predicted performance in all of the dwellings tested.
What is concerning is that in the majority of the dwellings tested, the difference between the steady-state predicted and the measured performance is significant; in eight of the dwellings the difference is greater than 70% and in two of the dwellings the difference is greater than 100%. On average, the measured fabric performance within the database was just under 45% greater than that predicted. If the Passivhaus Certified case study dwellings are excluded, then the average measured performance difference increases to just over 50% greater than that predicted. Despite this, it is clear that the Passivhaus Certified case study dwellings are the best performing dwellings in the sample, both in terms of predicted and measured performance, by some considerable margin.
In terms of the absolute difference in heat loss, there are also large variations across the database, with the absolute difference ranging from just over 123 W/K for Dwelling 23 to just over 2 W/K for the Racecourse Development Dwelling 2. The average difference in absolute heat loss attributable to the non Passivhaus Certified dwellings is 51 W/K compared to less than 6 W/K for the Passivhaus Certified dwellings. At the most extreme end of the scale, the differences in absolute heat loss measured are likely to have important implications in terms of the energy use and carbon dioxide emissions attributable to these dwellings. Furthermore, the levels of thermal comfort experienced by the occupants of these dwellings is likely to be impaired and it is probable that the performance of the building fabric in these dwellings is in excess of that which is required to achieve Building Regulation compliance. For those dwellings that suffer significant absolute heat loss compared to their prediction (even if they achieve Building Regulations compliance in practice), then with regard to contract law, there may be other legal implications.
7. Conclusions
The in situ thermal performance of the building fabric of seven Passivhaus Certified case study dwellings has been quantified by undertaking an electric coheating test. Although it is only possible to make a number of qualitative comments, due to the small and non-random nature of the case study dwellings tested, the results indicate that in all but one of the dwellings, the measured whole-house in situ heat loss was greater than the predicted steady-state heat loss. In the one dwelling where the in situ measured heat loss was lower than the predicted steady-state heat loss, it is thought that a number of factors are likely to have acted in combination to contribute to the result obtained.
Although the electric coheating test results indicate the presence of a building fabric thermal “performance gap” in all but one of the Passivhaus Certified case study dwellings, the size of the gap measured was only marginal. If one takes into account the various uncertainties associated with the coheating test, then in spite of the Passivhaus Standard’s weak attention to addressing thermal bypass, the building fabric associated with the case study dwellings examined performs within acceptable boundaries and delivers “what is says on the tin”. It may be that the knock-on consequence of the onerous airtightness standard required to achieve Certification is that designers and site labour pay greater attention to all aspects of the building fabric which influence building performance.
Regardless of this, the findings of this study can be placed in the context that there is very little measured data available on the in situ thermal performance of the building fabric of Passivhaus dwellings. At this point, and with the limited in situ data that is currently available, the results suggest it is possible to construct Passivhaus Certified dwellings where the in situ performance of the building fabric performs thermally more-or-less as predicted. This is in contrast to the rest of the electric coheating data that are currently available from more mainstream UK housing, where differences between the in situ measured and steady-state predicted performance of more than 100% have been observed. Consequently, the Passivhaus Standard would appear to offer a robust solution to the building fabric thermal “performance gap”.


