Article

Diffusion Patterns in Convergence among High-Technology Industries: A Co-Occurrence-Based Analysis of Newspaper Article Data

1
Graduate School of Innovation and Technology Management, College of Business, KAIST, Daejeon 34141, Korea
2
School of Business and Technology Management, College of Business, KAIST, Daejeon 34141, Korea
3
Graduate School of Management of Technology, Pukyong National University, Busan 48547, Korea
4
Department of Physics, KAIST, Daejeon 34141, Korea
5
Department of Business Administration, Sangji University, Wonju, Kangwon 26339, Korea
*
Authors to whom correspondence should be addressed.
Sustainability 2016, 8(10), 1029; https://0-doi-org.brum.beds.ac.uk/10.3390/su8101029
Submission received: 17 June 2016 / Revised: 28 September 2016 / Accepted: 29 September 2016 / Published: 14 October 2016

Abstract

:
Firms in high-technology industries have faced great technological and market uncertainty and volatility in the past few decades. In order to be competitive and sustainable in this environment, firms have been pursuing technological innovation, product differentiation, vertical integration, and alliances, which eventually drive industry convergence, defined as the process of blurring boundaries between previously distinct industries. Although industry convergence has greatly affected industrial structure and the economy, little research has investigated this phenomenon, especially its diffusion patterns; thus, it is still unclear which industries are converging more rapidly or have a higher potential for convergence. This paper explores these issues by investigating industry convergence in U.S. high-technology industries, using a large set of newspaper articles from 1987 to 2012. We perform a co-occurrence-based analysis to obtain information on industry convergence and estimate its diffusion patterns using an internal-influence logistic model. We find heterogeneous diffusion patterns, depending on convergent-industry pairs and their wide dispersion. In addition, we find that the potential degree of industry convergence is significantly negatively associated with its growth rate, which indicates that a great deal of time will be required for industry convergence between high-technology industries with this high potential to achieve a high degree of convergence.

1. Introduction

In the past few decades, high-technology industries have experienced evolution, shorter product life cycles, a higher production rate of new products, and radical changes over time for several reasons, such as technological developments, regulatory changes, or new consumer preferences [1,2]. Therefore, firms in these high-technology industries have inherently experienced great technological and market uncertainty and volatility in terms of rapid product innovation, obsolescence, and market saturation [3]. Correspondingly, to be competitive in this industrial environment, firms have pursued technology or product convergence, which eventually leads to industry convergence, defined as the process of blurring boundaries between previously distinct industries [1,4,5,6,7,8,9,10,11,12]. This is because technology or product convergence became a way for firms to develop and sustain their competitive advantage in the face of rapidly changing industrial paradigms [3].
Examples of convergence among high-technology industries are numerous: the smartphone industry, which integrated cell phones, portable computers, and software [1]; the nutraceutical and functional food industry, which was created through convergence between the pharmaceutical and food industries [1,7,13,14,15]; and the smart car industry, which accelerates the integration of automobiles, electronics, and software [16,17,18]. These convergent industries have grown rapidly, and some firms in them—such as Apple, Walgreens, and Google—have led their industries and changed their inherent structure.
Because industry convergence has had such a significant impact on the structure of these inherent industries, some governments have established national programs to promote and support activities involved in convergence. In 2003, for example, the National Science Foundation in the United States published a report titled “Converging Technologies for Improving Human Performance” [19]; in 2004, the European Commission of the European Union published the report “Converging Technologies: Shaping the Future of European Societies” [20]; and in 2011 and 2012, respectively, South Korea passed the Industry Convergence Promotion Act and established the Korea National Industrial Convergence Center. In particular, it is important for policy makers to understand the diffusion patterns of convergent industries and to create and sustain policies that promote and support convergence because it occurs across industries, and its patterns of emergence and diffusion are heterogeneous across convergent-industry pairs [10,21]. However, to the best of our knowledge, no research to date has investigated the emergence and diffusion patterns of industry convergence. Although a recent study [10] shows the trends in industry convergence, it is limited to the diffusion characteristics of convergence, such as the potential degree to which industry convergence will develop and the speed of development.
Therefore, this research aims to investigate the emergence and diffusion patterns of convergence among high-technology industries in order to provide important empirical grounds for public policy as well as an innovative study on industry convergence. In doing so, we use the co-occurrence-based analysis conducted by Kim et al. [10] to identify industry convergence from an extensive and comprehensive set of newspaper articles. The original newspaper article dataset we use covers about two million articles published by a major newspaper company in the United States over 26 years, from 1987 to 2012. From this original dataset, we extract 45 high-technology-industry pairs that show a continuously rising trend in industry convergence. Then, we calculate the degree of industry convergence for every convergent-industry pair and estimate diffusion parameters, such as the potential degree of industry convergence and the growth rate of industry convergence for each convergent-industry pair.
The estimation results show a wide dispersion of industries in terms of the potential degree and the growth rate of industry convergence. In addition, we find that these two factors are negatively associated, which indicates that, if the potential degree of convergence among industries is high, the growth rate of convergence among them is low. Furthermore, the diffusion curves of the convergent-industry pairs indicate heterogeneous patterns. These findings suggest important empirical patterns in industry convergence from a market-based perspective, which has not been explored before. In addition, the heterogeneous patterns we found suggest important insights for firm strategies related to the accelerated changes due to industry convergence.
The remainder of this paper is structured as follows. First, literature on industry convergence is briefly reviewed. Second, our method for measuring industry convergence is introduced. Third, using this measurement, our empirical methodology for estimating the diffusion model is described. Fourth, results of our analysis are reported, followed by a discussion. Finally, implications of this study are explored in our concluding remarks.

2. Literature Review

As a prevailing paradigm in the current high-technology industries, industry convergence increases connectivity and compatibility between converging industries [10]. Ultimately, industry convergence introduces substitute or complementary offerings that cause creative destruction in related markets [8,22,23]. It eventually triggers a transformation from a traditional industry to a newly restructured industry, altering the nature of competitive, cooperative, and regulatory interactions [8,10,24,25]. Firms that cannot effectively adapt to the restructured industrial environment fail in market competition and, eventually, lose their market position. The recent transformation of the mobile phone industry is a representative example. The integration of diverse functionalities in different product categories in various industries—such as high-speed data communication, high-resolution cameras, high-quality games, GPS-based navigation, and numerous applications—has restructured the traditional feature phone (i.e., cell phones that are not smartphones) industry, ceding dominance to the smartphone industry. Amid this turbulence, Nokia did not adjust to the smartphone industry well and was acquired by Microsoft in September 2013 [16]. In other words, industry convergence becomes an important antecedent condition for firms to consider before they design a competitive strategy.
In this regard, existing studies examine the sources of industry convergence and suggest two major precursors of industry convergence: first, technology convergence [1,9,14,26,27] and, second, applicational convergence [5,10,23,28,29,30,31,32] (other researchers call this type of convergence “market convergence” [1,7,15]). Technology convergence generated by the combination of extant technologies replaces established technological paradigms, resulting in industry convergence that will disrupt the value chain of the existing industry [10]. Applicational convergence occurs when market competition promotes firms’ technological innovation [33], which eventually overshoots the market at some point [34]. To overcome this market saturation, firms pursue convergence in the form of new applications, products, or services that provide the customer with value and differentiation vis-à-vis competitors—that is, applicational convergence [9,35]. To achieve successful applicational convergence, these firms need knowledge and capabilities vis-à-vis the new features of converged industries in which they were previously uninterested [13,36] and engage in interfirm relationships across industries as well as carry out open innovation activities, such as divestment, strategic alliances, joint ventures, mergers and acquisitions (M&As), and patent licensing, or demand articulation from the market [1,37,38,39,40]. As firms gradually engage in these interorganizational activities, applicational convergence leads to collisions between existing business models [30] and removes boundaries between the relevant industrial sectors—that is, industry convergence [41].
Industry convergence is not a one-time event but, rather, a dynamic series of events that unfolds over time. Therefore, it demonstrates various diffusion trends, for example, some industries are continuously converging (i.e., evolutionary convergence) or are sometimes stagnant in its development (i.e., stationary convergence) [10]. Other industries that previously converged can diverge later (i.e., divergence) [10]. In particular, evolutionary convergence needs to be examined more closely with respect to which trends they demonstrate over time because it is the main type of convergence. In evolutionary convergence, as the size of the overlap between those industries expands, the degree of convergence increases according to an evolutionary pattern [10]. This pattern indicates that over time this convergence permeates an industrial and economic system. Moreover, as the term ”evolutionary” is used with respect to innovation and change, in theory outside biology, coined by innovation studies (e.g., [42]), it refers to gradual or radical change that implies the mechanism of variation, selection, and retention [43]. In this mechanism, the characteristics of individual industries are uneven, and so are those of the converging industries. In particular, their diffusion characteristics may thus show heterogeneous patterns that can be determined by the potential degree and the growth rate of industry convergence. These diffusion characteristics may lead to unique policy perspectives on sustainable innovation that stimulates the emergence of radical technologies and changes in innovation system [43] because those two factors determine the diffusion pattern that can be utilized as criteria for policy decision on the size and priority of R&D subsidization or promotion. However, to the best of our knowledge, little research has been conducted to date on these diffusion characteristics of evolutionary industry convergence.
To explore the characteristics of the diffusion of industry convergence, first, we need a way to measure industry convergence. As shown in Table 1, previous studies have suggested how to measure industry convergence, most of them by carrying out co-classification analysis, citation analysis, or industry-technology concordance analysis of patent information [1,6,7,14,23,27,44]. For example, Curran and Leker [1] suggest an international patent classification (IPC) co-classification analysis to investigate industry convergence in nutraceuticals and functional foods, while Karvonen and Kässi [44] provide a patent citation analysis to identify overlapping technologies in the computer, audiovisual, semiconductor, and optics industries.
However, despite the advantages of availability and inclusion of codified knowledge, patent data have limitations when it comes to measuring the degree of industry convergence [10]. First, patent data imply a lack of contemporaneity. In general, patents explain possible outcomes derived from science and technology in the future, rather than indicating ongoing developments in industry convergence. This is because it takes a long time for patents to be commercialized by being transformed into products or services, which imply convergent characteristics. Second, patent data lack actuality. Because the IPC code of each patent is determined by individual patent examiners, a co-classification analysis using patents may not be capable of representing the actual phenomenon of industry convergence [10].
From this perspective, to satisfy the need for contemporaneity and actuality in the measurement of the degree of industry convergence, recent studies choose alternative approaches, such as an interindustry product-market entry analysis using product-market entry data [45] and a co-occurrence-based analysis using newspaper articles [10]. First, the product-market entry measure can be used as a proxy of industry convergence. This measure is constructed based on the logic that the extent of convergence between two industries is determined by the relatedness between product markets in these two industries [45]. In addition, it satisfies the need for contemporaneity and actuality by containing information on firms that actually introduce their products to the market. Second, the newspaper article data can be another information source to measure the degree of industry convergence. This is because newspaper articles include publicly announced interorganizational information, such as competitive actions against rivals, the formation of M&As, strategic alliances or joint ventures, engagement in joint research and development (R&D), and patent licensing with other companies that even belong to different industries. However, it is challenging to obtain this information from other public sources [9]. In this research, we thus use a newspaper article dataset to measure the degree of industry convergence and investigate its emergence and diffusion pattern and characteristics.

3. Methodology

3.1. Data Collection and Processing

The newspaper article dataset used in this study was obtained from a major newspaper company in the United States, and it comprises about 2 million articles over 26 years from 1987 to 2012. Then, we eliminated duplicate articles using the Levenshtein distance ratio (i.e., r > 0.90) between article pairs published the same day. After duplicate articles were eliminated, we also removed nontext articles, such as articles that consist of only tables and photos, as well as articles not in English. Consequently, we collected text contents with corresponding metadata to construct a full and independent set of articles for the same day.
Meanwhile, to use a consistent article format, any special characters were replaced with those in ASCII (American Standard Code for Information Interchange), and white space and formats were normalized. Then, we transformed article text into text with information using the Stanford Core natural language processing (NLP) tool [46] and extracted relevant information from the sentences. Afterward, nonsentences—such as section titles, tables, and figure captions—were systematically excluded.
Next, firm names were constructed as a joint set of two name sets. The first name set comprises proper nouns collected from article texts, whose named entity (NE) is given as an organization. In the name sets, company-specific suffixes (e.g., Company or Co., Ltd.) are filtered using NE extraction with regular expression (RegEx) [47]. In addition, the second name set is companies’ names in the COMPUSTAT dataset with the standard industrial classification (SIC) code. We regarded an abbreviated or alternative name of a company as the same company name but considered the name of subsidiary companies as the name of different companies. Afterward, we assigned each name a representative name for a company as well as the SIC code for each company manually. Among all the company name candidates, we removed names that appeared more than five times to eliminate insignificant company mentions.
Finally, we constructed the relationship of co-occurrences when two companies appeared in the same sentence based on an analysis of split sentences in which company names were assigned. This co-occurrence is related to direct relations between companies. Because of the scarcity of information on industrial classification that co-occurred in the original data [10], we converted co-occurring firms into co-occurring industries—i.e., SIC codes. The SIC codes are three digit, that is, industry-group level, which is used for high-technology industries [48] and reflects a balance between the need to minimize the possibility of gathering unrelated firms and the need to indicate the viability of an industry group [49]. Furthermore, comparing the list of high-technology industries suggested by Hecker [48] and that of high- and medium-high-technology industries suggested by the Organization for Economic Cooperation and Development (OECD) [50], this research uses 21 high-technology industries (Table 2).

3.2. Degree of Industry Convergence

To measure the degree of industry convergence (DIC), this research employs the measurement suggested by Kim et al. [10] (Kim et al. [10] modify the normalized pointwise mutual information (PMI) index to develop the degree of industry convergence. The normalized PMI index refers to how much two random variables mutually share information [51,52]. For example, let us suppose that there are two random variables A and B whose probabilities of occurrence are denoted p(A) and p(B), respectively, and the co-occurrence probability is p(A,B). Then, the normalized PMI index can be calculated as follows: N o r m a l i z e d   P M I = l o g ( p ( A , B ) p ( A ) × p ( B ) ) / l o g ( p ( A , B ) ) ) because it effectively shows the five patterns of industry convergence, using a range from −1 to 1. A degree of 1 implies complete convergence between two industries; 0 means two industries co-occur independently, which represents independence; and −1 implies that two industries are distinct. Furthermore, a positive value means that two industries are mentioned together more frequently than they are separately, which refers to industry convergence, whereas a negative value means that the two industries are diverging. The DIC between two industries i and j at a given time t is as follows:
D I C i j t = l o g ( A i j t + 1 A t   A i t + 1 A t × A j t + 1 A t ) / l o g ( A i j t + 1 A t   ) ,
where Aijt is the number of articles in which industries i and j co-occurred in the sentence in a given year t; Ait and Ajt are the numbers of articles in which industries i and j appeared in the sentence in a given year t, respectively; and At represents the total number of articles including firms regardless of industry in a given year t. In addition, we added 1 to every single numerator to avoid the undefined division within the log term or the negative infinite value of log term when the number of articles where two industries appeared together in the sentence is zero. Then, to identify the evolutionary convergence patterns, we estimated each pair’s slope coefficient of the linear trend of the DIC and selected those whose coefficient is positive and statistically significant. The industry pairs that show evolutionary convergence patterns are listed in Appendix Table A1. Interestingly, four pairs have the same SIC code, such as 282–282, 283–283, 285–285 and 873–873, which shows within-industry convergence, which represents convergence among subindustries [10] (In the case of within-industry convergence, convergence occurs among sub-industries in an industry sector. For example, the convergence between automobile and electronics represents within-industry convergence since they are subindustries in a manufacturing industry sector [10]. Note that this definition of within-industry convergence is relative because of the hierarchical structure of industrial classification. Since we use three-digit SIC codes as the unit of analysis in this research, the same three-digit SIC codes represent within-industry convergence. However, if we use four-digit SIC codes, this convergence may not be recognized as within-industry convergence).

3.3. Estimation of a Diffusion Model of Industry Convergence

Since the diffusion model was mathematically developed by Bass [53], various models have been applied to explain the spread of product and service innovation among prospective adopters over time [54]. They also have been widely adopted by researchers in the social sciences [55]. We can represent the general structure of the diffusion model in a differential equation as follows:
d N ( t ) d t = g ( t ) [ m N ( t ) ]
where N(t) is the cumulative number of adopters, m is the total number of potential adopters, [m − N(t)] is untapped potential, and g(t) is the parameter of diffusion, usually formulated as a function of N(t) [56].
In many diffusion models, g(t) is formulated as a linear function of N(t):
g ( t ) = p + q N ( t )
where p reflects influence that is independent of previous adoption, while q reflects adoption influence that depends on imitation or learning [54]. Depending on these two parameters, g(t) can be characterized as three models: a mixed-influence model, an external-influence model, and an internal-influence model [57]. First, where both p and q are not zero, g(t) is p + qN(t), which is the mixed-influence model. Second, where only q is zero, g(t) is a constant p, which is the external-influence model. Lastly, where only p is zero, g(t) becomes qN(t), which is the internal-influence model [56]. When we consider the diffusion of various and complex features of convergence, the internal-influence model is the most appropriate for estimating a diffusion model of industry convergence [55].
Among internal-influence models, two types demonstrate the symmetry of the diffusion curve: logistic models (if the diffusion curve is symmetric) and Gompertz models (if the diffusion curve is asymmetric). In this paper, we compare the residual sum of the squares (RSS) of the logistic model and Gompertz model and find that the RSS of the logistic model is smaller than that of the Gompertz model in most convergent-industry pairs [55]. Therefore, we use the internal-influence logistic diffusion model in this research as follows (the original logistic diffusion model is N ( t ) = m / ( 1 + m N 0 N 0 e q m ( t t 0 ) ) ):
D I C i j t = b 1 1 + b 1 b 0 b 0 e b 2 ( t t 0 )
where DICijt is the degree of convergence between industries i and j at a given time t, as suggested in the previous section. This index, which considers only the cases of evolutionary convergence, implies a continuous increase during the period under analysis. Moreover, the evolutionary convergence of industries reflects a cumulative aspect influenced by previous convergence because of the path dependence of industry convergence [10]. Along with previous research on the diffusion of technology convergence [54], the parameters of the logistic diffusion model (i.e., b0, b1, and b2) are defined from the perspective of industry convergence. Therefore, b0 is defined as the initial degree of industry convergence. In this research, the initial time—that is, t0—is 1987, the first year of the data. In addition, b1 means the potential degree of industry convergence, while b2 indicates the growth rate of industry convergence.

4. Results

Based on the DIC obtained from the previous section, this research estimates the diffusion parameters of DIC for the convergent-industry pairs shown in Table 3, while number 46 (Total) represents the mean DIC of the entire convergent-industry pair. First, a coefficient of the initial degree of industry convergence (b0)—that is, DIC at the starting year, 1987—is significantly larger in pairs 285 (Paints, varnishes, lacquers, enamels, and allied–Paints, varnishes, lacquers, enamels, and allied) and 285 as well as 873 (Research, development, and testing services) and 281 (Industrial inorganic chemicals) than others. The former pair consists of a single SIC code (i.e., 285), which means the industry convergence occurs within this industry group. By contrast, this coefficient is significantly smaller in pairs 386 (Photographic equipment and supplies) and 284 (Soap, detergents, and cleaning preparations; perfumes, cosmetics, and other toilet preparations) as well as 356 (General industrial machinery and equipment) and 284 (Soap, detergents, and cleaning preparations; perfumes, cosmetics, and other toilet preparations) than others.
Second, the results for the potential degree of industry convergence (b1) suggest the extent to which industry convergence develops. The pairs 285 (Paints, varnishes, lacquers, enamels, and allied) and 284 (Soap, detergents, and cleaning preparations; perfumes, cosmetics, and other toilet preparations), 356 (General industrial machinery and equipment) and 281 (Industrial inorganic chemicals), and 356 and 284 show larger and significant coefficients, suggesting high convergence potential. In contrast, the pairs 873 (Research, development, and testing services) and 372 (Aircraft and parts) as well as 286 (Industrial organic chemicals) and 283 (Drugs) demonstrate significantly smaller coefficients than others with low convergence potential.
Third, the estimation result of the growth rate of the degree of industry convergence (b2) shows that the pairs 382 (Laboratory apparatus and analytical, optical, measuring, and controlling instruments) and 287 (Agricultural chemicals) as well as 386 (Photographic equipment and supplies) and 287 (Agricultural chemicals) are growing more rapidly than others. However, the pairs 285–284 and 873–281 show a significantly lower growth rate than others during 1987–2012.
Among these three diffusion parameters, this research uses the potential degree (b1) and the growth rate (b2) of industry convergence to explore the dispersion of convergent-industry pairs (1 to 27) whose coefficients are both statistically significant. Using these two coefficients as separate axes, we draw a chart of the dispersion of convergent-industry pairs, shown in Figure 1. Furthermore, we divide the dispersion area into quadrants by the average values of those two coefficients of the convergent-industry pairs (i.e., 0.590 and 0.262 for b1 and b2, respectively).
The first quadrant is where both coefficients are higher than average, which suggests that industry pairs in this region have high convergence potential as well as a high growth rate. For example, the industry pairs in this quadrant, that is, 287–281 (6) and 356–287 (11), have potentially higher degrees of industry convergence, and the growth rates of the degree of industry convergence are also higher than average. The second quadrant includes industry pairs whose convergence potential is higher, and the growth rates of DIC are lower than average. This quadrant includes eight industry pairs: 285–284 (2), 285–285 (3), 356–282 (9), 356–284 (10), 382–285 (18), 386–281 (20), 873–281 (23), and 873–356 (25). Interestingly, one industry group, 356 (General industrial machinery and equipment), is included in the first and second quadrants. This means that this industry group has converged with other industry groups, reaching a high potential degree of industry convergence, regardless of the growth rate of convergence.
The third quadrant is an area in which both coefficients are lower than average, including industry pairs such as 284–282 (1), 286–282 (4), and 357–285 (12). Furthermore, in general, the diffusion parameters of mean DIC of the entire industry pairs (46) also have values below average. Finally, the fourth quadrant has industry pairs with lower convergence potential and a higher growth rate of DIC than others, including 286–283 (5), 287–284 (7), 372–356 (16), 382–287 (19), 386–287 (21), and 873–372 (26). The convergence of industry pairs in this area seems to become saturated quickly, considering the potential and rate of convergence.
Interestingly, we find that the potential for industry convergence and the growth of industry convergence are negatively related. An ordinary least squares (OLS) regression result confirms this negative relationship in Table 4. This indicates that convergence between high-technology industries, in general, takes a longer time to emerge, diffuse, and reach a high degree, if convergence potential is high.
After estimating the diffusion parameters, such as the initial DIC (b0), potential DIC (b1), and the growth rate of DIC (b2), and exploring the dispersion of convergent-industry pairs using these parameters, this research also shows the diffusion patterns of convergent-industry pairs (1 to 27) in 
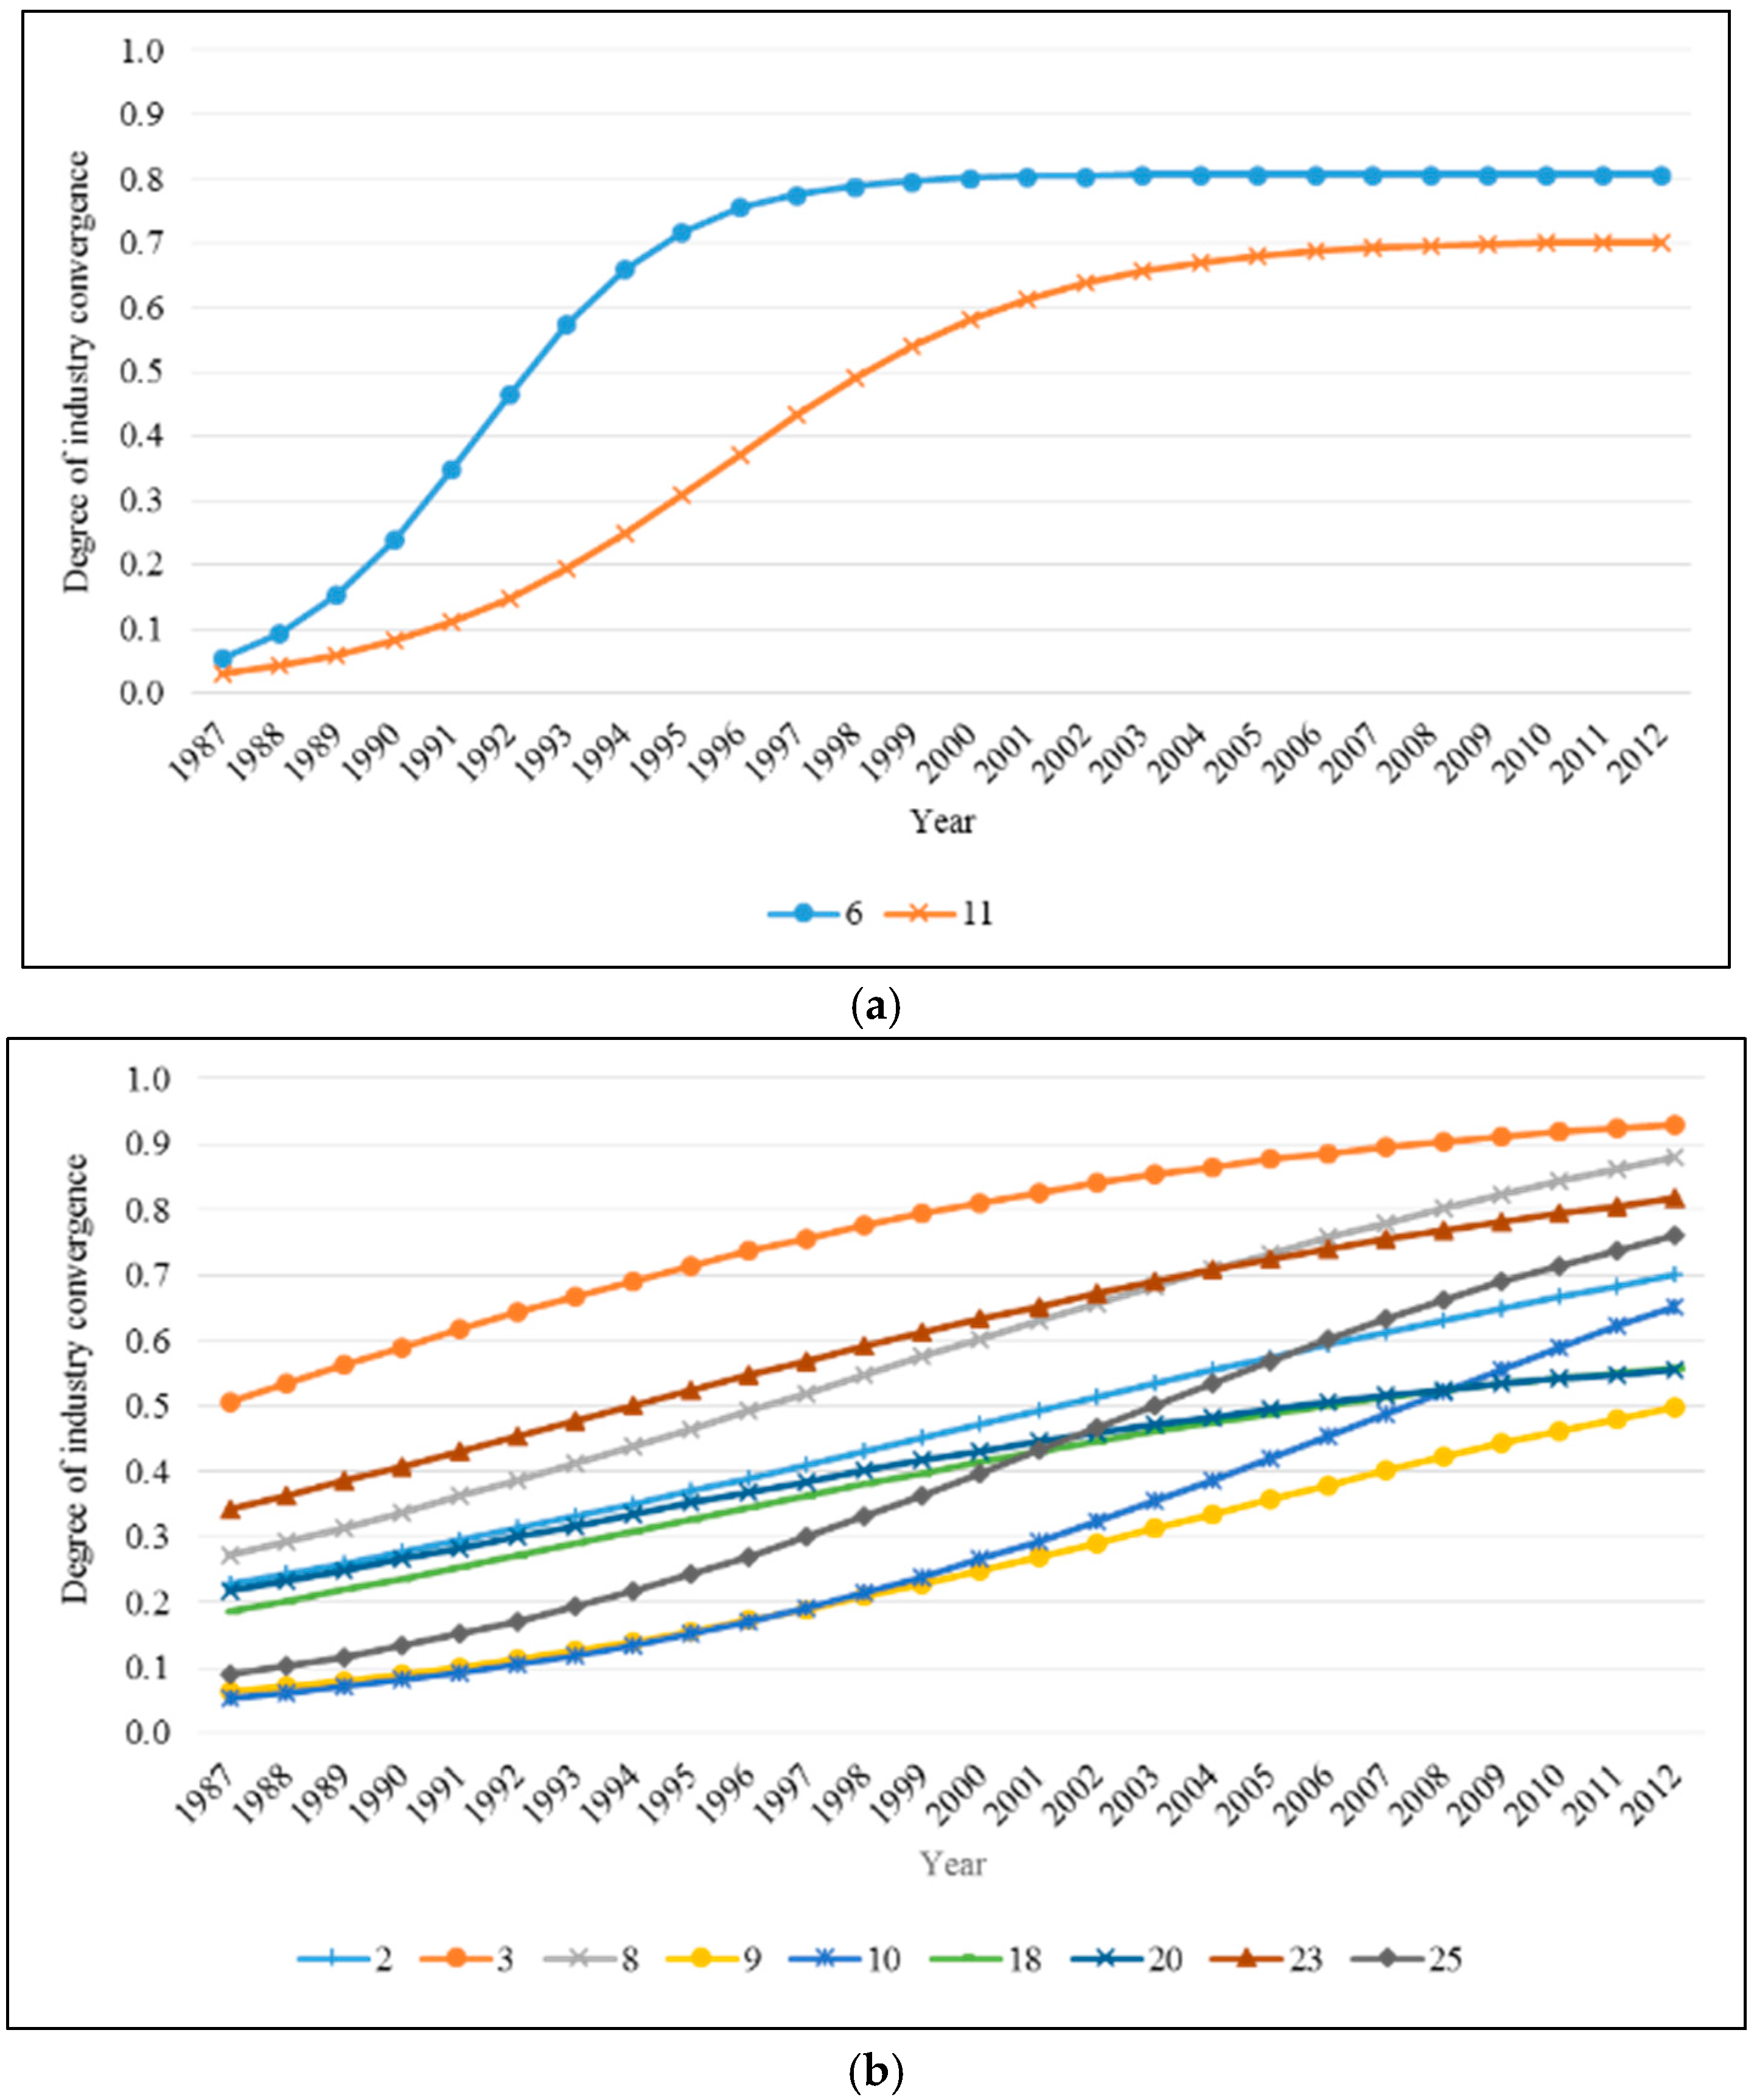
Figure 2. We find that the diffusion patterns of industry convergence are heterogeneous across the quadratic regions. In Figure 2a, the diffusion curves of the convergent-industry pairs 287–281 (6) and 356–287 (11) in the first quadrant are depicted. Interestingly, although both the potential degree and the growth rate of industry convergence of these pairs are higher than average, their convergence potential is stagnant for several years. This means that the convergence between these industries occurred rapidly and has already achieved a very high degree.
The diffusion curves of the convergent-industry pairs in the second quadrant are shown in Figure 2b. Because they have growth rates lower than average but a degree of potential that is higher, the diffusion curves show gradual growth up to the maximum degree of convergence between industries. Interestingly, two pairs—873 (Research, development, and testing services) and 356 (General industrial machinery and equipment) (25) as well as 356 and 284 (Soap, detergents, and cleaning preparations; perfumes, cosmetics, and other toilet preparations) (10)—show higher growth rates than other pairs in this quadrant (i.e., 0.150 and 0.142, respectively). 
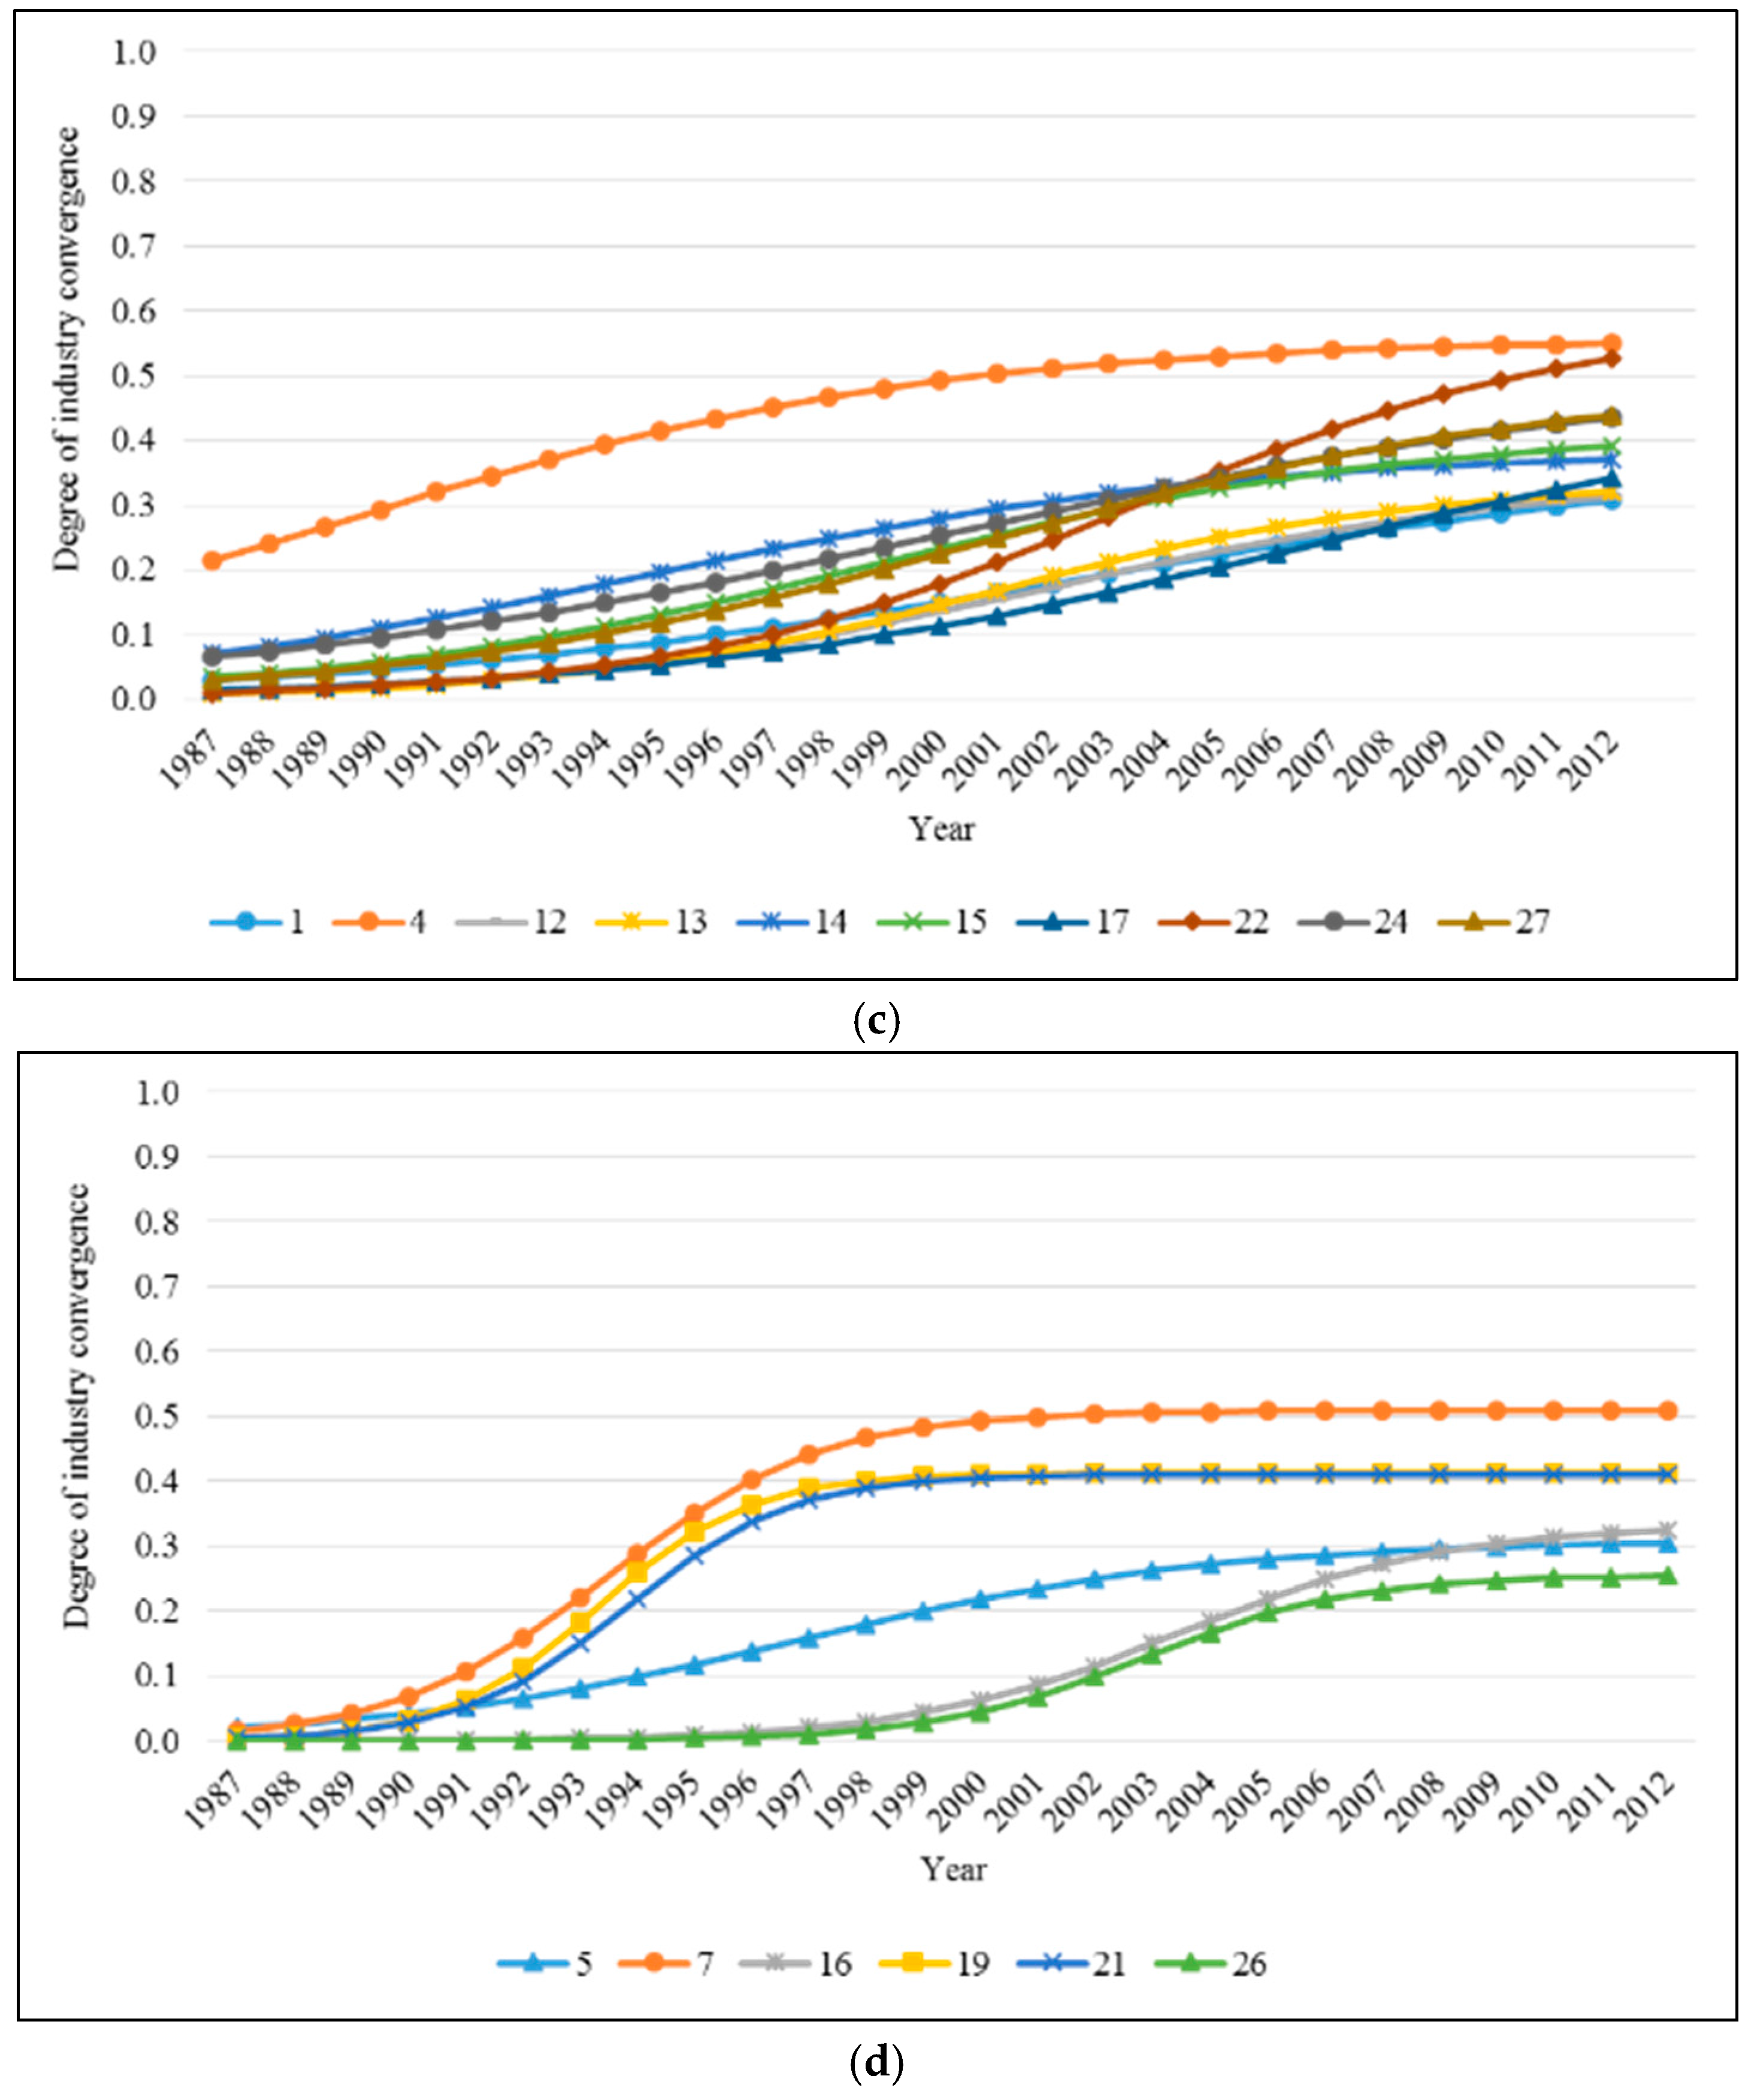
Figure 2c shows the diffusion curves of convergent-industry pairs in the third quadrant, where the convergence potential and growth rates of industry convergence are both lower than average. Among the pairs in this quadrant, the pair 386 (Photographic equipment and supplies) and 356 (22) has a potential degree of industry convergence close to average, while the pair 357 (Computer and office equipment) and 286 (Industrial organic chemicals) (13) shows a growth rate of industry convergence similar to the average. Finally, Figure 2d shows the diffusion patterns of convergent-industry pairs in the fourth quadrant. The industry convergence of these pairs has grown rapidly but has a lower potential degree of convergence than others.
Overall, we find that convergent-industry pairs across different quadrants have heterogeneous and unique diffusion patterns. In other words, industry convergence is currently developing at a different rate and degree of potential depending on the industry pair. Some industries in particular—such as 873 (Research, development, and testing services), 356 (General industrial machinery and equipment), 284 (Soap, detergents, and cleaning preparations; perfumes, cosmetics, and other toilet preparations), 357 (Computer and office equipment), and 286 (Industrial organic chemicals)—show both a significant convergence rate and degree of potential and seem to be leaders of the industry convergence phenomenon.

5. Conclusions

As the high-technology market environment has changed rapidly and become more uncertain, firms have confronted intense competition, which accelerates firms’ technological innovation and product differentiation combining new product functionalities of other industrial sectors with their existing products. This combination of product functionalities drives applicational convergence, which promotes industry convergence and creates a new value chain in an industry as well as new market demand.
In spite of the appearance of industry convergence arising from not only technological development but also application/market development, previous research has studied industry convergence primarily from the perspective of technology. Although one recent study focuses on the market perspective [10], it does not explore which industries have converged more rapidly and how their diffusion characteristics vary. Therefore, this paper investigates the diffusion patterns in industry convergence in U.S. high-technology industries by applying a text-mining-based co-occurrence analysis using a large set of newspaper article data. It is appropriate to examine industry convergence using newspaper article data because they provide various detailed information regarding firms and their changes. However, the data have not been used in innovation research, due to data related capability. Recent advancements in computer science enable us to obtain appropriate information regarding firms from newspaper articles [10].
As a result, we estimate the potential degree and the growth rate of industry convergence of convergent-industry pairs that show an evolutionary convergence pattern. Furthermore, we explore the dispersion of convergent-industry pairs, dividing the dispersion area into four quadrants by the potential degree and growth rate of industry convergence. We find that the potential degree of industry convergence has a significantly negative association with the growth rate of industry convergence, which indicates that it takes a long time for high-technology industries with high convergence potential to achieve a high degree of industry convergence. This result is consistent with that of Choi et al. [55] in terms of the negative relationship between these two factors of convergence, although they analyze the diffusion patterns of technology convergence, not industry convergence. Furthermore, the diffusion curves obtained from the diffusion parameters indicate the heterogeneous diffusion patterns of convergent-industry pairs. With these results, one can infer not only which high-technology industries have converged but also how intense and how rapid their convergence has been.
This research contributes to the literature on industry convergence in three ways. First, this study provides a new approach that has rarely been explored previously to investigate industry convergence (i.e., interorganizational dynamics and market-based industry convergence). By analyzing text-mining-based co-occurrence using newspaper articles, our study provides unique results on industry convergence from the market perspective. Second, this paper also suggests a specific industry-pair-level of analysis of industry convergence while previous studies have engaged in a general-industry-level or technology-sector-level analysis. While a general-industry-level analysis shows overall trends of industry convergence, the analysis in this paper shows which industries are converging at a specific level. This allows policy makers to understand the phenomenon of industry convergence from a different perspective than previous studies, by providing implications about which industries are converging and which form of convergent industry will be created. Third, this research estimates the diffusion parameters of convergent-industry pairs, which also has implications for the extent and the speed of industry convergence. This evolutionary perspective becomes even more important for policy analysis as radical technologies and system changes are regarded as ways of achieving sustainable innovation and development [43]. Since the industry convergence is a problematic innovation because of the high level of uncertainty, it needs to take an evolutionary approach that be modified depending on the situation.
Moreover, our findings have important managerial implications for industry convergence. As interorganizational activities are drivers of industry convergence, firms should recognize that their strategic decisions may not be limited to their business area but can expand or change over the course of evolutionary convergence. It is very important for managers to recognize how their business area (i.e., industry) changes and converges because industry convergence introduces new competitors who were previously in different arenas. In this context, managers can use an adaptation or niche differentiation strategy to address evolutionary convergence, especially when it is not complete [45,58].
Despite the contributions described above, this research has several limitations that should be addressed in future studies. First, although we eliminated noisy information in the newspaper articles, other noise may exist. Future studies can apply an advanced NLP method to extract more precise and clearer co-occurrence information from the newspaper articles. Second, the analytical basis used in this research—that is, the industry-pair level—cannot fully describe the formation of convergent industries that consist of more than two industries. For example, the smartphone industry integrated cell phones, portable computers, and software [1], which we cannot define at the pair level. This might be due to the method of measuring industry convergence (i.e., co-occurrence analysis). The degree of industry convergence based on the co-occurrence of SIC codes only shows the diffusion patterns of convergence between those two industries. A network perspective may be helpful for identifying the convergent industry cluster. Third, this paper focuses only on convergence among high-technology industries, not on entire industries. Industry convergence seems to occur among entire industrial sectors [9]. In addition to convergence between high-technology industries, future studies can usefully investigate the diffusion patterns of convergence between high-technology and other industries. This will enable us to draw a fuller picture of the diffusion patterns of entire convergent industries.

Acknowledgments

This work was supported by the National Research Foundation of Korea Grant funded by the Korean government (NRF-2015-S1A3A-2046742).

Author Contributions

All six authors contributed to completion of the research. Hyeokseong Lee contributed to and led the entire process of this research as well as drawing the outline of the paper. Namil Kim developed the measurement method and analyzed the diffusion model. Kiho Kwak and Kyungbae Park reviewed the related literature and modified the draft. Hyungjoon Soh collected and processed the data analyzed. Hyeokseong Lee, Kiho Kwak, and Wonjoon Kim were in charge of theory development and manuscript preparation. All authors have read and approved the final manuscript.

Conflicts of Interest

The authors declare no conflict of interest.

Abbreviations

The following abbreviations are used in this manuscript:
ASCIIAmerican Standard Code for Information Interchange
DICDegree of Industry Convergence
IPCInternational Patent Classification
M&AMerger and Acquisition
NENamed Entity
NLPNatural Language Processing
OECDOrganization for Economic Cooperation and Development
OLSOrdinary Least Squares
PMIPointwise Mutual Information
RegExRegular Expression
R&DResearch and Development
SICStandard Industrial Classification

Appendix A

Table A1. Pairs of converging high-technology industries.
SIC Code PairConvergent-Industry Pair
282–281Plastics materials and synthetic resins, synthetic—Industrial inorganic chemicals
282–282Plastics materials and synthetic resins, synthetic—Plastics materials and synthetic resins, synthetic
283–283Drugs—Drugs
284–282Soap, detergents, and cleaning preparations; perfumes, cosmetics, and other toilet preparations—Plastics materials and synthetic resins, synthetic
285–283Paints, varnishes, lacquers, enamels, and allied—Drugs
285–284Paints, varnishes, lacquers, enamels, and allied—Soap, detergents, and cleaning preparations; perfumes, cosmetics, and other toilet preparations
285–285Paints, varnishes, lacquers, enamels, and allied—Paints, varnishes, lacquers, enamels, and allied
286–282Industrial organic chemicals—Plastics materials and synthetic resins, synthetic
286–283Industrial organic chemicals—Drugs
287–281Agricultural chemicals—Industrial inorganic chemicals
287–284Agricultural chemicals—Soap, detergents, and cleaning preparations; perfumes, cosmetics, and other toilet preparations
289–281Miscellaneous chemical products—Industrial inorganic chemicals
289–285Miscellaneous chemical products—Paints, varnishes, lacquers, enamels, and allied
289–286Miscellaneous chemical products—Industrial organic chemicals
289–287Miscellaneous chemical products—Agricultural chemicals
356–281General industrial machinery and equipment—Industrial inorganic chemicals
356–282General industrial machinery and equipment—Plastics materials and synthetic resins, synthetic
356–284General industrial machinery and equipment—Soap, detergents, and cleaning preparations; perfumes, cosmetics, and other toilet preparations
356–287General industrial machinery and equipment—Agricultural chemicals
357–281Computer and office equipment—Industrial inorganic chemicals
357–285Computer and office equipment—Paints, varnishes, lacquers, enamels, and allied
357–286Computer and office equipment—Industrial organic chemicals
357–287Computer and office equipment—Agricultural chemicals
371–281Motor vehicles and motor vehicle equipment—Industrial inorganic chemicals
371–285Motor vehicles and motor vehicle equipment—Paints, varnishes, lacquers, enamels, and allied
372–281Aircraft and parts—Industrial inorganic chemicals
372–285Aircraft and parts—Paints, varnishes, lacquers, enamels, and allied
372–356Aircraft and parts—General industrial machinery and equipment
382–284Laboratory apparatus and analytical, optical, measuring, and controlling instruments—Soap, detergents, and cleaning preparations; perfumes, cosmetics, and other toilet preparations
382–285Laboratory apparatus and analytical, optical, measuring, and controlling instruments—Paints, varnishes, lacquers, enamels, and allied
382–287Laboratory apparatus and analytical, optical, measuring, and controlling instruments—Agricultural chemicals
382–356Laboratory apparatus and analytical, optical, measuring, and controlling instruments—General industrial machinery and equipment
386–281Photographic equipment and supplies—Industrial inorganic chemicals
386–284Photographic equipment and supplies—Soap, detergents, and cleaning preparations; perfumes, cosmetics, and other toilet preparations
386–287Photographic equipment and supplies—Agricultural chemicals
386–356Photographic equipment and supplies—General industrial machinery and equipment
873–281Research, development, and testing services—Industrial inorganic chemicals
873–282Research, development, and testing services—Plastics materials and synthetic resins, synthetic
873–285Research, development, and testing services—Paints, varnishes, lacquers, enamels, and allied
873–289Research, development, and testing services—Miscellaneous chemical products
873–356Research, development, and testing services—General industrial machinery and equipment
873–372Research, development, and testing services—Aircraft and parts
873–382Research, development, and testing services—Laboratory apparatus and analytical, optical, measuring, and controlling instruments
873–386Research, development, and testing services—Photographic equipment and supplies
873–873Research, development, and testing services—Research, development, and testing services

References

  1. Curran, C.-S.; Leker, J. Patent indicators for monitoring convergence-examples from NFF and ICT. Technol. Forecast. Soc. Chang. 2011, 78, 256–273. [Google Scholar] [CrossRef]
  2. Wang, C.H.; Lu, Y.H.; Huang, C.W.; Lee, J.Y. R&D, productivity, and market value: An empirical study from high-technology firms. Omega 2013, 41, 143–155. [Google Scholar]
  3. Hills, S.B.; Sarin, S. From market driven to market driving: An alternate paradigm for marketing in high technology industries. J. Mark. Theory Pract. 2003, 11, 13–24. [Google Scholar] [CrossRef]
  4. Benner, M.J.; Ranganathan, R. Divergent reactions to convergent strategies: Investor beliefs and analyst reactions during technological change. Organ. Sci. 2013, 24, 378–394. [Google Scholar] [CrossRef]
  5. Choi, D.; Valikangas, L. Patterns of strategy innovation. Eur. Manag. J. 2001, 19, 424–429. [Google Scholar] [CrossRef]
  6. Curran, C.-S. The Anticipation of Converging Industries; Springer: London, UK, 2013. [Google Scholar]
  7. Curran, C.-S.; Bröring, S.; Leker, J. Anticipating converging industries using publicly available data. Technol. Forecast. Soc. Chang. 2010, 77, 385–395. [Google Scholar] [CrossRef]
  8. Hacklin, F. Management of Convergence in Innovation: Strategies and Capabilities for Value Creation beyond Blurring Industry Boundaries; Springer: Berlin, Germany, 2008. [Google Scholar]
  9. Hacklin, F.; Marxt, C.; Fahrni, F. Coevolutionary cycles of convergence: An extrapolation from the ICT industry. Technol. Forecast. Soc. Chang. 2009, 76, 723–736. [Google Scholar] [CrossRef]
  10. Kim, N.; Lee, H.; Kim, W.; Lee, H.; Suh, J.H. Dynamic patterns of industry convergence: Evidence from a large amount of unstructured data. Res. Policy 2015, 44, 1734–1748. [Google Scholar] [CrossRef]
  11. Lee, G.K. The significance of network resources in the race to enter emerging product markets: The convergence of telephony communications and computer networking, 1989–2001. Strateg. Manag. J. 2007, 28, 17–37. [Google Scholar] [CrossRef]
  12. Srinivasan, R.; Haunschild, P.; Grewal, R. Vicarious learning in new product introductions in the early years of a converging market. Manag. Sci. 2007, 53, 16–28. [Google Scholar] [CrossRef]
  13. Bröring, S.; Leker, J. Industry convergence and its implications for the front end of innovation: A problem of absorptive capacity. Creat. Innov. Manag. 2007, 16, 165–175. [Google Scholar] [CrossRef]
  14. Preschitschek, N.; Niemann, H.; Leker, J.; Moehrle, M.G. Anticipating industry convergence: Semantic analyses vs. IPC co-classification analyses of patents. Foresight 2013, 15, 446–464. [Google Scholar] [CrossRef]
  15. Weenen, T.C.; Ramezanpour, B.; Pronker, E.S.; Commandeur, H.; Claassen, E. Food-pharma convergence in medical nutrition—Best of both worlds? PLoS ONE 2013, 8, e82609. [Google Scholar] [CrossRef] [PubMed] [Green Version]
  16. Hacklin, F.; Wallin, M.W. Convergence and interdisciplinarity in innovation management: A review, critique, and future directions. Serv. Ind. J. 2013, 33, 774–788. [Google Scholar] [CrossRef]
  17. Kim, W.; Kim, M. Reference quality-based competitive market structure for innovation driven markets. Int. J. Res. Market. 2015, 32, 284–296. [Google Scholar] [CrossRef]
  18. Lee, S.; Kim, W. Identifying the structure of knowledge networks in the U.S. mobile ecosystems: Patent citation analysis. Technol. Anal. Strateg. Manag. 2015, 28, 411–434. [Google Scholar] [CrossRef]
  19. Roco, M.C.; Bainbridge, W.S. Converging Technologies for Improving Human Performance: Nanotechnology, Biotechnology, Information Technology and Cognitive Science; Kluwer Academic Publishers: Norwell, MA, USA, 2003. [Google Scholar]
  20. Nordmann, A. Converging Technologies–Shaping the Future of European Societies; European Commission: Brussels, Belgium, 2004. [Google Scholar]
  21. Kim, W. Current transition in management of technology (MOT) education: The case of Korea. Technol. Forecast. Soc. Chang. 2015, 100, 5–20. [Google Scholar] [CrossRef]
  22. Lei, D.T. Industry evolution and competence development: The imperatives of technological convergence. Int. J. Technol. Manag. 2000, 19, 699–738. [Google Scholar] [CrossRef]
  23. Pennings, J.M.; Puranam, P. Market Convergence & Firm Strategy: New Directions for Theory and Research; ECIS Conference, The Future of Innovation Studies: Eindhoven, The Netherlands, 2001. [Google Scholar]
  24. Hamel, G. Strategy as revolution. Harv. Bus. Rev. 1996, 74, 69–82. [Google Scholar] [PubMed]
  25. Jaworski, B.; Kohli, A.K.; Sahay, A. Market-driven versus driving markets. J. Acad. Mark. Sci. 2000, 28, 45–54. [Google Scholar] [CrossRef]
  26. Cho, Y.; Kim, E.; Kim, W. Strategy transformation under technological convergence: Evidence from the printed electronics industry. Int. J. Technol. Manag. 2015, 67, 106–131. [Google Scholar] [CrossRef]
  27. Fai, F.; Von Tunzelmann, N. Industry-specific competencies and converging technological systems: Evidence from patents. Struct. Chang. Econ. Dyn. 2001, 12, 141–170. [Google Scholar] [CrossRef]
  28. Andergassen, R.; Nardini, F.; Ricottilli, M. Innovation waves, self-organized criticality and technological convergence. J. Econ. Behav. Organ. 2006, 61, 710–728. [Google Scholar] [CrossRef]
  29. D’Aveni, R.A.; Dagnino, G.B.; Smith, K.G. The age of temporary advantage. Strateg. Manag. J. 2010, 31, 1371–1385. [Google Scholar] [CrossRef]
  30. Hacklin, F.; Marxt, C.; Fahrni, F. An evolutionary perspective on convergence: Inducing a stage model of inter-industry innovation. Int. J. Technol. Manag. 2010, 49, 220–249. [Google Scholar] [CrossRef]
  31. Kim, E.; Cho, Y.; Kim, W. Dynamic patterns of technological convergence in printed electronics technologies: patent citation network. Scientometrics 2014, 98, 975–998. [Google Scholar] [CrossRef]
  32. Zhang, Y.; Li, H. Innovation search of new ventures in a technology cluster: The role of ties with service intermediaries. Strateg. Manag. J. 2010, 31, 88–109. [Google Scholar] [CrossRef]
  33. Kim, W.; Lee, J.-D. Measuring the role of technology-push and demand-pull in the dynamic development of the semiconductor industry: The case of the global DRAM market. J. Appl. Econ. 2009, 12, 83–108. [Google Scholar] [CrossRef]
  34. Christensen, C. The Innovator’s Dilemma: When New Technologies Cause Great Firms to Fail; Harvard Business Press: Boston, MA, USA, 1997. [Google Scholar]
  35. Kwak, K.; Kim, W. Effect of service integration strategy on industrial firm performance. J. Serv. Manag. 2016, 27, 391–430. [Google Scholar] [CrossRef]
  36. Bierly, P.; Chakrabarti, A.K. Managing through industry fusion. In The Dynamics Innovation: Strategic and Managerial Implications; Brockhoff, K., Chakrabarti, A.K., Hauschildt, J., Eds.; Springer: Berlin/Heidelberg, Germany; New York, NY, USA, 1999; pp. 7–26. [Google Scholar]
  37. Mowery, D.C.; Oxley, J.E.; Silverman, B.S. Strategic alliances and interfirm knowledge transfer. Strateg. Manag. J. 1996, 17, 77–91. [Google Scholar] [CrossRef]
  38. Yun, J.J.; Won, D.; Park, K. Dynamics from open innovation to evolutionary change. J. Open Innov. Technol. Market Complex. 2016, 2, 1–22. [Google Scholar] [CrossRef]
  39. Kim, S.-J.; Kim, E.-M.; Suh, Y.; Zheng, Z. The effect of service innovation on R&D activities and government support systems: The moderating role of government support systems in Korea. J. Open Innov. Technol. Market Complex. 2016, 2, 1–13. [Google Scholar]
  40. Kodama, F.; Shibata, T. Demand articulation in the open-innovation paradigm. J. Open Innov. Technol. Market Complex. 2015, 1, 1–21. [Google Scholar] [CrossRef]
  41. Duysters, G.; Hagedoorn, J. Core competences and company performance in the world-wide computer industry. J. High Technol. Manag. Res. 2000, 11, 75–91. [Google Scholar] [CrossRef]
  42. Nelson, R.R.; Winter, S. An Evolutionary Theory of Economic Change; Harvard University Press: Cambridge, MA, USA, 1982. [Google Scholar]
  43. Nill, J.; Kemp, R. Evolutionary approaches for sustainable innovation policies: From niche to paradigm? Res. Policy 2009, 38, 668–680. [Google Scholar] [CrossRef]
  44. Karvonen, M.; Kässi, T. Patent citations as a tool for analysing the early stages of convergence. Technol. Forecast. Soc. Chang. 2013, 80, 1094–1107. [Google Scholar] [CrossRef]
  45. Hsu, S.T.; Prescott, J.E. The alliance experience transfer effect: The case of industry convergence in the telecommunications equipment industry. Br. J. Manag. 2016. [Google Scholar] [CrossRef]
  46. Manning, C.D.; Surdeanu, M.; Bauer, J.; Finkel, J.R.; Bethard, S.; McClosky, D. The Stanford CoreNLP Natural Language Processing Toolkit. In Proceedings of the 52nd Annual Meeting of the Association for Computational Linguistics: System Demonstrations, Baltimore, MD, USA, 23–24 June 2014.
  47. Finkel, J.R.; Grenager, T.; Manning, C. Incorporating Non-Local Information into Information Extraction Systems by Gibbs Sampling. In Proceedings of the 43rd Annual Meeting on Association for Computational Linguistics, Ann Arbor, MI, USA, 25–30 June 2005.
  48. Hecker, D. High-technology employment: A broader view. Mon. Labor Rev. 1999, 122, 18–28. [Google Scholar]
  49. Engelberg, J.; Ozoguz, A.; Wang, S. Know thy neighbor: Industry clusters, information spillovers and market efficiency. Soc. Sci. Res. Netw. 2013. [Google Scholar] [CrossRef]
  50. Organisation for Economic Co-Operation and Development. ISIC REV. 3 Technology Intensity Definition. 2011. Available online: www.oecd.org/dataoecd/43/41/48350231.pdf (accessed on 12 October 2016).
  51. Bouma, G. Normalized (pointwise) mutual information in collocation extraction. In Proceedings of the International Conference of the German Society for Computational Linguistics and Language Technology, Potsdam, Germany, 30 September–2 October 2009.
  52. Church, K.W.; Hanks, P. Word association norms, mutual information, and lexicography. Comput. Linguist. 1990, 16, 22–29. [Google Scholar]
  53. Bass, F.M. A new product growth for model consumer durables. Manag. Sci. 1969, 15, 215–227. [Google Scholar] [CrossRef]
  54. Mahajan, V.; Muller, E.; Bass, F.M. New product diffusion models in marketing: A review and directions for research. J. Mark. 1990, 54, 1–26. [Google Scholar] [CrossRef]
  55. Choi, J.Y.; Jeong, S.; Kim, K. A study on diffusion pattern of technology convergence: Patent analysis for Korea. Sustainability 2015, 7, 11546–11569. [Google Scholar] [CrossRef]
  56. Leeflang, P.; Wittink, D.R.; Wedel, M.; Naert, P.A. Building Models for Marketing Decisions; Kluwer Academic Publishers: Boston, MA, USA, 2000. [Google Scholar]
  57. Mahajan, V.; Peterson, R.A. Models for Innovation Diffusion; Sage: Beverly Hills, CA, USA, 1985. [Google Scholar]
  58. Oh, C.; Cho, Y.; Kim, W. The effect of firm’s strategic innovation decisions on its market performance. Technol. Anal. Strateg. Manag. 2014, 27, 39–53. [Google Scholar] [CrossRef]
Figure 1. Dispersion of convergent-industry pairs by potential degree (b1) and growth rate (b2) of industry convergence (Note: only where coefficients b1 and b2 are both significant; each number represents a convergent-industry pair as shown in Table 3).
Sustainability 08 01029 g001
Figure 2. Diffusion patterns of convergent-industry pairs: (a) pairs in the first quadrant; (b) pairs in the second quadrant; (c) pairs in the third quadrant; and (d) pairs in the fourth quadrant (Note: the numbers in the legend refer to the corresponding industry pairs as shown in Table 3).
Sustainability 08 01029 g002aSustainability 08 01029 g002b
Table 1. Methods of measuring industry convergence in the literature.
Information SourceMethodologyLiterature
PatentsIPC co-classification analysisCurran and Leker [1]
Preschitschek et al. [14]
Patent citation analysisKarvonen and Kässi [44]
Industry-technology concordance analysisCurran et al. [7]
Fai and Von Tunzelmann [27]
Pennings and Puranam [23]
Product-market entryInterindustry product-market entry analysisHsu and Prescott [45]
Newspaper articlesCo-occurrence-based analysisKim et al. [10]
Table 2. List of high-technology industries.
SIC CodeIndustry
281Industrial inorganic chemicals
282Plastics materials and synthetic resins, synthetic
283Drugs
284Soap, detergents, and cleaning preparations; perfumes, cosmetics, and other toilet preparations
285Paints, varnishes, lacquers, enamels, and allied
286Industrial organic chemicals
287Agricultural chemicals
289Miscellaneous chemical products
351Engines and turbines
356General industrial machinery and equipment
357Computer and office equipment
361Electric transmission and distribution equipment
366Communications equipment
371Motor vehicles and motor vehicle equipment
372Aircraft and parts
382Laboratory apparatus and analytical, optical, measuring, and controlling instruments
384Surgical, medical, and dental instruments and supplies
386Photographic equipment and supplies
737Computer programming, data processing, and other computer related services
871Engineering, architectural, and surveying services
873Research, development, and testing services
Source: Hecker [48] and OECD [50].
Table 3. Estimation results of the logistic diffusion model of the degree of industry convergence.
No.SIC Code PairConvergent-Industry PairInitial DIC (b0)Potential DIC (b1)Growth Rate (b2)
1284–282Soap, detergents, and cleaning preparations; perfumes, cosmetics, and other toilet preparations—Plastics materials and synthetic resins, synthetic0.0310.382 **0.154 **
2285–284Paints, varnishes, lacquers, enamels, and allied—Soap, detergents, and cleaning preparations; perfumes, cosmetics, and other toilet preparations0.228 ***0.941 **0.088 **
3285–285Paints, varnishes, lacquers, enamels, and allied—Paints, varnishes, lacquers, enamels, and allied0.506 ***0.978 ***0.115 *
4286–282Industrial organic chemicals—Plastics materials and synthetic resins, synthetic0.214 ***0.556 ***0.192 **
5286–283Industrial organic chemicals—Drugs0.0190.309 ***0.275 ***
6287–281Agricultural chemicals—Industrial inorganic chemicals0.053 *0.807 ***0.591 ***
7287–284Agricultural chemicals—Soap, detergents, and cleaning preparations; perfumes, cosmetics, and other toilet preparations0.0150.509 ***0.532 ***
8356–281General industrial machinery and equipment—Industrial inorganic chemicals0.271 ***1.095 ***0.101 ***
9356–282General industrial machinery and equipment—Plastics materials and synthetic resins, synthetic0.064 *0.671 *0.133 *
10356–284General industrial machinery and equipment—Soap, detergents, and cleaning preparations; perfumes, cosmetics, and other toilet preparations0.055 *0.968 *0.142 **
11356–287General industrial machinery and equipment—Agricultural chemicals0.0300.703 ***0.359 ***
12357–285Computer and office equipment—Paints, varnishes, lacquers, enamels, and allied0.0120.346 ***0.224 **
13357–286Computer and office equipment—Industrial organic chemicals0.0080.337 ***0.263 ***
14372–281Aircraft and parts—Industrial inorganic chemicals0.071 **0.386 ***0.189 ***
15372–285Aircraft and parts—Paints, varnishes, lacquers, enamels, and allied0.0340.418 ***0.205 ***
16372–356Aircraft and parts—General industrial machinery and equipment0.0000.332 ***0.430 **
17382–284Laboratory apparatus and analytical, optical, measuring, and controlling instruments—Soap, detergents, and cleaning preparations; perfumes, cosmetics, and other toilet preparations0.0140.464 **0.179 ***
18382–285Laboratory apparatus and analytical, optical, measuring, and controlling instruments—Paints, varnishes, lacquers, enamels, and allied0.187 ***0.630 ***0.117 **
19382–287Laboratory apparatus and analytical, optical, measuring, and controlling instruments—Agricultural chemicals0.0040.412 ***0.753 *
20386–281Photographic equipment and supplies—Industrial inorganic chemicals0.217 ***0.618 ***0.112 **
21386–287Photographic equipment and supplies—Agricultural chemicals0.0040.410 ***0.695 **
22386–356Photographic equipment and supplies—General industrial machinery and equipment0.0100.587 ***0.247 ***
23873–281Research, development, and testing services—Industrial inorganic chemicals0.341 ***0.935 ***0.099 ***
24873–282Research, development, and testing services—Plastics materials and synthetic resins, synthetic0.066 **0.516 ***0.144 **
25873–356Research, development, and testing services—General industrial machinery and equipment0.089 *0.926 ***0.150 **
26873–372Research, development, and testing services—Aircraft and parts0.0000.255 ***0.552 *
27873–386Research, development, and testing services—Photographic equipment and supplies0.0310.488 ***0.196 **
28282–281Plastics materials and synthetic resins, synthetic—Industrial inorganic chemicals0.279 ***0.579 ***0.115
29285–283Paints, varnishes, lacquers, enamels, and allied—Drugs0.118 ***0.5620.060
30289–281Miscellaneous chemical products—Industrial inorganic chemicals0.336 ***0.570 ***0.126
31289–285Miscellaneous chemical products—Paints, varnishes, lacquers, enamels, and allied0.289 ***0.526 ***0.160
32289–286Miscellaneous chemical products—Industrial organic chemicals0.290 ***0.551 ***0.124
33289–287Miscellaneous chemical products—Agricultural chemicals0.0000.421 ***1.431
34357–281Computer and office equipment—Industrial inorganic chemicals0.061 *1.3430.079
35357–287Computer and office equipment—Agricultural chemicals0.0020.170 ***0.444
36371–281Motor vehicles and motor vehicle equipment—Industrial inorganic chemicals0.0000.151 ***1.287
37371–285Motor vehicles and motor vehicle equipment—Paints, varnishes, lacquers, enamels, and allied0.0220.197 *0.152
38382–356Laboratory apparatus and analytical, optical, measuring, and controlling instruments—General industrial machinery and equipment0.081 **1.2510.092 *
39386–284Photographic equipment and supplies—Soap, detergents, and cleaning preparations; perfumes, cosmetics, and other toilet preparations0.036 *0.6870.113 *
40873–285Research, development, and testing services—Paints, varnishes, lacquers, enamels, and allied0.323 ***1.132 *0.078
41873–289Research, development, and testing services—Miscellaneous chemical products0.182 ***1.4880.038
42873–382Research, development, and testing services—Laboratory apparatus and analytical, optical, measuring, and controlling instruments0.089 **0.8200.093
43282–282Plastics materials and synthetic resins, synthetic—Plastics materials and synthetic resins, synthetic0.106 **0.306 ***0.132
44283–283Drugs—Drugs0.335 ***0.667 **0.069
45873–873Research, development, and testing services—Research, development, and testing services0.212 ***1.4290.072
46Total 0.112 ***0.529 ***0.103 ***
Note: * p < 0.1; ** p < 0.05; *** p < 0.01.
Table 4. OLS regression result of a relationship between the growth rate and the potential degree of convergence.
VariableCoeff.95% Confidence Interval
Growth rate−0.538 ** (0.230)[−1.012, −0.064]
Constant0.736 *** (0.076)[0.580, 0.892]
R20.179
F5.46 **
Note: ** p < 0.05; *** p < 0.01. Standard errors are in parentheses.

