
Mapping Dynamic Urban Land Use Patterns with Crowdsourced Geo-Tagged Social Media (Sina-Weibo) and Commercial Points of Interest Collections in Beijing, China

Abstract
:1. Introduction
2. Related Works in Mapping Urban Dynamics and Land Use
2.1. Mapping Urban Dynamics with Social Media and Social Sensor Data
2.2. Clustering Algorithms for Land Use
2.3. Text Mining in Social Media
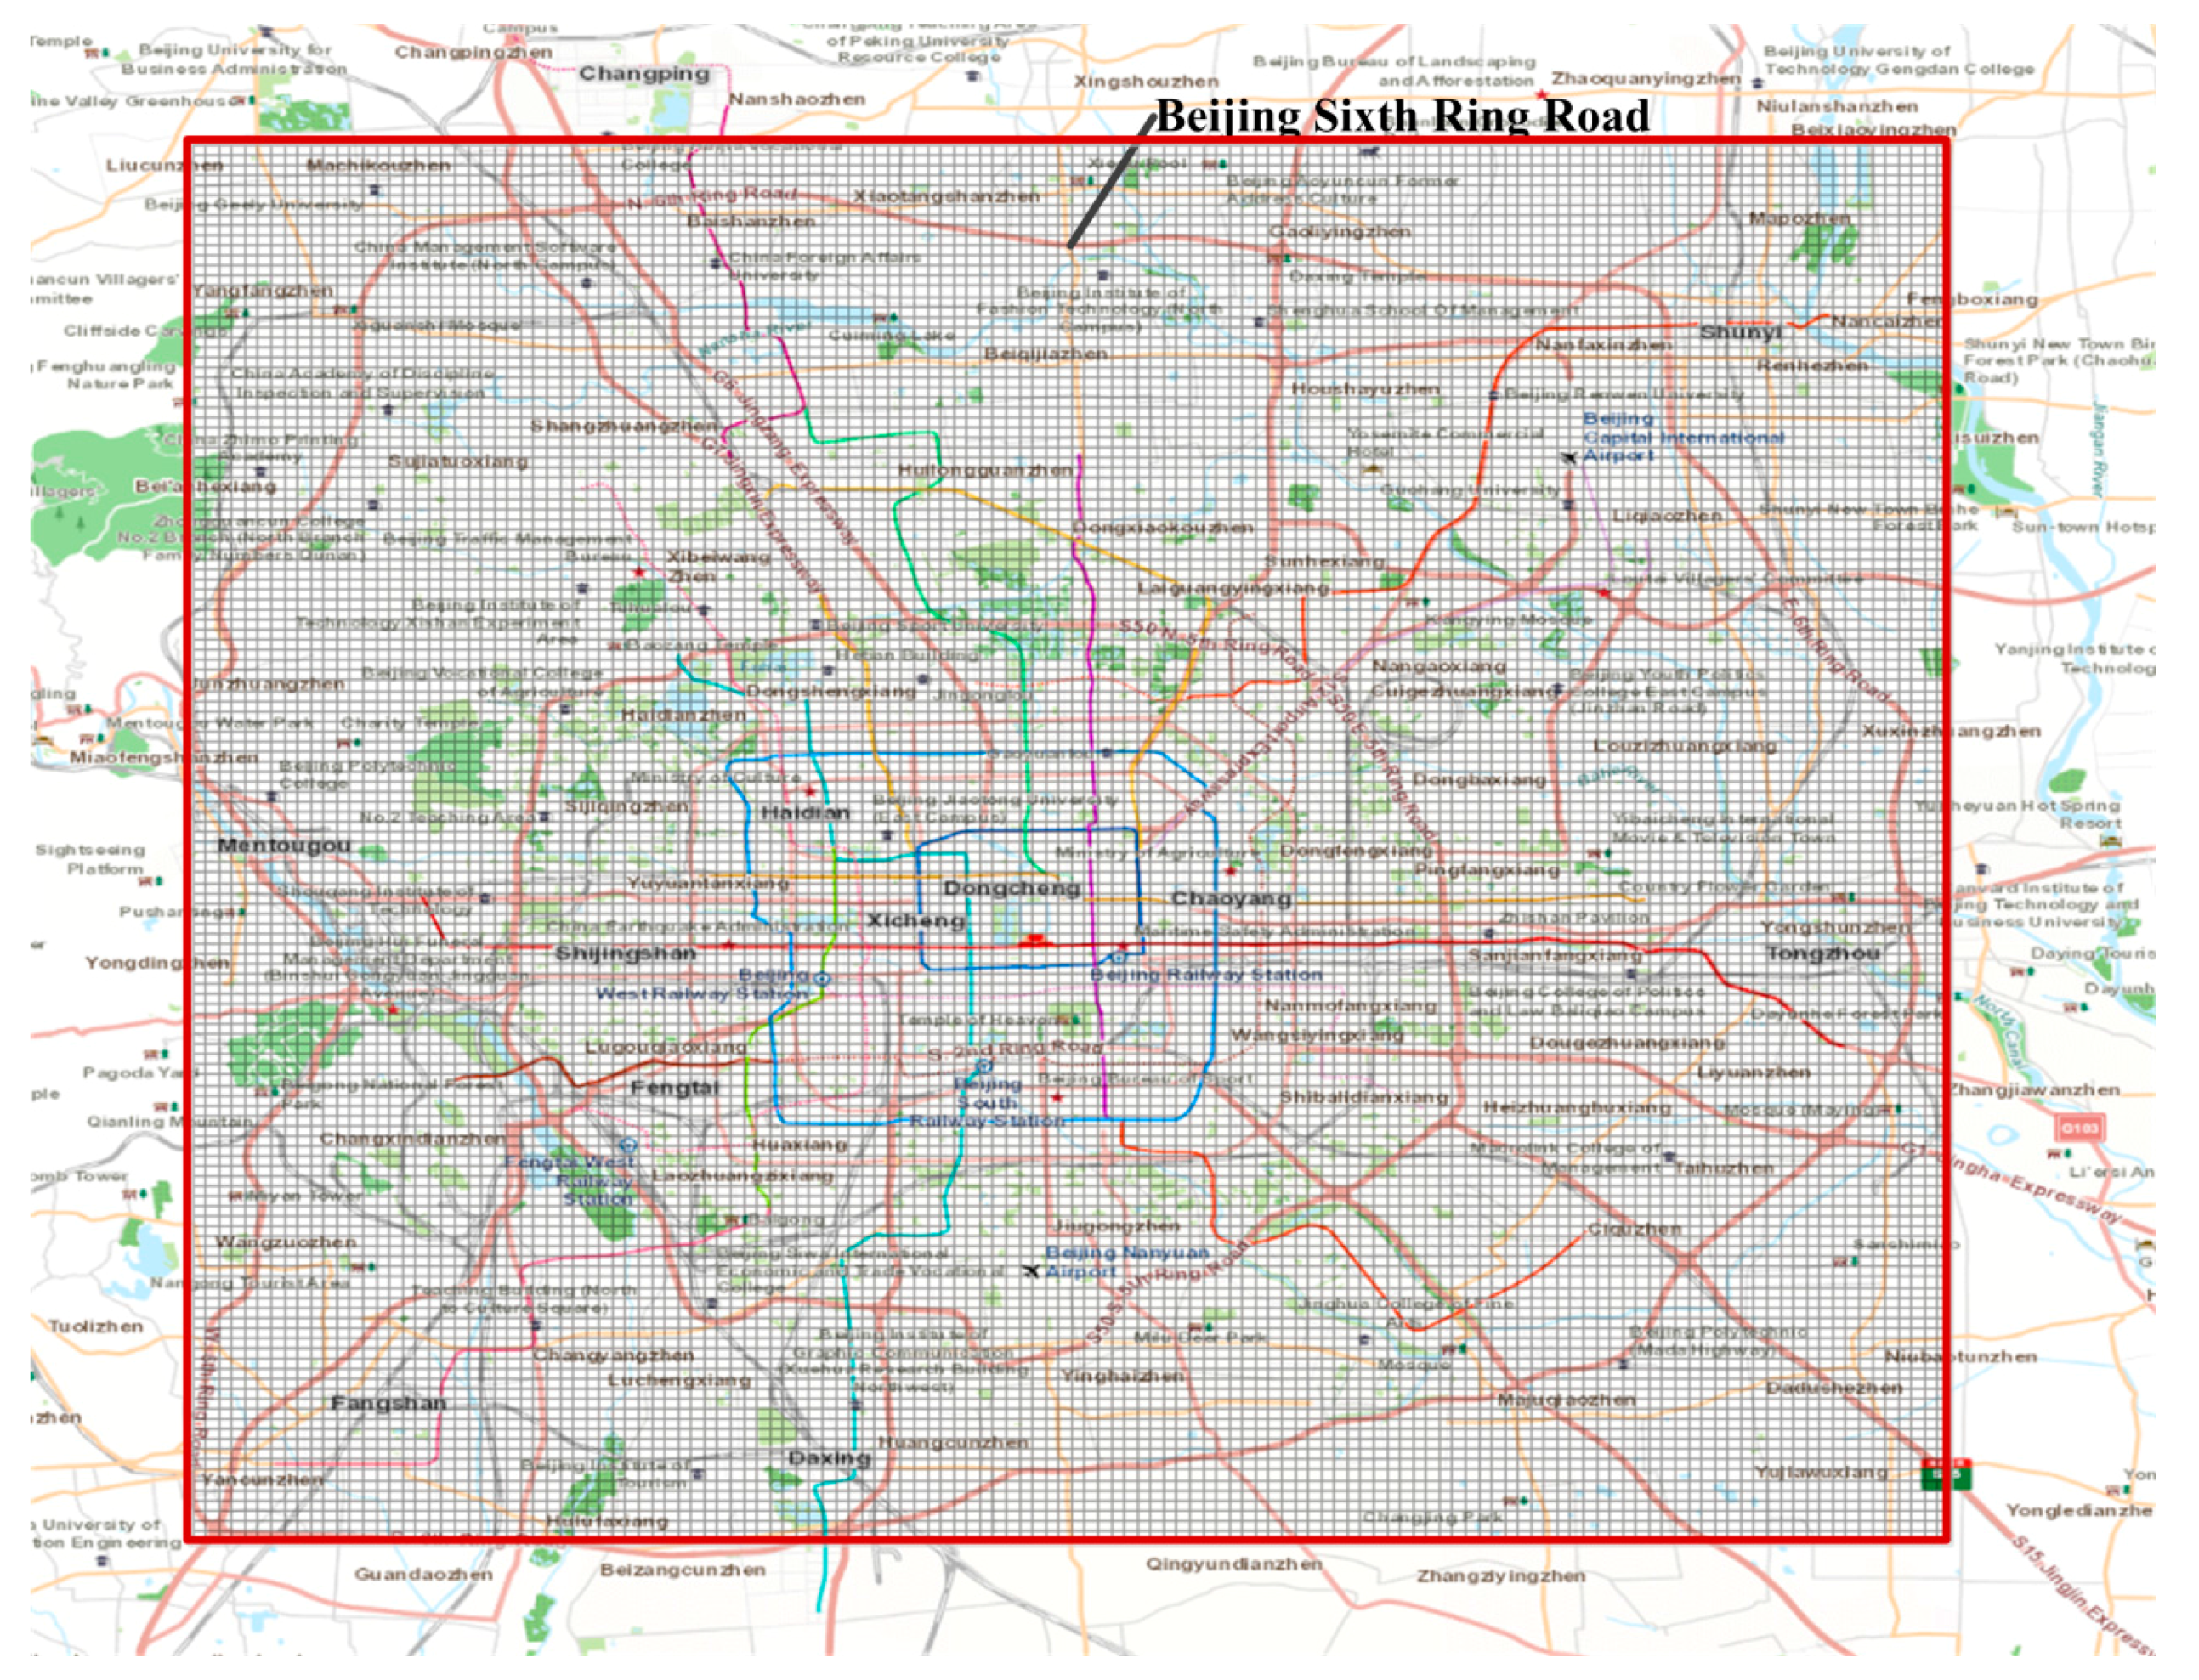
3. Data Collection and Land Use Type Analysis
3.1. Data Collection
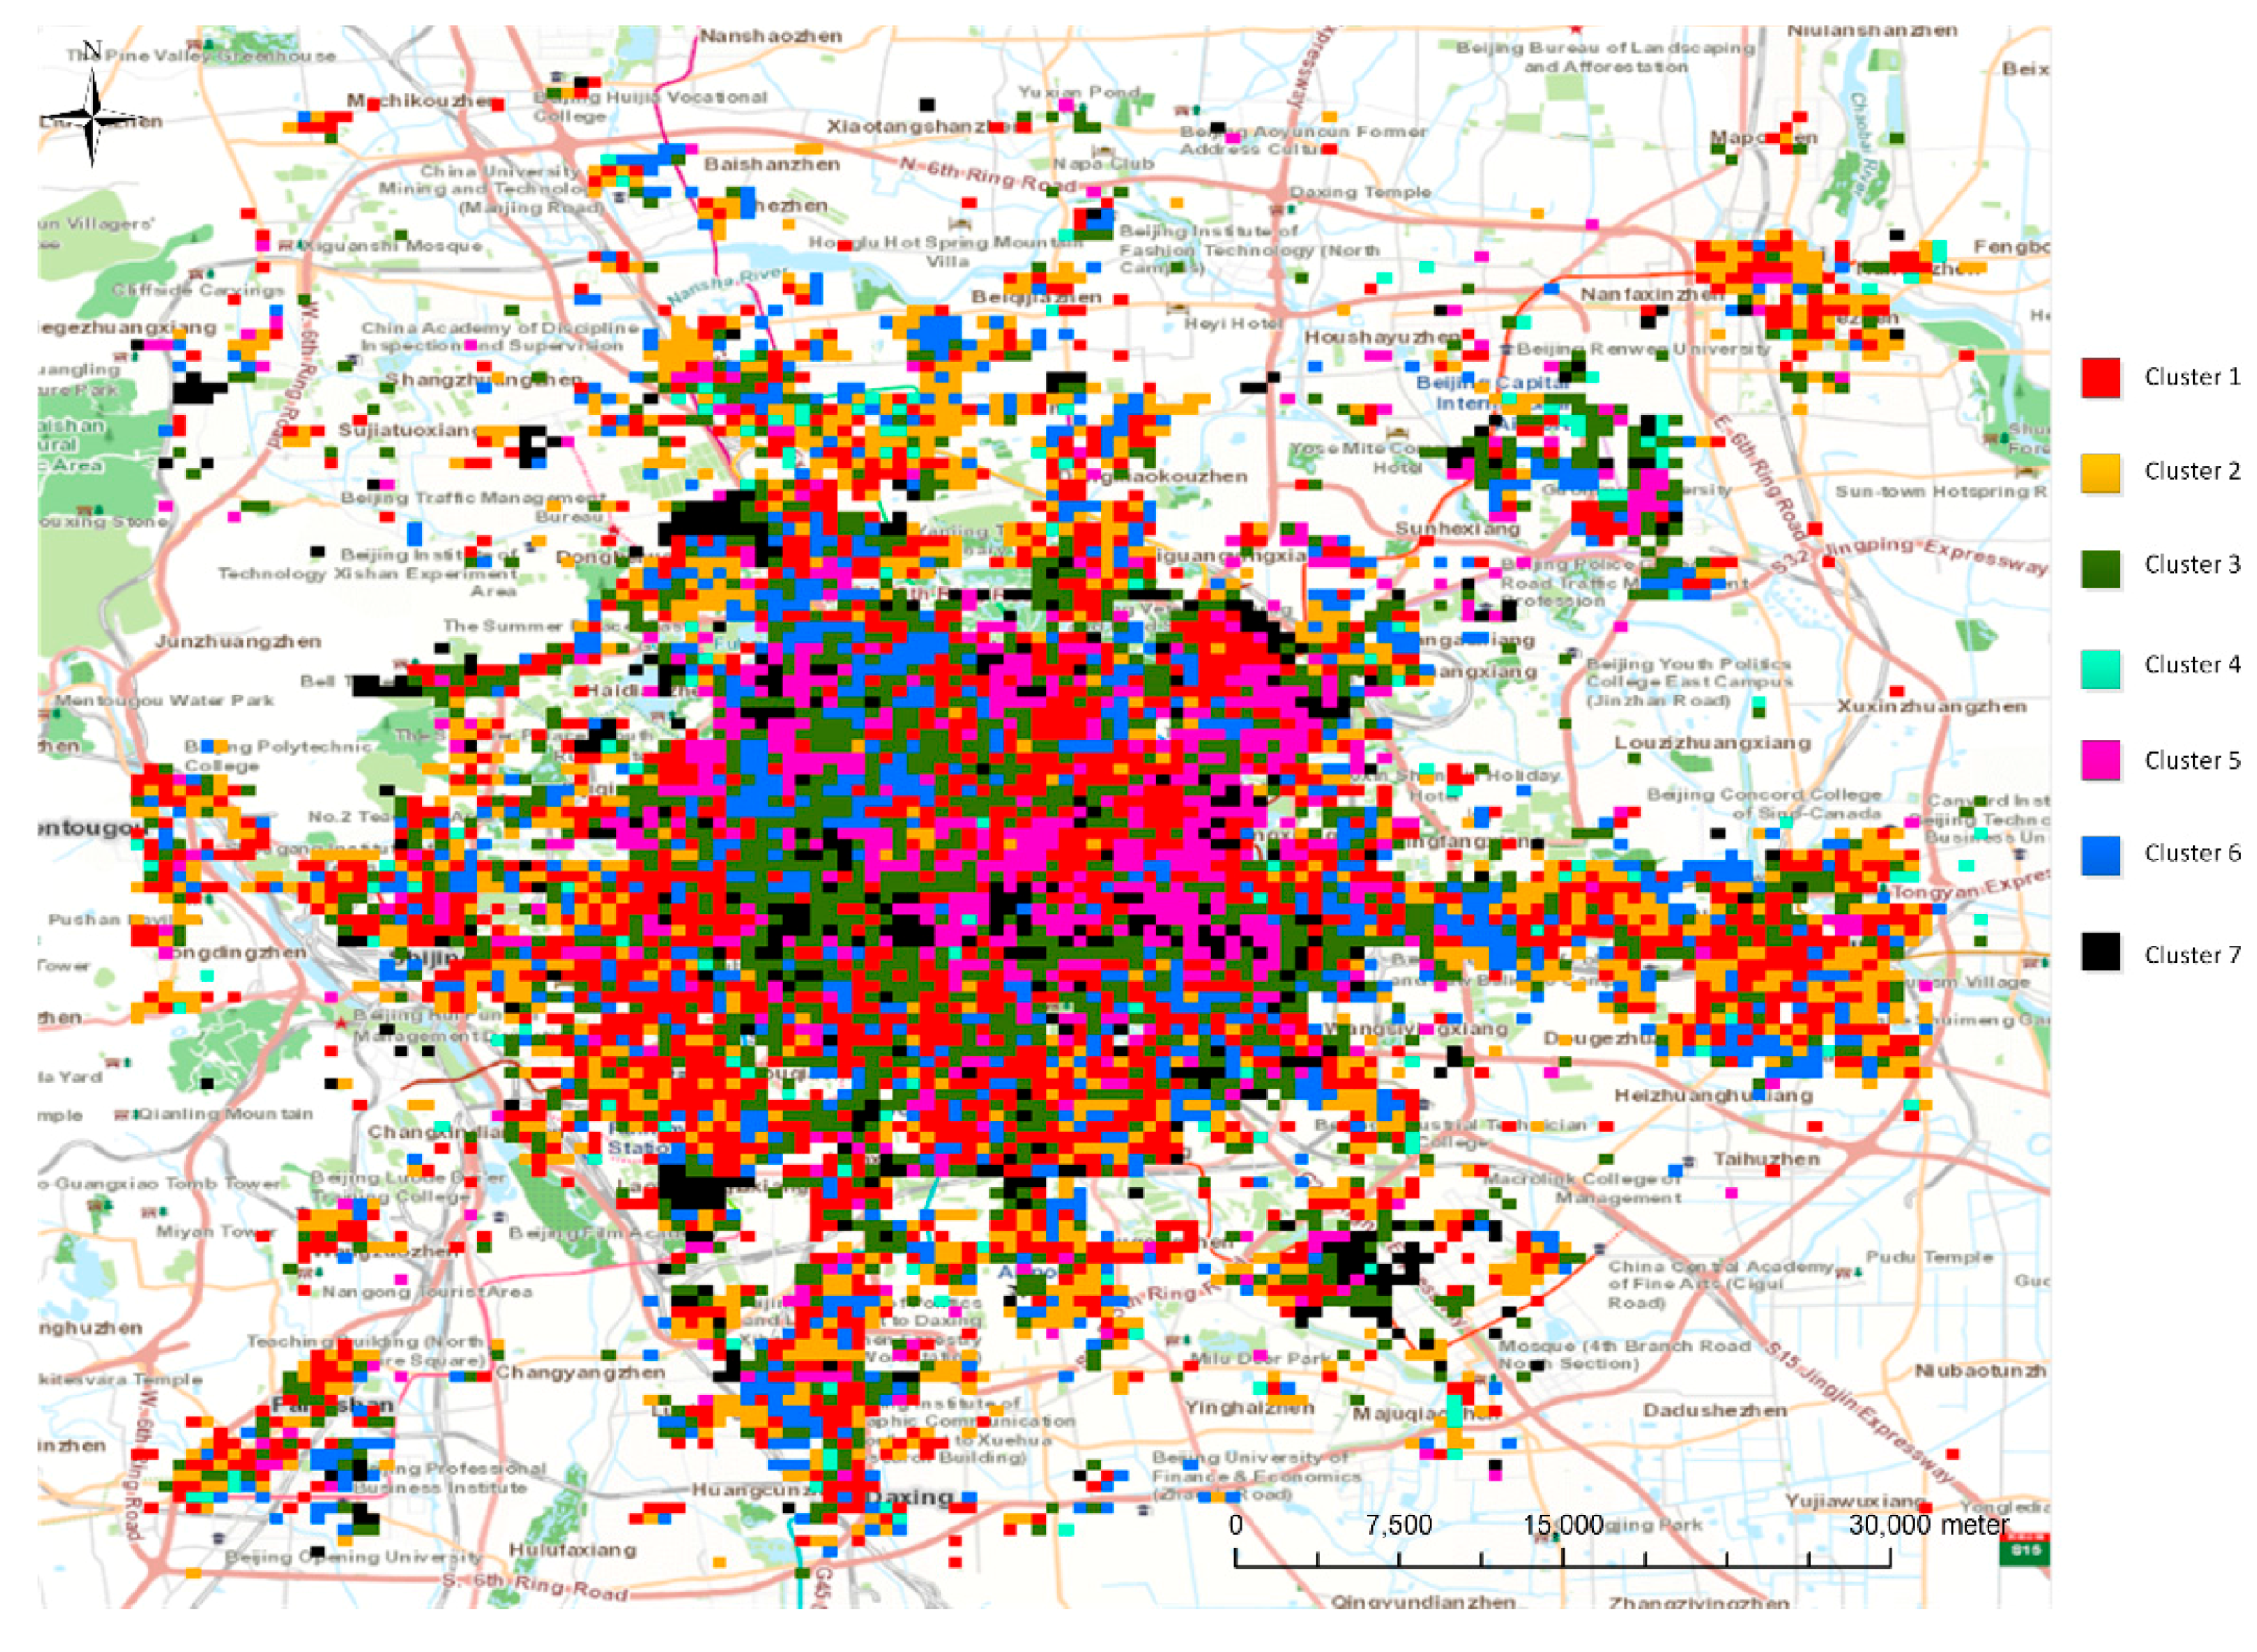
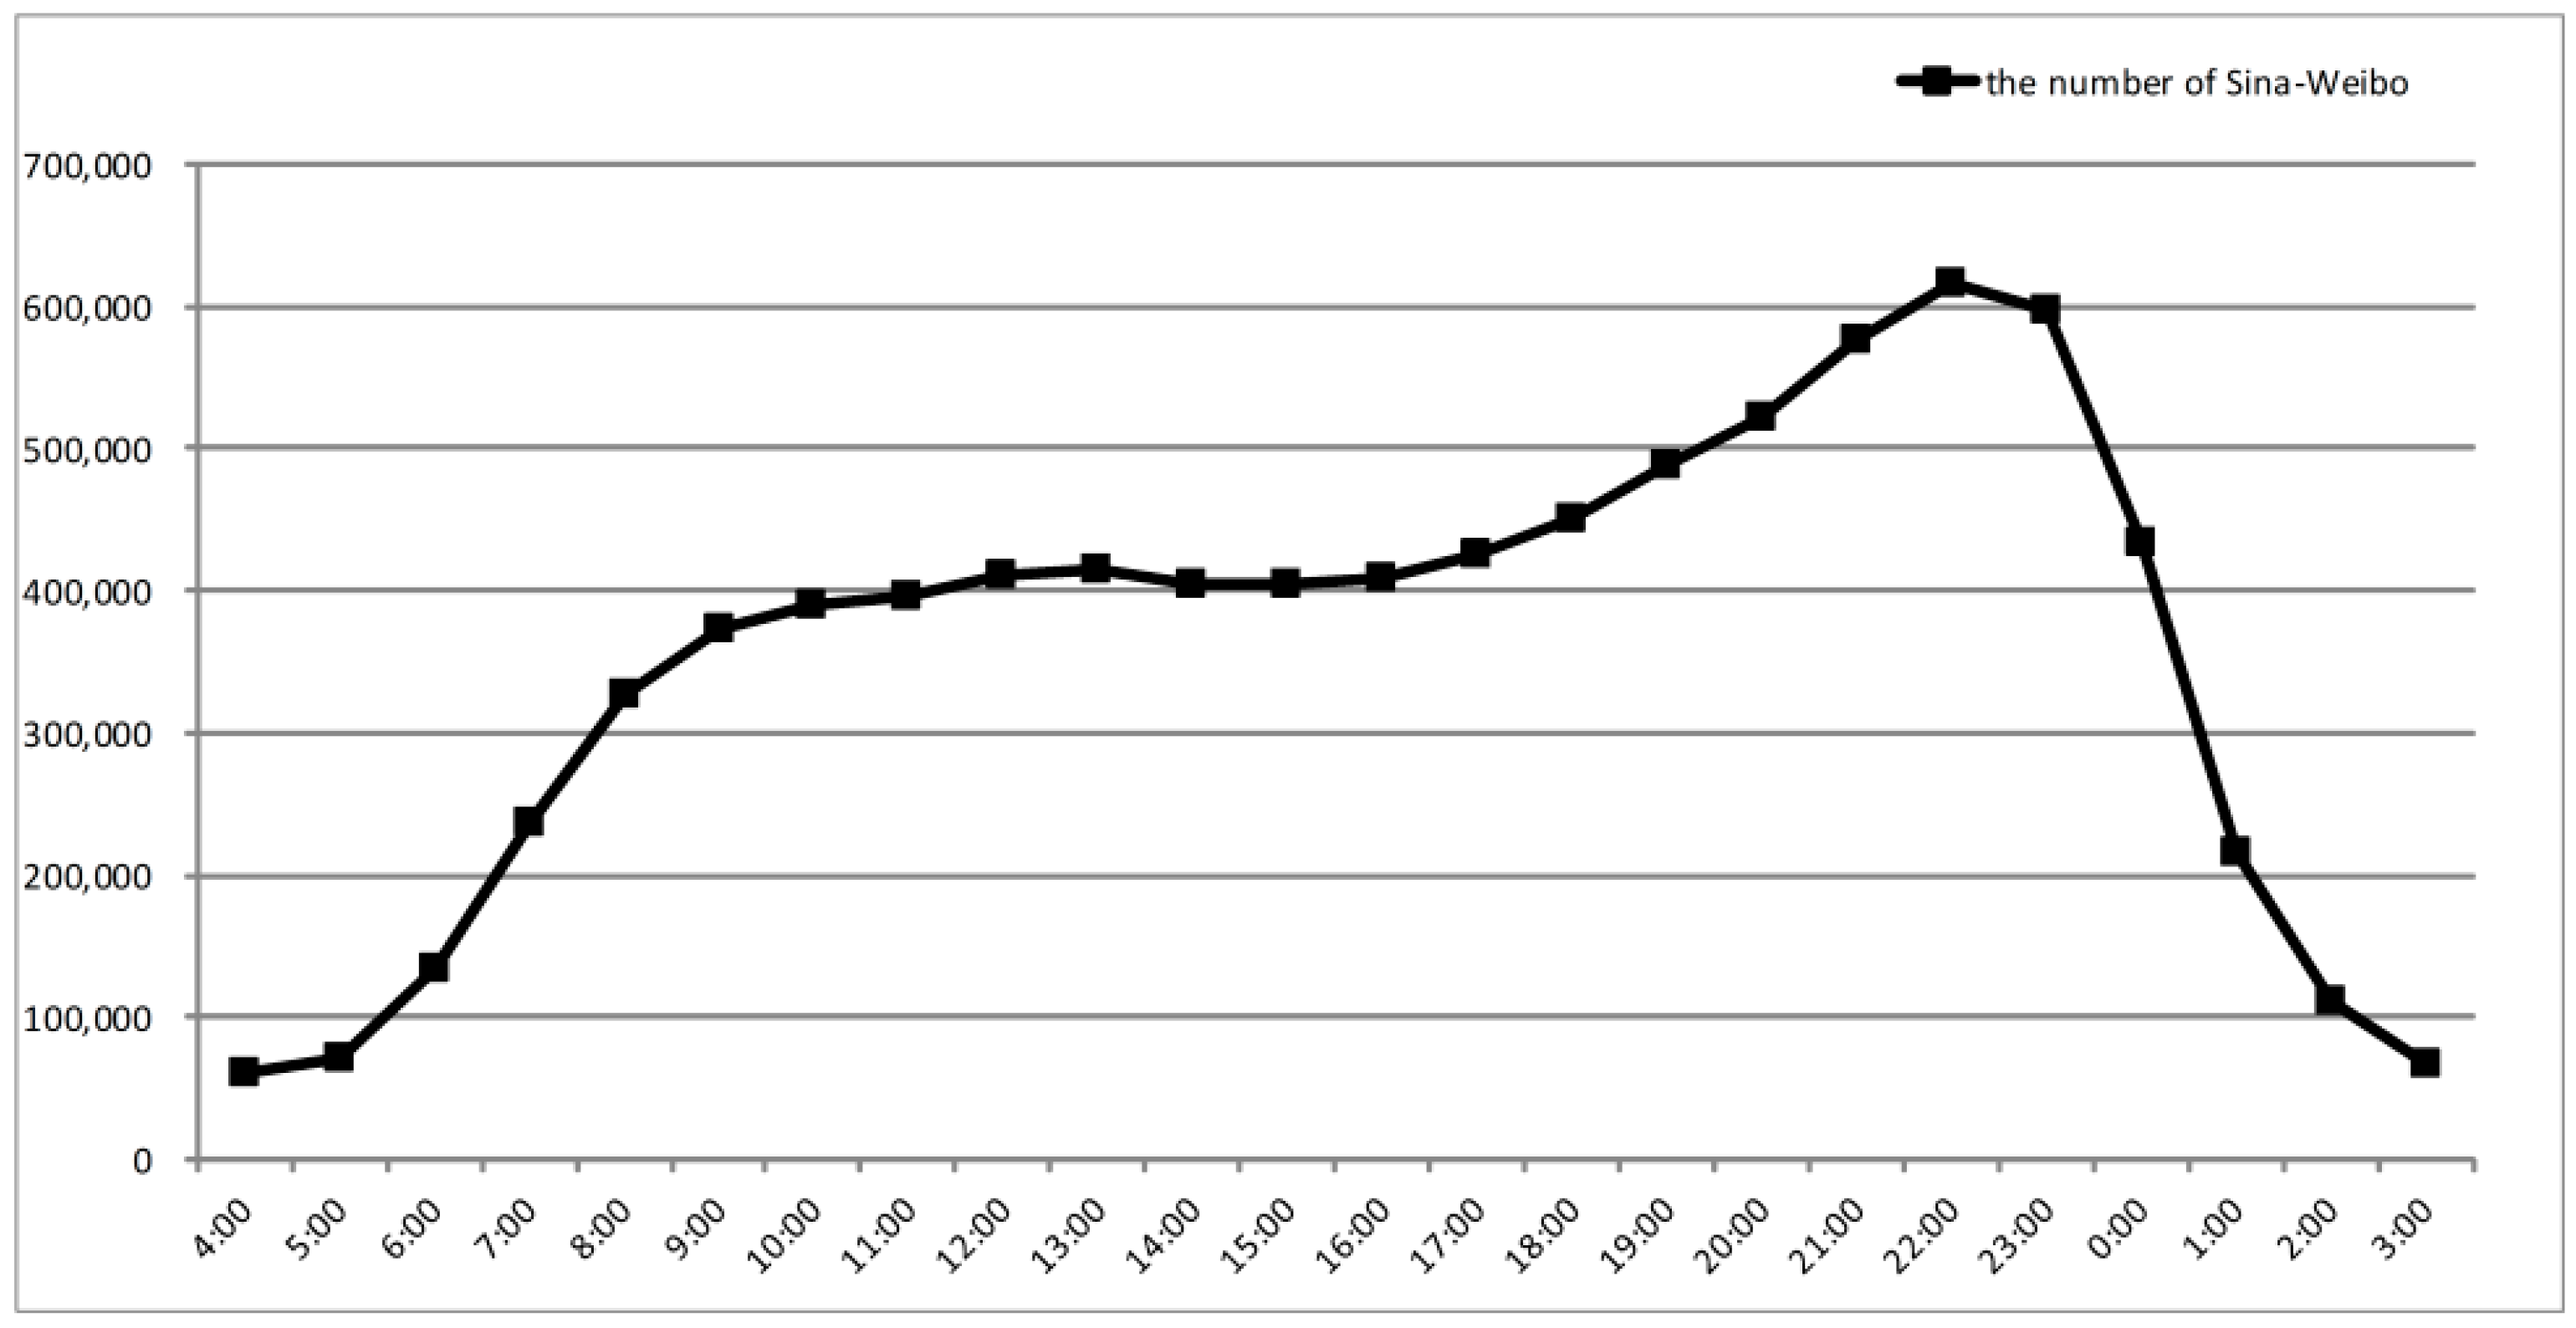
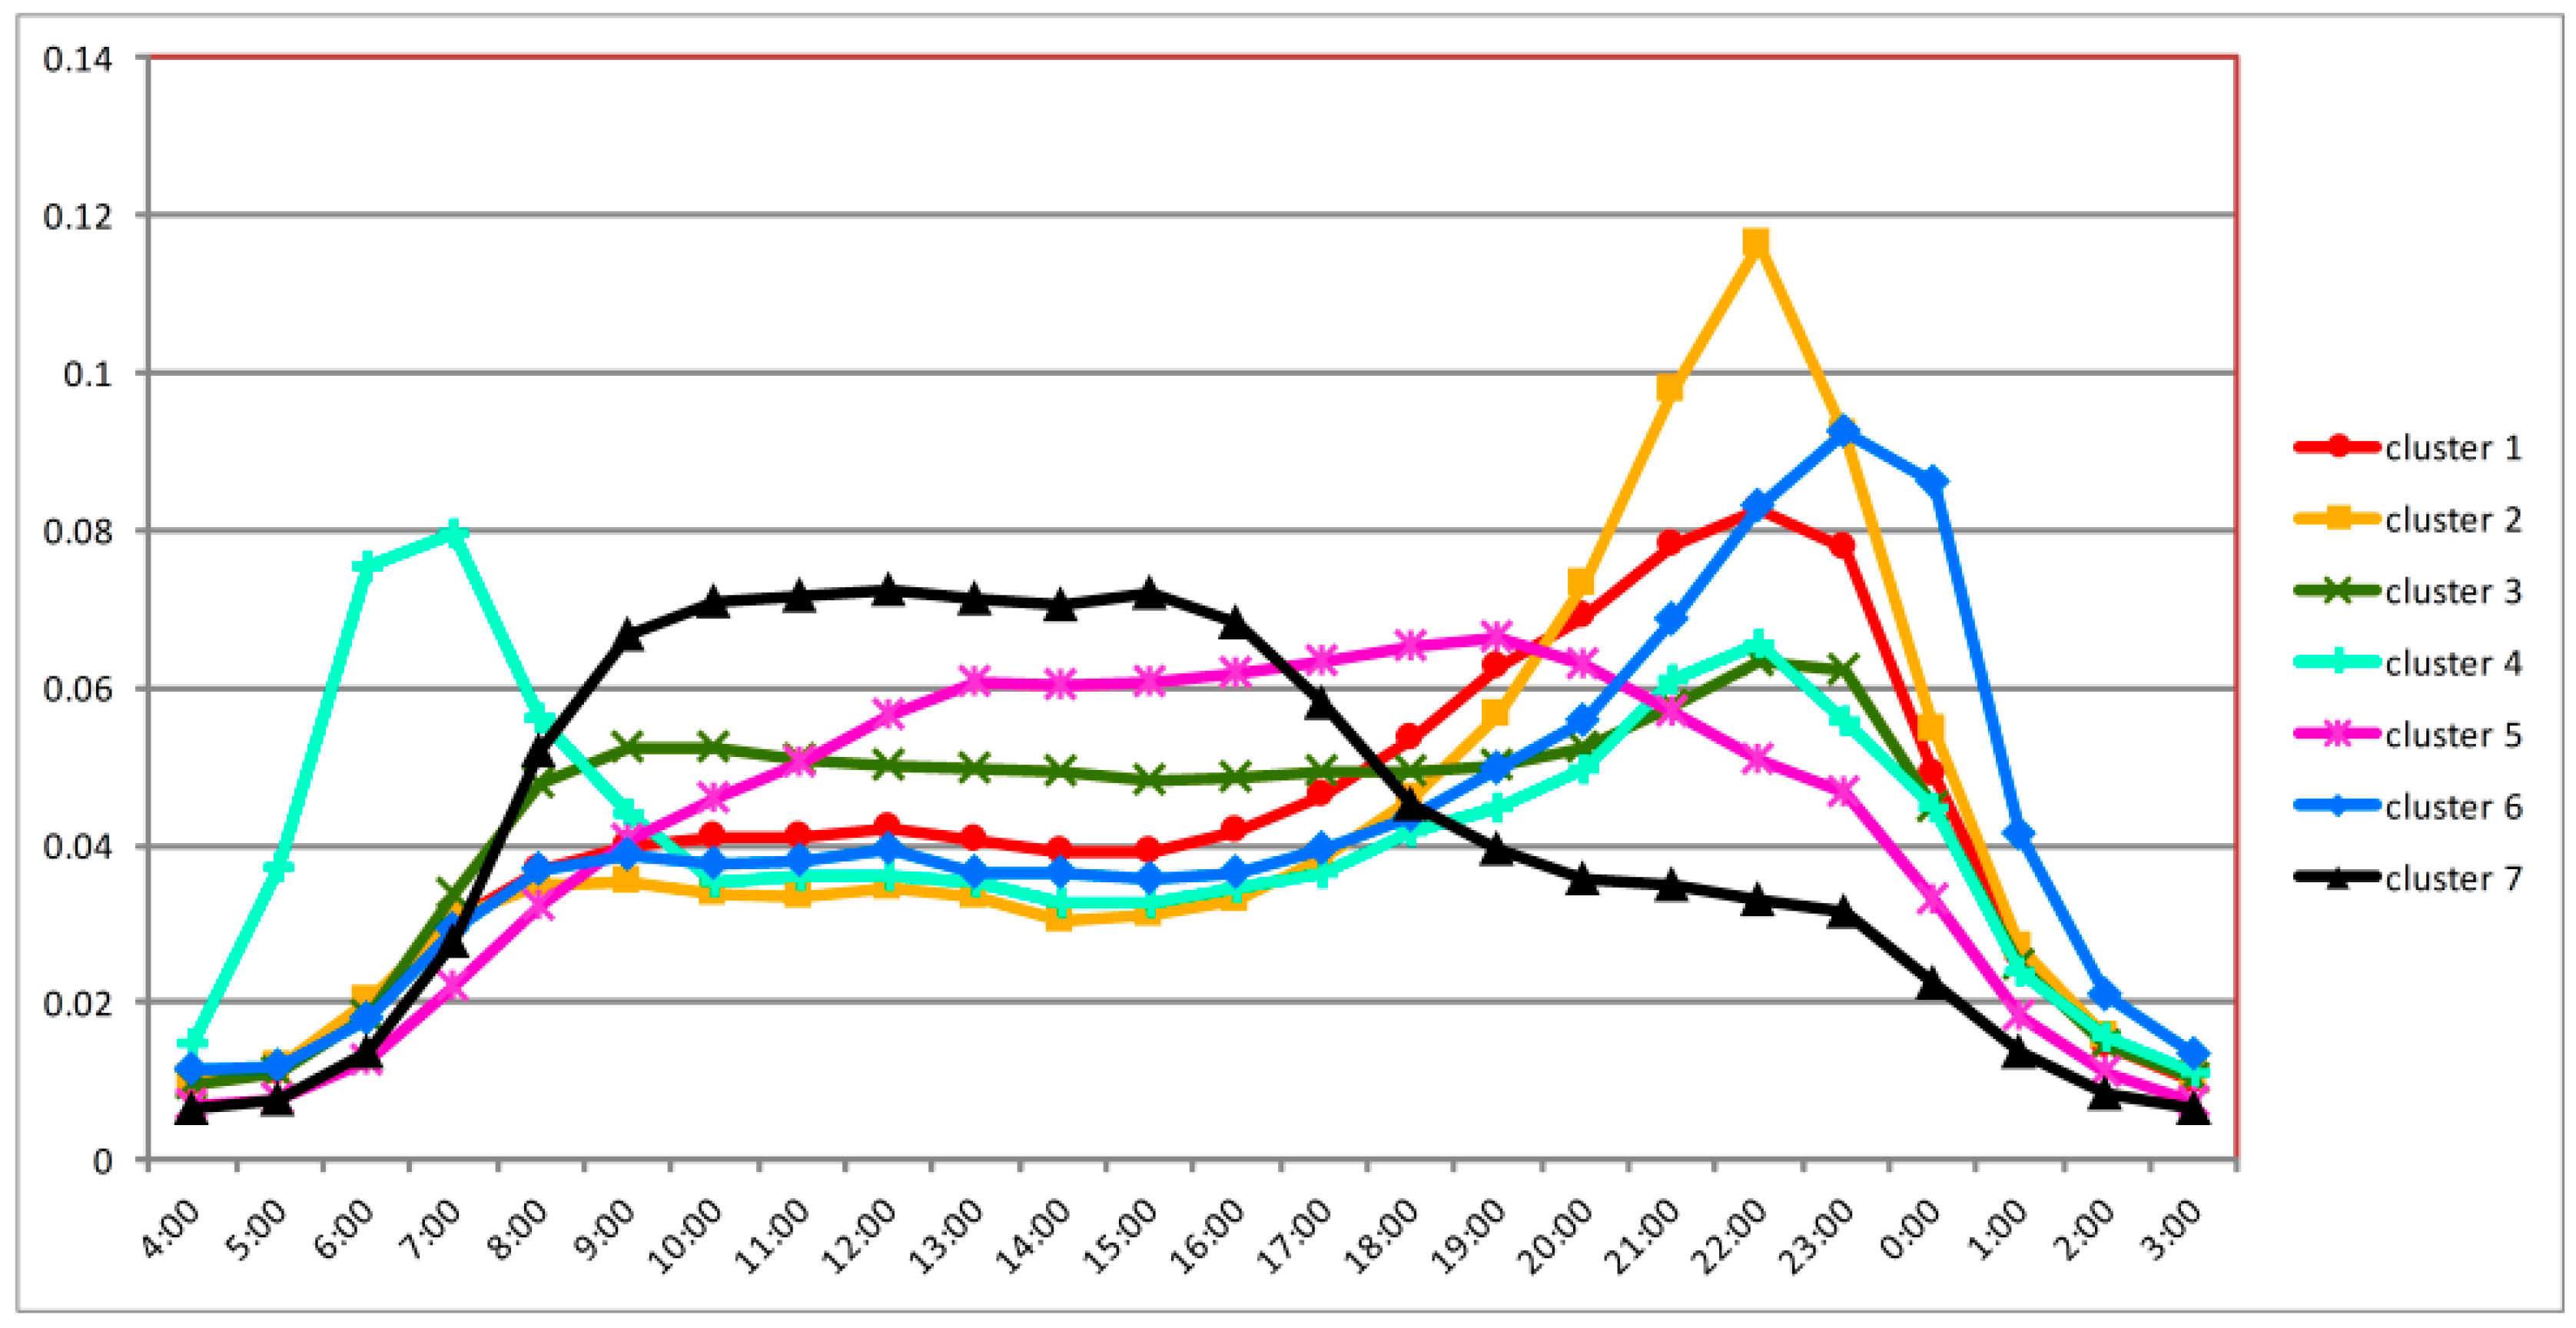
3.2. Grid-Based Land Use Segmentation and Aggregated Temporal Trends
3.3. Analysis of Different Clusters with Associated Land Use Types
3.4. Commercial POI Analysis for the Verification of Land Use Types
4. Results and Discussion
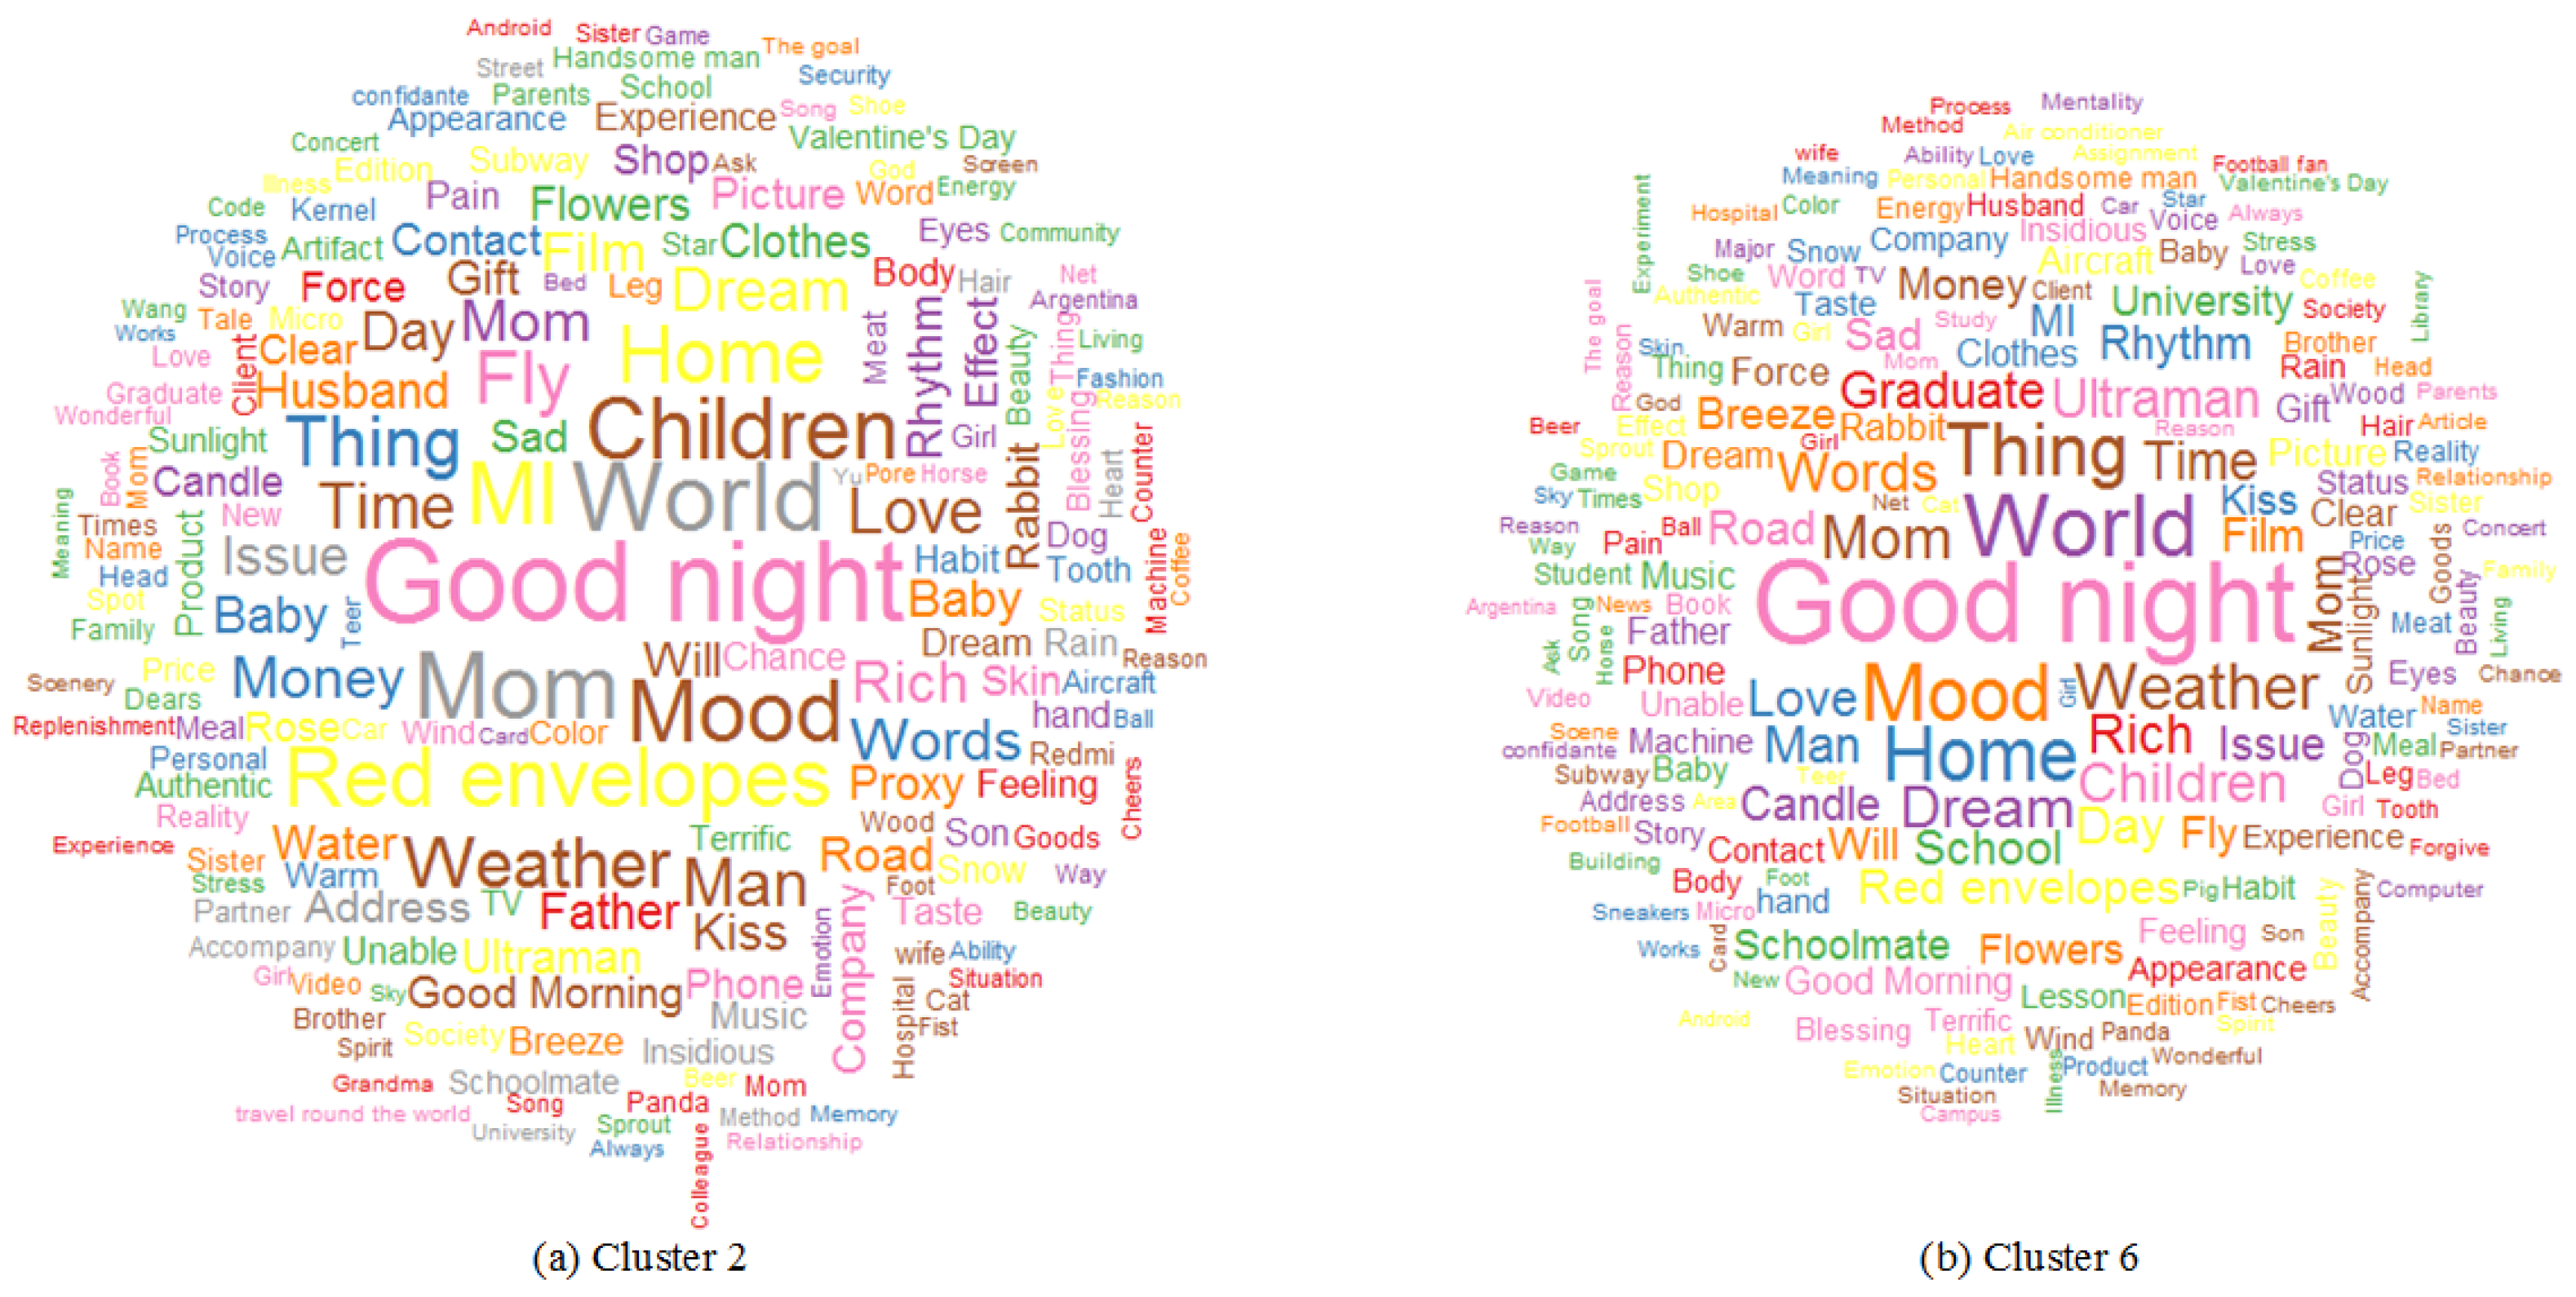
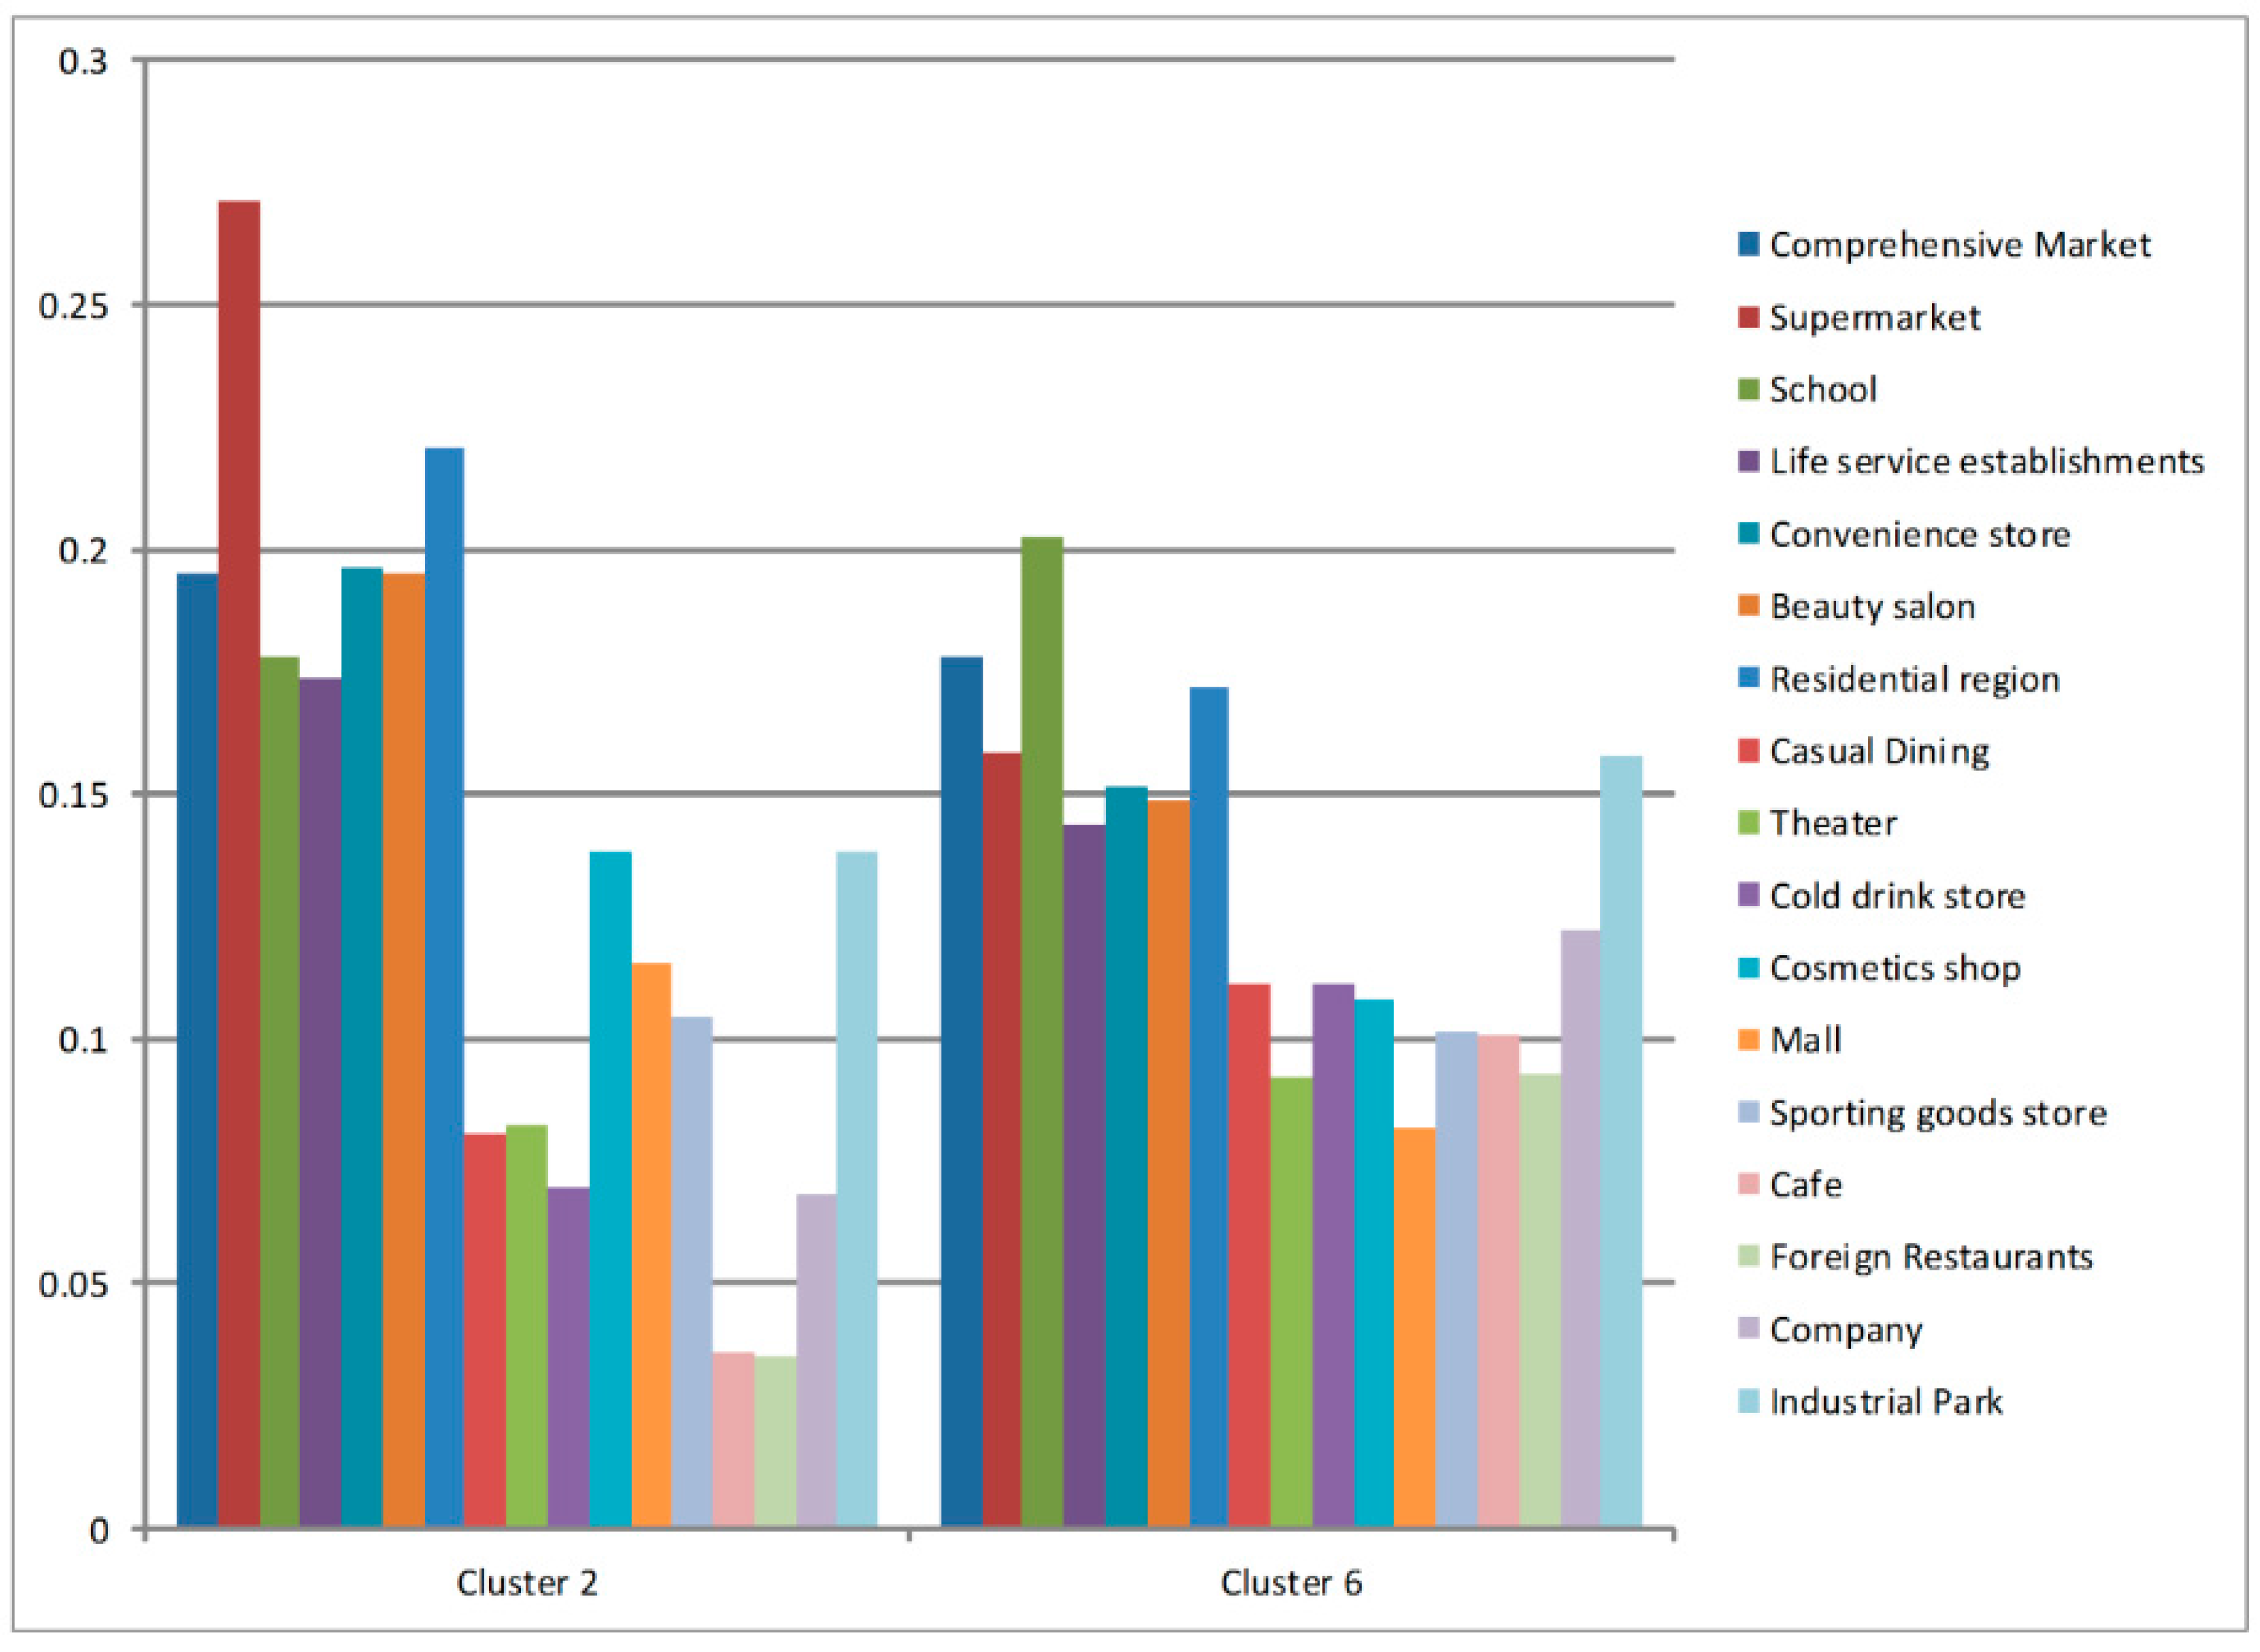
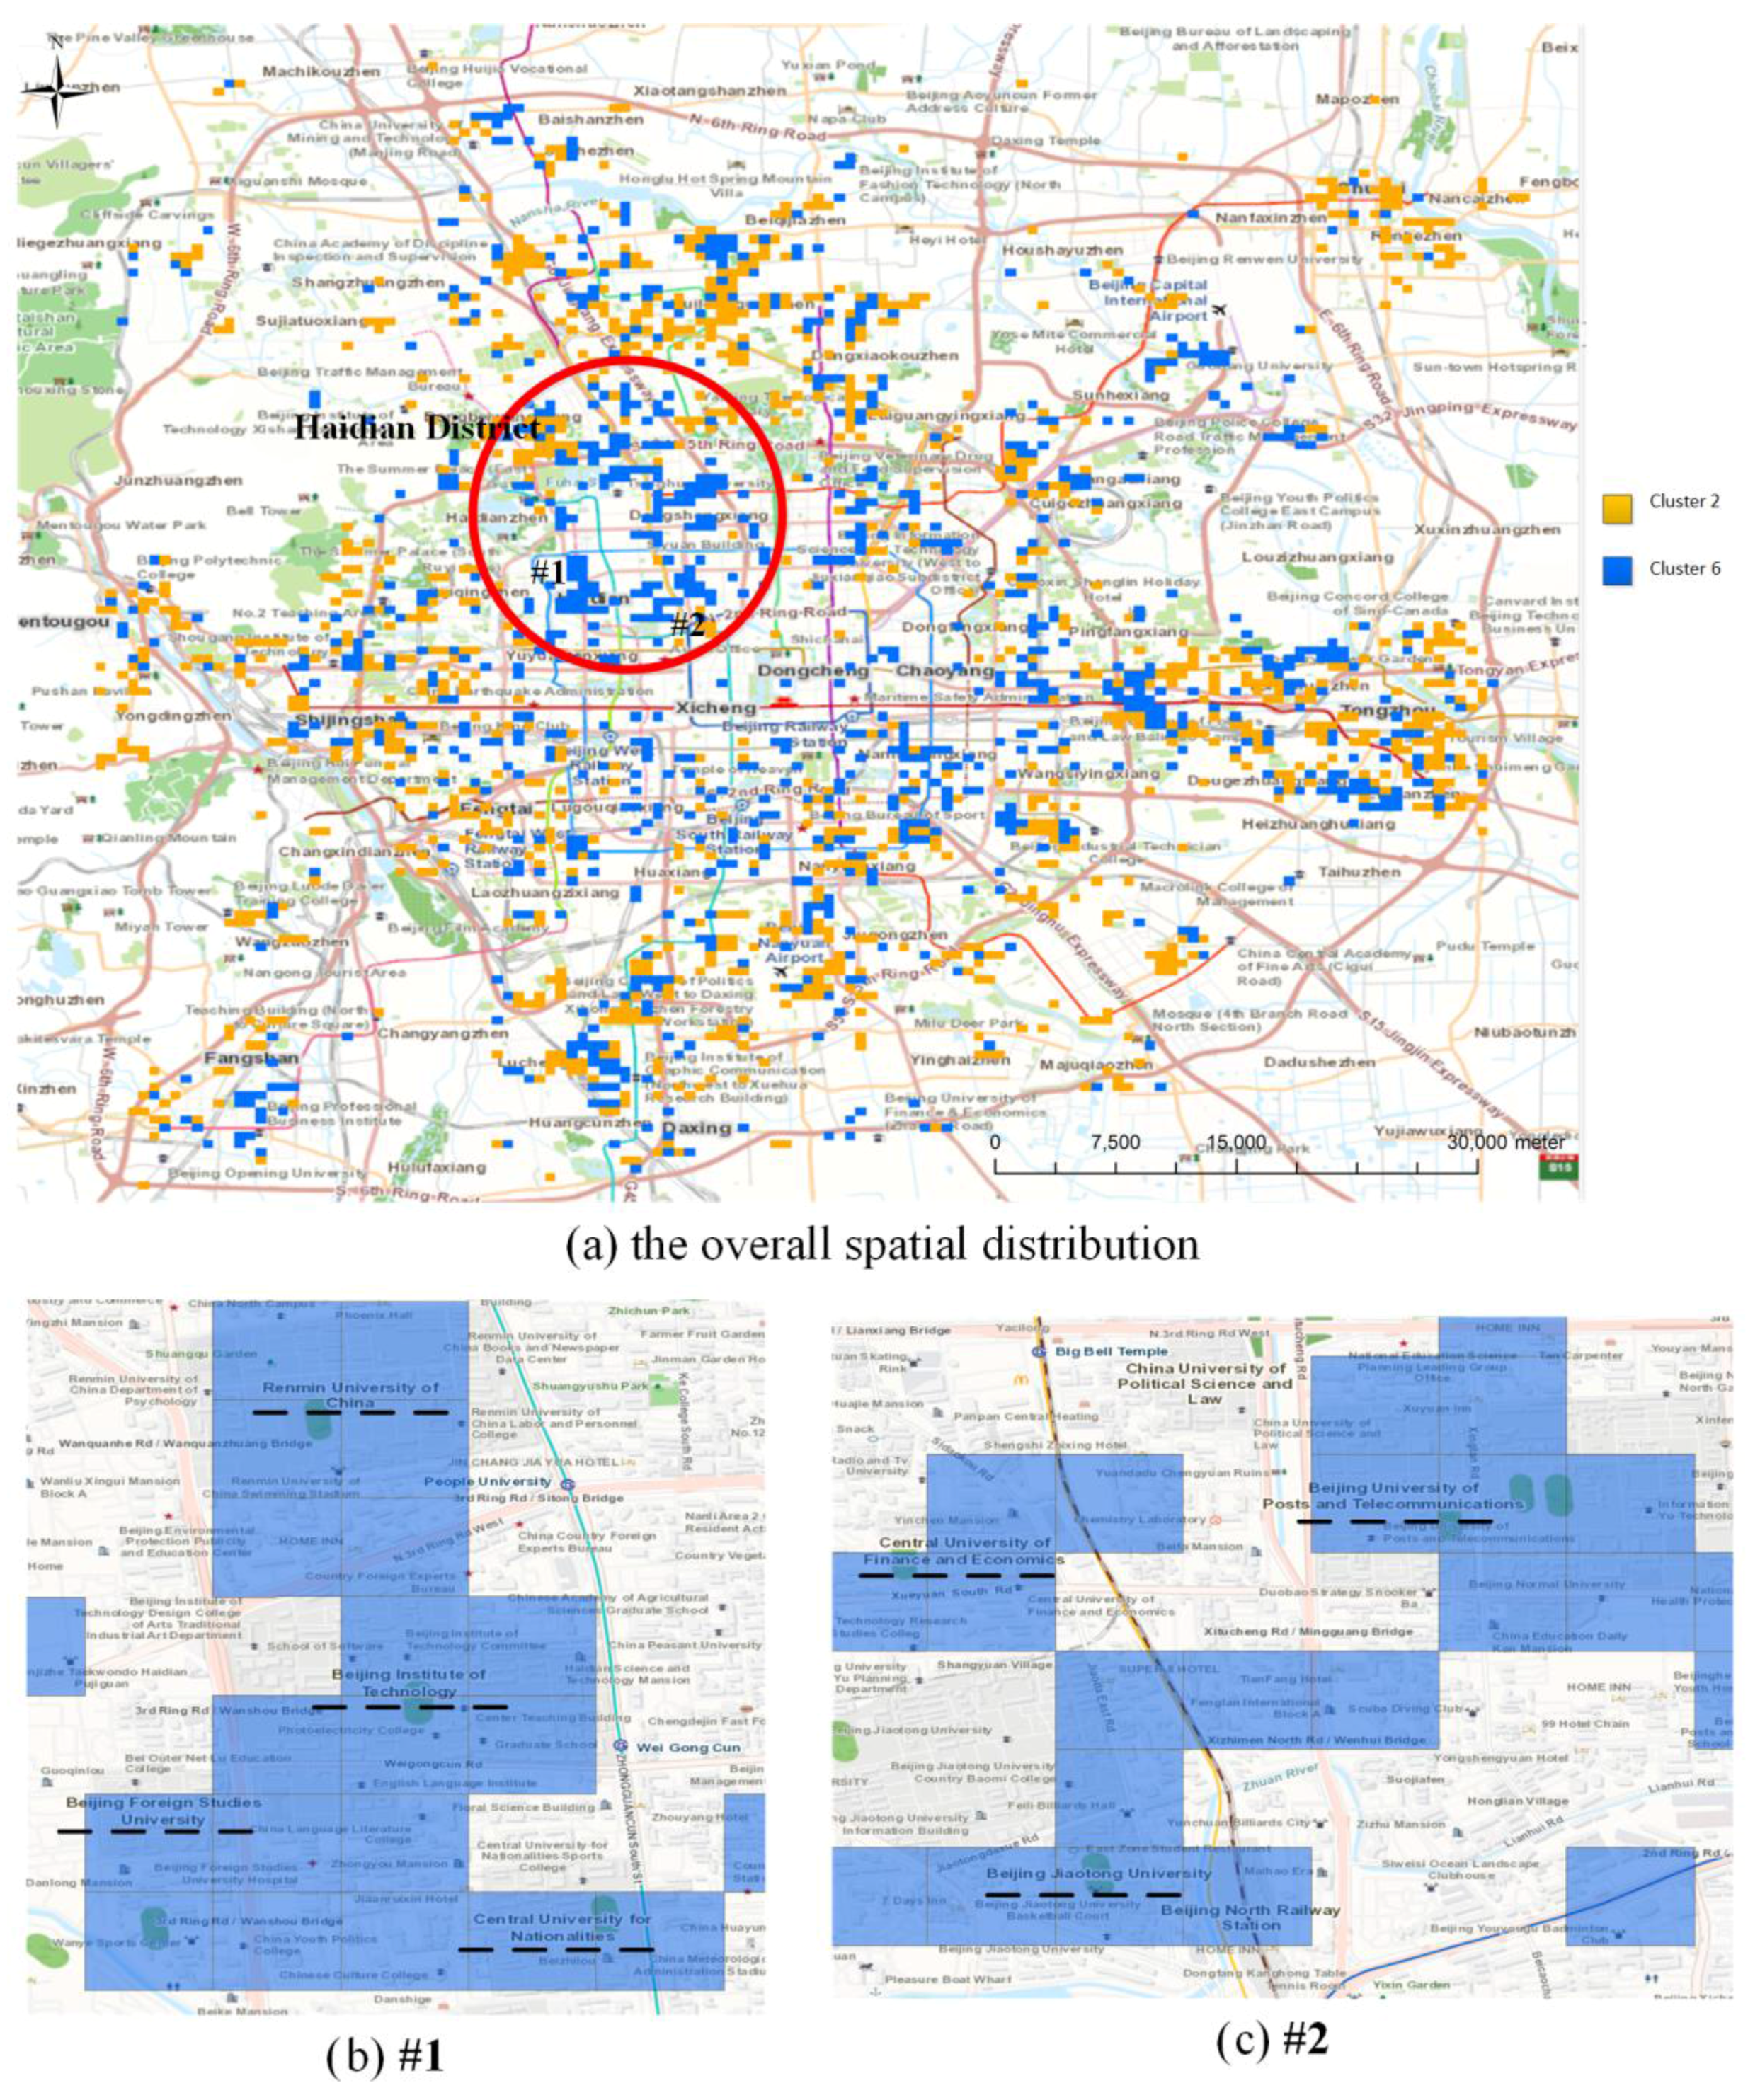
4.1. Residential Areas (Cluster 2 and Cluster 6)
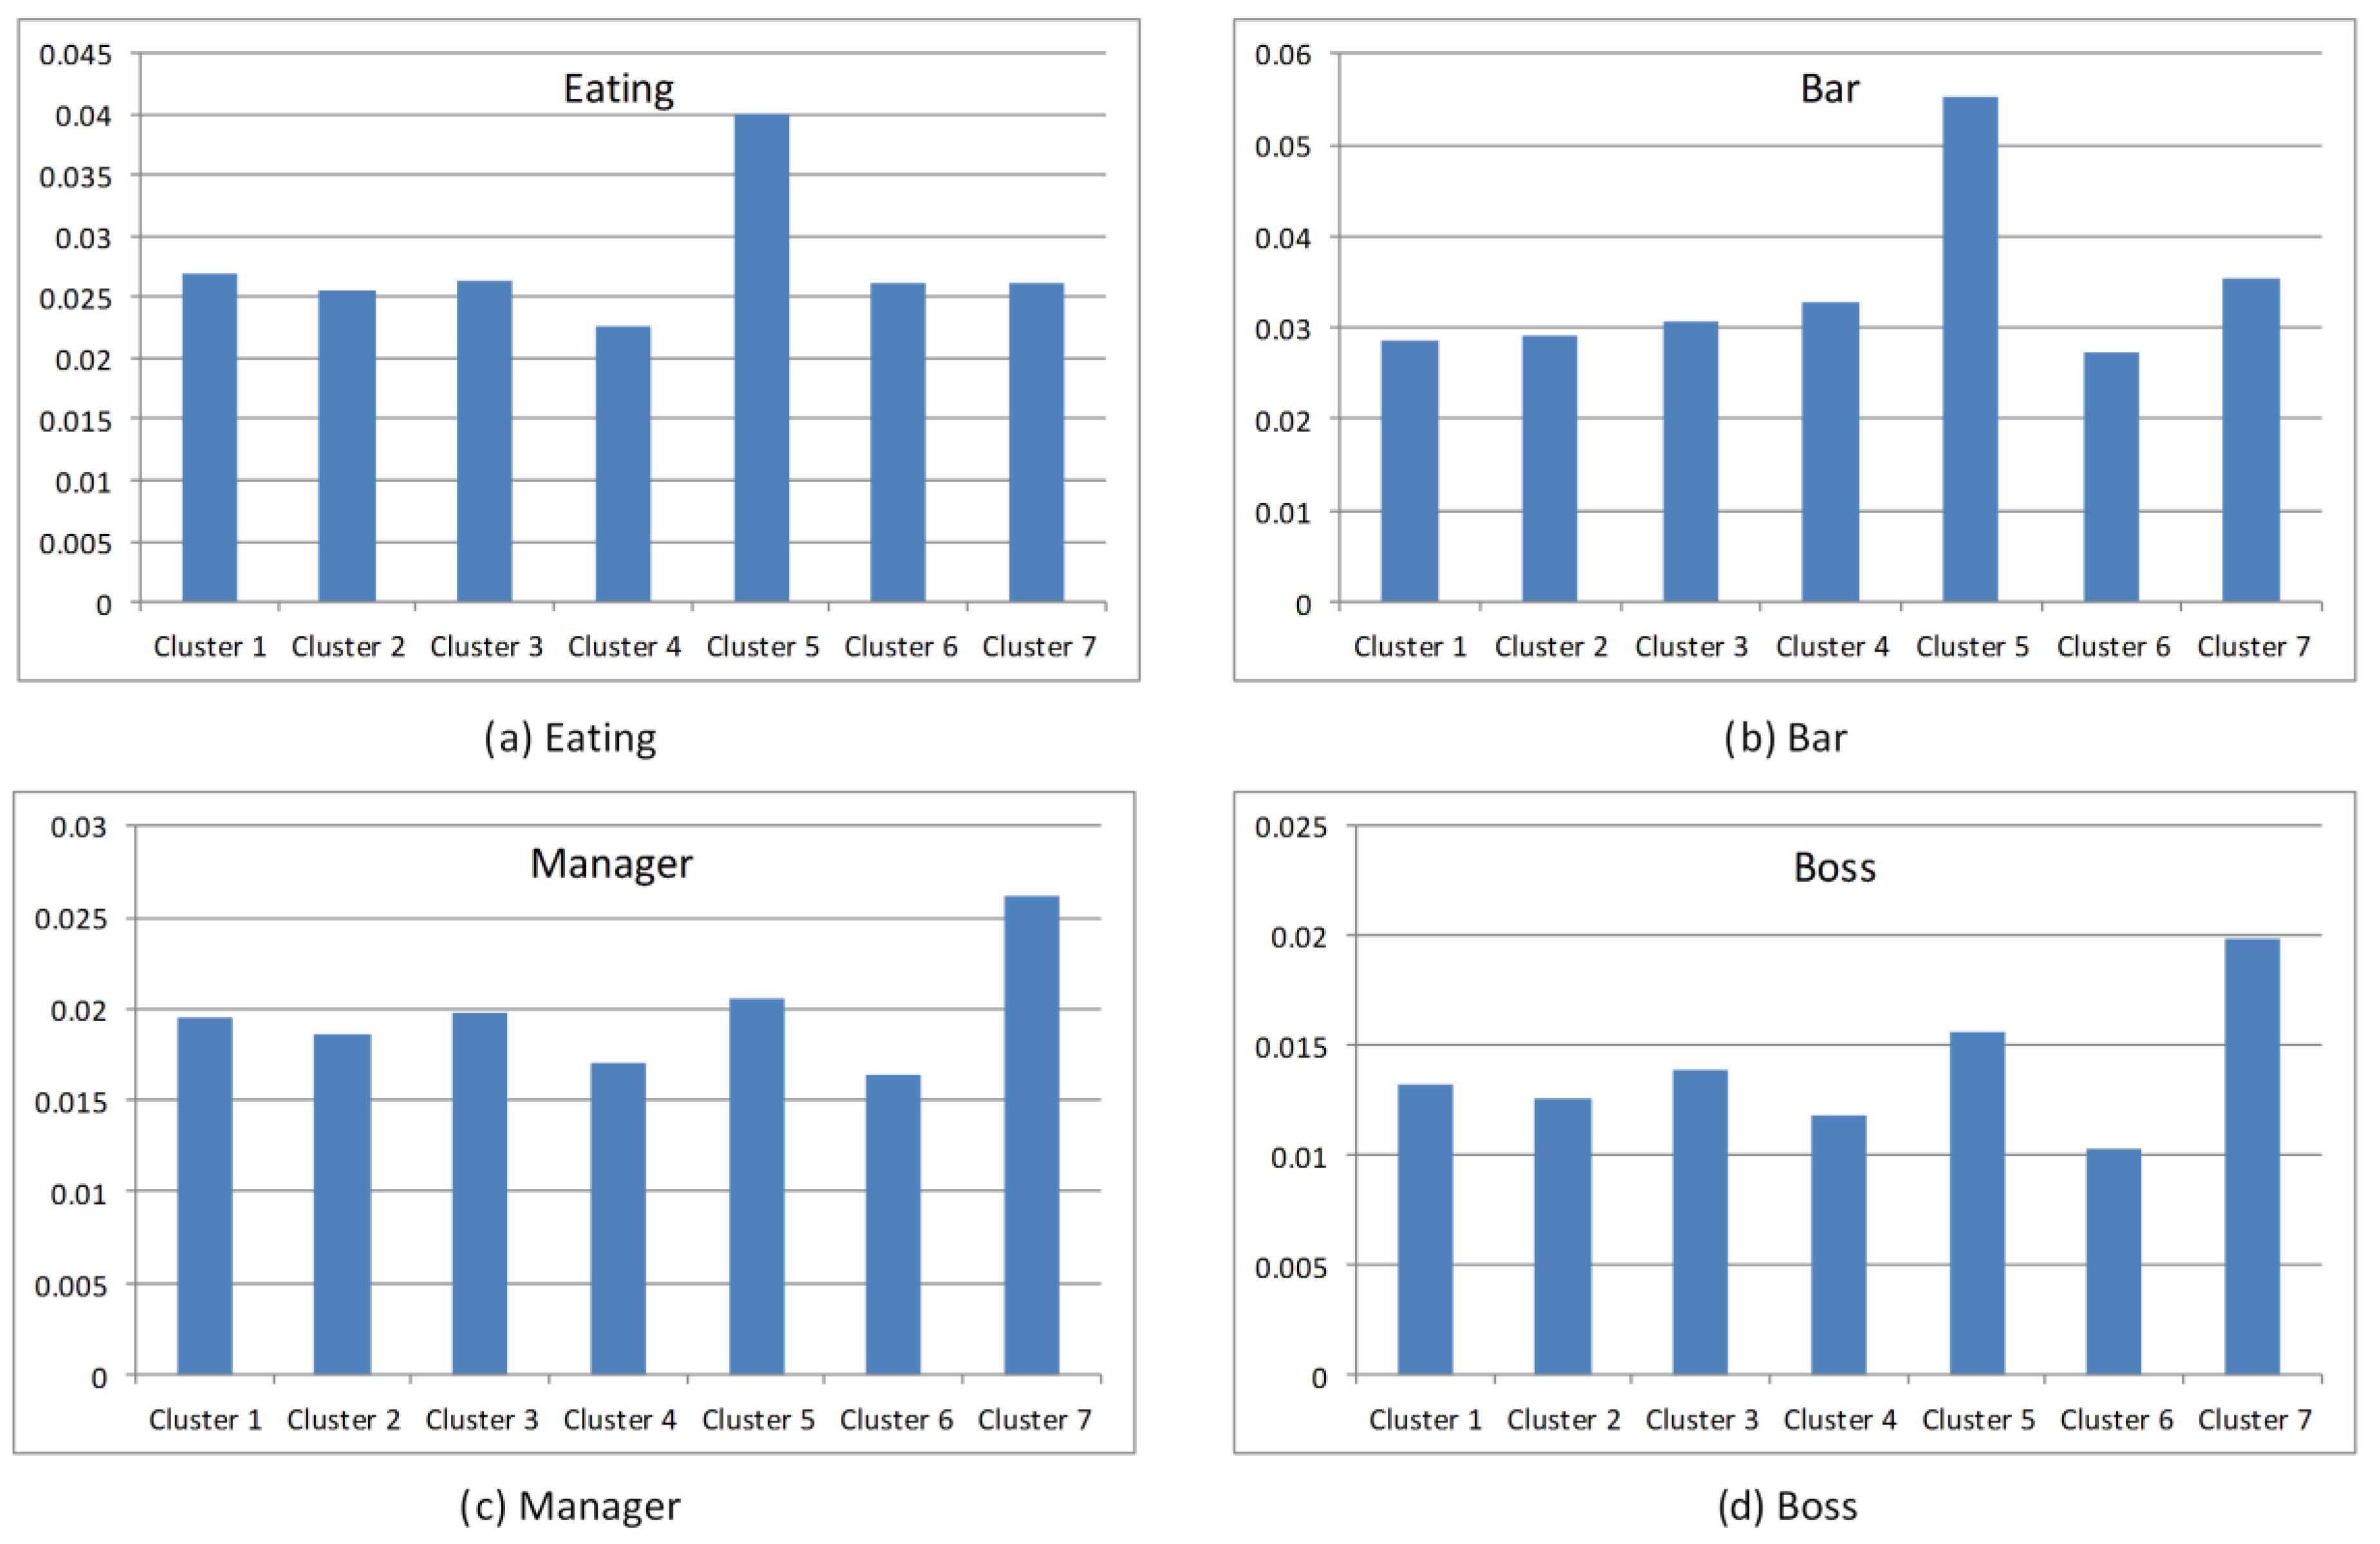
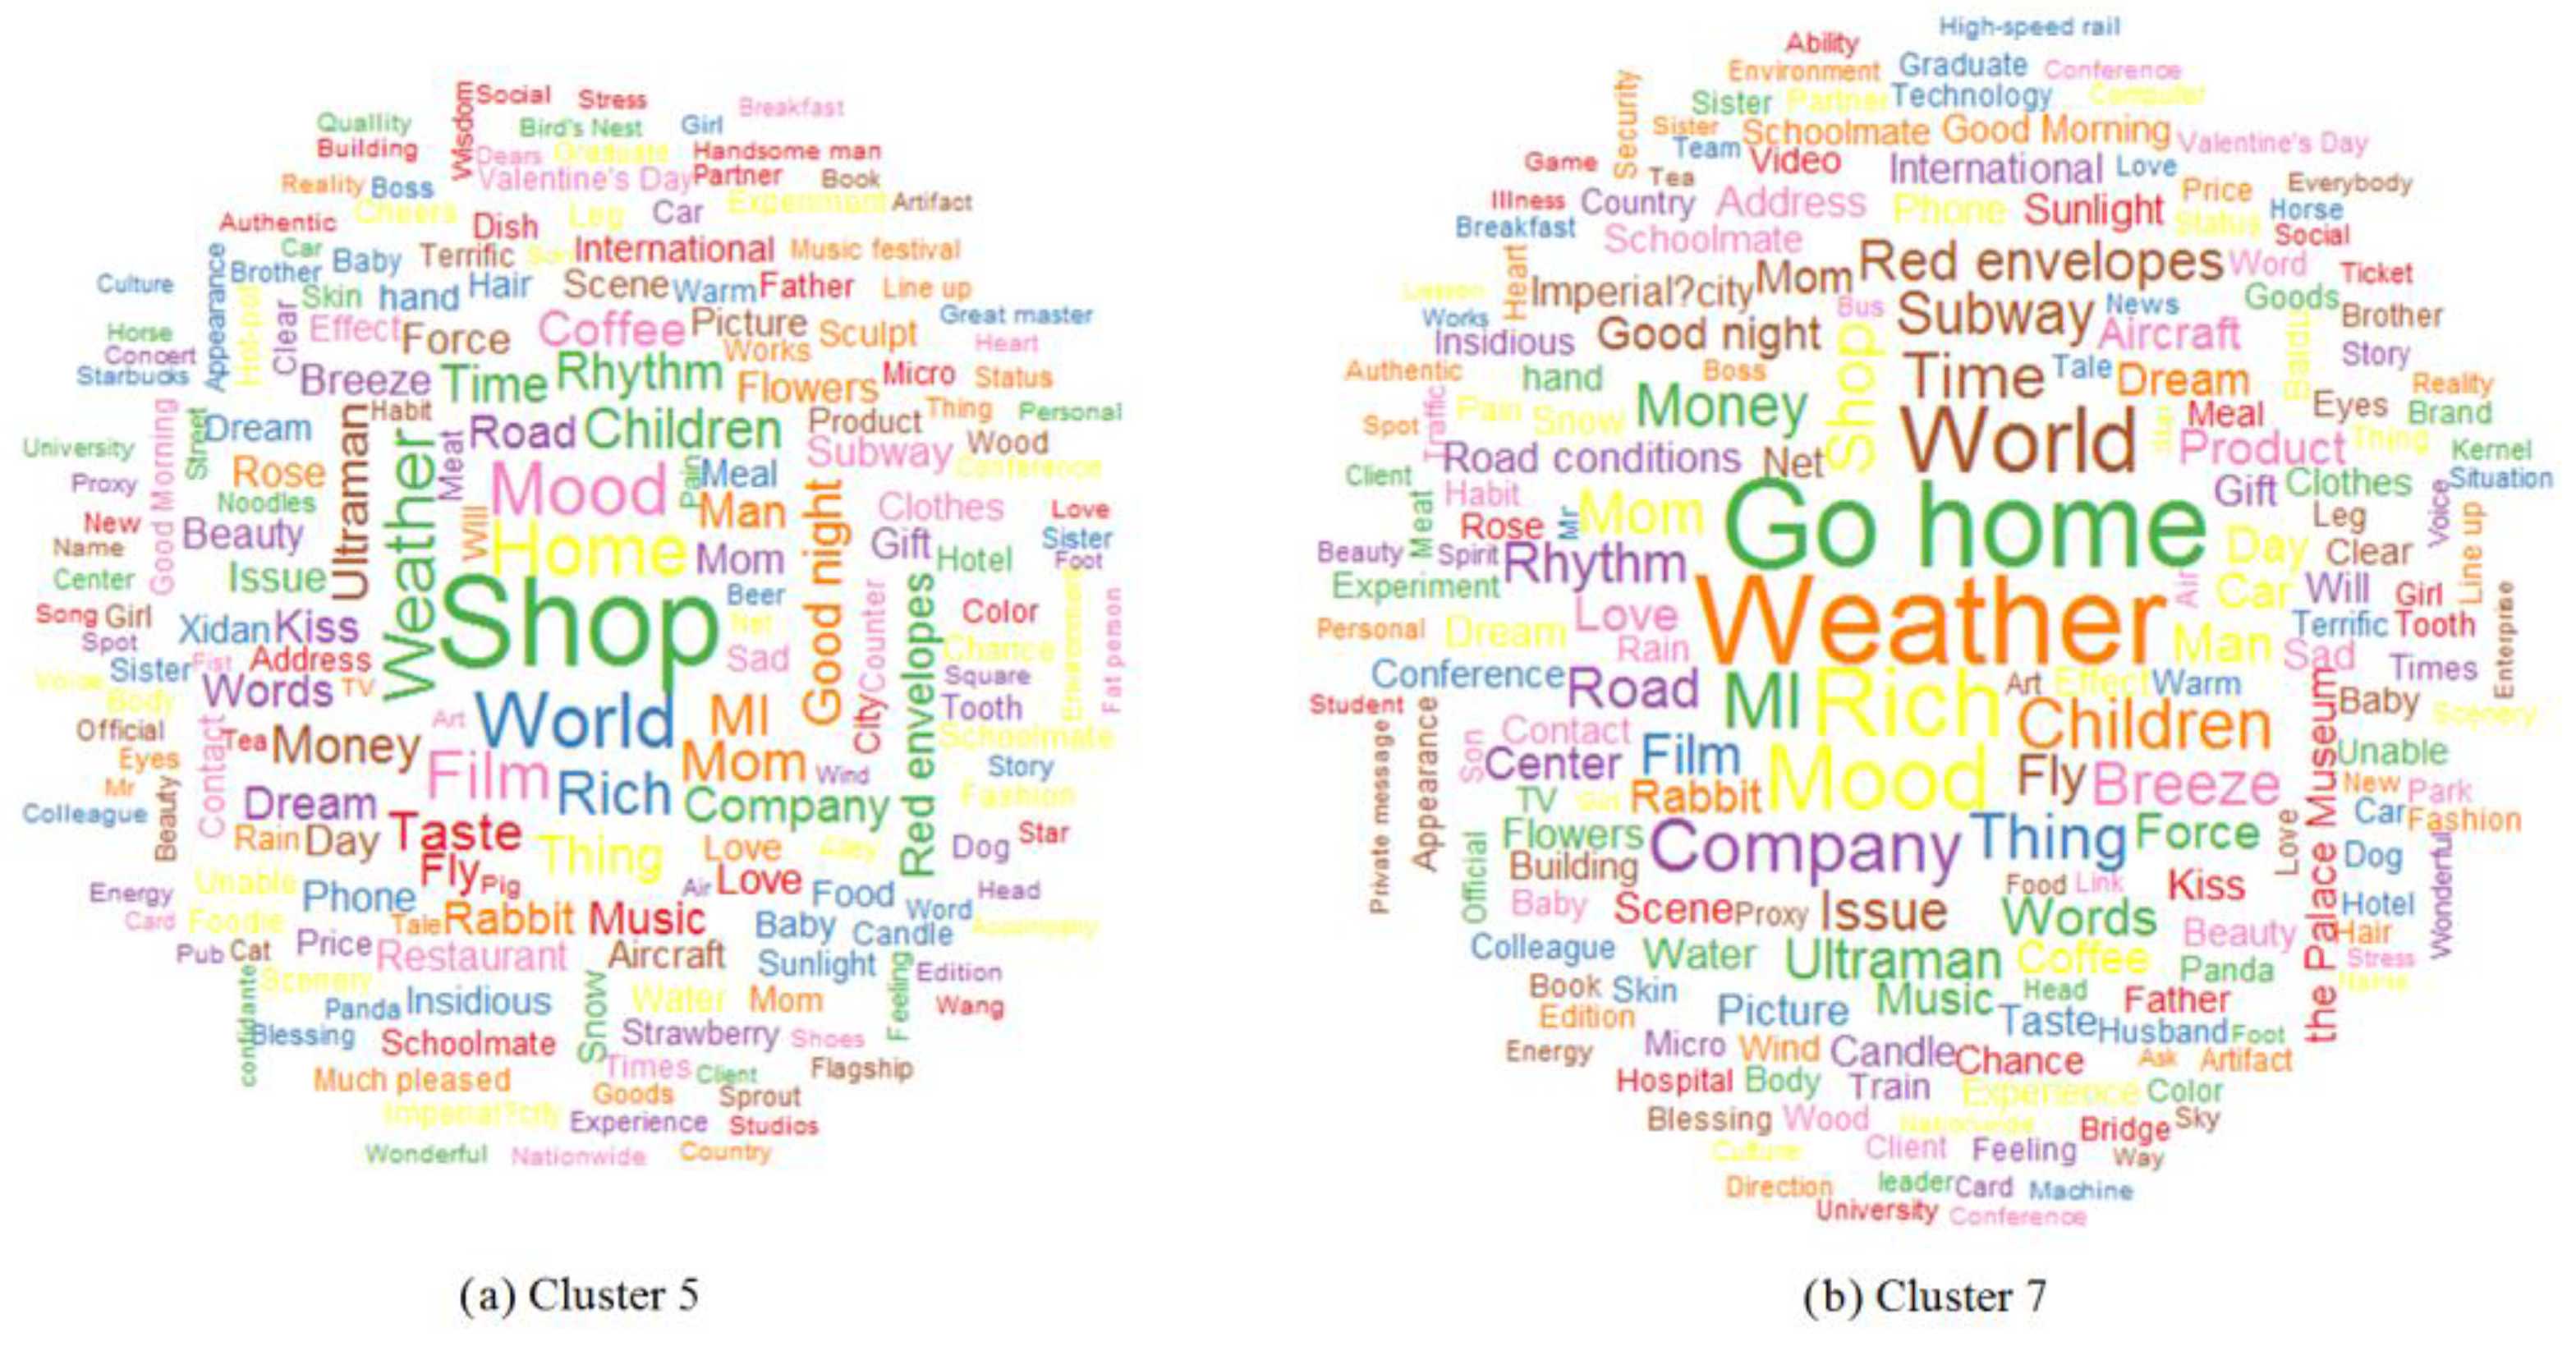
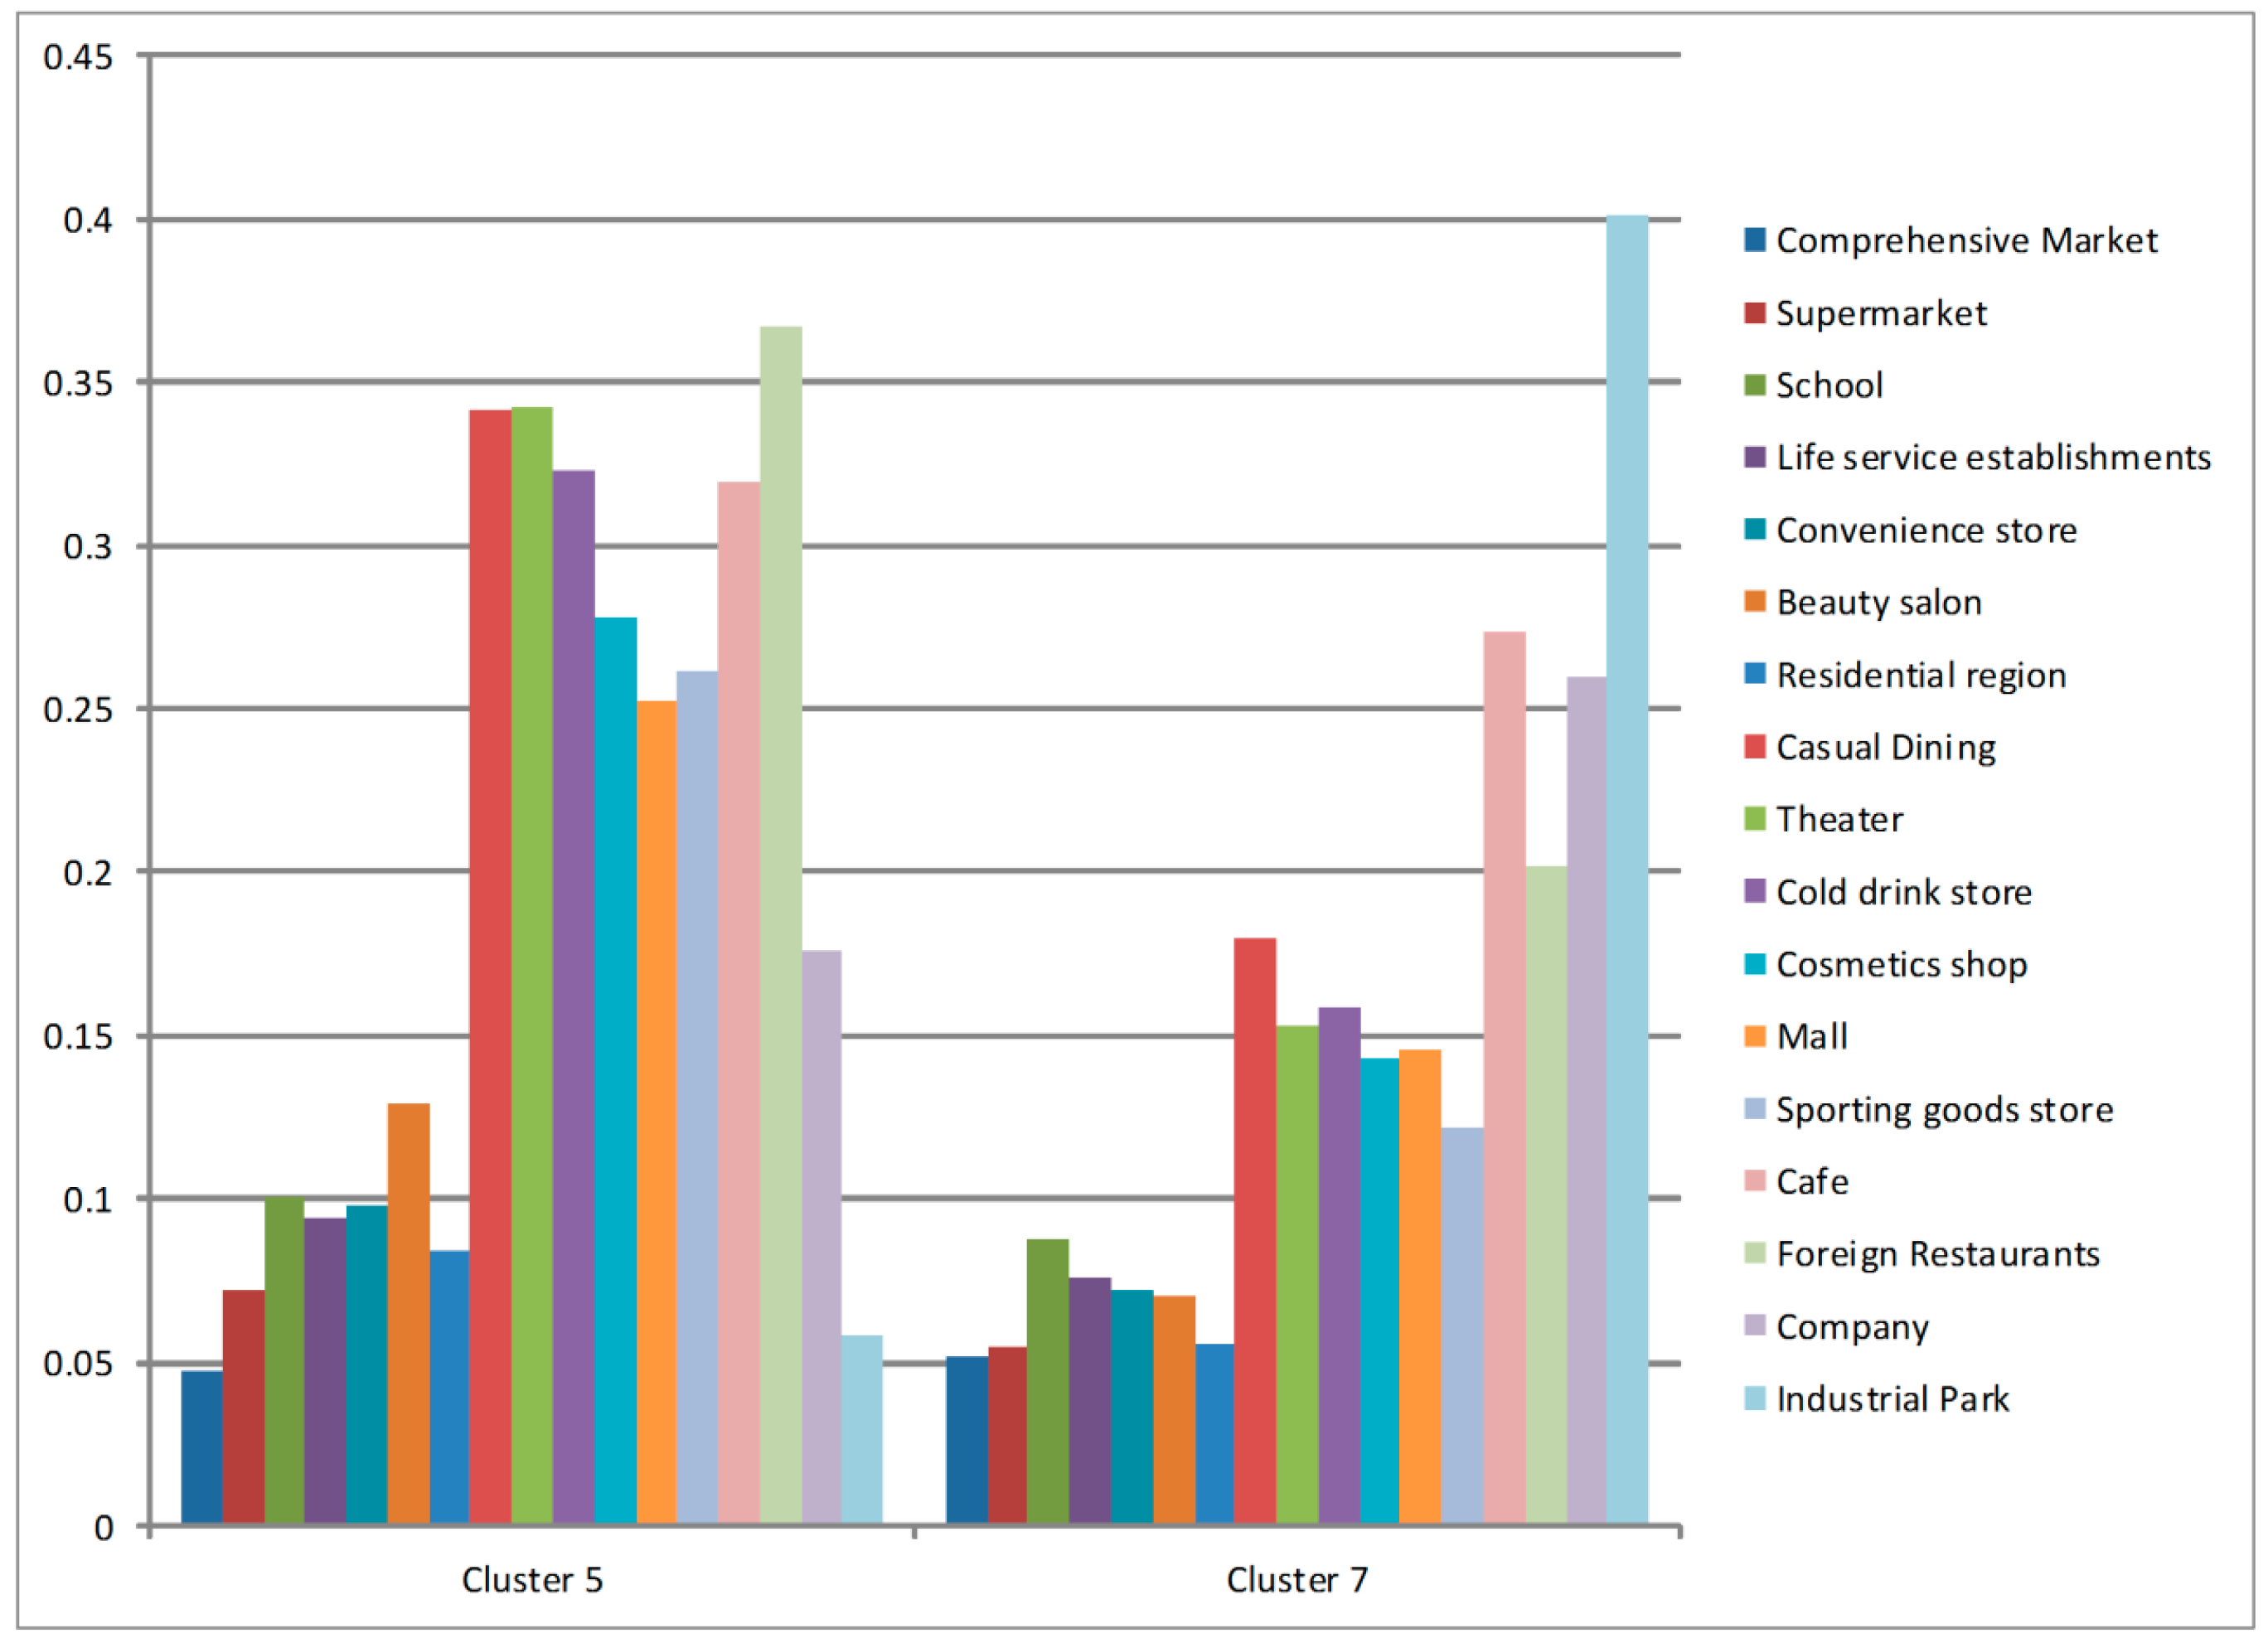
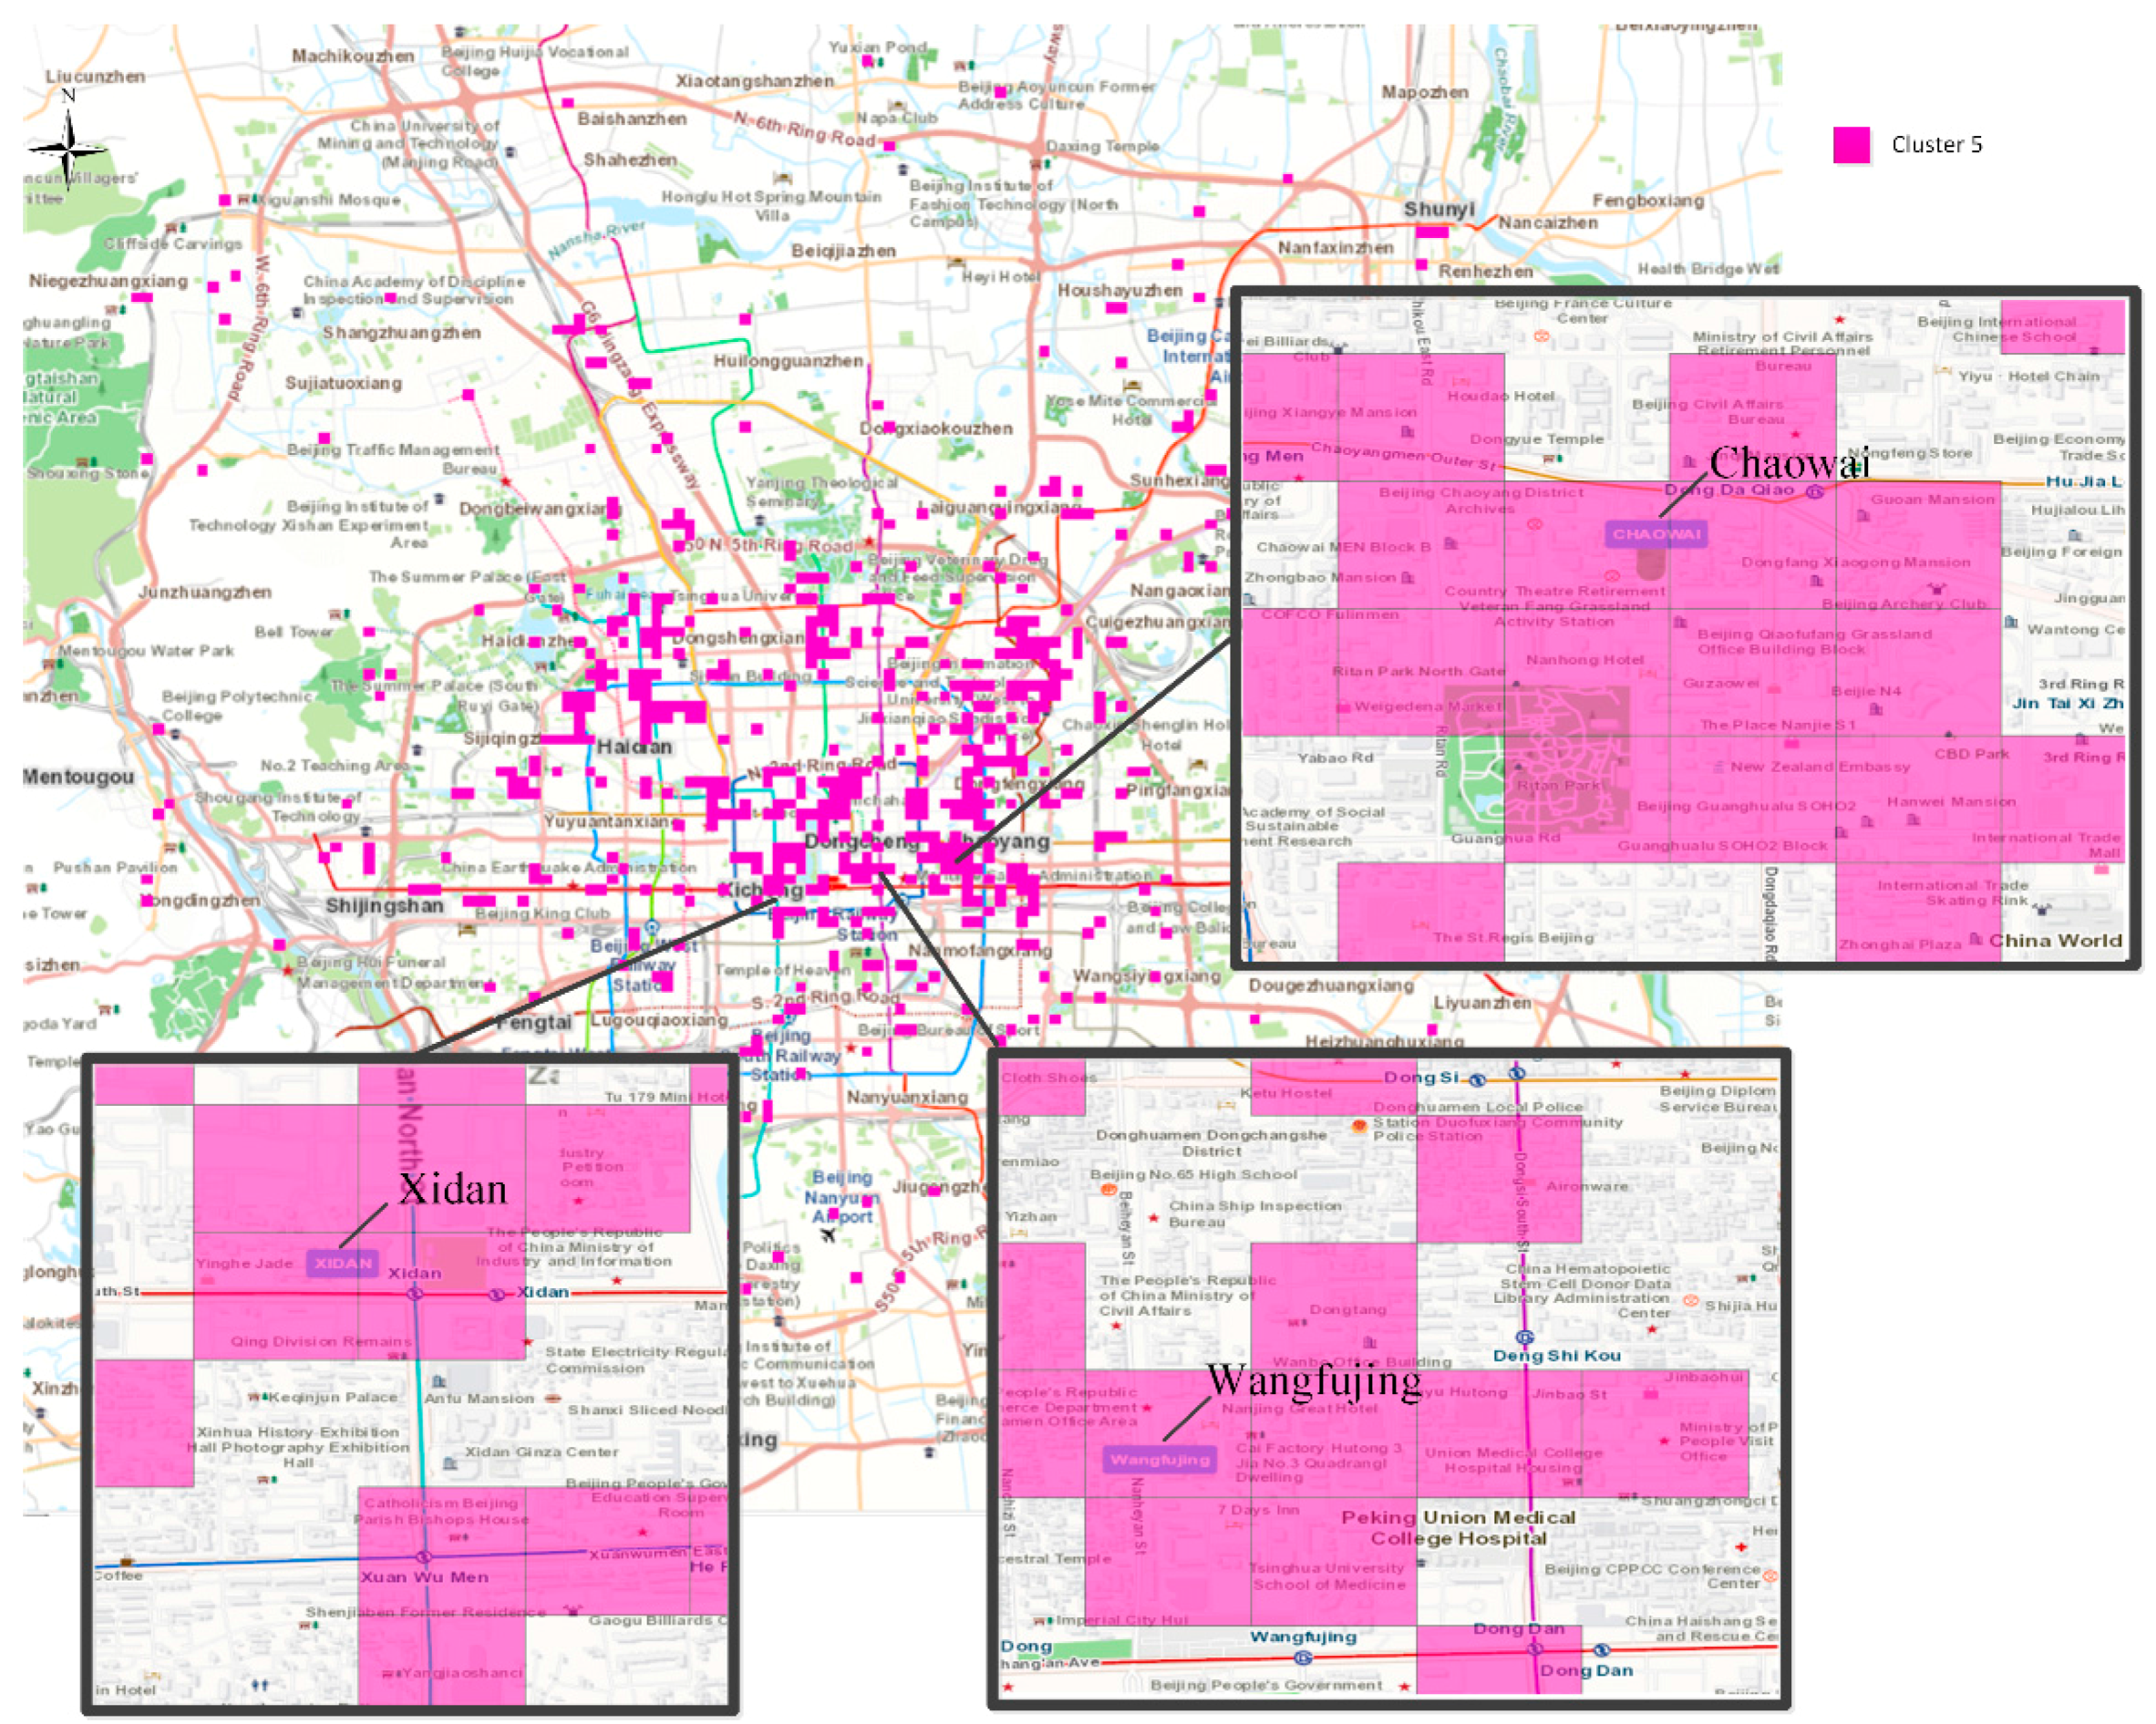
4.2. Commercial Areas and Work Areas (Cluster 5 and Cluster 7)
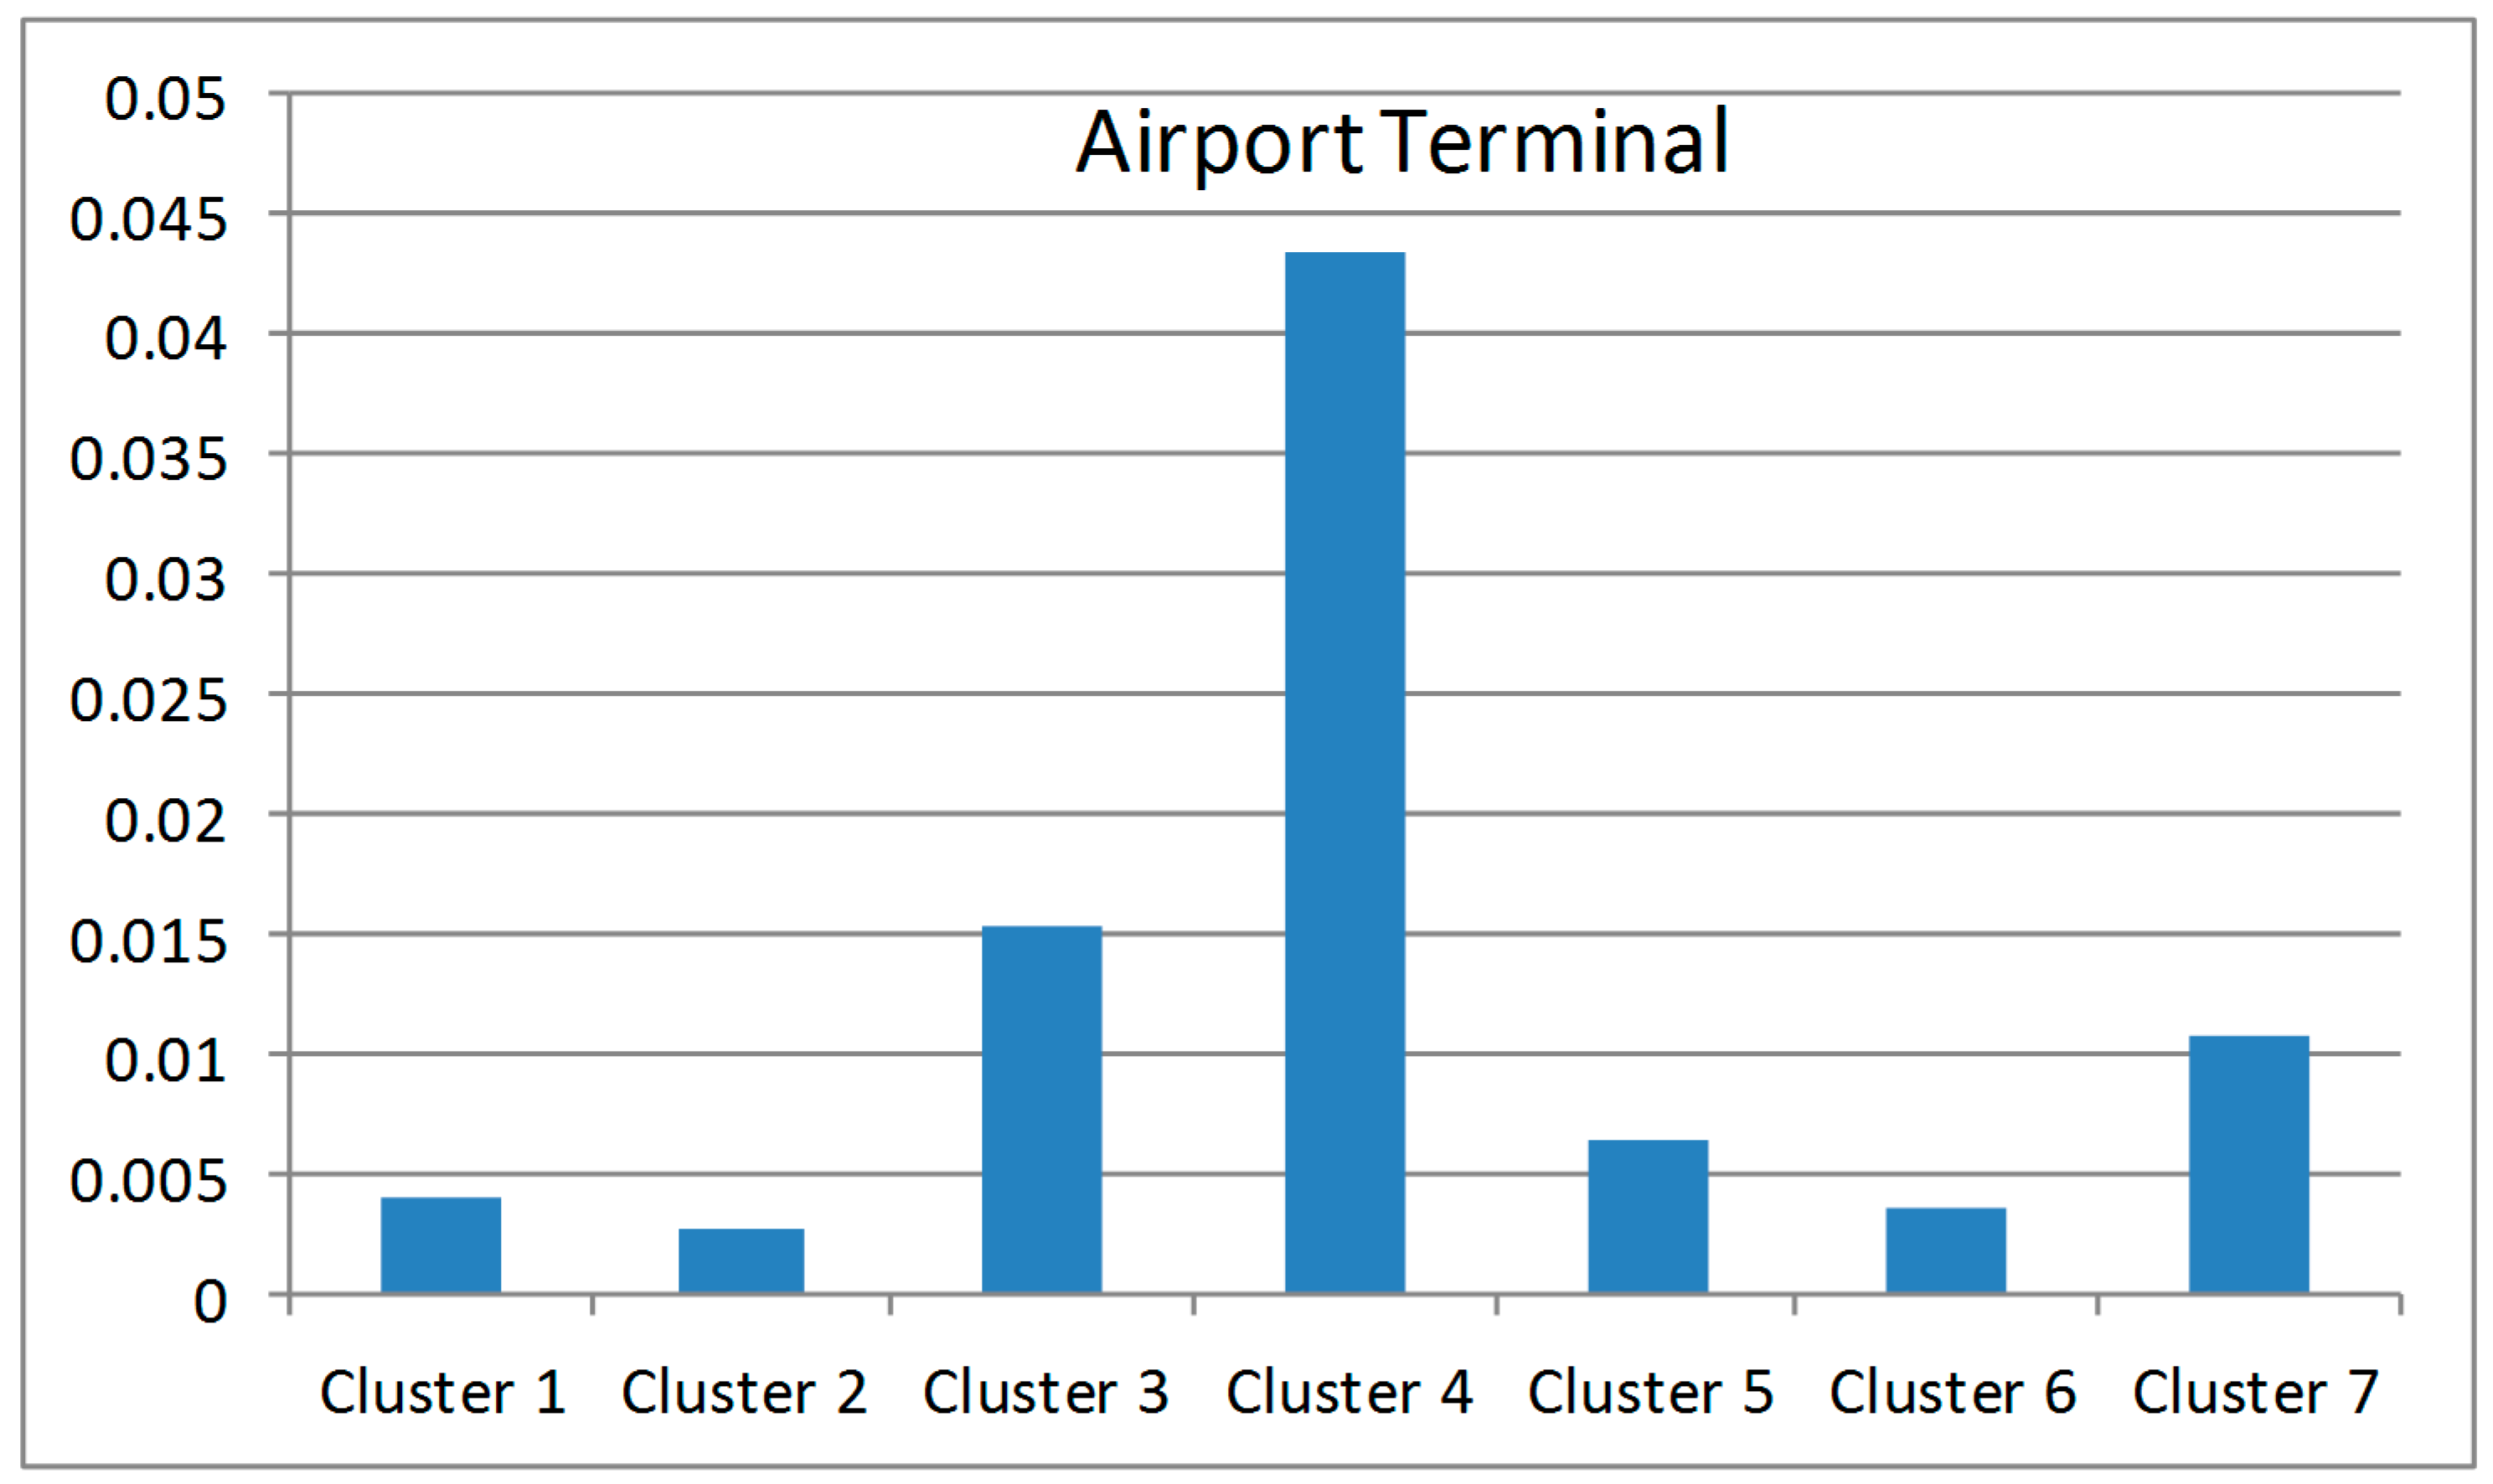
4.3. Transportation Hub Areas (Cluster 4)
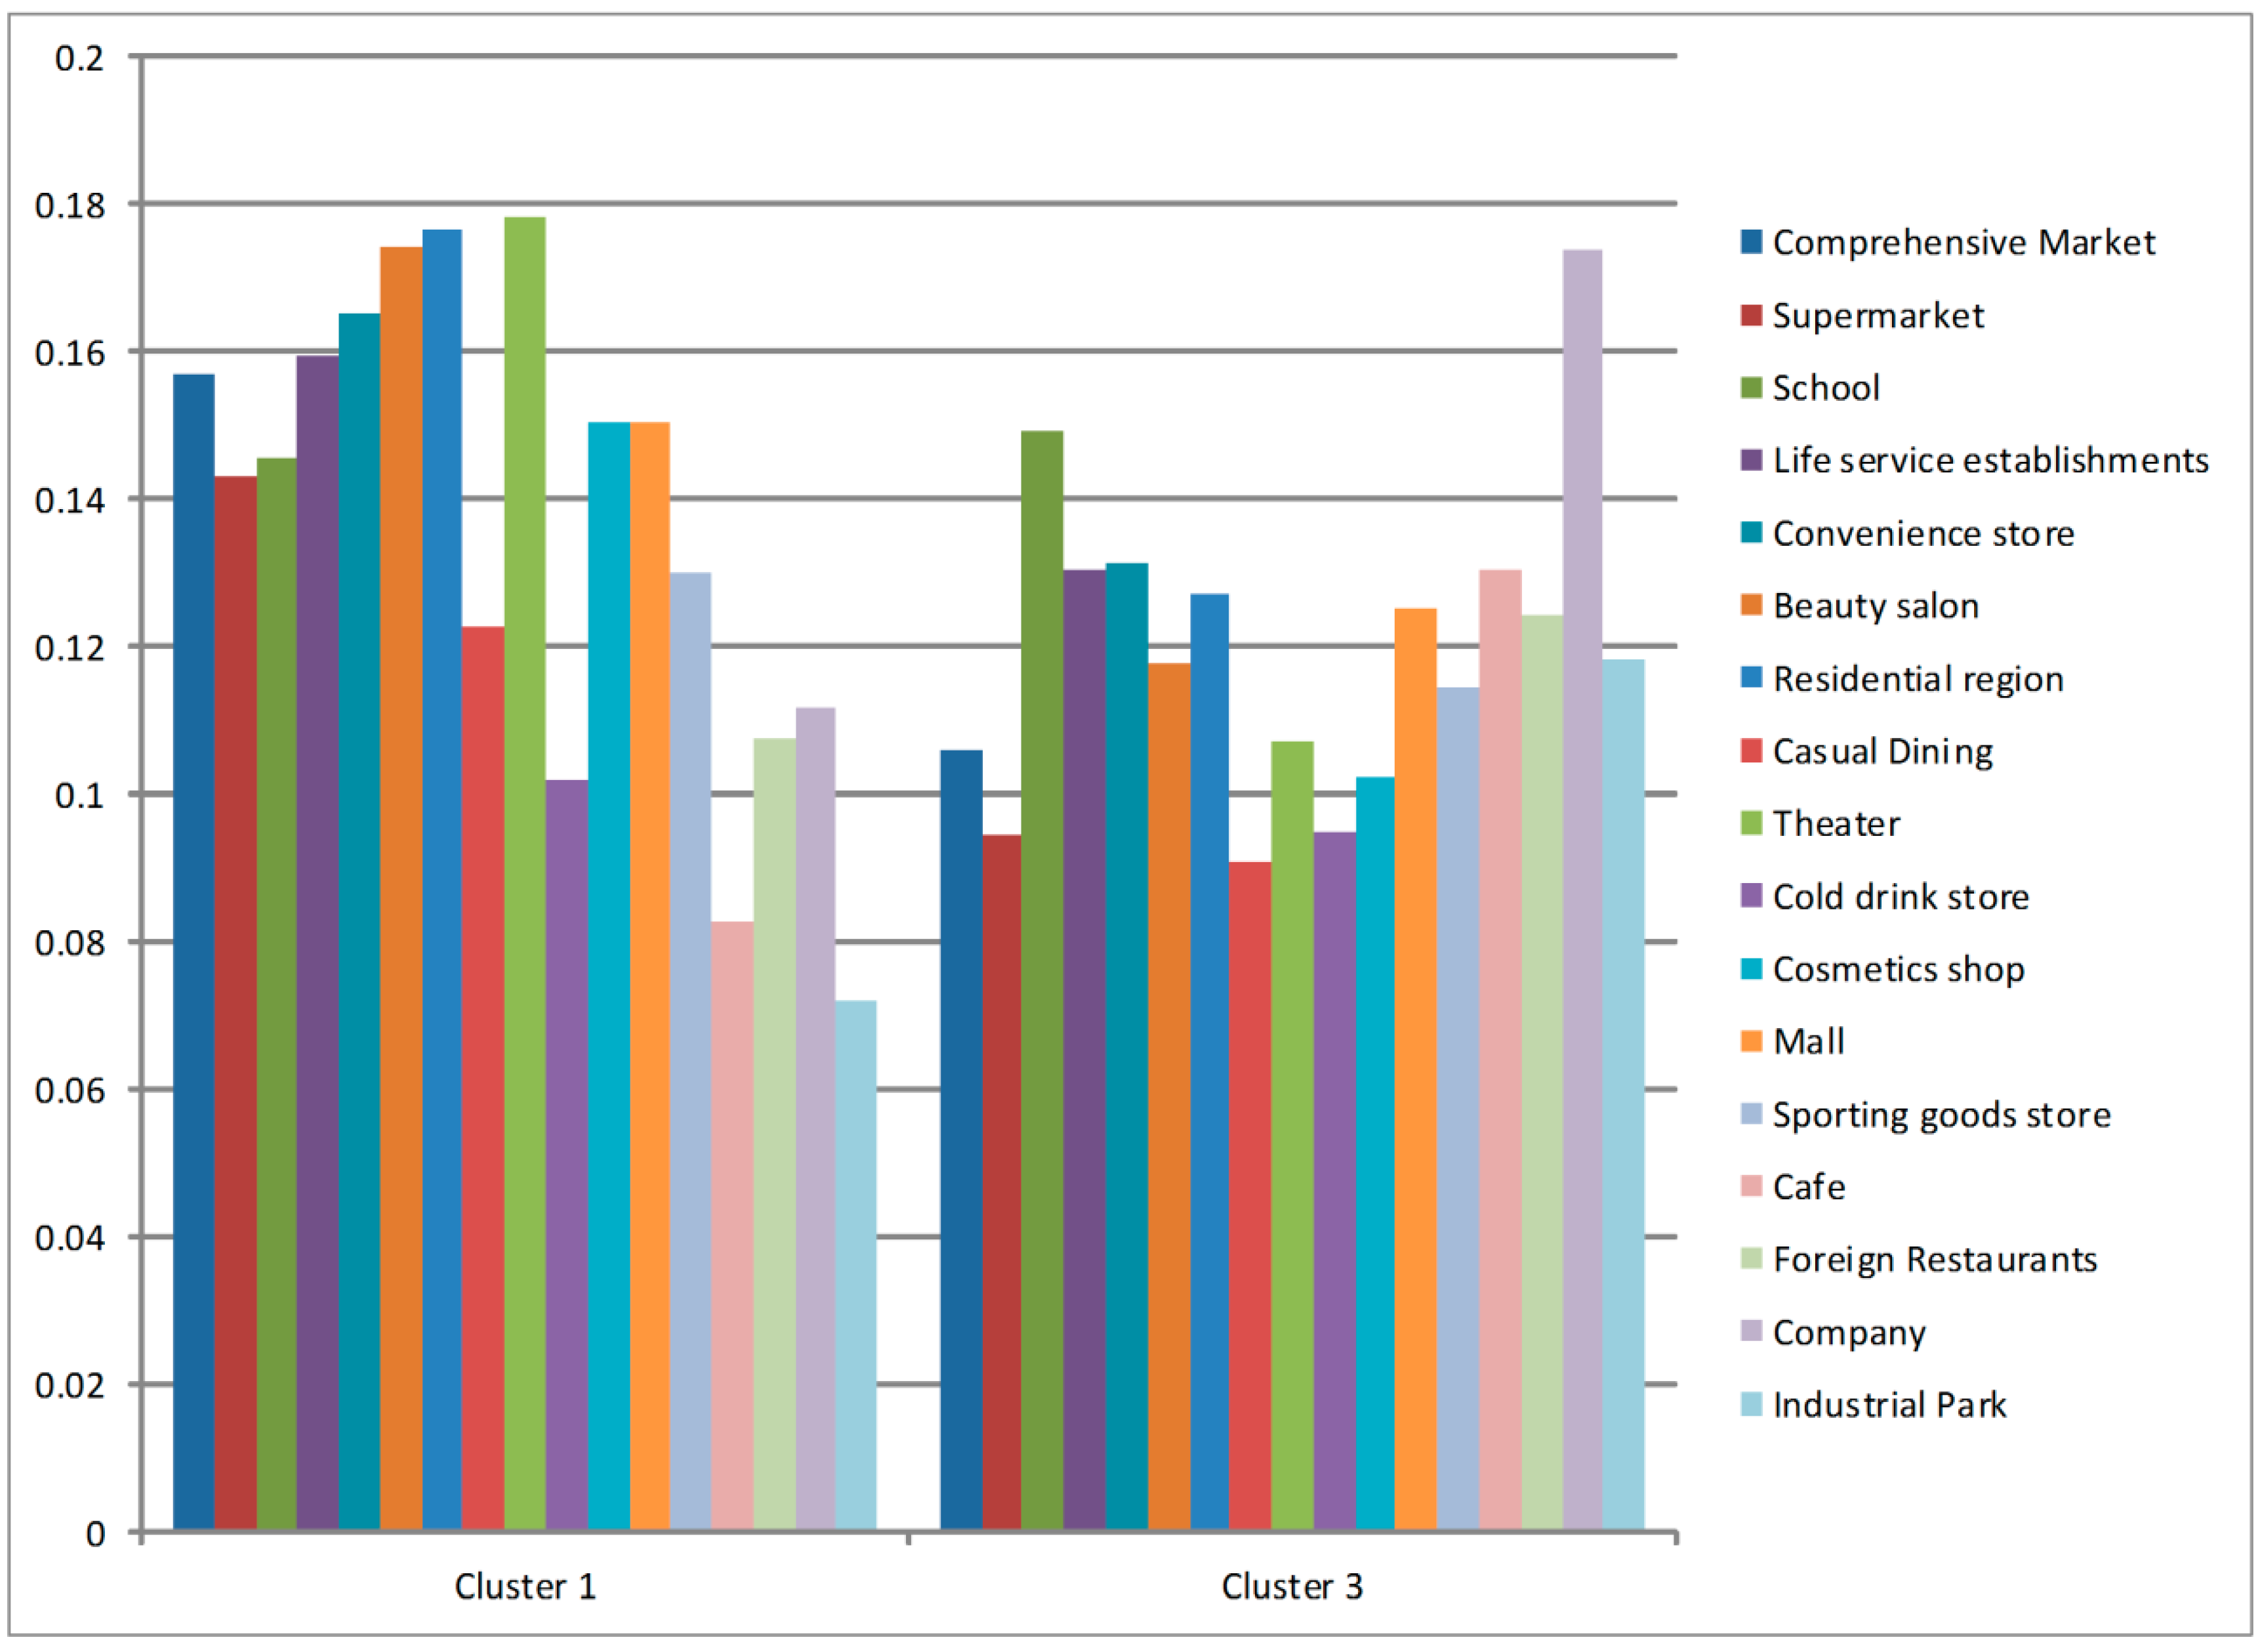
4.4. Mixed Land Use Areas (Cluster 1 and Cluster 3)
5. Conclusions and Future Works
Acknowledgments
Author Contributions
Conflicts of Interest
References
- Tsou, M.-H.; Leitner, M. Visualization of social media: Seeing a mirage or a message? Cartogr. Geogr. Inf. Sci. 2013, 40, 55–60. [Google Scholar] [CrossRef]
- Liu, Y.; Sui, Z.; Kang, C.; Gao, Y. Uncovering patterns of inter-urban trip and spatial interaction from social media check-in data. PLoS ONE 2014, 9, e86026. [Google Scholar] [CrossRef] [PubMed]
- Yates, D.; Paquette, S. Emergency knowledge management and social media technologies: A case study of the 2010 Haitian earthquake. Int. J. Inf. Manag. 2011, 31, 6–13. [Google Scholar] [CrossRef]
- Yin, J.; Lampert, A.; Cameron, M.; Robinson, B.; Power, R. Using social media to enhance emergency situation awareness. IEEE Intell. Syst. 2012, 27, 52–59. [Google Scholar] [CrossRef]
- Sakaki, T.; Okazaki, M.; Matsuo, Y. Tweet analysis for real-time event detection and earthquake reporting system development. IEEE Trans. Knowl. Data Eng. 2013, 25, 919–931. [Google Scholar] [CrossRef]
- Bakillah, M.; Li, R.-Y.; Liang, S.H.L. Geo-located community detection in Twitter with enhanced fast-greedy optimization of modularity: The case study of typhoon Haiyan. Int. J. Geogr. Inf. Sci. 2015, 29, 258–279. [Google Scholar] [CrossRef]
- Song, C.; Koren, T.; Wang, P.; Barabási, A.-L. Modelling the scaling properties of human mobility. Nat. Phys. 2010, 6, 818–823. [Google Scholar] [CrossRef]
- Cho, E.; Myers, S.A.; Leskovec, J. Friendship and mobility: User movement in location-based social networks. In Proceedings of the 17th ACM SIGKDD International Conference on Knowledge Discovery and Data Mining, San Diego, CA, USA, 21–24 August 2011; pp. 1082–1090.
- Phithakkitnukoon, S.; Smoreda, Z.; Olivier, P. Socio-geography of human mobility: A study using longitudinal mobile phone data. PLoS ONE 2012, 7, e39253. [Google Scholar] [CrossRef] [PubMed]
- Xiao, G.; Juan, Z.; Zhang, C. Travel mode detection based on GPS track data and Bayesian networks. Comput. Environ. Urban Syst. 2015, 54, 14–22. [Google Scholar] [CrossRef]
- Preoţiuc-Pietro, D.; Cohn, T. Mining user behaviours: A study of check-in patterns in location based social networks. In Proceedings of the 5th Annual ACM Web Science Conference, Paris, France, 2–4 May 2013; pp. 306–331.
- Ahas, R.; Aasa, A.; Silm, S.; Tiru, M. Daily rhythms of suburban commuters’ movements in the Tallinn metropolitan area: Case study with mobile positioning data. Transp. Res. C Emerg. Technol. 2010, 18, 45–54. [Google Scholar] [CrossRef]
- Ahas, R.; Aasa, A.; Yuan, Y.; Raubal, M.; Smoreda, Z.; Liu, Y.; Ziemlicki, C.; Tiru, M.; Zook, M. Everyday space-time geographies: Using mobile phone-based sensor data to monitor urban activity in Harbin, Paris, and Tallinn. Int. J. Geogr. Inf. Sci. 2015, 29, 2017–2039. [Google Scholar] [CrossRef]
- Liu, L.; Andris, C.; Ratti, C. Uncovering cabdrivers’ behavior patterns from their digital traces. Comput. Environ. Urban Syst. 2010, 34, 541–548. [Google Scholar] [CrossRef]
- Deville, P.; Linard, C.; Martin, S.; Gilbert, M.; Stevens, F.R.; Gaughan, A.E.; Blondel, V.D.; Tatem, A.J. Dynamic population mapping using mobile phone data. Proc. Natl. Acad. Sci. USA 2014, 111, 15888–15893. [Google Scholar] [CrossRef] [PubMed]
- Hasan, S.; Ukkusuri, S.V. Urban activity pattern classification using topic models from online geo-location data. Transp. Res. C Emerg. Technol. 2014, 44, 363–381. [Google Scholar] [CrossRef]
- Lee, R.; Wakamiya, S.; Sumiya, K. Urban area characterization based on crowd behavioral lifelogs over Twitter. Pers. Ubiquitous Comput. 2012, 17, 605–620. [Google Scholar] [CrossRef]
- Ferrari, L.; Rosi, A.; Mamei, M.; Zambonelli, F. Extracting urban patterns from location-based social networks. In Proceedings of the 3rd ACM SIGSPATIAL International Workshop on Location-Based Social Networks, Chicago, IL, USA, 1 November 2011; pp. 9–16.
- Adnan, M.; Leak, A.; Longley, P. A geocomputational analysis of twitter activity around different world cities. Geo-Spat. Inf. Sci. 2014, 17, 145–152. [Google Scholar] [CrossRef]
- Liu, Y.; Wang, F.; Xiao, Y.; Gao, S. Urban land uses and traffic ‘source-sink areas’: Evidence from GPS-enabled taxi data in Shanghai. Landsc. Urban Plan. 2012, 106, 73–87. [Google Scholar] [CrossRef]
- Frias-Martinez, V.; Frias-Martinez, E. Spectral clustering for sensing urban land use using Twitter activity. Eng. Appl. Artif. Intell. 2014, 35, 237–245. [Google Scholar] [CrossRef]
- Tsou, M.-H.; Leitner, M. Visualization of social media: Seeing a mirage or a message? Cartogr. Geogr. Inf. Sci. 2013, 40, 55–60. [Google Scholar] [CrossRef]
- Liu, Y.; Liu, X.; Gao, S.; Gong, L.; Kang, C.; Zhi, Y.; Chi, G.; Shi, L. Social sensing: A new approach to understanding our socioeconomic environments. Ann. Assoc. Am. Geogr. 2015, 105, 512–530. [Google Scholar] [CrossRef]
- Sagl, G.; Resch, B.; Hawelka, B.; Beinat, E. From social sensor data to collective human behaviour patterns: Analysing and visualising spatio-temporal dynamics in urban environments. In GI-Forum 2012: Geovisualization, Society and Learning, Salzburg, Austria, 3–6 July 2012.
- Qi, G.; Li, X.; Li, S.; Pan, G.; Wang, Z.; Zhang, D. Measuring social functions of city areas from large-scale taxi behaviors. In Proceedings of the Pervasive Computing and Communications Workshops (PERCOM Workshops), Seattle, WA, USA, 21–25 March 2011; pp. 21–25.
- Soto, V.; Frias-Martinez, E. Robust land use characterization of urban landscapes using cell phone data. In Proceedings of the 1st Workshop on Pervasive Urban Applications, San Francisco, CA, USA, 12–15 June 2011.
- Fujisaka, T.; Lee, R.; Sumiya, K. Exploring urban characteristics using movement history of mass mobile microbloggers. In Proceedings of the 11th Workshop on Mobile Computing Systems & Applications, Annapolis, MD, USA, 22–23 February 2010; pp. 13–18.
- Antipova, A.; Wang, F.; Wilmot, C. Urban land uses, socio-demographic attributes and commuting: A multilevel modeling approach. Appl. Geogr. 2011, 31, 1010–1018. [Google Scholar] [CrossRef]
- Han, S.Y.; Tsou, M.H.; Clarke, K.C. Do global cities enable global views? Using twitter to quantify the level of geographical awareness of U.S. Cities. PLoS ONE 2015, 10, e0132464. [Google Scholar] [CrossRef] [PubMed]
- Trasarti, R.; Olteanu-Raimond, A.-M.; Nanni, M.; Couronné, T.; Furletti, B.; Giannotti, F.; Smoreda, Z.; Ziemlicki, C. Discovering urban and country dynamics from mobile phone data with spatial correlation patterns. Telecommun. Policy 2015, 39, 347–362. [Google Scholar] [CrossRef]
- Yuan, J.; Zheng, Y.; Xie, X. Discovering areas of different functions in a city using human mobility and POI. In Proceedings of the 18th ACM SIGKDD International Conference on Knowledge Discovery and Data Mining, Beijing, China, 12–16 August 2012; pp. 186–194.
- Pulselli, R.M.; Romano, P.; Ratti, C.; Tiezzi, E. Computing urban mobile landscapes through monitoring population density based on cell-phone chatting. Int. J. Des. Nat. Ecodyn. 2008, 3, 121–134. [Google Scholar] [PubMed]
- Mak, K.F.; McGill, K.L.; Park, J.; McEuen, P.L. Valleytronics. The valley Hall effect in MoS(2) transistors. Science 2014, 344, 1489–1492. [Google Scholar] [CrossRef] [PubMed]
- Ester, M.; Kriegel, H.-P.; Sander, J.; Xu, X. A density-based algorithm for discovering clusters in large spatial databases with noise. In Proceedings of the 2nd International Conference on Knowledge Discovery and Data Mining, Portland, OR, USA, 2–4 August 1996; AAAI Press: Palo Alto, CA, USA, 1996; pp. 226–231. [Google Scholar]
- Hartigan, J.A.; Wong, M.A. Algorithm AS 136: A k-means clustering algorithm. Appl. Stat. 1979, 28, 100–108. [Google Scholar] [CrossRef]
- Tibshirani, R.; Walther, G.; Hastie, T. Estimating the number of clusters in a data set via the gap statistic. J. R. Stat. Soc. Ser. B (Stat. Methodol.) 2001, 63, 411–423. [Google Scholar] [CrossRef]
- Blei, D.M.; Ng, A.Y.; Jordan, M.I. Latent Dirichlet allocation. J. Mach. Learn. Res. 2003, 3, 993–1022. [Google Scholar]
- Suykens, J.A.K.; Vandewalle, J. Least squares support vector machine classifiers. Neural Process. Lett. 1999, 9, 293–300. [Google Scholar] [CrossRef]
- Mikolov, T.; Chen, K.; Corrado, G.; Dean, J. Efficient Estimation of Word Representations in Vector Space. In Proceedings of the Workshop at International Conference on Learning Representations, Scottsdale, AZ, USA, 2–4 May 2013.
- Tsou, M.-H. Research challenges and opportunities in mapping social media and Big Data. Cartogr. Geogr. Inf. Sci. 2015, 42, 70–74. [Google Scholar] [CrossRef]


| Total Number of Cells | Total Number of Sina-Weibo | Inner Fifth Ring Road (Urban Core) | Outer Fifth Ring Road | |
|---|---|---|---|---|
| Cluster 1 | 1738 | 2,561,789 | 0.552 | 0.448 |
| Cluster 2 | 1034 | 783,409 | 0.313 | 0.687 |
| Cluster 3 | 1319 | 2,048,465 | 0.634 | 0.366 |
| Cluster 4 | 136 | 58,112 | 0.257 | 0.743 |
| Cluster 5 | 634 | 1,198,237 | 0.751 | 0.249 |
| Cluster 6 | 908 | 1,071,741 | 0.504 | 0.496 |
| Cluster 7 | 446 | 577,702 | 0.596 | 0.404 |
| Keyword | Coefficient | Keyword | Coefficient | Keyword | Coefficient |
|---|---|---|---|---|---|
| Parking apron | 0.807 | Air China | 0.638 | Beijing Airport | 0.610 |
| Gate | 0.803 | Lounge | 0.637 | Alternate | 0.608 |
| Border | 0.752 | Air France | 0.636 | Waiting | 0.607 |
| Executive Lounge | 0.744 | Airport | 0.628 | Night flight | 0.607 |
| Capital Airport | 0.735 | Navigation | 0.627 | Large aircraft | 0.604 |
| International Flights | 0.680 | Aircraft fault | 0.627 | Waiting room | 0.602 |
| Direct flight | 0.664 | Capital International Airport | 0.626 | Inbound | 0.602 |
| Beijing Capital Airport | 0.652 | Terminal | 0.624 | Flight | 0.600 |
| High | 0.647 | Elevator | 0.619 | Terminal building | 0.600 |
| Boarding | 0.643 | Shandong Airlines | 0.617 | South Station | 0.600 |
| Flights | 0.638 | Hainan Airlines | 0.614 | Hainan Airways | 0.599 |
| Flight number | 0.638 | Business Class | 0.611 | … | … |
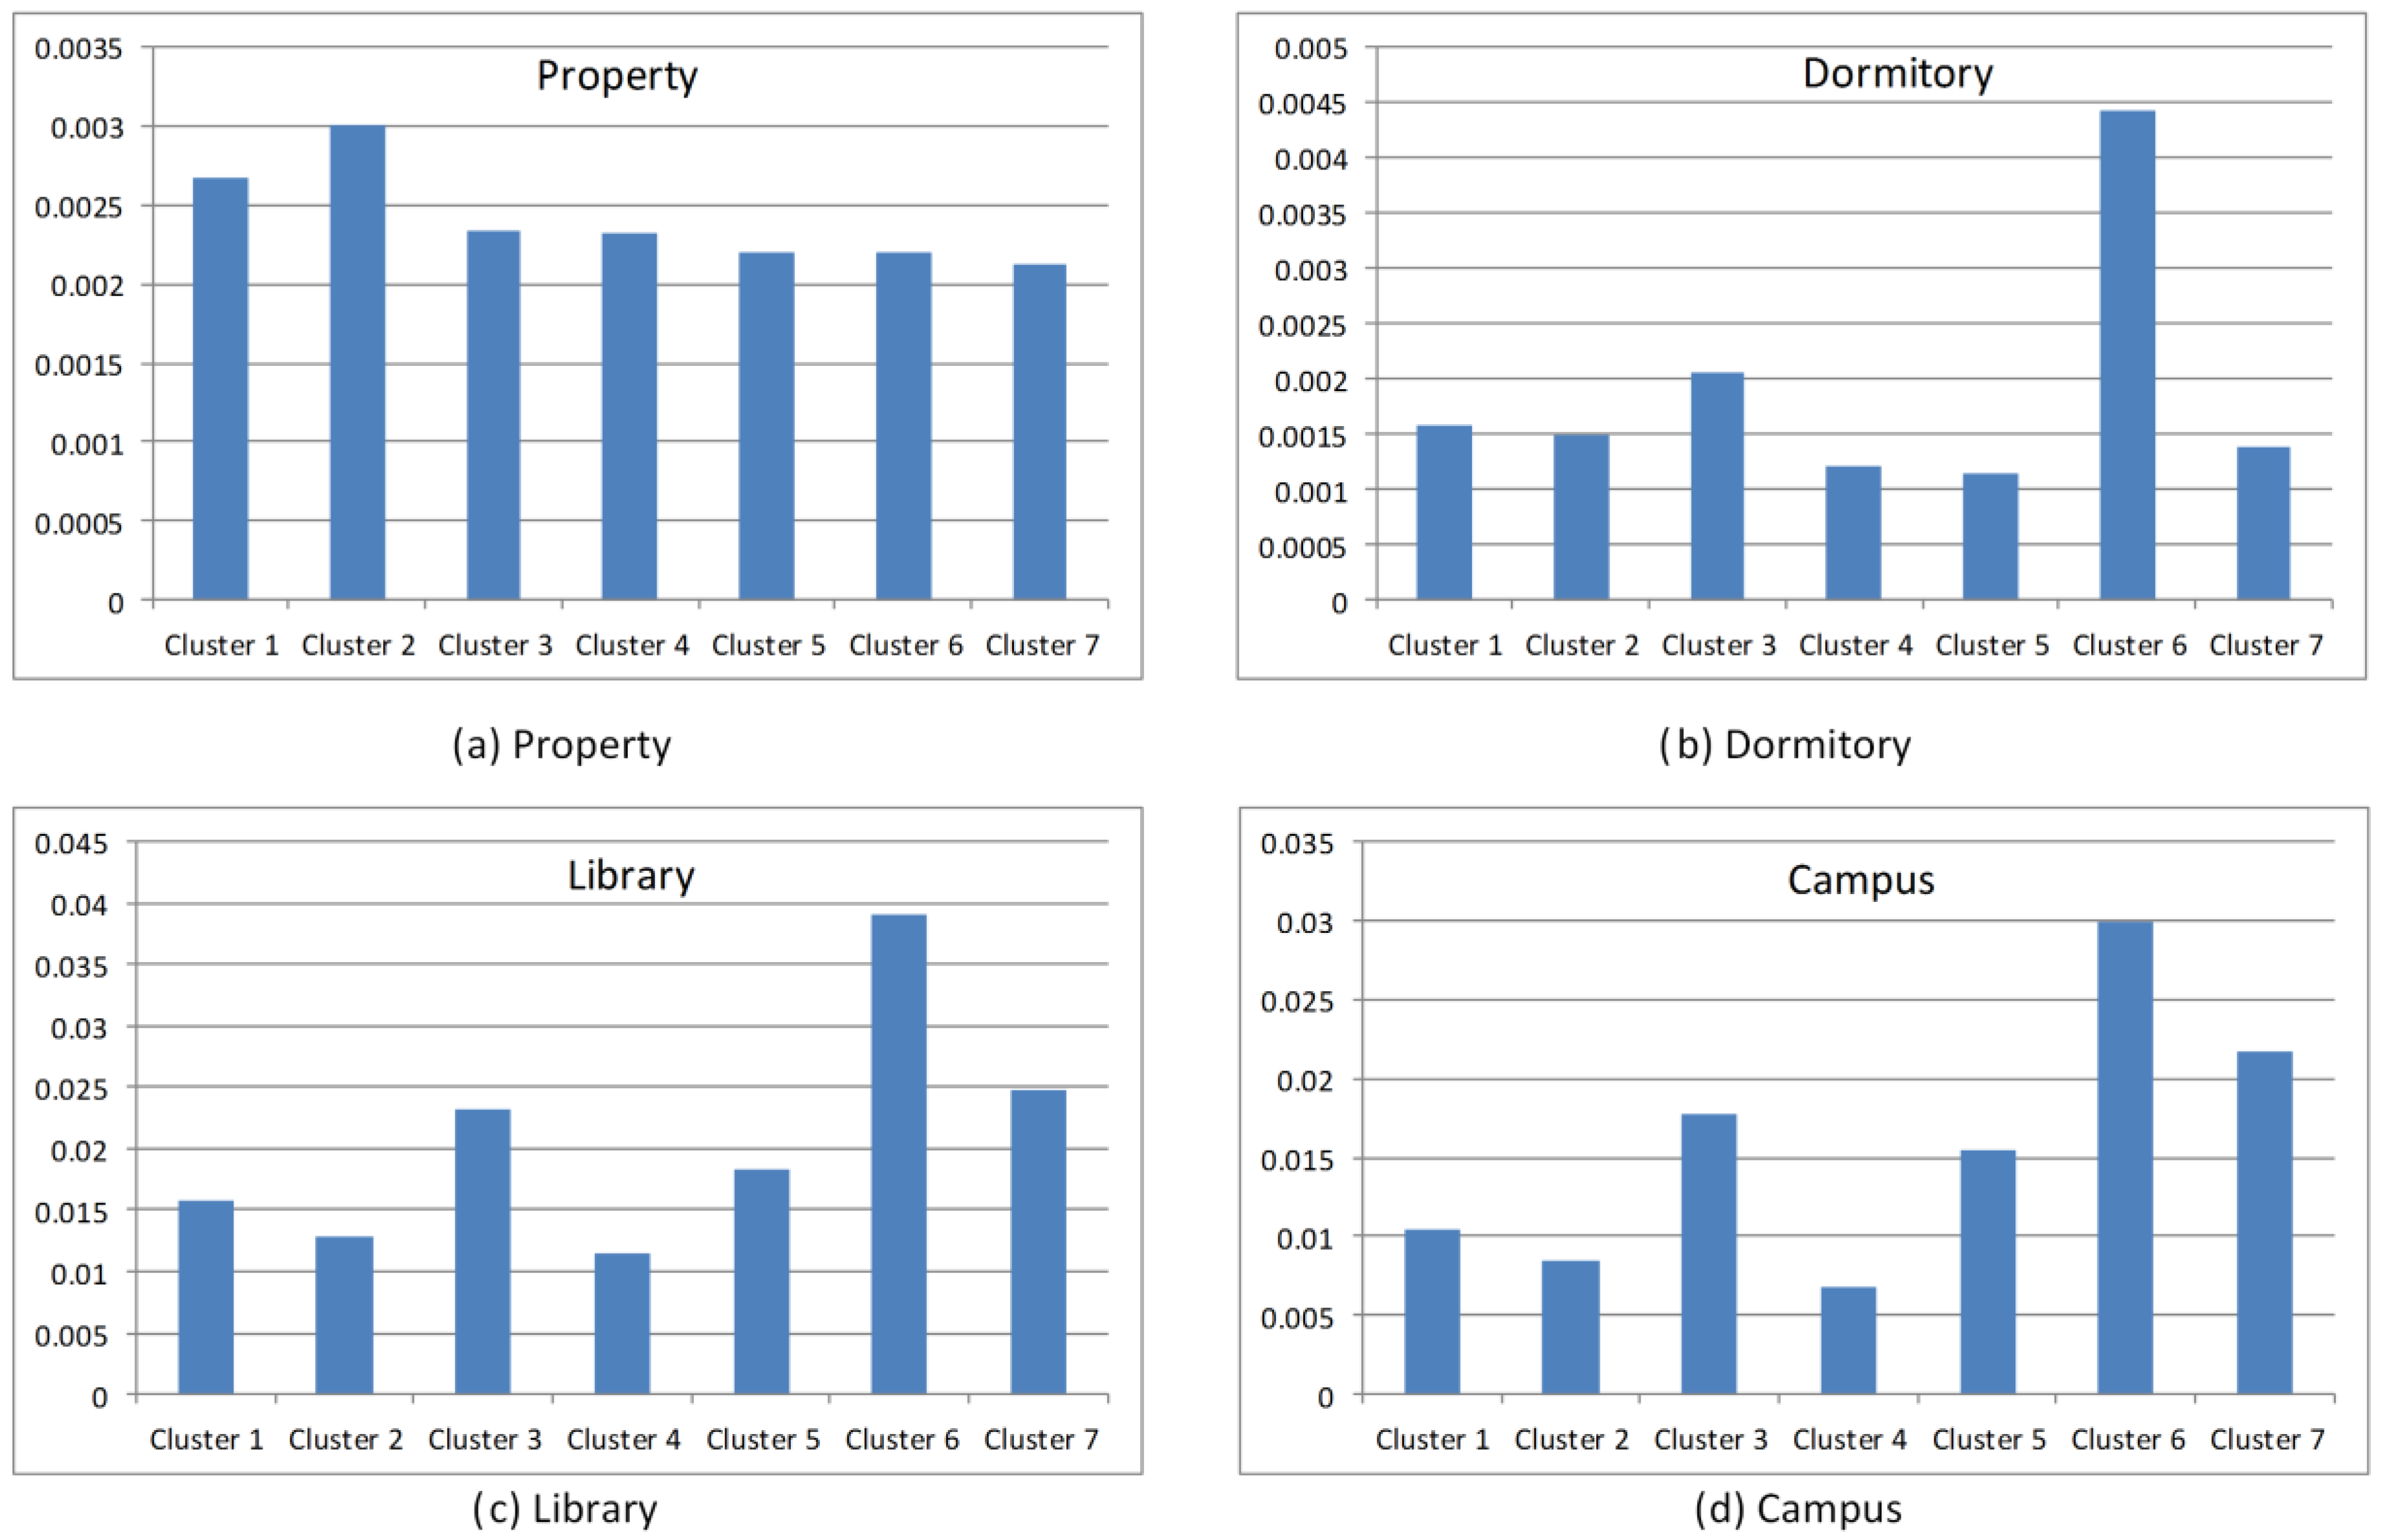
| Core Vocabulary | Related Keywords |
|---|---|
| Property | Tenants, Property fee, Owner, Sharing, Resident, Construction team, Property Company, Power Supply Bureau, Landlord, Homeowners, Directly Rent, Gas, Rental, Load-bearing walls, Water and electricity, Developers, Illegal buildings, Arbitrary charges, Rental housing, etc. |
| Dormitory | Study room, Lights Out, Dormitory building, Roommate, Laboratory, House, Aisle, Self-study, Power outage, Classroom, Corridor, Waterhouse, Power failure, Bed, Bedclothes, Back to sleep, Heater, Office, Washbasin, etc. |
| Library | Study room, Classroom, Reading room, Small classroom, Teaching Building II, Laboratory, Three school buildings, Library, Dormitory, Laboratory building, Light readings, Teaching Building, Peking University Library, School, etc. |
| Campus | University Campus, School gate, Beijing University, Alma mater, Beijing University of Posts and Telecommunications, Beijing Institute of Technology, Tsinghua University, Beijing University of Science and Technology, Tsinghua Park, etc. |
| Eating | Dinner, Lunch, Tired of eating, Too hungry, Vegetable dish, Half full, Change to eat, Too full, Quite full, Satiate, Each meal, Supper, Noodles, Eat less, Bowl, Bun, Rice, etc. |
| Bar | Bar Street, Singing, Cafe, Houhai (place name), Nightlife, Street, Stopover, Drink, Cafe, Pub, Bistro, Stroll, Never sleeps, Good place, Beer, Drum, Belfry, Nightclub, Ambience, Food Street, Quadrangle, Disco, Play, Barbecue, Sachs, etc. |
| Manager | Executives, Administrative Assistant, Headhunter, Commissioner, Employ, Customer manager, Clerk, Reception, Office, Customer, Project Manager, Foreman, Lobby, Staff, Recruitment, Business Manager, Market, Deputy Chief, etc. |
| Boss | Proprietress, Recruiting, Colleague, Helper, Furlough, Foreman, Money, The competent, Work number, Leadership, Store manager, Waiter, Staff, Clerk, Service, Cash register, CEO, Plus wages, Company, etc. |
| Airport Terminal | Parking apron, Gate, Border, Executive Lounge, Capital Airport, International Flights, Direct flight, Beijing Capital Airport, High, Boarding, Flights, Flight number, Air China, Lounge, Air France, Airport, Navigation, Aircraft fault, etc. |
| Cluster 1 | Cluster 2 | Cluster 3 | Cluster 4 | Cluster 5 | Cluster 6 | Cluster 7 | |
|---|---|---|---|---|---|---|---|
| Comprehensive Market | 912 (0.0333) | 337 (0.0411) | 489 (0.0223) | 56 (0.0573) | 183 (0.0101) | 421 (0.0373) | 80 (0.0104) |
| Supermarket | 934 (0.0341) | 526 (0.0641) | 490 (0.0224) | 49 (0.0502) | 312 (0.0172) | 422 (0.0374) | 95 (0.0124) |
| School | 1673 (0.0611) | 606 (0.0739) | 1359 (0.062) | 57 (0.0583) | 768 (0.0423) | 946 (0.0838) | 270 (0.0352) |
| Life service establishments | 2168 (0.0792) | 701 (0.0855) | 1405 (0.0641) | 110 (0.1126) | 854 (0.047) | 796 (0.0705) | 274 (0.0358) |
| Convenience store | 2429 (0.0887) | 857 (0.1045) | 1531 (0.0698) | 99 (0.1013) | 958 (0.0527) | 907 (0.0803) | 285 (0.0372) |
| Beauty salon | 2924 (0.1068) | 973 (0.1187) | 1570 (0.0716) | 101 (0.1034) | 1437 (0.0791) | 1014 (0.0898) | 314 (0.041) |
| Residential region | 6491 (0.2371) | 2409 (0.2938) | 3706 (0.1691) | 220 (0.2252) | 2047 (0.1127) | 2569 (0.2275) | 545 (0.0711) |
| Casual Dining | 46 (0.0017) | 9 (0.0011) | 27 (0.0012) | 1 (0.001) | 85 (0.0047) | 17 (0.0015) | 18 (0.0023) |
| Theater | 109 (0.004) | 15 (0.0018) | 52 (0.0024) | 1 (0.001) | 139 (0.0077) | 23 (0.002) | 25 (0.0033) |
| Cold drink store | 99 (0.0036) | 20 (0.0024) | 73 (0.0033) | 5 (0.0051) | 208 (0.0115) | 44 (0.0039) | 41 (0.0054) |
| Cosmetics shop | 154 (0.0056) | 42 (0.0051) | 83 (0.0038) | 3 (0.0031) | 189 (0.0104) | 45 (0.004) | 39 (0.0051) |
| Mall | 289 (0.0106) | 66 (0.008) | 191 (0.0087) | 9 (0.0092) | 322 (0.0177) | 64 (0.0057) | 75 (0.0098) |
| Sporting goods store | 365 (0.0133) | 87 (0.0106) | 255 (0.0116) | 17 (0.0174) | 487 (0.0268) | 116 (0.0103) | 91 (0.0119) |
| Cafe | 279 (0.0102) | 36 (0.0044) | 348 (0.0159) | 7 (0.0072) | 714 (0.0393) | 138 (0.0122) | 246 (0.0321) |
| Foreign Restaurants | 461 (0.0168) | 45 (0.0055) | 423 (0.0193) | 11 (0.0113) | 1046 (0.0576) | 162 (0.0143) | 231 (0.0302) |
| Company | 8003 (0.2924) | 1450 (0.1768) | 9872 (0.4503) | 230 (0.2354) | 8396 (0.4622) | 3574 (0.3165) | 4976 (0.6496) |
| Industrial Park | 37 (0.0014) | 21 (0.0026) | 48 (0.0022) | 1 (0.001) | 20 (0.0011) | 33 (0.0029) | 55 (0.0072) |
© 2016 by the authors; licensee MDPI, Basel, Switzerland. This article is an open access article distributed under the terms and conditions of the Creative Commons Attribution (CC-BY) license (http://creativecommons.org/licenses/by/4.0/).
Share and Cite
Wang, Y.; Wang, T.; Tsou, M.-H.; Li, H.; Jiang, W.; Guo, F. Mapping Dynamic Urban Land Use Patterns with Crowdsourced Geo-Tagged Social Media (Sina-Weibo) and Commercial Points of Interest Collections in Beijing, China. Sustainability 2016, 8, 1202. https://0-doi-org.brum.beds.ac.uk/10.3390/su8111202
Wang Y, Wang T, Tsou M-H, Li H, Jiang W, Guo F. Mapping Dynamic Urban Land Use Patterns with Crowdsourced Geo-Tagged Social Media (Sina-Weibo) and Commercial Points of Interest Collections in Beijing, China. Sustainability. 2016; 8(11):1202. https://0-doi-org.brum.beds.ac.uk/10.3390/su8111202
Chicago/Turabian StyleWang, Yandong, Teng Wang, Ming-Hsiang Tsou, Hao Li, Wei Jiang, and Fengqin Guo. 2016. "Mapping Dynamic Urban Land Use Patterns with Crowdsourced Geo-Tagged Social Media (Sina-Weibo) and Commercial Points of Interest Collections in Beijing, China" Sustainability 8, no. 11: 1202. https://0-doi-org.brum.beds.ac.uk/10.3390/su8111202