Article

Introduction of Behavioral Parameterization in the EPC Calculation Method and Assessment of Five Typical Urban Houses in Wallonia, Belgium

by
Stéphane Monfils
and
Jean-Marie Hauglustaine
*
Department of Environmental Sciences and Management, University of Liege, B-6700 Arlon, Belgium
*
Author to whom correspondence should be addressed.
Sustainability 2016, 8(11), 1205; https://0-doi-org.brum.beds.ac.uk/10.3390/su8111205
Submission received: 31 August 2016 / Revised: 3 November 2016 / Accepted: 7 November 2016 / Published: 22 November 2016

Abstract

:
The Energy Performance Certification (EPC) of existing residential buildings has been designed to introduce energy efficiency as a comparative criterion for real-estate purchase choices, which should influence real-estate market value and stimulate energy saving investments. EPCs in Belgium are asset ratings, calculated with a standardized approach, which purposefully (and understandably) takes the human factor out of the equations in order to allow the comparison of buildings. As a result, they often overestimate energy consumption and present discrepancies that do not allow appropriation of the results by potential buyers. This study proposes complementary EPC results, obtained by integrating the behavior of occupants in the calculation method. This paper first analyses the pool of behavioral uncertainties that influence the results of EPCs, describes a questionnaire built to gather additional data on households’ characteristics and energy consumption habits and proposes modifications to the calculation method. The complementary results are then compared to regulatory EPC results and real consumption data. Though acknowledging the necessity of a standardized EPC for dwellings’ comparison, this study completes it with data on the energy consumption-related behaviors to (partially) close the gap between real and theoretical consumptions.

1. Introduction

1.1. Context

The European Union’s strategy for sustainable growth makes the energy consumption reduction of the building sector a central objective for meeting the international commitments on climate change. It represented, in 2011:
  • In Wallonia (southern, mainly French-speaking part of Belgium): 22.4% of the total 135.4 TWh final energy consumption [1];
  • In Belgium: 19.9% of the total 39,759 ktoe (around 462 TWh) final energy consumption [2];
  • In Europe (EU28): 25% of the total 1.1 Gtoe (around 12.9 GWh) final energy consumption [3].
At a worldwide scale, this sector is thus regarded as one of the most cost-effective options for saving CO2 emissions [4]. In Belgium, national and regional policies have gradually been introduced for decades in order to reduce the global energy consumption of the building sector. Thermal regulations for buildings, for example, were introduced in Wallonia in 1985 (followed by the other regions in 1996 and 2002), but have, so far, mainly targeted new buildings.
The vast majority of the Walloon residential park is relatively old however: around half of it has been built before 1945, 70% before the first oil crisis of the 1970s and 75% before the first thermal regulations, in 1980 [5]. According to the same source, half the roofs were insulated in 2006 (with insulation layers of a minimum of 3 cm), and 80% of buildings were (partially) garnished with double glazing (but high performance glazing completely equipped only 10% of those). Walls were less often insulated due to technical difficulties, the architectural interest of the facades, higher costs, permits and administrative workload.
As everywhere else in Europe, it can be considered that most existing buildings will still be standing up and (hopefully) be used by the years 2020, 2030 or 2050 corresponding to varying regional objectives in reducing the energy consumption and the GHG emissions. Therefore, new buildings are expected to play a negligible role in future global consumptions, and it is crucial to target the existing park energy consumption by specific policies in order to reach those objectives.
One of the recent policies that targets this high improvement potential in the existing buildings (and the center of this study) has been imposed by the European Union [6]: the Energy Performance Certificate (EPC), a mandatory assessment of any existing dwelling’s energy performance, which witnesses its energy consumption and efficiency, when it is sold or rented. It includes, in Wallonia:
  • An asset rating of the annual primary energy consumption for heating, Domestic Hot Water (DHW), cooling (if present) and auxiliaries consumptions, expressed in kWh/m2 year;
  • A scale rating, based on the asset rating result, to sort buildings into efficiency categories (from A++ to G) and to allow easier comparisons between buildings.
The information given by the certificate firstly aims at communicating on energy performance to potential buyers or tenants, in order to progressively introduce energy efficiency as a comparative criterion in the search for a dwelling. It also tries to stimulate energy saving investments by delivering advice on technically possible improvements and to influence prices in a real-estate market that should gradually move towards greater global energy efficiency and towards Belgium’s goals in the reduction of global energy consumption and CO2 emissions. Lastly, it is expected to help build up comprehensive benchmarking databases, fundamental for shaping renovation strategies on local, regional and national levels.
A general observation, however, is that the Walloon EPC shows the same early dysfunction as the U.K.’s or Germany’s EPCs [7,8,9]. Communication on the EPC is, at best, inefficient:
  • The administration has very little direct contact with end-users, apart from (lengthy) guides released to help users understand their EPC.
  • Financial profitability leaves to the assessor few liberties to discuss the method, protocol, his/her assessment or conclusions.
  • Real-estate agents are not trained on the certification protocol, so that they generally cannot give better than fragmented information on the results (and they generally focus more on the A-to-G rating than the kWh/m2 year rating level or the improvement advice).
As a result, people are often left alone with the information, and do not take advantage of the not-so-frequent opportunity of having an expert assessing their building’s performance. Interest on the end-user part is crucial (a message needs a receiver), of course, but current communication on EPC is based on the assumptions that people: (1) understand that an EPC is an asset rating and not an operational rating; and (2) know to what a kWh of primary energy per square meter of “heated floor area” relates. Those who do not have the educational background are often left with their questioning, if they are interested enough. What use can they make of general renovation advice like “insulate your walls and your floor”? Additionally, for those who do understand, what conclusion can they draw, when the results often overestimate consumption by a factor of three or four?
The first problem, therefore, seems to be the lack of communication, knowledge and appropriation of the results. (“Individuals do not merely ‘internalize’ socially-derived knowledge. Rather, they engage in a transformative and constructive process referred to as ‘appropriation’ [10] in which both the source of the knowledge and learner are reciprocally transferred through individuals engagement in goal-directed activity” [11]. In this context, appropriation is defined as the ability for the user to understand and adopt the EPC message and results. Awareness (of their influence on consumption) and perceived usefulness of results and advice are important in order to mobilize this new personal knowledge and to act upon it [12].) Energy often remains a mysterious feature of everyday life that mainly allows one to reach comfort standards (in heating, DHW, lighting, cooking and use of various appliances); in the eyes of the end-user, the task of reducing energy consumption has generally been seen as a public concern (resource depletion, prices and economics, technological and technical innovations, national dependency and security, fuel poverty, global environmental change and (inter)national politics, etc.), which “faces scientific rather than social challenge” [13] (p. 2). This situation is changing however: actors of energy have increasingly been interested in the explanations social sciences can bring to the relationship between energy use and the ordering and organization of everyday life, and social sciences have been taking a growing interest in sociotechnical research. The sociology of energy, for example, is a branch of sociology recently developed that investigates energy-related knowledge and practices in the professional worlds of building research, design and construction, takes interests in the energy transition schemes and enlightens the need to encourage, accompany and constrain the structural changes, in order to attain the objectives in decreasing energy consumption and increasing efficiency [13].
By enlightening human behavior (anthropic activity) and energy consumption as major influences on climate change, the Inter-governmental Panel on Climate Change [4] is also spreading the word that behaviors must be taken into account in the pursuit of our international engagements.
This study, therefore, proposes an improvement on the communication around the EPC that could be attained by considering the behavior of occupants in the calculation method. We acknowledge, of course, the necessity to keep the actual standardized approach in order to allow building comparisons; but it is believed that complementary results could help future owners understand the performance of the coveted dwelling and foresee a rough monthly energy bill.

1.2. Behavioral Standardization

The 2002/91/CE and 2010/31/UE European Directives imposed domains of energy consumption that had to be considered for the assessment of the energy performance of a new residential building: heating, Domestic Hot Water (DHW), cooling and auxiliaries (with eventual compensation due to PV panels or cogeneration). The definition of the calculation method in itself, however, is left to the member states (or regions, in the case of Wallonia). The Walloon regulatory calculation method is described in [14] and had to be adapted in its Annex D [15] for the assessment of existing residential buildings.
Wallonia uses a standardized consumption calculation method (asset rating), instead of a measured data-based method (operating rating). Measured certification normalizes real consumption data in order to reach standardized energy consumption, using calculation parameters such as climate, building size and type, behavioral habits and patterns of use [16]. Besides the need to divide the measured energy into its different uses, adjustments to standardized energy use can be a huge problem, as real consumption data are obviously greatly influenced by the behavior of the occupants. In contrast, the calculated energy rating evaluates the performance using building characteristics (as close to reality as possible), default values (when no accepted proof of a more accurate value is available) and standardized parameters (which cannot be replaced by more accurate values, even if they are known).
In the Walloon regulatory calculation method, standardization seeks the assessment of the dwelling without the influence of the occupants. Reality, of course, displays a complete range of behaviors, set temperatures and heating habits that are bound to influence greatly the final energy consumption. In theory, two different families living in two identical homes would receive identical EPCs, but in reality, their real consumption would vary from one to three or four, depending on occupants’ behavior and household characteristics. Examples of previous studies on behavior-related residential energy consumption are given by Fanger [17], Hauglustaine [18], Lutzenheiser [19], Wilhite et al. [20,21,22], Linden et al. [23], Wallenborn [24], De Groot et al. [25] or, more recently, Guerra-Santin [26], Allibe [27] or Hens [28]. These studies pointed to metabolism, activity, gender and clothing amongst important comfort factors, provided insight into behavioral patterns (describing the inside climate as a rather energy-intensive heating habit) or showed variations in household behaviors, equipment rates and energy consumption.
An elaborate protocol and a short, precise and exhaustive list of accepted sources of accurate data in the dwelling description (“acceptable proofs”) have been developed to impose a rigid EPC assessment method, leaving few liberties to the assessors in the process. Although this is not directly linked to the results of this study, reservations should be mentioned towards the certification process in itself and the assessor’s skills and professionalism. It is said by the administration that the process has been developed so that different assessors should obtain the same results for the same dwelling (another kind of “behavioral standardization”). In 2012, however, a consumer-focused magazine [29] asked five assessors to certify the same houses in different parts of the country. For a single dwelling, the greatest range of estimated consumption spanned between 162 and 402 kWh/m2 year, witnessing important divergences in the process. Although the range is surprisingly wide, the human nature of the assessor should taint the process by uncertainties on input precision, accuracy or even plain correctness, however tight the protocol. Differences in data investigation and interpretation, or in profitability definitions, are bound to arise. This uncertainty has been somewhat lifted in this study, as all EPCs were made by trust-worthy assessors who stuck to the protocol.
More importantly, the “few liberties” left in the standardized calculation method have led the EPC assessors to resort to a high number of default values, which saves precious time and money when it comes to the always challenging characterization of an existing building’s envelope and systems. However, in the category of shortcuts, this study focuses more on the standardization that has been imagined to take the human factor out of the equations in order “to assess the building’s performance, not its users’ habits”. This includes the following parameters of the calculation method that should be considered influenced by dwellers’ behavior and comfort standards in a realistic approach:
  • The definition of the set temperature for heating the dwelling;
  • The definition of the heated volume, inside the “protected volume”;
  • The evaluation of internal loads, whether they could be gained from electricity consumption (equipment, cooking, lighting) or the metabolism of inhabitants;
  • The evaluation of heat losses due to ventilation;
  • The definition of DHW demands.
The next part of the paper will explain the materials and methodologies used for this study, including the selection of dwellings, the construction of the questionnaire and the modifications brought to the calculation method. The third part will display results of the case studies, evaluated with both the regulatory method and the proposed modified method. In addition, real consumption data, given by the respondent in the questionnaire, are presented for comparison. A discussion and conclusions will close the paper.

2. Materials and Methods

2.1. Dwellings

As a general rule in Wallonia, the older the building, the lower its energy performance and, often, its quality (salubrity, water tightness and woodwork stability in roofs, humidity, etc.). Old buildings are more present in urban centers, which developed before the first half of the 20th century. In Wallonia, this translated into the massive construction of brick houses during the development of the steel industry in the Meuse valley. These houses represent a major part of the residential energy consumption, as they are both highly represented in the territory of Wallonia (around one third of Walloon houses) and are in a global poor state, as far as energy performance and healthiness are concerned [30].
This study focuses on a small number of old urban typologies: five urban houses have been chosen (Table 1), representing different forms of that old single-family brick house. The only exception in this sample is the first case, which represents a modern form of that typology, built in 2007, and which will be used as an assessment comparison between old and new dwellings.
This limited selection of typologies already introduces a bias in population representation, as these dwellings are more often occupied by households with lower income, young people (newly active in the urban fabric, in search of first homes, etc.) and families (growing with the size of the house) [30]. Additionally, this sample in itself is quite small, which means that it will probably not represent the whole range of households (in socio-economic and socio-demographic variables) or behaviors that could be encountered. This study, however, aims at validating the method and the questionnaire; it is a first step; other cases studies, dwellings and households will follow in ulterior assessments.
The first analysis of the data (Figure 1, see below) proves that EPCs overestimate final energy consumptions of natural gas. Electricity consumption shows very different results, as the EPB (Energy Performance of Building; in this case, it refers to the Walloon thermal regulation applied to buildings) calculation method only considers the consumption for auxiliaries needed for heating and ventilation systems. Real electricity consumption is obviously expected to be higher, as it includes all electricity uses in the dwelling.

2.2. Questionnaire

In order to gain additional data on inhabitants’ behavior and energy consumption habits, a questionnaire has been built and progressively enriched. Five households were interviewed by the author, who filled in the questionnaire. This phase allowed the interviewers to evaluate (and sometimes improve) their understanding of the questions, and their level of consciousness on some behaviors that have been pointed out to influence energy consumption. It also permitted witnessing some habits and behaviors that were not yet considered or not verbalized by respondents.

2.2.1. Socio-Demographic Variables

Several socio-demographic variables have been identified by previous recent studies [23,24,25,26,27] as important determinants in the analysis of a household’s energy consumption; they have been considered in this study, as the questionnaire included questions on:
  • The household’s characteristics: size of the family, presence of toddlers, presence of children aged 15 or less, presence of people aged 65 or more; and overall income category;
  • The description of the responder to the interview (head of house): gender, age category, highest diploma, occupation.

2.2.2. Building

An EPC assessor only gathers information on the building that is needed for the EPC calculation method; some additional data are expected to be of importance in this study, so that the questionnaire enquires about:
  • The age of the building, its typology category, number of exterior facades, position in the block;
  • The existence (and use) of an extension (quite commonly built at the back of the building, after the original building and often lower quality);
  • The use of the upper floor area (for dwelling or for storage purposes, part of the heated volume or not, etc.);
  • The energy improvement investments that have been made since the EPC assessment, in order to upgrade it to better match the reality.

2.2.3. Heating Habits

The regulatory calculation method considers the whole protected volume as heated, all year round, at the same set temperature of 18 °C (20 °C during daytime, 16 °C during nighttime). In this rigid, standardized single-volume approach, there is no distinction between spaces, as far as heated periods or set temperatures are concerned, which explains part of the over-estimated results.
Different heating schemes for four main spaces (living room, kitchen, bathroom and bedrooms) were enlightened by the interviews and literature [23,24,25,26,27,31]. It became apparent, for example, that the daytime and nighttime zones of the dwellings are often managed differently in terms of set temperatures and heating schedules, depending on occupation patterns (and, therefore, the professional and/or scholarly situation of the occupants). The kitchen’s heating scheme generally follows the living room pattern, except when both spaces are separated by doors, walls or hallways (in open spaces, kitchens are extensions of the living room and, therefore, heated in the same way). Bathrooms are often heated only when needed, and at a higher temperature (often, even, boosted with an electrical device in addition to the central heating system); children’s bedrooms are more often heated than parental bedrooms. As a consequence, we considered 6 spaces in these equations: living room, kitchen, unheated bedrooms, heated bedrooms, bathroom and “others”. Consequently, the questionnaire displays questions that are used to describe the household’s heating pattern and temperature management profile for those main spaces. A “normal” winter week (work or school week) has to be described as follows:
  • Number of “all-day heating” days a week, during which the whole volume or the daytime zones only are fully heated all day (14 h a day by hypothesis);
  • Number of “partial heating” hours: average number of hours during which the main spaces are heated on “other days” (not “all-day” heating days);
  • Spaces heated during winter nights;
  • Set temperatures (when known; default values will have to be used otherwise) for daytime and nighttime (when necessary);
  • Heating devices (for the repartition of real consumption data);
  • Global temperature management systems (the presence of a regulation system).
Respondents are also questioned on “rational use of energy” habits that are bound to influence general temperature management hypotheses. In temperature management, the habit of closing or not closing doors between heated and non-heated spaces is expected to influence the temperature difference between those spaces, so that this question has been integrated with the questionnaire.

2.2.4. Ventilation Habits

Due to their influence on energy consumption, ventilation habits are also to be investigated, despite their often unconscious, irregular and inconstant nature in old buildings where no complete system exists. The questionnaire displays a series of possible ventilation schemes for four main spaces (living room, bedrooms, kitchen and bathroom), from “we do not (or rarely) ventilate this room in winter” to “this space is equipped with complete ventilation system with heat recovery”, passing by “there is enough draught as it is”, “we ventilate punctually” or “daily”, “there is a ventilation system but we shut it in winter”, etc.
In terms of air change rate, airtightness is an important parameter in old houses that generally are not equipped with standard ventilation systems. Without any “blower door” pressurization test on the building, the leak-flow parameter (v50,heat) remains a default value that cannot be changed easily. The only recurrent behavior that helps reduce air leakages is the weather-stripping of doors and windows. The “rational use of energy” section of the questionnaire thus asks the respondent to answer the following question: “Do you weather-strip the doors and windows in winter?”

2.2.5. Internal Gains

Internal loads can be gained from different sources. In this study, the overall internal load will be evaluated through metabolism, lighting of the spaces and electr(on)ic equipment and appliances (including cooking).
Metabolism loads are approached through the heating (=occupation) schedule of the dwelling and the size of the household.
Lighting loads depend on the power of the installation and the area to be lit; thus, the following questions are added to the questionnaire in order to refine the evaluation:
  • “Do you use low-energy bulbs?” and “Is the lack of natural light quality in the day zone a problem in your dwelling?” influence the lighting power hypotheses;
  • “Do you switch off the lights in unoccupied spaces?” reduces the lit area in brighter homes.
Respondents are asked to define their level of equipment, in order to evaluate the associated electrical consumption. Previous steps in this study have shown that a thorough listing of equipment appears relatively long and invasive from the respondent’s point of view; as a result, five average levels of equipment are proposed for the respondent’s choice:
  • Light (basic equipment of fridge with freezer, dishwasher or washing machine, microwave and regular ovens, extractor hood, radio, television and decoder, iron and vacuum cleaner);
  • Moderate (“light” + dishwasher and washing machine + computer and router, etc.);
  • Average (“moderate” + comfortable kitchen equipment + electric dryer, etc.);
  • Important (“average” + independent freezer + occasional second fridge + second computer, etc.);
  • Heavy (“important” + second television and high-tech media equipment, etc.).
Additional data allow some refinement in the estimation of internal loads:
  • The number of household members (a part of the consumption for each piece of equipment is fixed; a part varies according to the size of the household, including cooking equipment, small appliances and sleep mode consumptions);
  • The number of weekly uses of their dishwasher, washing machine and electric dryer (open questions in the questionnaire);
  • The daily use level of their television(s) and computer(s), with 6 possible answers: “NA”, “Less than 2 h a day”, “2 to 4 h a day”, “4 to 6 h a day”, “6 to 8 h a day” and “more than 8 h a day”;
  • The evaluation of sleep mode-associated consumptions, approached thanks to the question “Do you switch off or disconnect appliances, instead of letting them be in sleep mode?”

2.2.6. DHW Needs

DHW needs are approached in the questionnaire with two questions:
  • “How many baths/showers per week for the entire household?”
  • “Do you tend to prefer showers to baths, in order to save time and/or water consumption?” This “rational use of energy” question mainly calibrates the new DHW need evaluation.

2.2.7. Consumption Data

The questionnaire enquires about the respondents’ real consumption data for energy vectors (including wood, natural gas and electricity) and the corresponding period, so that climatic data can be chosen consequently.
Electricity consumptions are always given in kWh on invoices, so that these data were easily accessible. All houses used natural gas as the main energy vector, and data are also available in kWh on annual invoices. When necessary, data were translated into kWh, considering a calorific power of 11.5 kWh/m3 for natural gas [32] and 3.5 kWh/kg of dry wood [33].

2.3. Calculation Method

2.3.1. Simulator

It was necessary to find software that would allow alterations on the calculation method, which was obviously not the case of the software developed by the administration for the regulatory EPC assessment of existing dwellings.
In 2004, Wallonia launched an incentive program destined to prepare the building sector for the arrival of the EPB regulations in 2008, called “Build with energy… naturally”. With still 4 years to wait for the official software to be developed, a slightly simplified method (only new residential units were concerned) was implemented to allow complete assessments in an Excel spreadsheet by G. Dupont (University of Liege, Energy and Sustainable Development research unit, directed by Prof. J.-M. Hauglustaine, PhD) and S. Nourricier (University of Mons, Department of Thermal Engineering and Combustion, directed by Prof. V. Feldheim, PhD).
The calculation method for the assessment of existing dwellings’ energy performance is not different from the method for new dwellings in its general structure, but it introduces several simplifications, standardization and default values to ease the description of the building. Alterations were possible in accordance with the regulatory calculation method [13], as well as shortcuts (direct introduction of input data for the protected volume (Vp) or the heated floor area (Ach); or unmodified intermediary results from the EPC files, like the average thermal transmission coefficient, Um, or the solar gains, Qs,m).
Using respondents’ answers to the questionnaire to feed the calculation method requires a back-and-forth movement between both tools: progressive modifications have thus been made to the regulatory calculation method. The easiest way to offer more realistic complementary results is to keep the structure of the steady-state monthly calculation method. Without any further description of the building (internal walls, for example), it is essential to keep the single-zone model and the important parameters, which are the protected volume and the heated floor area. As a consequence, Net Heat Demands (NHDs) have to be revaluated for the whole dwelling, heated and unheated spaces alike.

2.3.2. Net Heat Demand

The official calculation method estimates the NHD thusly:
Q heat , net , m = Q T , heat , m + Q V , heat , m   η util , heat , m   ( Q i , m + Q s , m )
with:
  • Qheat,net,m = monthly NHD (MJ);
  • QT,heat,m = monthly heat losses due to transmission (MJ);
  • QV,heat,m = monthly heat losses due to airtightness and ventilation (MJ);
  • ηutil,heat,seci,m = monthly heat gains application rate, a factor that tames the internal and solar gains when they are less needed (depending on the losses/gains monthly ratio); its evaluation is not changed in this method;
  • Qi,m = monthly internal gains (MJ); see [6] for the proposed evaluation method;
  • Qs,m = monthly solar gains (MJ). Their evaluation is not changed in this method.

2.3.3. Heat Losses by Transmission

They are evaluated as follows in the regulatory method:
Q T , heat , m = H T , heat × ( 18   θ e , m ) × t m
with:
  • QT,heat,m = monthly heat losses through the envelope (MJ);
  • HT,heat = transmission heat losses coefficient (W/K), sum of the heat losses through the different walls of the envelope. This parameter is mainly ruled by default values that are difficult to change (when there is no more accurate data available) and uninfluenced by inhabitants behavior and habits, so that it will not be questioned here;
  • θe,m = monthly average exterior temperature (°C);
  • tm = length of the month (106 s).
Without modifications on the HT,heat coefficient, we can intuitively consider two possible alterations to Equation (2): the definition of the set temperature and the introduction of different periods of the heating schedule by the subdivision of the “time” (tm) term into a sum of tm,i terms:
t m = i = 1 i = t m , i
with tm,i = length of the “i” period (106 s).
This means that for each tm,i period, the set temperature can be redefined, based on the volumetric proportions and set temperature of the different spaces, according to the respondent answers to the questionnaire. This way, a big uncertainty on an annual average (Tset = 18 °C in the regulatory calculation method) is replaced by smaller uncertainties on periodic averages:
Q T , heat , m =   i = 1 i =   H T , heat , m × ( T set , i   θ e , m ) × t m , i
with Tset,i = average set temperature for the “i” period.
Set temperatures are given (or approached, when unknown precisely) for the main heated spaces by the respondents during the interviews. For unheated (or indirectly heated) spaces, however, no temperature monitoring allowed exact hypotheses, so that the temperature in those spaces was assigned empirically (and this is another uncertainty on the result that must be acknowledged). This ΔT between heated and unheated spaces is mainly defined through the question “Do you close doors of non-heated spaces, in order to isolate them from the heated volume?” (ΔTuhs = 3 to 5 K, depending on the answer). This first hypothesis is then corrected by the principle that a well-insulated building (characterized by a lower average thermal transmission coefficient Um) provides more uniform temperatures throughout the volume, thus producing a more comfortable occupant environment:
T set , unheated   spaces = T set , heated   spaces ( Δ T uhs × f Um )
with:
  • ΔTuhs = empirical temperature difference between heated and unheated spaces (K);
  • fUm = multiplicative factor, empirically equal to the average thermal transmission coefficient (Um) of the building (-).
Therefore, the average periodic set temperature is defined thusly:
T set , i =   j = 1 j = 6 T i , j × V p , j V p
V p = j = 1 j = 6 V p , j
with:
  • Ti,j = temperature of the “j” portion of the Vp, during the “i” period (K); these data are either given by the respondent or a default value when unknown;
  • Vp,j = protected volume of the “j” space (m3);
  • Vp = protected volume of the whole dwelling (m3).

2.3.4. Heat Losses by Ventilation

Their evaluation (QV,heat) in the regulatory method is very similar to Equation (2), except that the coefficient (HV,heat) includes heat losses caused by both air tightness and hygienic ventilation:
H V , heat = 0.34 × ( V ˙ in / exfilt , heat + r preh , heat × V ˙ hyg , heat )
with:
  • HV,heat = heat losses coefficient due to air tightness and ventilation (W/K);
  • Vin/exfilt,heat = air tightness ventilation air flow for heating calculations (m3/h);
  • rpreh,heat = taming factor considering the pre-heating of the ventilation air (when applicable) (-);
  • Vhyg,heat = hygienic ventilation air flow for heating calculations (m3/h).
In the modified method, the total air change rate (due to ventilation and air tightness) is revaluated following respondents’ answers to their ventilation and weather-stripping habits.
As far as air tightness is concerned, the answer of the respondent to the question “do you weather-strip the doors and windows in winter, to avoid air leakages?” defines the value of an empirical multiplicative factor (fv50, which ranges from 0.8 to 1) that eventually reduces the air change rate through the envelope.
v ˙ 50 , behav = v ˙ 50 , heat × f v 50
V ˙ in / exfilt , heat = 0.04 × v ˙ 50 , behav × A T , E
with:
  • v50,heat = air flow default value, under 50 Pa pressure, by square meter of the heat loss area, for heating calculations = 12 m3/h m2;
  • v50,behave = air flow due to airtightness, under 50 Pa pressure, by square meter of the heat loss area, tamed by inhabitants’ behavior (m3/h m2);
  • fv50 = multiplicative factor taming the air flow to consider behavior (-);
  • AT,E = total heat losses area of the envelope of the protected volume (m2).
In the regulatory method, the heat losses due to hygienic ventilation are estimated with the protected volume as the only parameter:
V ˙ hyg , heat = [ 0.2 + 0.5 × e ( V P 500 ) ] × m heat × V p
with:
  • Vhyg,heat = hygienic ventilation air flow for heating calculations (m3/h);
  • mheat = multiplicative factor, depending on the ventilation system quality of execution (taking air leakages into consideration, for example; when no system is present, this parameter is set to 1).
Without any complete standard ventilation system in any of the studied buildings, air change rates were unobtainable, and validation of the following hypotheses was not possible. However, due to their influence on energy consumption, it was necessary to approach more realistic estimates of air change rates in main spaces, via the questionnaire:
  • If the room is declared “non-ventilated”, or “only ventilated through air leakages”, or “punctual window opening” (on occasions, as opposed to regular or daily opening): Vhyg,heat,j = 0 m3/h;
  • “Daily window opening”: Vhyg,heat,j = 100% of the Vp,j, the volume of the space in question (m3/h);
  • “Obstruction of air vents”: Vhyg,heat,j = 15% of the regulatory air ventilation flow for the space (which is the maximum air flow allowed by the Belgian residential ventilation standard—NBN D50-001—when vents are closed) (m3/h);
  • “Use of a kitchen extractor hood”: Vhyg,heat,j = 400 m3/h multiplied by the number of hours during which the hotplates are used (20 min/day + 10 min/day per person ) (m3/h);
  • “Use of a bathroom extractor hood”: Vhyg,heat,j = 100 m3/h multiplied by the number of hours during which the bathroom is being used (m3/h);
  • “Use of a complete ventilation system”: Vhyg,heat,j = 100% of the regulatory air ventilation flow for the protected volume (m3/h);

2.3.5. Internal Gains

In the official calculation method, they vary linearly with the protected volume:
Q i , m =   ( 0.67 × V p + 220 ) × t m
In this proposition, however, internal gains are revaluated as the sum of power delivered by:
  • The presence of inhabitants (depending on the size of the household, the occupation pattern of the building and the loads defined by the ISO 7730:2005 standard):
    Q met , a =   ( i = 1 i = a N occ × P met , i × t m , i 3600 )
    with:
    Qmet,a = annual internal loads due to metabolism (occupation pattern) (MJ);
    Nocc = number of occupants, size of the household (-);
    Pmet,i = metabolism load of one person present during the period ‘i’ (ISO 7730:2005: 80 W/person at sleep; 100 W/person awake, light activity; 120 W/person awake, daytime);
    Tm,i = length of the period “i” (106 s).
  • The equipment, which depends on the description made by the respondent in the questionnaire (“light” to “heavy” levels, number of daily or weekly uses for washing and media appliances).
    Q Equip , a =   Q e , a
    with:
    QEquip,a = annual internal loads due to equipment and appliances (MJ);
    Qe,a = annual consumption of each equipment of the list defined by the level of equipment and/or the number of uses, and the number of inhabitants; see Section 2.2.5 above (MJ).
  • The lighting of the dwelling, which depends on the lighting time, the power installed and the lit area (approached via the heated floor area and taming factors).
    Q light , a = ( N h , light , a ×   f qual , L × P L ×   A ch ×   0.8 ×   f L ) 3600
    with:
    Qlight,a = annual internal loads due to lighting (MJ);
    Nh,light,a = average annual number of hours when lights are on = 1300 h/year, considering ephemeris in Belgium [34], 8 h of sleep a night and 3 annual weeks of absence.
    fqual,L = multiplicative factor (-) = 0.8 to 1.6, depending on the answer to the “quality of natural lighting in day zone” question;
    PL = lighting power = 4 to 8 W/m2, depending on the answer to the “do you use low-energy light bulbs” question;
    Ach = heated floor area (m2), reduced by the 0.8 factor to exclude walls and circulation areas;
    fL = empirical taming factor (-) = 0.5 to 0.9 depending on the answer to the “do you switch off the lights in unoccupied rooms” habit.
Internal gains described above were summed up on an annual basis and redistributed to each tm,i period.
Q i , a = Q Equip , a +   Q met , a +   Q light , a
Q i , m =   Q i , a ×   t m t a
with:
  • Qi,a = annual internal loads (MJ);
  • ta = length of the year (106 s).

2.3.6. DHW Demand

This other consumption normally depends on the number of inhabitants. In the official method however, it is calculated with the building’s protected volume as the only parameter:
Q water , bathi , net , m = f bath , i × max ( 64 ,   64 + 0.22 × ( V p 192 )   ) × t m
Q water , sin ki , net , m = f sin k , i × max ( 16 ,   16 + 0.055 × ( V p 192 )   ) × t m
with:
  • Qwater,bathi,net,m, Qwater,sinki,net,m: net DHW energy demand for a bath or a kitchen sink (MJ);
  • fbathi, fsinki: the part of the bath or kitchen sink in the total DHW net energy demand (-).
In this study, a realistic demand in DHW was estimated as the first approach by the number of baths and showers taken weekly by the household and their tendency to prefer showers (rational use of energy) to baths. By hypothesis, respondents are given a “water consumption level” (from ‘light’ to ‘heavy’) and attributed a daily use of 30 to 50 liters of water according to the level granted [18,35]. This water supplied comes out of the public network at an average temperature of 10 °C and has to be heated, every day, to a minimal temperature of 50 °C, so that the monthly net energy demand for DHW becomes:
Q water , net , m = ( N lt × N d , m × 4.1855 × ( θ water , out θ water , in ) ) 1000
with:
  • Qwater,net,m: the net energy demand for domestic hot water production (MJ);
  • Nlt: the number of liters to be heated (L);
  • Nd,m: the number of days in the month (-);
  • 4.1855: the energy needed to raise by 1 °C the temperature of 1 cm3 of water (J);
  • θwater,out: the temperature of the heated water = 50 °C;
  • θwater,in: the temperature of the supplied water = 10 °C.
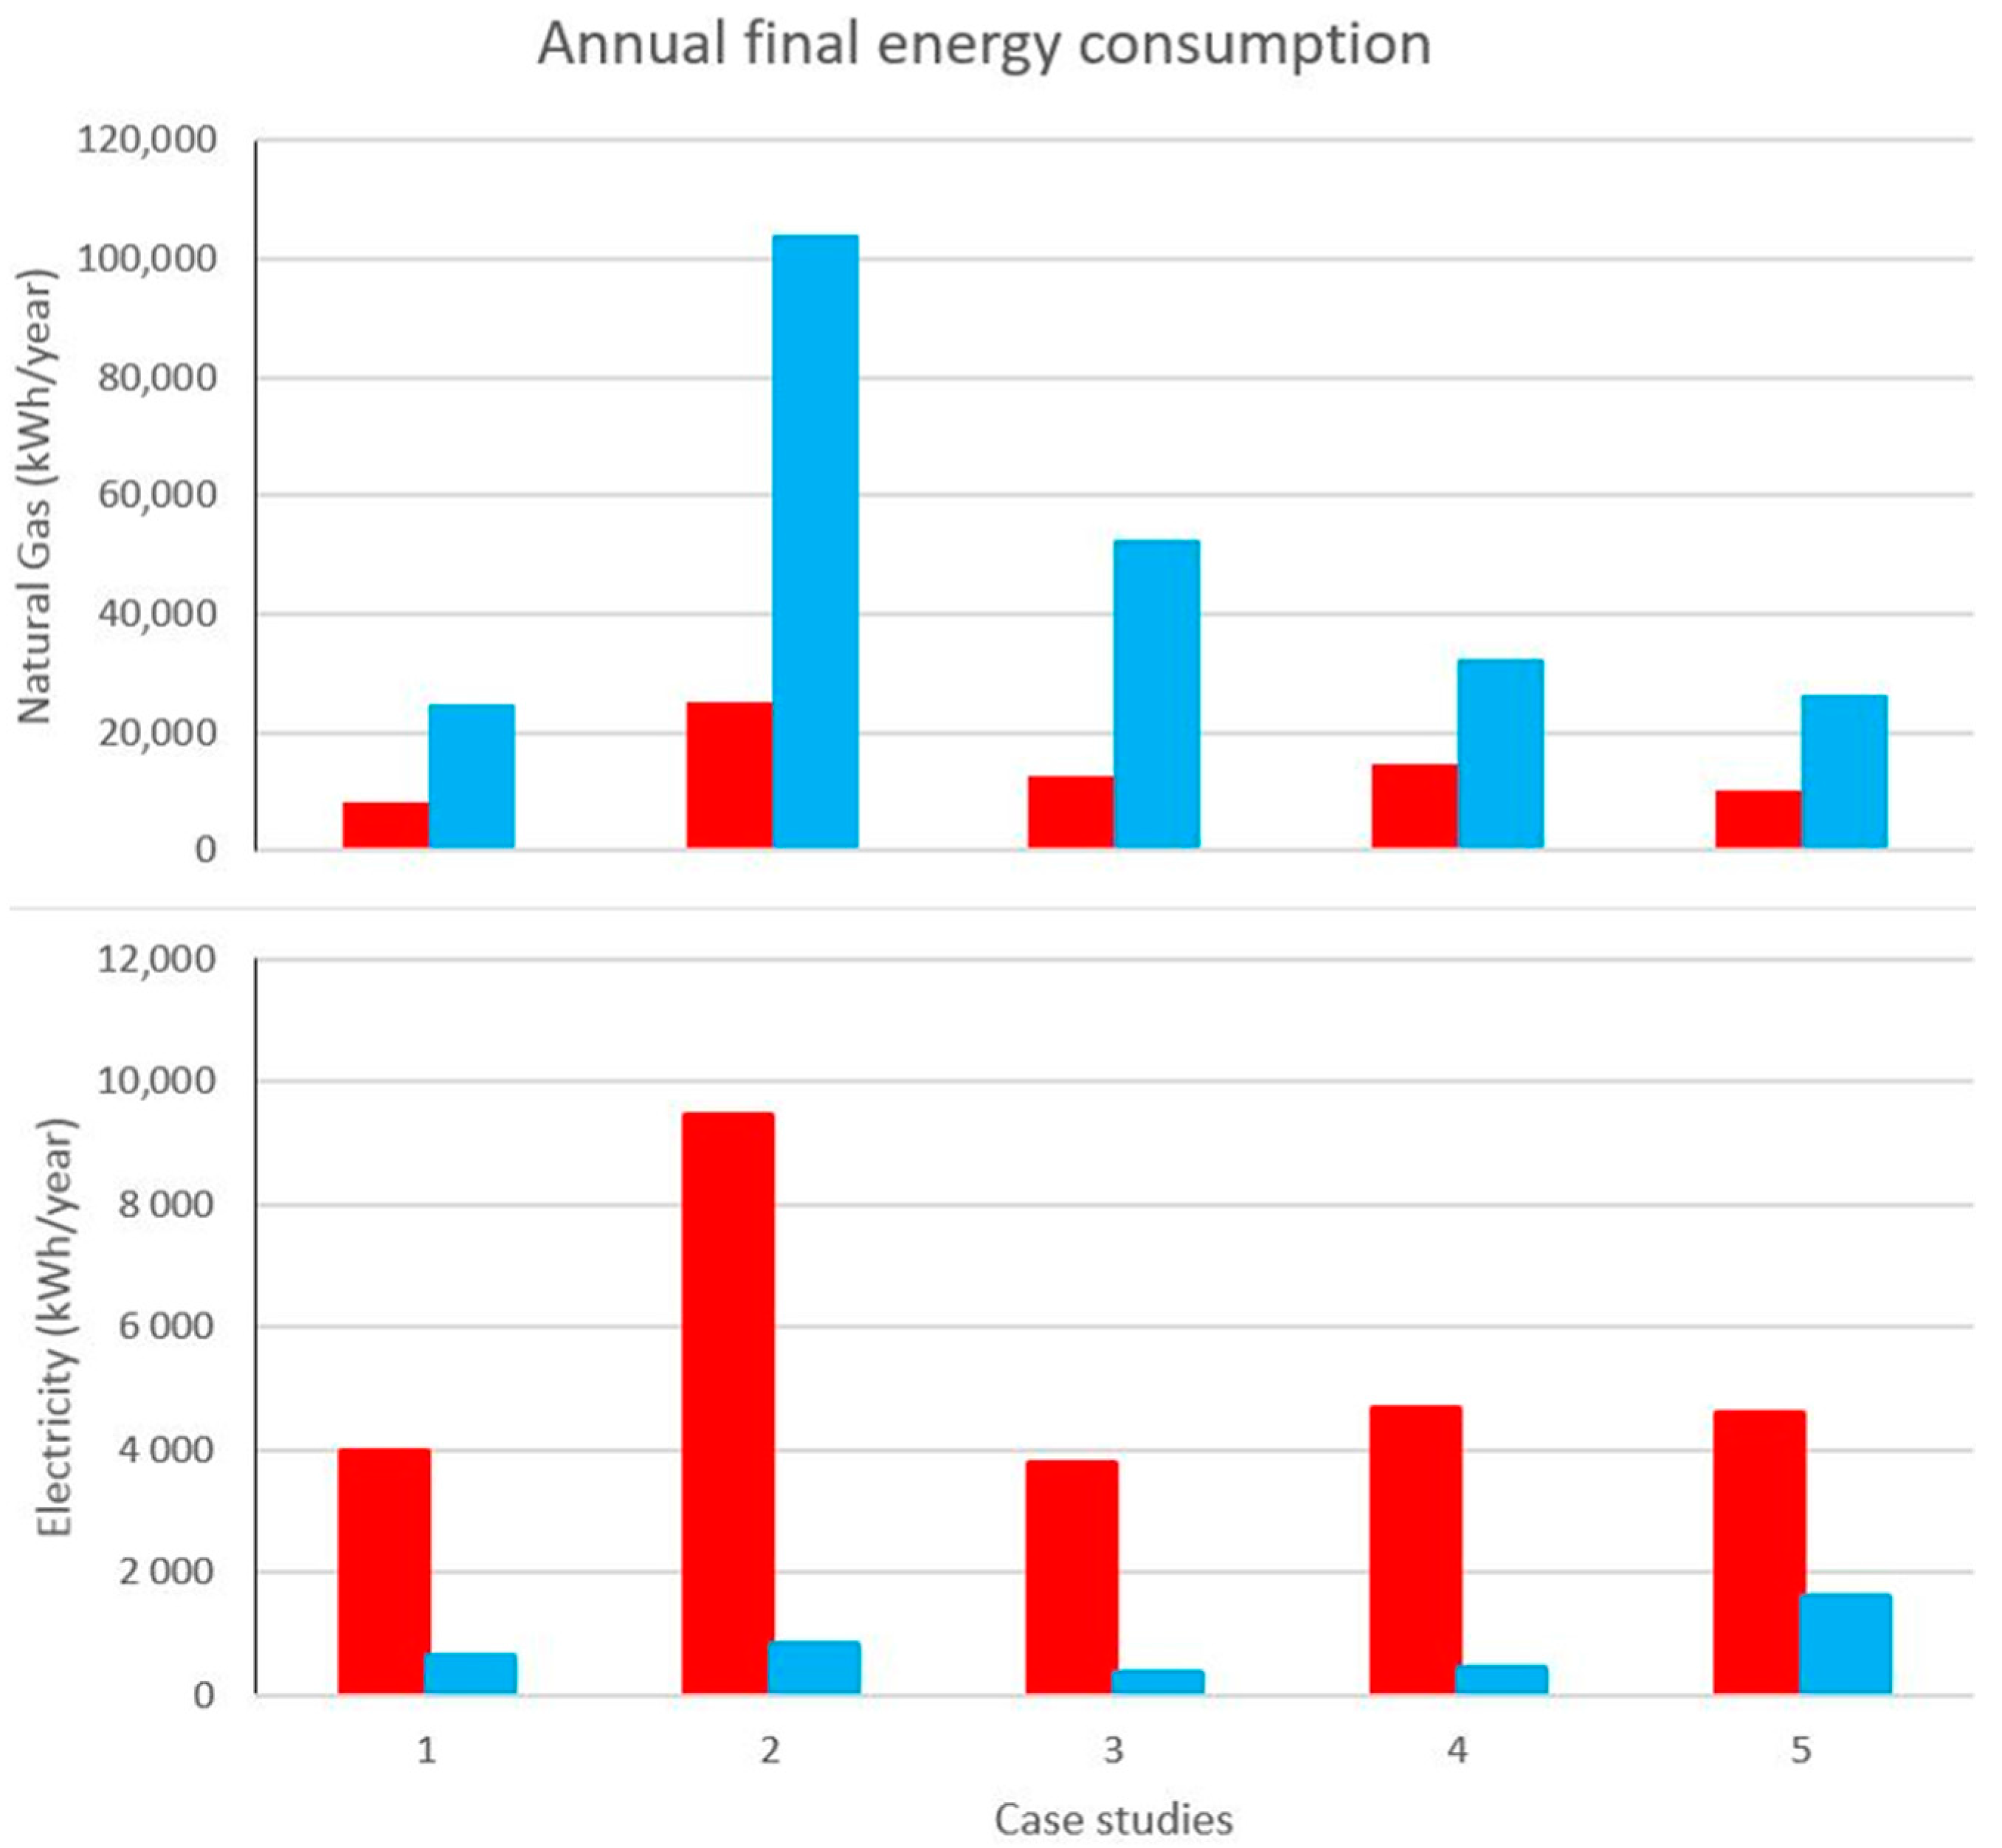
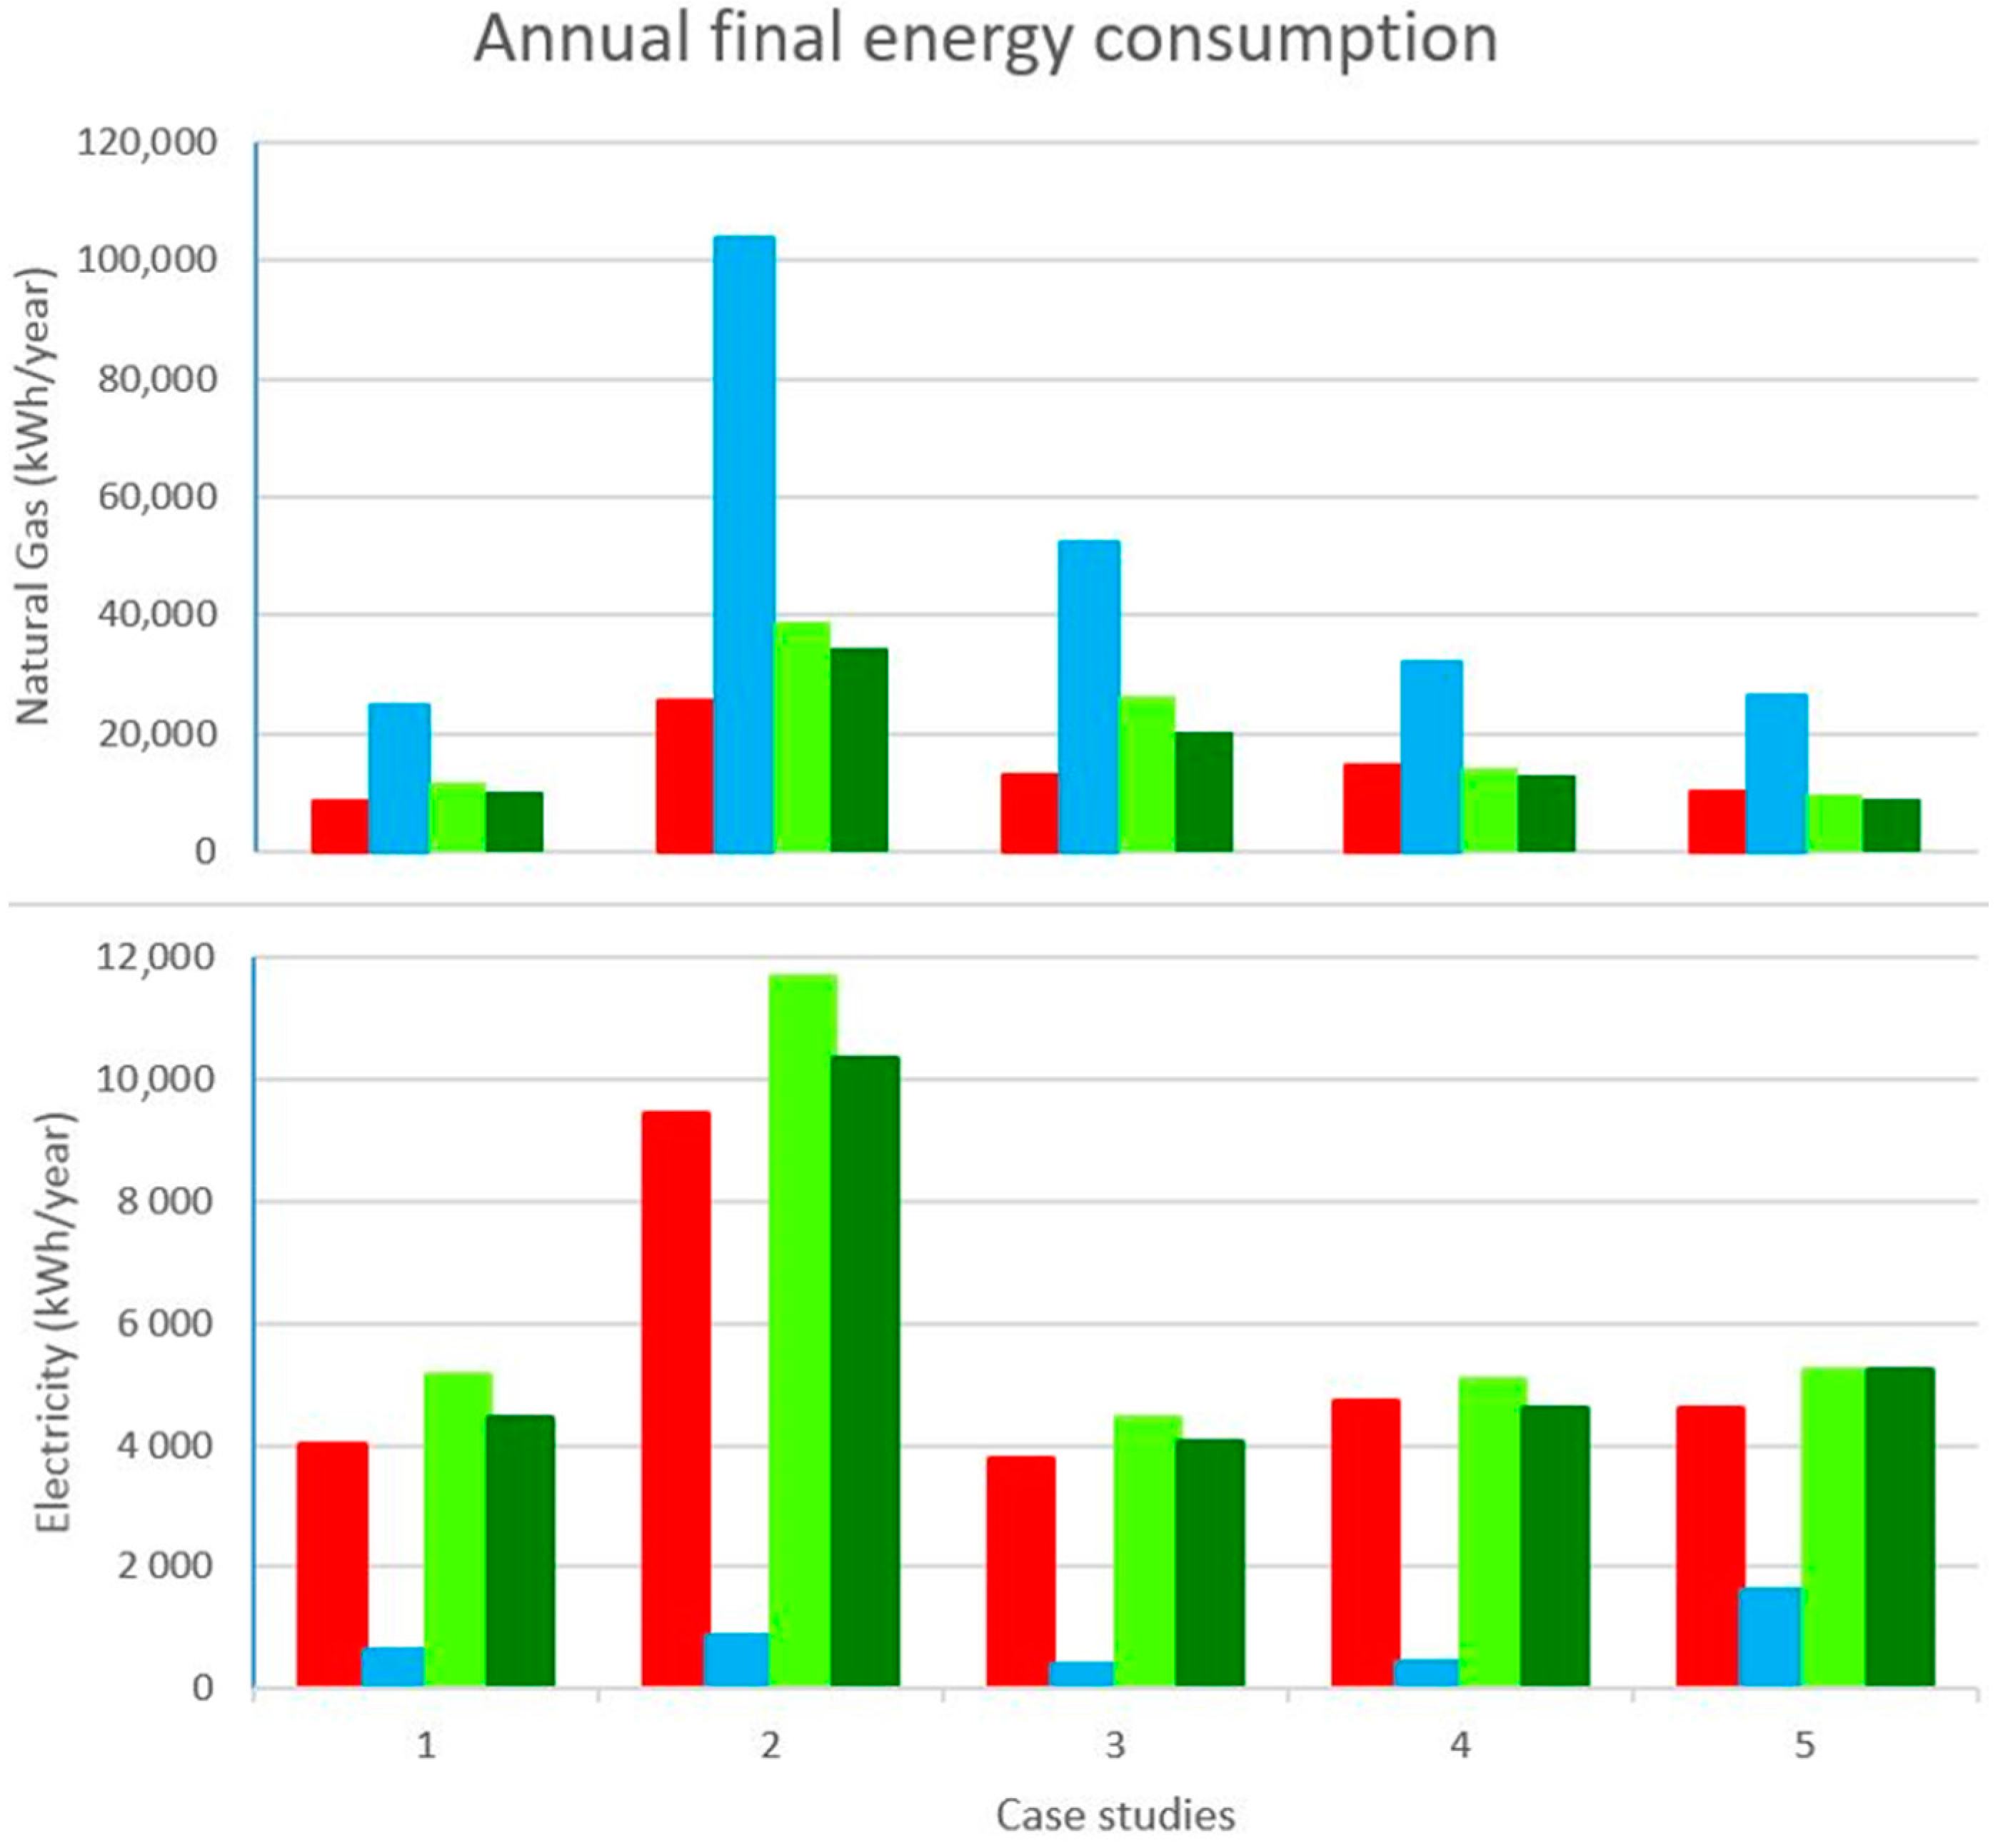
3. Results

Table 3 hereunder displays socio-demographic determinants gathered from respondents.
Table 4 displays answers respondents gave to the questions discussed above (white lines). It also presents the hypotheses behind their answers, as well as intermediary results in the revaluation of internal loads in the five dwellings. The new evaluation increases those by 20% to 40%.
The first part of Table 5 presents the heating schedule for a typical winter week, by a recalculation of heating hours and set temperatures, according to the calculation method described above. The second part presents ventilation habits: “occasional” ventilation indicates that respondents do not ventilate daily, only when discomfort occurs; “hood” is the extractor hood used when cooking; “timed” refers to the use of a temporized extractor, during bathroom use. The average ventilation rate those answers are translated into are given, as are the default ventilation rates obtained with the EPC regulatory calculation method for comparison. Interestingly, revaluated air flow is only 3.9% to 8% of the default values in old houses; in the newest house, equipped with a ventilation system (Case Study 1), this ratio is higher (16.4%).
The third part of Table 5 presents the hypotheses taken with regards to air-tightness.
The fourth part displays average set temperatures for heated spaces (obtained from data of the first part), hypotheses on temperature differences in unheated rooms and the average set temperature for the whole protected volume, evaluated with Equation (6).
Last part of Table 5 displays domestic hot water consumption profiles.
Table 6 shows revaluation results for NHDs and DHW demand, as well as the estimated electricity consumption for local heating of bathrooms and bedrooms (when applicable). Revaluated NHDs are in a [31.9%; 43.9%] range of those calculated by the regulatory calculation method, which means that the standardized hypothesis generates a final energy consumption that is (at least) 2 to 3 times superior to real energy consumption in those dwellings, inhabited by the same occupants.
Interestingly, DHW needs revaluation as it shows opposite results, and they are estimated 58.4% to 97% higher than in the regulatory method.
The estimated electricity consumptions for heating the bathroom is based on the assumption that a 2-kW electric heater is being used during bath time (depending thus on the number of inhabitants). The same is done in Case 2 for evaluating the needed heating of bedrooms (apart from the main one), considering 3 bedrooms to heat during 6 hours a day during winter days with a 2-kW electric heater each. This description is closer to reality during winter months than during mid-season; consumptions are corrected for warmer months using the distribution of NHD of the whole dwelling.
Table 7 and Figure 2 (see below) give final results for electricity and natural gas consumptions, comparing real data from respondents’ questionnaires and new evaluations that result from the modifications and additions described above. New results are displayed both for the EPB Belgian average climate and for the real climatic data (corresponding to the respondents’ data). For interpretation purposes, ratios are given, comparing EPC regulatory results and new evaluation results (both climates) with real consumption data.
It must be specified that electrical consumption results are not easily comparable between both methods:
  • Regulatory results include consumptions from ventilation and heating systems auxiliaries. As EPCs do not consider local mobile heating systems, there is no electrical heating considered in these assessments. Only Case 5 also includes electric DHW production, which explains its higher scores.
  • Revaluated results (for both climates) include electrical consumption for electr(on)ic equipment, lighting, auxiliaries, cooking, when indicated thus by the respondents, local heating (mostly bathrooms, but also “other” bedrooms in Case 2) and DHW production (Case 5).

4. Discussion

The discussion around those results must be done in light of the limitation stated in the dwelling description. Use of a small sample implies that occupants must not be considered as “average”. In these cases, households’ incomes and employment rate are quite high (only one ‘stay-at-home’ parent in Case 3), and their age categories are relatively low. Three respondents out of five were female (two of them are architects), all with university degrees.
It is undeniable that the methodology proposed here allows one to partially close the gap between theoretical and real consumptions: margins decrease from [221.9%; 410.5%] to [89.4%; 157.7%] by only the introduction of behavioral parameters in the EPC steady-state calculation method. Results differ between case studies, however, as Cases 1, 4 and 5 present revaluation results that are much closer to real consumption data. Cases 2 and 3 present important parameters that could explain their higher remaining gap:
  • Higher average thermal transmission coefficients (Um; see Table 1) and total heat loss by transmission coefficient (HT,heat; see Table 1). There are several levels of precision in available engineering estimates for envelope description: the thermal conductivity of all (identified) materials is imposed by default values. The very existence of the insulation layer can be unknown, which leads to the lowest level of certainty on envelope description; the thermal resistance of this hypothetical layer is therefore given a default value based on the age of the wall’s construction or renovation. When the existence of this layer is acceptably proven, its thermal resistance can still present different values, when its thickness and/or the type of insulation material is described, or when the thermal resistance of the layer is given by trustworthy proofs. Higher Um and HT,heat values could witness greater imprecision in input data.
  • Lower DHW systems’ efficiencies. This is interesting, because the intermediary results (Table 5) clearly show that revaluated DHW demands are quite higher than the demands from the EPC intermediary results, which is quite surprising considering the opposite tendency in the estimation of heating demands. With higher DHW demands, therefore, detrimental DHW system efficiencies’ default values exercise higher influence on the final energy consumption. It all happens as though the regulatory method compensates underestimated DHW demands by even more underestimated system efficiencies.
    Major obstacles to a more refined evaluation are: (1) the real data from inhabitants, indivisible between cold and hot water consumptions; (2) the determination of efficiency values closer to reality by the assessor; and (3) the difficulty to estimate real DHW demands, based on inconstant DHW use behavior (from the interviews, Case 5: “It depends when [my daughter] is here or at her mother’s”; Case 3: “I do not bathe every day, sometimes I just rinse myself, sometimes I draw long and bubbly baths…” or Case 1: “we used to shower, but the kid arrived mid-year, and now baths are more common”). It must be admitted that inconstant behavior would normally also be witnessed in heating habits or use of appliances; these different reactions to DHW use might hide some privacy issues on the respondents’ side (for example, the healthiness interpretation of data).
Particular information on those Cases 2 and 3 could further explain the remaining discrepancies:
  • Case 2 is the biggest of the five studied houses (higher protected volume, five occupants) and presents several additions to the original volume that were initially uninsulated (roofs have been insulated thereafter). The upper level was not inhabited nor inhabitable during the period covered by the consumption data and separated from the protected volume by a simple wooden door and uninsulated walls and ceiling. All of this could explain the high total heat loss by transmission coefficient (HT,heat = 951.2 W/K), around 3.2-times the coefficient of the Case 4 house, which shares the same typology category, but is located in a row.
    The very important heat losses area (slightly less than 600 m2, more than twice the heat losses areas from every other cases) increases significantly the heat losses by (lack of) air tightness, which obliges us to acknowledge that this parameter is still influential in this method (and there are no real ways to refine it during an EPC assessment). Lastly, this house is equipped with PV panels, which were not considered in this study, as it focuses on consumptions rather than productions. Nevertheless, this encourages the owners to prefer local mobile electric systems to heat their children’s bedrooms and use central heating as an eventual additional system. Such particular behaviors are difficult to model in a steady-state, single-volume method.
  • During the interview of Case 3, several things had been noted by the interviewer: first, the particular configuration of the house, in a sloping street, with the garden at the first-floor level (the ground floor being partially buried, a significant part of the heat loss area is protected from severe air leakages); secondly, the presence of humidity (and mold smell) in the kitchen and cigarette smoke in the living room seem to confirm the low ventilation rate revaluation. This case being the only one with a ‘stay-at-home’ parent, conscious and unconscious variations in heating habits, uncovered by this study or non-verbalized by respondents, could have an important influence on the results that do not appear here. This is probably a limitation of this exercise.
If results for Cases 1, 2 and 3 are still above the real consumption data, the same cannot be said for Cases 4 and 5:
  • Case 4 is probably the more “precise” EPC to begin with, with little default values to be replaced (the ones still used are not alterable). Both electricity and natural consumptions (obtained with the modified method using “real climate” data) are fairly close to the real consumption data.
  • Case 5 is more questionable. The addition of electricity and natural gas consumptions, obtained with the modified method under the “real climate” data, is quite close to the addition of real consumptions data from respondents. In detail, however, the electricity consumption is about 600 kWh above reality, and natural gas is about 1000 kWh under reality. This case being the only one where DHW is produced with electricity, instead of natural gas, the discussion above on DHW results could explain the discrepancy in electricity consumptions, but not natural gas consumptions. Three important characteristics of the household could bring some explanation. Firstly, the income is relatively high for this type of house, which generally shelters more precarious households. Generally, higher incomes influences higher energy consumptions [17,22,24,26,36]. Secondly, this house is a temporary home; it is owned by the occupants, but they are currently renovating what will become their permanent home. This implies inconstant occupancy and a feeling of “not really home” that could be comparable to tenants’ attitudes and representations (generally less careful about energy consumption [22,23,24,25]). Lastly, the owners confessed: “The one who feels coldest, wins. Will turn the valve to its maximum. That’s the problem when you live with a lizard.” Humor aside, this implies that thermal comfort requires higher temperatures, the management of which is probably inconstant (and the lack of a regulation system reinforces this feeling).
Case 1 is the house built recently in 2007, but the search for “accepted proofs” was not particularly more prolific: plans were accessible that could be used for several inputs (presence and thickness of insulation layers, presence of an air cavity, thickness of the wall), but did not mention insulation type precisely, nor thermal resistances. Lack of any official technical data sheets for system efficiencies imposed resorting to disadvantageous default values (which is anyway always the case for DHW production). This shows the limitations of a rigid assessment method (with a short and exhaustive list of acceptable proofs): even recent houses show inaccuracy of input data and gaps in results that are comparable to old houses. Perhaps a more elaborate matrix of default values, which constantly refer to the age of the building and its typology, could be an easy way to bring some refinement in the assessment.
Lastly, it is quite obvious that multi-zone dynamic calculations would probably render more precise (and closer) results than the adaptation of a steady-state single-zone calculation method. However, this study, in order to evaluate the potential of the existing protocol and assessment method, is based on the existing steady-state regulatory calculation method.
As the refinement of calculation parameters progresses, the influence of the remaining pool of unknown (or default) parameters increases, so that it is difficult to assess the accuracy of the proposed method without an indicator that would enlighten the level of (un)certainty that surrounds the input data. This indicator could, for example, be based on an accuracy level on the envelope description regarding its (non-)insulation and air-tightness and on systems’ efficiencies, but this would necessitate comparing the hypotheses with real Um, HT,heat and v50,heat values (which are obviously unknown) and efficiencies (data that could probably be easier to obtain, with the help of heating system assessors and maintenance services). We therefore hit again the well-known major obstacle to existing buildings’ energy performance assessment accuracy: lack of accurate data, necessity to investigate further, difficulty finding the balance between necessary parameters, precision possibilities and the time and cost required to make a full assessment.
It is therefore interesting to wonder where to stop in this process of detailing/questioning the behavioral habits of a household’s energy consumption. As every parameter of the method could be questioned, every parameter of a household’s representations, attitudes and behaviors could be studied. There are, however, limitations to this exercise:
  • This study has as the ultimate motive to try and predict the energy consumption of a household in a house that they do not (yet) live in. The prediction of energy bills is, by essence, uncertain. The uncertainty on future climate obviously influences the results, and the average EPB Belgian climate could be as good as any in a predictive model. There is a gap, in the results above, between revaluation results obtained using the EPB average climate on the one hand or the “real” climate data on the other; that gap is part of a permanent uncertainty margin that has to be considered in the analysis of the results (and the study of annual climatic variations could result in wider margins).
  • Exact correspondence between theoretical and real consumption data is limited by the high number of uncertainty parameters in the method to control, particularities and special occasions in energy consumption. Furthermore, the respondents to the survey cannot or will not always give the needed information, as some are subconscious, others considered private by those who have a more emotional link to energy or a more secretive approach to their life at home.
  • The questionnaire media in itself is a limitation: the attention, interest and understanding of the respondent is important for the reliability of his/her answers, so that the number of questions should be controlled. Therefore, the number of added parameters will be restrained. Interviews allowed detecting unmentioned behaviors and improving the progressing questionnaire. There was, however, no psychological side to this study, while it must be acknowledged that this is also a crucial way to understand consumption behavior or attitude/behavior gaps [11,17,36].
  • Lastly, one must acknowledge that this questionnaire somehow replaces default values by others, some of which are chosen empirically (see above). Perhaps more precisely, default values have been multiplied, in the belief that a sum of little uncertainties on more accurate default values would be less damaging to the final results than one big uncertainty on one default value. A sensitivity analysis will follow to validate them.

5. Conclusions

It is difficult to draw general conclusions on a small sample of case studies. These results, however, allow some interesting deductions:
-
The steady-state calculation method, as it is implemented in Wallonia, is probably accurate enough to allow final energy consumption predictions, if improved on several behavioral parameters.
-
The additional data gathered with the questionnaire is already quite extensive and requires about an hour of interview with respondents (around half of it for the data needed in this study; the rest of the interview was used to explore the households’ understandings and views on the certification scheme, their real-estate investments decisions and obstacles and incentives for their renovation decisions). The number of questions has to be limited to ensure sufficient understanding and attention of respondents, as well as the reliability in their answers.
-
An indication on the level of accuracy of input data (envelope and systems’ descriptions) is strongly needed to analyze these results, but requires more thorough monitoring and investigations on the building, which would completely change the certification protocol, the time needed for full assessment and perhaps the financial profitability of the “job”.
-
There could be further study on the existing Walloon dwelling stock in order to refine the regulatory calculation method on envelope description. The introduction of typologies in addition to the age of the building, for example, could lead to a matrix of more accurate default values, to replace the actual list of values that characterize the whole building stock.
-
A sensitivity analysis on the accuracy of behavioral parameters that are input is needed as a further step in this study; there are still several (some of them empirical) parameters that influence the final result that are still to be analyzed and validated.
As one of the respondent said, “The EPC is useless for old houses, it has been designed to promote new and efficient houses. It is not subtle enough to differentiate two old houses. They will both be at the bottom of the scale, and let us face it, the scale level is the only thing people understand”.
In order to reach energy efficiency at any level, we have to acknowledge the importance of the human factor. On the one hand, efficient solutions (regarding, for example, building energy consumptions) have to be implemented by an authority who understands the complexity of the urban context and its impacts on the environment; on the other hand, it is important to improve citizens’ awareness of their environmental impact and to lead them to using available solutions to their full potential. In the field of residential use of energy, people are therefore a crucial parameter of both the problem and its solution.
A clear example of this is given by this study. The EPC has been designed by authorities to “provide clear information about the energy performance of a building”, in order to influence the real-estate market, energy performance improvements and help build up comprehensive benchmarking databases, fundamental for shaping strategies on a local or regional level. However, as the EPC is often too distant from reality, end-users lack the appropriate information. The general picture shows a great opportunity remaining underexploited, a potential driver to reducing energy consumption and CO2 emissions, surrounded by barriers and obstacles that render its use all the more difficult.
We appreciate the necessity of presenting a “legal” result as a comparison base, following the approved standardized calculation method. It is believed that complementary results could be displayed, closing the gap between real and theoretical consumptions, allowing future owners to better understand and appreciate the EPC results and foresee a rough monthly energy bill. This study therefore questions the uncertainty parameters and proposes a modified calculation, based on the existing inputs, protocol and method of the EPC, to allow better decision making strategies for households, as far as their real-estate ambitions are concerned.

Acknowledgments

Thanks and acknowledgements have to be given to the European Cooperation in Science and Technology (COST) frame, for the possibility to share information, skills and knowledge on Smart Energy Regions.

Author Contributions

Stéphane Monfils conceived of, designed and performed the experiments, analyzed the data and wrote the paper. Jean-Marie Hauglustaine realized the study behind Figure 1 and ensured scientific supervision.

Conflicts of Interest

The authors declare no conflict of interest.

References

  1. ICEDD ASBL. 2011 Energy Assessment of Wallonia; ICEDD asbl for the Public Service of Wallonia: Namur, Belgium, 2012; p. 80. [Google Scholar]
  2. International Energy Agency Website—Belgium Page. Available online: https://www.iea.org/countries/membercountries/belgium/ (accessed on 19 September 2016).
  3. Eurostat Website. Available online: http://ec.europa.eu/eurostat/web/energy/data/energy-balances (accessed on 19 September 2016).
  4. Intergovernmental Panel on Climate Change (IPCC). Climate Change 2007: Synthesis Report; Core Writing Team, Pachauri, R.K., Reisinger, A., Eds.; IPCC: Geneva, Switzerland, 2007; p. 104. [Google Scholar]
  5. Housing Division, DGATLP, Ministry of the Walloon Region. Enquête sur la Qualité de L'habitat en Région Wallonne 2006–2007; Walloon Region: Namur, Belgium, 2007. [Google Scholar]
  6. European Parliament and Council. Directive 2002/91/CE Approved the 16th of December 2002, about Energy Performance of Buildings. 2002. Available online: http://eur-lex.europa.eu/eli/dir/2002/91/oj (accessed on 9 November 2016).
  7. Laine, L. As Easy as EPC? Consumer Views on the Content and Format of the Energy Performance Certificate; Consumer Focus: London, UK, 2011. [Google Scholar]
  8. O’Sullivan, A. Urban Economics; McGraw-Hill: Boston, MA, USA; London, UK, 2007. [Google Scholar]
  9. Amecke, H. The Impact of Energy Performance Certificate: A Survey of German Home Owners. Energy Policy 2012, 46, 4–14. [Google Scholar] [CrossRef]
  10. Rogoff, B. Observing sociocultural activities on three planes: Participatory appropriation, guided appropriation and apprenticeship. In Sociocultural Studies of the Mind; Wertsch, J.V., Del Rio, P., Alverez, A., Eds.; Cambridge University Press: Cambridge, UK, 1995; pp. 139–164. [Google Scholar]
  11. Billett, S.R. Situation, social systems and learning. J. Educ. Work 1998, 11, 255–274. [Google Scholar] [CrossRef]
  12. Serfaty-Garzon, P. L’Appropriation. In Dictionnaire Critique de L’habitat et du Logement; Segaud, M., Brun, J., Driant, J.-C., Eds.; Editions Armand Colin: Paris, France, 2003; pp. 27–30. [Google Scholar]
  13. Guy, S.; Shove, E. The Sociology of Energy, Buildings and the Environment: Constructing Knowledge, Designing Practice (Routledge Research Global Environmental Change Series, 5); Routledge: London, UK, 2000; p. 164. [Google Scholar]
  14. Public Service of Wallonia. Arrêté du Gouvernement Wallon du 30 Juillet 2014 Portant Exécution du Décret du 28 Novembre 2013 Relatif à la Performance Énergétique des Bâtiments; Belgian Monitor: Namur, Belgium, 2014; pp. 56172–56294. [Google Scholar]
  15. Public Service of Wallonia. Annexe D: Méthode de Détermination de la Consommation Spécifique des Bâtiments Résidentiels dans le Cadre de la Certification PEB; Belgian Monitor: Namur, Belgium, 2014; pp. 61636–61767. [Google Scholar]
  16. EPBD—Concerted Action. Implementing the Energy Performance of Buildings Directive 2010 (EPBD), Featuring Country Reports; EU Publications Office: Brussels, Belgium, 2011. [Google Scholar]
  17. Fanger, P.O. Human Comfort and Energy Consumption in Residential Buildings. In Proceedings of the International Energy Use Management Conference, Tucson, AZ, USA, 24–28 October 1977.
  18. Hauglustaine, J.-M. Incidences du Comportement Humain sur la Consommation D’énergie dans les Habitations Sociales. Master’s Thesis, University of Liege, Liege, Belgium, 1979. [Google Scholar]
  19. Lutzenheiser, L. Social and behavioral aspects of energy use. Annu. Rev. Energy Environ. 1993, 18, 247–289. [Google Scholar] [CrossRef]
  20. Wilhite, H.; Nakagami, H.; Masuda, T.; Yamaga, Y.; Haneda, H. A cross-cultural analysis of household energy-use behaviour in Japan and Norway. Energy Policy 1996, 24, 795–803. [Google Scholar] [CrossRef]
  21. Wilhite, H.; Lutzenhiser, L. Social loading and sustainable consumption. Adv. Consum. Res. 1998, 26, 281–287. [Google Scholar]
  22. Wilhite, H.; Shove, E.; Lutzenhiser, L.; Kempton, W. The legacy of twenty years of energy demand management: We know more about individual behaviour but next to nothing about demand. In Society, Behaviour, and Climate Change Mitigation; Jochem, E., Sathaye, J., Bouille, D., Eds.; Springer: Dordrecht, The Netherlands, 2000; pp. 109–126. [Google Scholar]
  23. Lindén, A.L.; Carlsson-Kanyama, A.; Eriksson, B. Efficient and inefficient aspects of residential energy behaviour: What are the policy instruments for change? Energy Policy 2005, 34, 1918–1927. [Google Scholar] [CrossRef]
  24. Wallenborn, G.; Rousseau, C.; Thollier, K.; Aupaix, H. Politique d’Appui Scientifique à une Politique de Développement Durable PADDII: Détermination de Profils de Ménages Pour une Utilisation Plus Rationnelle de L’énergie, Partie 1: Modes de Production et de Consommation Durables; Federal Scientific Policy: Brussels, Belgium, 2006; p. 106. [Google Scholar]
  25. De Groot, E.; Spiekman, M.; Opstelten, I. Dutch research into user behaviour in relation to energy use of residence. In Proceedings of the PLEA 2008—25th Conference on Passive and Low Energy Architecture, Dublin, Ireland, 22–24 October 2008.
  26. Santin, O.G. Actual Energy Consumption in Dwellings, the Effect of Energy Performance Regulations and Occupant Behavior; Sustainable Areas Series; TU Delft: Delft, The Netherlands, 2010; p. 242. [Google Scholar]
  27. Allibe, B. Modélisation des Consommations D’énergie du Secteur Résidentiel Français à Long Terme, Amélioration du Réalisme Comportemental et Scenarios Volontaristes. Ph.D. Thesis, Ecole des Hautes Etudes en Sciences Sociales, Paris, France, 2012. [Google Scholar]
  28. Hens, H.; Parijs, W.; Deurinck, M. Energy consumption for heating and rebound effects. Energy Build. 2010, 42, 105–110. [Google Scholar] [CrossRef]
  29. Vanparys, R.; Niclaes, E.; Lesage, O. Certificat Énergie, la Base d’un Véritable Audit? Association des Consommateurs Test-Achats SCRL: Brussels, Belgium, 2012; pp. 10–16. [Google Scholar]
  30. Monfils, S.; Hauglustaine, J.-M. Etude Énergétique—Typologique du parc Résidentiel Wallon en Vue D’en Dégager des Pistes de Rénovation Prioritaires, Rapport Final; University of Liege: Liege, Belgium, 2009; p. 73. [Google Scholar]
  31. Gram-Hanssen, K. Residential heat comfort practices: understanding users. Build. Res. Inf. 2010, 38, 175–186. [Google Scholar] [CrossRef]
  32. Official Website of the Walloon Commission for Energy. Available online: http://www.cwape.be/ (accessed on 26 September 2016).
  33. Website of the Belgian Association for the Promotion of Renewable Energies. Available online: http://www.apere.org (accessed on 26 September 2016).
  34. Official National Weather Forecast and Database Website. Available online: http://www.meteobelgique.be/ (accessed on 15 June 2016).
  35. Davin, E.; André, P. Rapport Smart Micro Cogen WP2: Identification des Profils Caractéristiques de Consommations (Chauffage, Consommations Électriques) dans les Bâtiments; University of Liege: Arlon, Belgium, 2014; p. 25. [Google Scholar]
  36. Brisepierre, G. Analyse Sociologique de la Consommation D’énergie dans les Bâtiments Résidentiels et Tertiaires: Bilan et Perspectives; ADEME: Paris, France, 2013; p. 51. [Google Scholar]
Figure 1. Comparison of the energy consumption data for 5 case studies: natural gas (first graph) and electricity (second graph). In red: real data given by respondents; in blue: EPC regulatory results. Numerical values can be found in Table 2.
Sustainability 08 01205 g001
Figure 2. Comparison of annual final energy consumption data for the 5 case studies: natural gas (first graph) and electricity (second graph). In red: real data given by respondents; in blue: EPC regulatory results; in green: revaluation of final energy consumptions (light green for the EPB average climate, darker for the “real” climatic data). Numerical values can be found in Table 7.
Sustainability 08 01205 g002
Table 1. Dwelling description.
Case Study12345
Photo Sustainability 08 01205 i001 Sustainability 08 01205 i002 Sustainability 08 01205 i003 Sustainability 08 01205 i004 Sustainability 08 01205 i005
Building period (-)2007[1946–1960][1919–1945][1946–1960][1919–1945]
TypologyFirst floorUrb. extensionModestUrb. extensionBlue-collar
Vp (protected volume) (m3)487841.8443.2505.5323.1
Heated Floor Area (m2)160.7254.9138.1162.6101.3
AT (Total heat loss area) (m2)228.2598.9225.5257.2179.4
Average U-value (W/m2·K)0.791.591.761.161.21
HT,heat (W/K)180.6951.2397.1297.6217.4
Heating system efficiency (EPC) (-)0.6700.6930.6010.7740.626
DHW system efficiency (EPC) (-)0.5100.3830.3320.4880.712
Number of exterior facades (-)23222
Presence of an extension?NoYesYesNoYes
Use of the upper floor?BedroomsAttic (off Vp)BedroomsStorage (in Vp)Storage (in Vp)
Kitchen open on living room?YesYesNoYesYes
“First floor” refers to a house in which the day-living floor is located above the ground; “Urb. extension” refers to a larger typology of the brick house, built on larger parcels of urban extensions after WWII; “blue collar” houses are generally small and of poor quality, built in rows for blue-collar workers during the development of industry; a “modest” house is a slightly bigger and better version of the “blue collar” house, built for slightly wealthier owners.
Table 2. Annual final energy (electricity and natural gas) consumptions: real consumption data from respondents and consumption as evaluated by the EPC regulatory calculation method.
Case Study12345
Photo Sustainability 08 01205 i006 Sustainability 08 01205 i007 Sustainability 08 01205 i008 Sustainability 08 01205 i009 Sustainability 08 01205 i010
Annual electricity consumption (kWh/year)
(1) Real data (respondent’s)39899436377446914609
(2) EPC regulatory calculation6148413774301599
 (2)/(1) (%)15.4%8.9%10.0%9.2%34.7%
Annual final energy consumption for heating and DHW, excluding electricity (kWh/year)
(3) Real data (respondent’s)830025,29712,74314,49310,091
(4) EPC regulatory calculation24,806103,78052,30432,16326,390
 (4)/(3) (%)298.9%410.2%410.5%221.9%261.5%
Table 3. Description of the households.
Case Study12345
Photo Sustainability 08 01205 i011 Sustainability 08 01205 i012 Sustainability 08 01205 i013 Sustainability 08 01205 i014 Sustainability 08 01205 i015
Number of inhabitants (-)45443
Presence of toddlers?YesNoYesYesNo
Presence of children between 3 and 15?NoYes (3)Yes (2)Yes (2)Yes (1, half-time)
Presence of elderly?NoNoNoNoNo
Monthly total income category[2000; 2999][4000; 4999][2000; 2999][4000; 4999][4000; 4999]
Respondent genderFFMFM
Respondent age category[25; 34][35; 44][25; 34][25; 34][35; 44]
Respondent highest diplomaUniversityUniversitySup non univ.UniversitySup non univ.
Respondent daily occupationIndependentExecutiveEmployedExecutiveEmployed
Table 4. Internal gains recalculation: questionnaire data (white) and intermediary results (grey).
Case Study12345
Photo Sustainability 08 01205 i016 Sustainability 08 01205 i017 Sustainability 08 01205 i018 Sustainability 08 01205 i019 Sustainability 08 01205 i020
Metabolism loads due to occupation (Qmet,a) (kWh/year)26263158232125211857
Equipment levelImportantImportantAverageAverageAverage
Switch off appliances instead of sleep mode?+++/−+/−+/−
 Estimated sleep mode annual consumption (kWh/year)135150160160140
Equipment electricity consumption (Qequip,a) (kWh/year)30884088305532392091
Switch off the lights in unoccupied spaces?+/-+++++
 Area-reducing factor (fL) (-)0.70.60.50.60.6
Do you use low-energy bulbs?+/-++++++
 Lighting power (PL) (W/m²)65544
Natural lighting quality in day zone?+++-+/--
 Quality factor (fqual,L) (-)0.811.41.21.4
Lighting electricity consumption (Qlight,a) (kWh/year)562795503487354
Energy vector for cooking (hobs)?ElectricityElectricityElectricityElectricityElectricity
Cooking electricity consumption (Qcook,a) (kWh/year)420420490420280
Total annual internal gains (Qi,a) (kWh/year)
 From EPC regulatory method4785.56869.14527.34897.03823.0
 Revaluation from behavior66968461636966674582
 Revaluation / EPC (%)139.9%123.2%140.7%136.1%119.9%
Table 5. Heating habits: questionnaire data (white) and intermediary results (grey).
Case Study12345
Photo Sustainability 08 01205 i021 Sustainability 08 01205 i022 Sustainability 08 01205 i023 Sustainability 08 01205 i024 Sustainability 08 01205 i025
Out of the 7 days of a normal (work or school) winter week, how many all-day heating of…
… the whole home (day AND night zones)?02220
… the day-time zone only?50505
On “other” days (not “all-day” heating days), on average, how many hours do you heat…
 … the living room (LR)?48084
 … the kitchen (K)?481084
 … the main bedroom (MBDR)?00000
 … the other bedrooms (OBDR)?06660
 … the bathroom (BTR)?22.5261.25
Spaces heated during winter nights?LR, K, OBDRLR, KLROBDRLR, K
% of winter time without heating?11.9%17.9%8.3%17.9%20.2%
Temperature regulation device?YesYesYesYesNo
Set temperatures during day-time in…
 … the living room (LR)?2121222124
 … the kitchen (K)?2121222124
 … the bedroom(s) (BDR)?-212021-
 … the bathroom(s) (BTR)?2121222124
Set temperature during night time?1816181616
Do you close doors separating heated and unheated spaces?+/−++++++++
Ventilation of the living-room (LR)?occasionaloccasionaloccasionalnodaily
Ventilation of the kitchen (K)?hoodoccas. + hooddailydaily + hoodno
Ventilation of the bedrooms (BDR)?dailydailydailyoccasionaldaily
Ventilation of the bathroom (BTR)?timedoccasionaloccasionaldailytimed
Average ventilation rates (m3/h)
 From EPC regulatory method284.8369.8269.9289.6223.9
 Revaluation from behavior46.628.9510.623.112.6
 Revaluation/EPC (%)16.4%7.8%3.9%8.0%5.6%
Do you weather-strip the doors and windows in winter?+++++/-+
 air-flow reducing factor fv50 (-)0.80.850.850.90.85
 Empirical ΔT (ΔTuhs × fUm)2.37 °C6.35 °C7.04 °C4.63 °C4.85 °C
Heating periods: average set temperature of heated zones?19.58 °C18.46°C20.55 °C18.46 °C19.49 °C
Heating periods: estimated average temperature of the whole building?17.99 °C15.5 °C15.5 °C14.57 °C15.94 °C
How many baths/showers a week?7/1410/207/710/104/14
Tendency to prefer showers?+/-+/--+/-+
 Consumption levelAverageRather heavyRather lightRather heavyRather heavy
Table 6. Intermediary results: Net Heat Demand (NHD), Domestic Hot Water (DHW) and local electricity consumptions (bathrrom, bedrooms).
Case Study12345
Photo Sustainability 08 01205 i026 Sustainability 08 01205 i027 Sustainability 08 01205 i028 Sustainability 08 01205 i029 Sustainability 08 01205 i030
Annual Net Heat Demand (Qheat,net,a) (kWh/year)
(1) From EPC regulatory method14,817.267,652.428,843.422,574.217,600.8
(2) Revaluation-EPB climate5430.429,708.611,734.37191.87385.6
 (2)/(1) (%)36.6%43.9%40.7%31.9%42.0%
Annual DHW net demand (Qwater,net,a) (kWh/year)
(3) From EPC regulatory method1411.52266.71305.51457.21016.4
(4) Revaluation from behavior2552.23589.42233.62870.81794.4
 (4)/(3) (%)180.8%158.4%171.1%197.0%176.5%
Bathroom heated by electricity?YesYesNoYesYes
Estimated annual electricity consumption for (local) bathroom heating (kWh/year)
 EPB climate465.9629.9-486.1321.1
 Real climate347598-447300
Bedrooms heated by electricity?NoYes (children)NoNoNo
Estimated annual electricity consumption for (local) bedrooms heating (kWh/year)
 EPB climate-4909---
 Real climate-4448---
Table 7. Annual final energy (electricity and natural gas) consumptions, evaluated by the EPC regulatory calculation method (white) and the modified method (grey).
Case Study12345
Photo Sustainability 08 01205 i031 Sustainability 08 01205 i032 Sustainability 08 01205 i033 Sustainability 08 01205 i034 Sustainability 08 01205 i035
Annual electricity consumption (kWh/year)
(1) Real data (respondent’s)39899436377446914609
(2) EPC regulatory calculation6148413774301599
(3) Revaluation-EPB climate515011,683442550625239
(4) Revaluation-real climate441710,349404845935218
 (2)/(1) (%)15.4%8.9%10.0%9.2%34.7%
 (3)/(1) (%)129.1%123.8%117.2%107.9%113.7%
 (4)/(1) (%)110.7%109.7%107.3%97.9%113.2%
Annual final energy consumption for heating and DHW, excluding electricity (kWh/year)
(5) Real data (respondent’s)830025,29712,74314,49310,091
(6) EPC regulatory calculation24,806103,78052,30432,16326,390
(7) Revaluation-EPB climate11,61538,75326,24414,0469804
(8) Revaluation-real climate988734,29120,09413,0959017
 (6)/(5) (%)298.9%410.2%410.5%221.9%261.5%
 (7)/(5) (%)139.9%153.2%206.0%96.9%97.2%
 (8)/(5) (%)119.1%135.6%157.7%90.4%89.4%

