Article

Regional Competition, Heterogeneous Factors and Pollution Intensity in China: A Spatial Econometric Analysis

School of Economics and Trade, Hunan University, Changsha 410079, China
*
Author to whom correspondence should be addressed.
Sustainability 2016, 8(2), 171; https://0-doi-org.brum.beds.ac.uk/10.3390/su8020171
Submission received: 10 January 2016 / Revised: 29 January 2016 / Accepted: 1 February 2016 / Published: 16 February 2016

Abstract

:
Regional competition may play an important role in the balance of environmental protection and economic growth. However, it is a pending issue of whether the competition among Chinese local governments leads to a race to black development or green development. This paper aims to explore the strategic interactions in provincial development in terms of an environment-economic indicator, i.e., the pollution intensity in China from 2000 to 2013. We divide four predominant industrial pollutants into two groups according to whether the pollutant is regulated, and then test the strategic interactions among regions based on the spatial lag term by employing the spatial Durbin model. The results show that the heterogeneous factors, such as various pollutants and regional difference, may give rise to diversified competition strategies. We find that the “race to black development” hypothesis is not supported at the national level, and the “race to green development” hypothesis is established in the developed eastern regions only in terms of the regulated industrial pollutants. We also detect how pollution intensity is influenced by the direct and spatial spillover effects of environmental regulation and find that environmental legislation has been effective in reducing regulated pollutants’ pollution intensity, while the effects of environmental staff and investment are weak. Finally, some policy suggestions are discussed.

1. Introduction

China, the largest developing country in the world, is confronted with a dilemma of economic growth and environmental protection right now [1]. China has achieved important economic development for more than 30 years (since the 1980s), with an annual economic growth rate of approximately 10%. However, its annual GDP (gross domestic product) growth decreased to nearly 7% in 2015 with the background of the global economic recession, which indicates the enormous pressure to maintain China’s rapid economic growth. The pressure of environmental protection is also great for China, which has been among the top of all countries in terms of the scale of pollutant emission and has been struggling with increasingly severe environmental pollution problems, such as heavy haze, in recent years. Lowering the environmental costs of economic growth for achieving balance between environmental protection and economic growth is an urgent and crucial issue.
Interprovincial competition is believed to be one of the most essential driving forces for China’s economic growth, as proposed by Li and Zhou [2], based on the promotion tournament model. However, on the other hand, the competition among provinces may lead to a serious pollution problem and high environment costs in the early developmental stage [3]. Pollution abatement in China is dominated by provincial-level implementation with enforcement standards created by the central government. If the development of a region and the assessment for provincial officials are economically oriented, local governments may ease environmental regulation stringency to attract more investment for economic growth in the competition, i.e., developing in a “dirty” or “black” way. Fortunately, the Chinese central government has realized the importance of green development and proposed a scientific development concept for regional development in 2003, gradually replacing the economically oriented assessment system for local officials with an environment-economic–oriented one; this change may reverse the direction of regional competition. The environment-economic–oriented assessment system may induce the subnational regions to compete for economic growth with lower environmental costs and thus develop in a greener way, as indicated by some studies [4,5].
However, China is a country with many heterogeneous provinces, so the results of competition in different areas may depend on the regional development level. Moreover, there are many kinds of heterogeneous pollutants that are regulated with different degrees of stringency. The local governments may treat them differently and only compete in the abatement of the regulated pollutants, which implies a selective competition mechanism (see the explanation in Subsection 2.2). Using provincial panel data since 2000 and an environment-economic indicator, i.e., pollution intensity, this paper examines the relationship between regional competition and environmental costs of economic growth with consideration of the heterogeneous factors in China, as well as the effects of environmental regulation. Based on the test procedures, we choose the spatial Durbin model and explore the direct effects and spatial spillover effects of related variables. This paper contributes to the literature in three ways. First, we study regional competition in a comprehensive way which simultaneously includes economic and environmental regulatory competition. By incorporating these two kinds of competition, the research may provide comprehensive and meaningful implications aimed at alleviating the conflict of economic growth and environmental protection in China. By extending the “race to the bottom” (RTB) and “race to the top” (RTT) theories about environmental regulation, we propose that regional governments may engage in a race to black development (RBD) or a race to green development (RGD). Therefore, we investigate the situation in China empirically in terms of variation of pollution intensity. Second, we find that the heterogeneous factors, such as various pollutants and regional difference, may lead to diverse results. We differentiate four industrial pollutants into two groups. The Chinese central government set up obligatory emission reduction targets only for the first group, which contains two kinds of pollutants, i.e., SO2 (sulfur dioxide) and COD (chemical oxygen demand), but did not establish obligatory targets for the others (waste water and waste gas). Thus, the local regulators and firms treat these pollutants differently, which leads to different environmental costs of economic growth and different results for regional competition. The empirical results are also different when we separate the samples into developed regions and developing ones. In the end, we find that the effectiveness of environmental regulation on the pollution intensity is also related to these heterogeneous factors. We identify regulation intensity variables from the perspectives of environmental legislation, staff and capital investment and then find some surprising results associated with the regulation status of the pollutants. Our research may help to better understand whether interactions between regions lead to RBD or RGD when considering regional and pollutant heterogeneities and provide insight into how environmental regulation could be fully explored to reduce pollution.
The remainder of this paper is organized as follows: In Section 2, we propose the theories of “RBD” and “RGD” about regional competition, then adding the heterogeneous factors of China into the theoretical analysis to get the hypotheses to be verified in this study. Section 3 describes the empirical methodology and data. Section 4 reports empirical results, including changes in provincial environmental costs and regulation intensity, the estimated spatial econometric models and a comparison of the eastern and western areas. In Section 5, we offer some conclusions and policy implications.

2. Theoretical Background

2.1. From RTB (RTT) to RBD (RGD)

The extant literature has proven that regional governments interact with each other in both developed and developing countries [2,3,4,5,6,7,8,9,10,11,12,13,14,15,16,17,18,19,20,21,22,23]. The policies and behavior of a local government are correlated with those of neighboring or benchmark jurisdictions, while interactions often take the form of competition in economic growth, environmental regulation, etc. Many empirical studies on the economic competition among governments have been presented [6,7,8,9]. Specifically in China, economic competition among provinces has been embedded in a centralized political system, and the role of political incentives for regional government officials has been emphasized in promoting local economic growth [2]. Evidence of Chinese provincial interaction can also be seen in other studies [10,11,12,13].
On the other hand, the environmental regulatory competition in local governments has been a fixture of studies for the past 20 years. At least four alternative theories have been proposed. Among them, the “race to the bottom” (RTB) theory suggests that local governments have incentives to ease environmental regulation to influence economic voting [14] or to meet business-oriented interest groups’ demands [15]. However, the “race to the top” (RTT) theory argues that some regions may strive to reject those pollution-intensive industries by generating more stringent environmental standards [16] because some state-elected officials may view environmental protection as a more important factor in gaining the support of environmentally minded voters [17]. The third theory, proposed by Konisky [18,19], argues that neither RTB nor RTT entirely accounts for the complexity of governments’ environmental regulatory behavior: Some states may race to the bottom, while others may race to the top in environmental regulatory competition. The above three theories assume the existence of environmental regulatory competition, whereas the fourth theory maintains that regulatory decisions are based solely on intrastate factors, namely local regulators not acting strategically [20]. The related empirical results are mixed so far. Using the US states as samples, Woods [21] provided empirical evidence for RTB, but Fredriksson and Milliment [22] and Konisky [18] did not find enough proof to support RTB. Li and Shen [23] and Yang et al. [3] showed evidence of RTB in China, while the RTT argument was also supported by some studies [4,5].
We realized that the extant studies about intergovernmental competition focus only on economic or environmental aspects. However, the environmental regulatory competition is strongly interrelated with economic competition. Relaxing environmental regulation is often stimulated by economic competition and is a potential instrument in regional economic competition in some cases [18]. In addition, environmental regulatory competition would influence the regional economic development as well. Nevertheless, economic growth is always a crucial subject for local governments, even if they execute stringent environmental regulation. Given the importance of balancing economic growth and environmental protection, providing comprehensive and meaningful implications appears to be imperative. Unfortunately, there have been few studies explicitly and simultaneously analyzing the economic and environmental regulatory competition among local governments via some ingenious devices.
A quick overview of developmental patterns may provide us new ideas for further research. With the increasing concern about global warming and environmental pollution, “green development” has become a new consensus around the world, which means lowering the environmental costs of economic development and maintaining balance between economic development and ecological environment [24]. In contrast, “black development”, which has been conducted by many countries during industrialization, indicates that economic growth occurs with high environmental costs and huge resource consumption [25]. To achieve sustainable development, governments should transform the pattern of economic growth from black to green to realize a win-win solution for economic development and environmental protection [26]. Therefore, it is extremely necessary to investigate the economic and environmental regulatory competition among governments in a common framework, as environmental regulatory competition always appears to be the method for economic competition. Noting that both the RTB and RTT theories proposed by previous related literature emphasize competition only from the perspective of environmental regulation, we suggest extending the above theories into the “race to black development” (RBD) and “race to green development” (RGD) hypotheses, which combine economic and environmental factors in the research on intergovernmental competition. Further empirical research based on it may provide more comprehensive and fruitful results.
The RBD hypothesis suggests that interregional competition may give rise to increasingly higher environmental costs of economic development, which would imply a pattern of unsustainable (“black”) development. The negative externality of environmental pollution provides governments the chance to gain economic growth while sharing transboundary pollution with their neighbors. Local governments may weaken environmental regulation stringency and try to attract or maintain “dirty” industries [18]. As a result, the environmental costs of economic growth will increase as time passes and be positively correlated with other competitive regions. In contrast, the RGD hypothesis suggests that environmental costs of economic development are lowered steadily under the influence of interregional competition, which would imply a pattern of sustainable (“green”) development. Since regional regulators may endeavor to improve environmental performance to gain political promotion or votes [17,18], the corresponding competition among regions may cause more stringent environmental regulation, which will lead to development in a greener way. Consequently, environmental costs of economic development will decrease.
An interesting and important question is how the regional competition influences the environmental costs of economic growth and the developmental pattern in practice, i.e., whether the RBD or RGD hypothesis can be supported by empirical tests. If either of them is confirmed, the related results will provide meaningful implications for the balance of economic growth and environmental protection. Specifically in China, pollution abatement is a combination of centralized standard-setting and provincial-level implementation. According to the promotion tournament model [27], China’s local officials are engaged in competition for economic growth. In addition, the local environmental agencies are dominated by local governments. To ensure economic growth, reducing environmental protection efforts may be the choice for some local governments. Therefore, in the economic-oriented developmental stage, the regional competition may result in higher environmental costs and push regions toward black development as the RBD hypothesis suggests, while in the environment-economic–oriented developmental stage, local officials would engage in a race to lower the environmental costs of economic growth because their political promotion relies on the assessment of regional environment-economic performance. In this case, the inter-regional competition may lead to RGD, which is beneficial for the balance of economic growth and environmental protection. However, the RBD and RGD hypotheses are not fully explored in the existing literature.

2.2. Heterogeneous Factors and Hypotheses to Be Verified

When environmental regulation is dominated by local governments, relaxing environmental standards to absorb or maintain environmentally sensitive investment may be an applicable strategy due to the externality of transboundary pollution [21]. This may lead to the RBD generally if related governments behave in similar ways. However, heterogeneous factors may result in diverse regional competitive strategies, which would undermine the RBD or RGD hypothesis and give rise to diversified results. This paper focuses on two heterogeneous factors in China: regional difference and divergence of pollutants.
Beginning with regional difference, we presume that the RBD may occur in undeveloped regions, which are engaged in economic growth and do not have enough choices available for economic competition. Because the environmental pressure could be relatively low in the undeveloped regions, those local governments may tradeoff environmental protection for economic development and relax environmental standards, with the thought of treating after polluting. However, the developed regions have advantages in technological innovation, human capital, industrial agglomeration and market systems, which may offer them a number of competitive strategies. When facing environmental problems and economic competition, they may turn to alternative strategies, such as technological or capital incentive, instead of easing environmental protection efforts. To gain the support of environmentally sensitive voters or promotion from the central government, local officials in developed areas may even strengthen regulation, which may lead to the RGB. In sum, the logic of RBD or RGD relies on a homogeneous hypothesis.
Specifically in China, a large country with many heterogeneous provinces, neither the RBD nor the RGD might occur readily at the national level. As stated by Song et al. [28], the difference in geographical locations of distinct provinces might increase the disparity of abilities for economic development, which further affects their environmental performance and efficiency. For example, the average GDP per capita of the Chinese eastern area (including 11 provincial-level regions) was approximately 3 (1.8) times as big as that of the western area (including 10 provincial-level regions) in 2000 (2013), and the average emission of industrial waste gas of the former was nearly 2(1.6) times as much as that of the latter in 2000 (2013). Provincial governments in the western regions may lower their environmental standards to absorb more investment because they lack enough capital and technology, whereas provincial governments in the eastern regions may diversify approaches to stimulating their economies because the strategy of relaxing environmental regulation is neither a unique nor a common choice. Therefore, it is difficult to prove the existence of the RBD at the national level. When environmental performance becomes one of the assessment indicators of local officials, governments may put more resources into pollutant abatement, which may cause the phenomenon known as the “California effect” [29], in which regulators tend to adopt the most stringent environmental standards and facilitate the regions to develop in a greener way. In a word, we propose the hypothesis that it is possible to find evidence of the RBD occurring in the undeveloped areas, while the RGD might occur in the developed areas in China.
Another heterogeneous factor is the divergence of regulation on the pollutants. Pollutants such as SO2, COD and waste gas have different environmental regulation intensities. Because SO2 and COD are under the stringent regulation of the central government, regional governments may pay more attention to controlling the pollution of related industries and firms. Then, the inter-regional competition may lead to lower environmental costs computed with the regulated pollutants, and provide evidence to support the RGD hypothesis. While other unregulated pollutants might receive scant attention from local governments, the RBD may be established when the environmental costs are calculated with the unregulated pollutants, because the local governments may select different competitive manners in terms of the regulation stringency of pollutants. We summarize it into the “selective competition mechanism”, which indicates that the RBG and RGD are likely to be conditionally supported.
Regulation heterogeneity of pollutants has existed in China. China set incentive emission reduction targets of SO2 (−10%) and COD (−10%) for the period of 2001–2005; however, the total emissions of industrial waste water and waste gas are not regulated [30]. Specifically, the obligatory emission reduction targets of SO2 and COD were set for −10% during 2006–2010 [31]. As a result, we find that the emission volume of industrial waste gas increased approximately 380%, while the emission volume of SO2 merely increased approximately 15% from 2000 to 2013. When considering the above heterogeneity, this paper infers that the establishment of RBD or RGD in China is associated with whether or not the pollutants (which are used to compute the environmental costs) are under the supervision of the central government. We examine the previously mentioned hypotheses in terms of pollution intensity, which is a simple and clear indicator used by previous studies [4].

3. Methodology, Variables and Data

3.1. Econometric Methodology

To test the interaction of regions empirically, previous studies such as Fredriksson and Millimet [22], Konisky [18] and Li et al. [5] focused on the spatial autoregressive coefficient ρ in Equation (1):
y i t = a + ρ j = 1 , i j N w i j y j t + β X i t + s i + u t + ε i t
where yit is the dependent variable such as pollution intensity; a is the constant term; ρ is the spatial autoregressive coefficient and the absolute value of it is smaller than unity, i.e., | ρ | < 1 . A nonzero coefficient, i.e., significant ρ , implies that a province’s competitive strategy depends on the status of other provinces’ strategies [18,22]. Specifically, a positive and significant ρ indicates similar strategies in the regional competition (RBD/RGD), while a negative or an insignificant positive ρ indicates diverse competitive strategies. w i j denotes the weight describing the strategic interaction between the regions i and j; β is the coefficient vector of independent variables; s i is regional fixed effects; and u t is time fixed effects. Xit refers to independent variables and ε i t is the error term.
To obtain consistent and accurate estimation, some issues should be addressed here. The first is the endogeneity of j = 1 , i j N w i j y j t in Equation (1). If the dependent variable (y) in region i is a function of y in region j, then y in region j should also be a function of y in region i [18]. OLS (ordinary least squares) estimates will be biased because of the above simultaneity problem. To address this issue, the instrumental variable approach is used by Konisky [18]. However, Zhang et al. [4] argued that it is very hard to find the proper instrumental variables, and the estimation results rely heavily on the choice of instrumental variables. Noting that the instrumental variable approach may lead to inaccurate estimation of ρ , they suggested the application of the spatial econometric method proposed by Anseilin [32] and used the maximum likelihood estimation to settle this endogeneity issue. Following LeSage and Pace [33,34] and Zhang et al. [4], this paper employs the ML (maximum likelihood) approach to estimate the spatial econometric model. It is worth noting that the ML estimation method requires an assumption about the normal distribution of the error term. If it is not satisfied, the estimated coefficients are still consistent in the ML estimation, whereas the estimated standard errors of coefficients may be biased. In such a case, the Quasi ML method should be applied to provide consistent and unbiased estimates. The Quasi ML and ML provide the same estimated coefficients, while their estimation of standard errors is different.
The second issue is spatial spillover effects of independent variables. The dependent variable may be influenced by the independent variables (X) of adjacent regions, which implies the spatial spillover effects and spatial Durbin model should be considered [33]. In the interaction models, the spatial weighted lag term of X should not be neglected, and the application of it may help to alleviate the auto-correlation of the error term [4]. This paper adds the spatial weighted lag term of X, i.e., θ j = 1 , i j N w i j X j t , to Equation (1) in the empirical study as follows:
y i t = a + ρ j = 1 , i j N w i j y j t + β X i t + θ j = 1 , i j N w i j X j t + s i + u t + ε i t
where θ represents a parameter to be estimated. This paper uses a spatial adjacent matrix, i.e., w i j , if two provinces share a common border and zero otherwise. The spatial weights matrix W should be row-standardized, i.e., row-stochastic, and the row-sums of W equal unity. The spatial and time-specific effects can be treated as fixed or random effects, which should be selected by the Hausman test. A spatial econometric model may provide a better estimation of the regulatory competition. However, there are several kinds of spatial models, such as the autoregressive model (SAR), the spatial error model (SEM) and the spatial Durbin model (SDM). SAR contains endogenous interaction effects (see Equation (1)), which are often used in the studies of regulatory competition [18,22], while the SEM contains interaction effects among the error terms. Both SAR and SEM do not include the weighted lag term of X mentioned above, while the SDM (see Equation (2)) does. Zhang et al. [4] used SDM to identify the interaction of Chinese provinces. A reasonable way to choose the proper model is based on econometric tests instead of subjective analyses. We select the proper panel model on the basis of the test procedures proposed by Elhorst [35] and find that SDM is the proper one (see the introduction of the specification test in Appendix).
Another endogeneity is related to the simultaneity of regulation intensity variables and the pollution intensity, which could be influenced by each other. To address this endogeneity, we take lags of regulation intensity variables, following the existing literature [36,37]. This method provides two advantages: (1) helping to ease the endogeneity to some extent and (2) considering the time-lag effects of environmental and economic policies.
The last issue is the choice of weights matrix. Some literature [38,39] used Bayesian MCMC (Markov chain Monte Carlo) methods to make the results more robust with respect to the choice of the weights matrix. Recently, LeSage and Pace [34] raised doubt about the view that estimates of spatial regression models are sensitive to the spatial weights, and pointed out that the view is of little theoretical basis. Following previous studies on the regional interaction [4,22], this paper uses the row-standardized spatial adjacent matrix for two reasons. The first one relies on the fact that regulatory competition originates from the externality of transboundary pollution, which is relatively obvious among adjacent regions. The second reason is that a region may be more inclined to compare itself with its neighbors than those not bordering it, which leads to competitive relationships between one region and its neighbors. The above analysis indicates an adjacent competition mechanism, which is an important theoretical basis of regional competition. We also use an inverse distance weights matrix in the robustness test and then get similar results.

3.2. Variables and Data

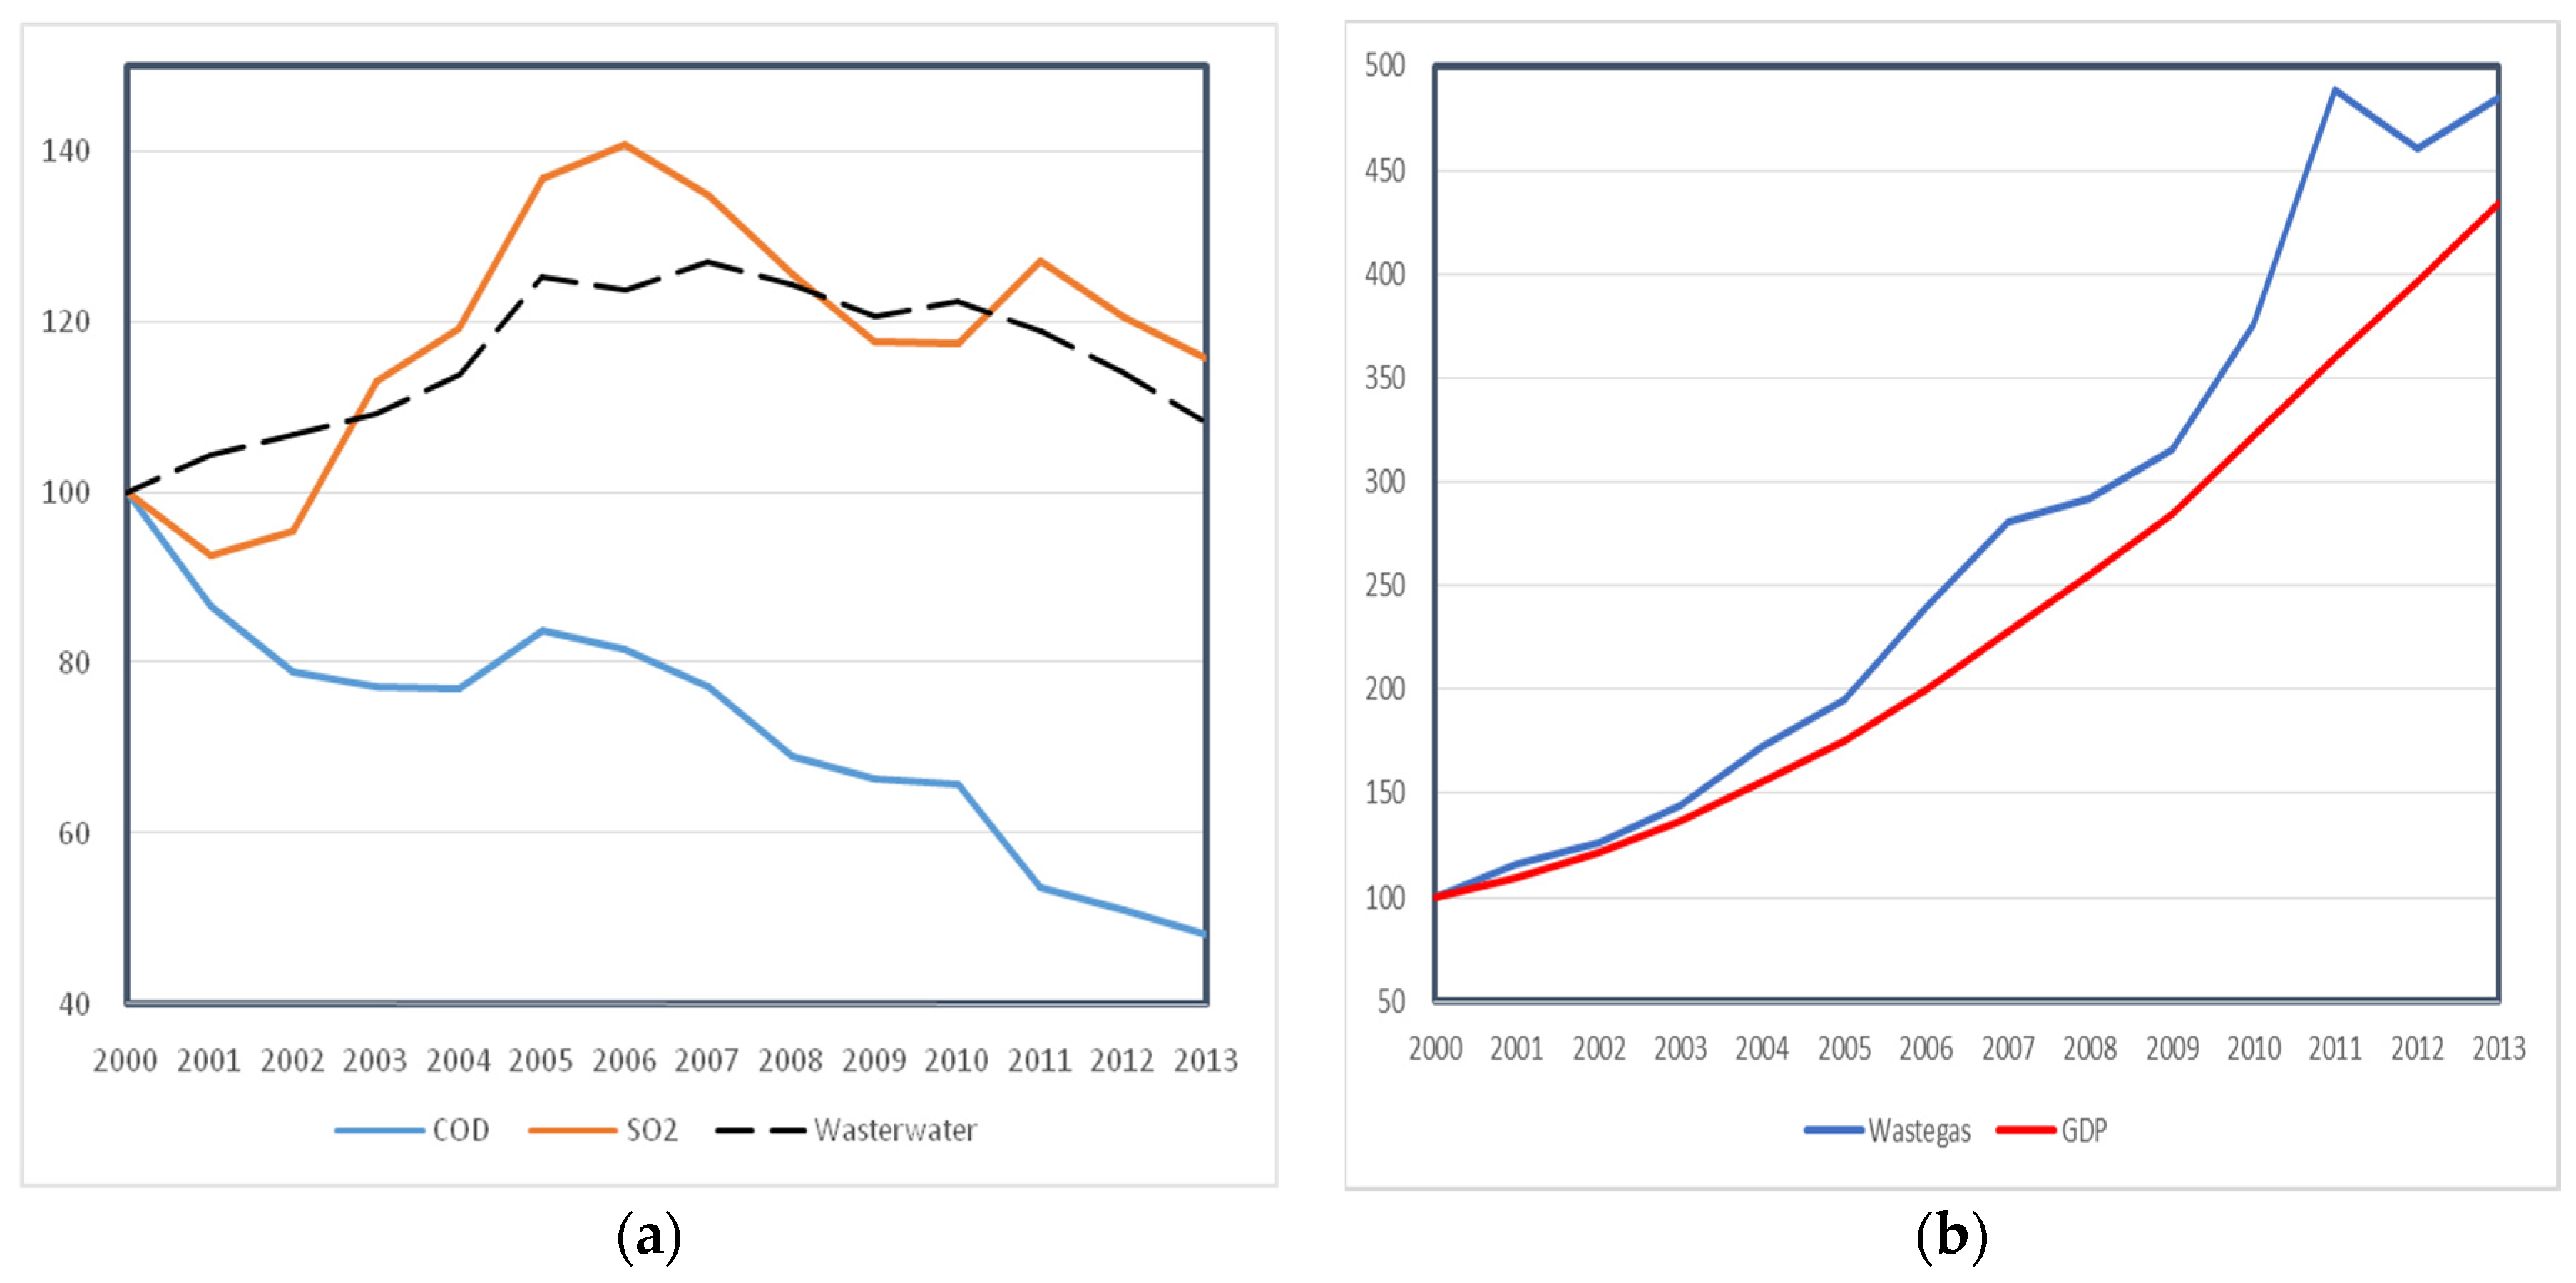
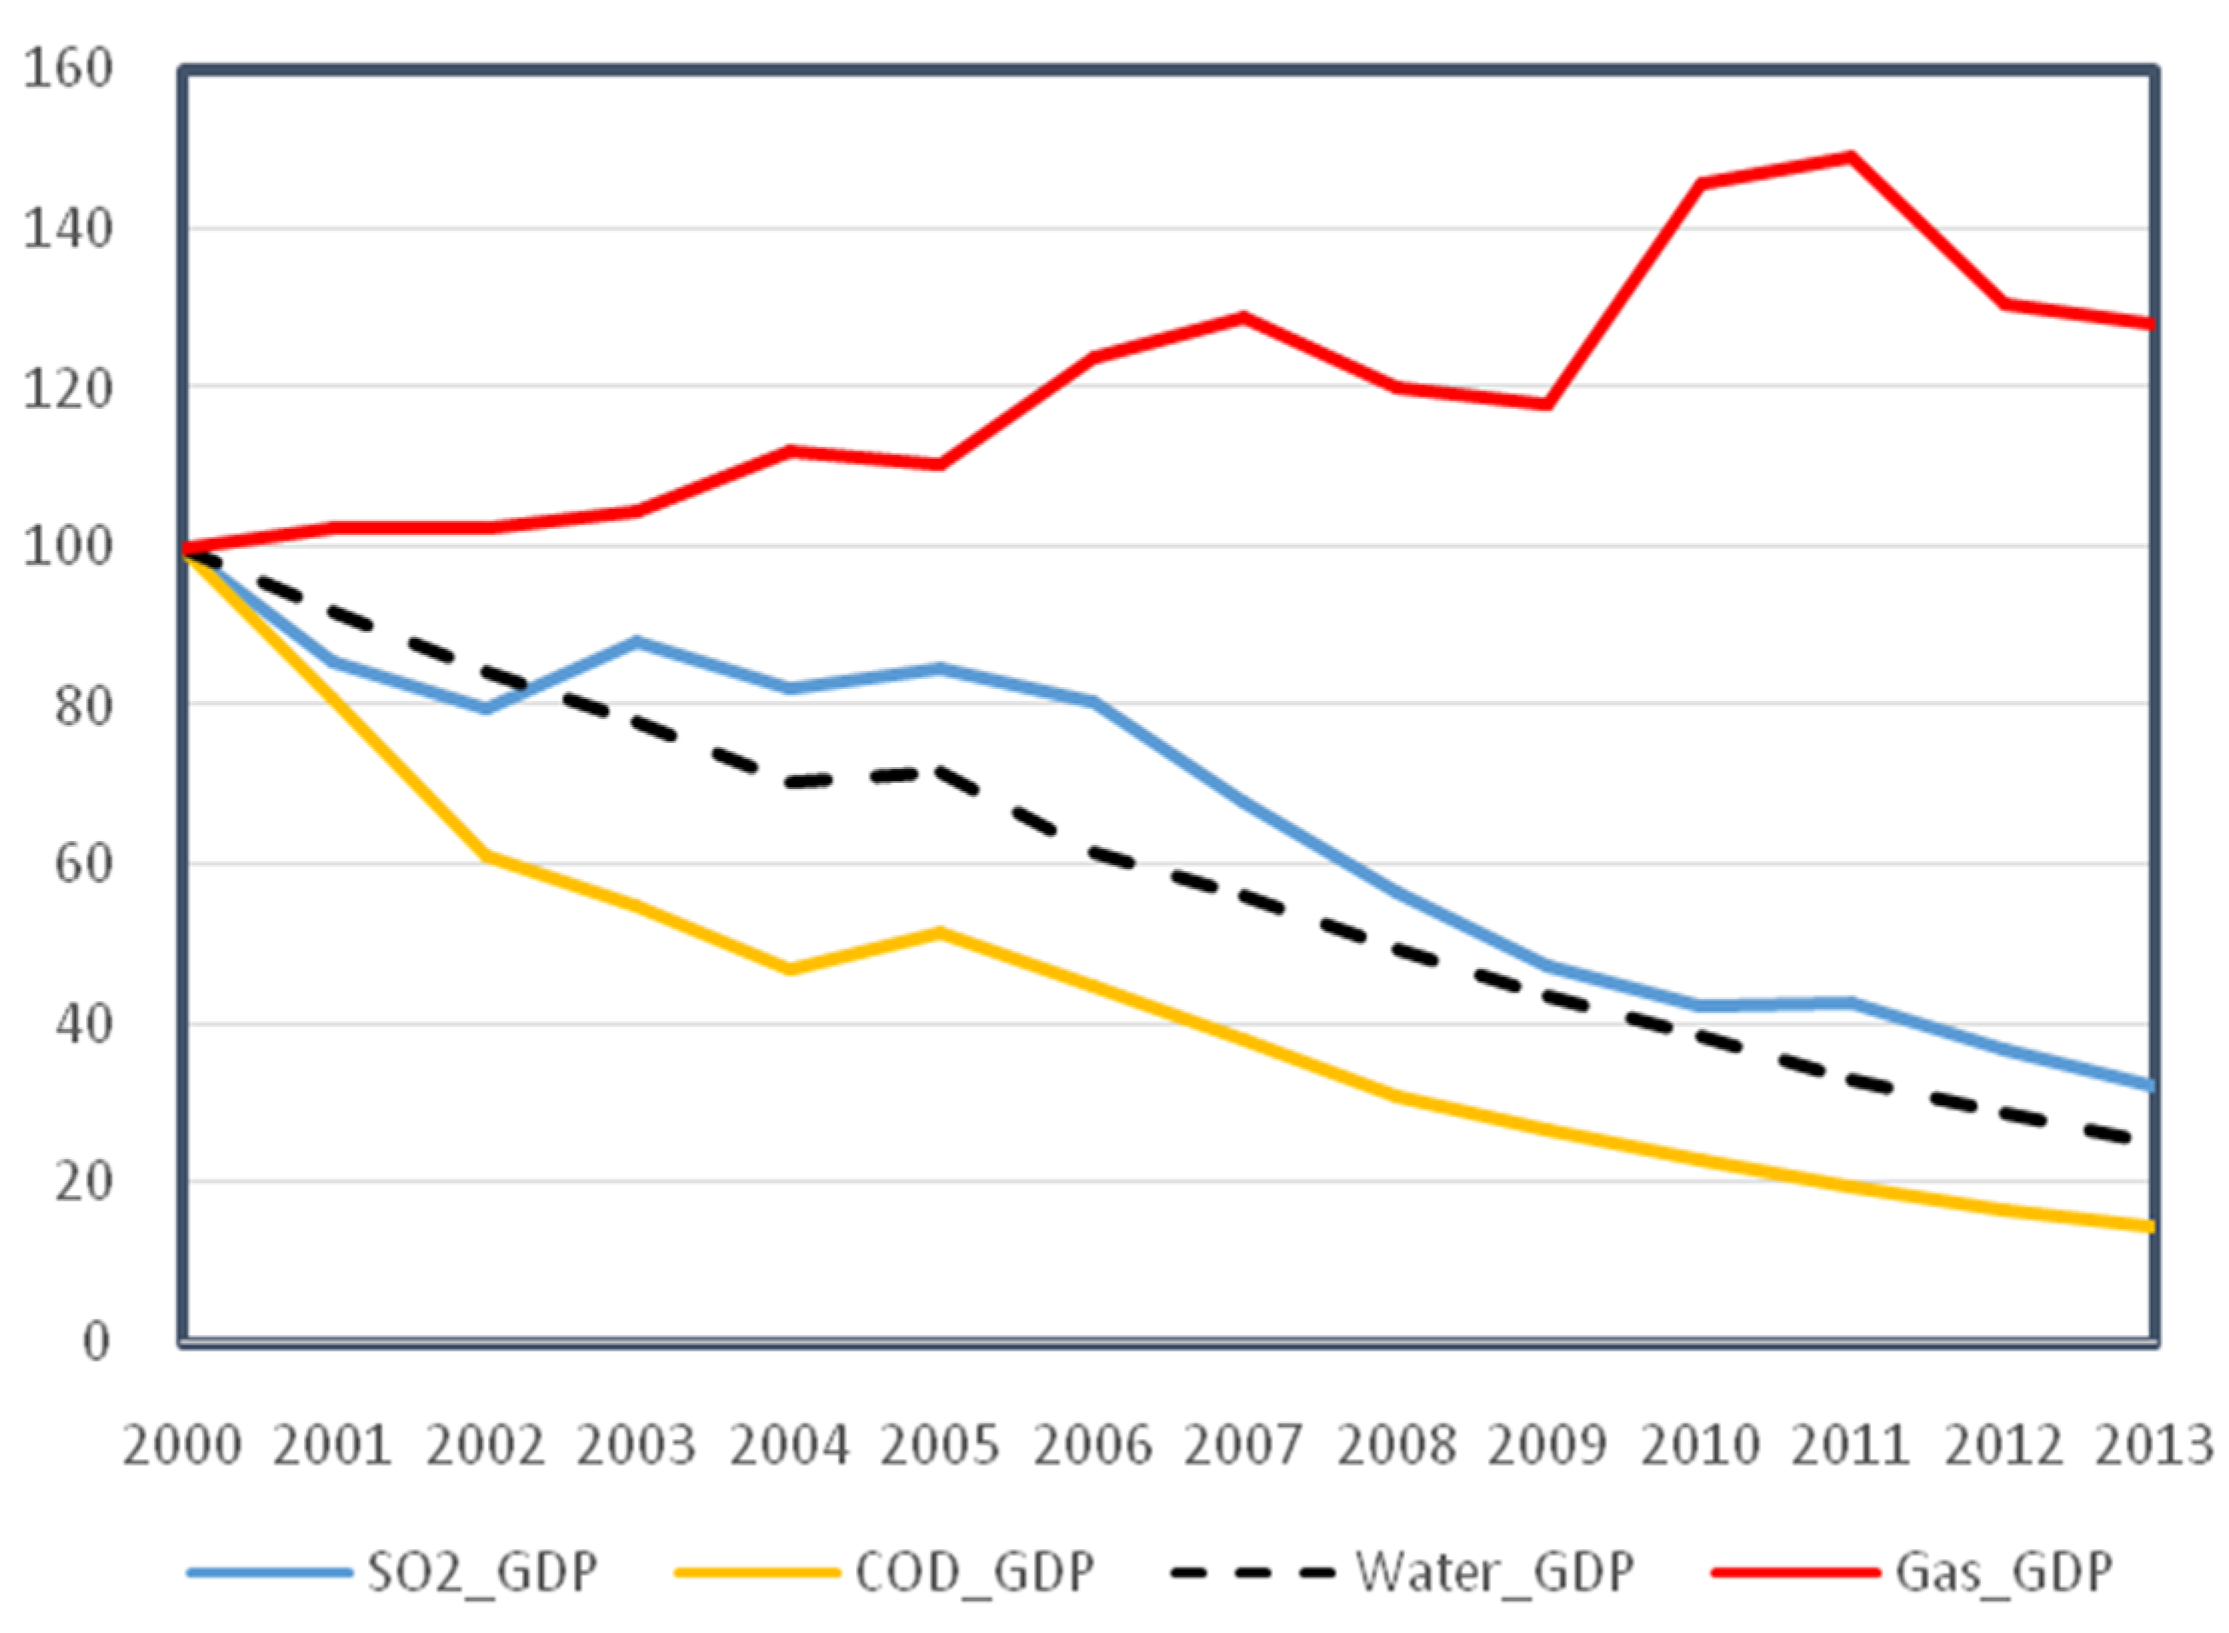
3.2.1. Dependent Variable and Strategic Interaction of Local Governments

To test the existence of strategic interactions between local governments, an intuitive method is to observe governments’ behavior directly and use it as the dependent variable. For example, inspections and punitive actions [18], pollution abatement and control expenditures [22] have been regarded as proxy measures of environmental regulation. However, this direct approach is not reliable in this empirical study for two reasons: (1) the lack of data about environmental enforcement such as the annual number of inspections in China; and (2) the different measures implemented by different governments to relax environmental regulation for the sake of stimulating their economies. A local government may lower the frequency of inspection for pollution-intensive firms, while its neighbors may use other methods such as reducing the punishment stringency; therefore, the behavior and reactions of local governments will be diversified and asymmetric.
An alternative way is to observe the results of the governments’ behavior, i.e., the environmental and economic performance linked with their competition, such as the ratio of industrial added value over pollutant emission [4,40], and input-output efficiency [5]. If a region stimulates its economic growth by relaxing the environmental regulation, the emission volume of pollutants will increase at the same time. Assuming that the technological level and other determinants are constant, the pollutant emission may grow faster than the economic output when the region lowers the environmental standards to absorb “dirty” industries in the economic competition, which implies the increasing environmental costs of economic growth. If the neighboring regions adopt similar strategies and develop in a black way, their environmental costs will be elevated together and show positive correlations with each other. However, if the regions race to green development, the competition among them will lead to lower environmental costs. Following the above logic, we test the strategic interactions of local governments by focusing on the results of competitive behavior. Consistent with previous studies [4,40,41,42,43], we use the ratio of pollutant emission volume over economic output, i.e., pollution intensity (PI), as the dependent variable (after a natural log transformation), which describes the environmental costs of per capita economic output as well as the coordination degree of the economy and environment. Note that a smaller PI is better.
As mentioned in Subsection 2.2, the empirical results may be diversified due to the heterogeneity of pollutant abatement. This paper observes two regulated industrial pollutants, SO2 and COD, as well as two unregulated industrial pollutants, waste gas and waste water. Therefore, the PIs in this study include SO2_GDP, COD_GDP, Water_GDP and Gas_GDP.

3.2.2. Independent Variables

Generally, measures of economic output, such as GDP, are functions of capital (K), labor (L) and other factors. Holdren and Ehrlich [44] suggested that the main determinants of environmental impact include the population, affluence and technology. According to Grossman and Krueger [45] and He [46], the pollutant emission is a function of the scale effect (SE), the technique effect (TE) and the composition effect (CE). The scale effect in China is paramount because achieving high economic growth has been the main political promotion criterion for local officials. The technique effect reflects the efforts from techniques that are likely to decrease the pollution intensity [46]. In addition, the composition effect denotes the association of a region’s environmental performance and its industrial structure as well as other kinds of composition factors at a given production scale. Note that systematic factors such as environmental regulation (ER) are also important determinants of PI. Combining them, we have:
PI = F ( ER , SE , TE , CE , )
where ϕ refers to other determinants. Note that K and L can be included in Equation (3) (see additional explanation in Appendix).
A key point of this paper is to explore the relationship between environmental regulation (ER) and PI. We determine the main independent variables from each of the three programs in accordance with data availability and the previous literature. (1) According to Mu et al. [47], the legislation may be the legal systematic improvement to balance economic and environmental interest for gaining sustainable development. The number of local environmental bylaws and rules (Sum_rule) is a proxy for the developmental level of environmental legislation by a provincial unit. (2) The number of staff in the environmental protection departments per industrial firm above the designated size (Regulator_perfirm) represents the input on the human resources for environmental protection by a provincial unit. (3) The investment in the treatment of industrial pollution per capita industrial output measures the expenditure on the abatement by a provincial unit (Inves_output). As we explained in Section 2, a one-year lag of the above variables is used, considering the time-lag effects of environmental regulation. Moreover, the Pearson correlation test shows that the three variables are weakly correlated (see Appendix), so their multicollinearity should not be an issue.
Specifically, we consider the following control variables. (1) To proxy for informal environmental regulation, we employ the share of people with college degrees or above in the population (S_college), consistent with Yuan and Xie [48]. They noted that highly educated people may be more concerned with environmental protection and then exert more pressure on the government. (2) L is a measure of the scale effect, which is greatly correlated with the population. (3) Following Wang and Chen [49], we also measure the scale effect of economic activity by the GDP per square kilometer (GDPSK). (4) Many kinds of pollutants are generated during the process of consuming energy, and the energy intensity (energy consumption per capita GDP, Engery_GDP) represents the technical level of energy utilization [50], which is a proxy measure of the technique effect as well. (5) The industry structure will influence the environmental costs, especially for heavy industry which contributes considerably to the GDP while emitting lots of pollutants. We employ the share of heavy industrial output in the total industrial output (S_HI) to denote the composition effect. (6) The state-owned enterprises (SOEs) also play very important roles in China [51], which produced approximately 47% of the gross industrial output value from 2000 to 2013. Because the property right structure of these enterprises may influence environmental performance, we use the share of industrial output generated by SOEs (S_SOE) as a measure of the composition effect. (7) K_L is the capital-labor ratio representing both capital intensity and endowment structure. Previous studies have found a clear positive correlation between K_L and environmental performance [52,53]. (8) Moreover, we employ the energy composition, i.e., the share of coal in the regional energy consumption (S_coal), to control its potential impacts on the environment because the extensive exploitation of coal, the largest energy source in China at present, has caused serious environmental pollution problems [54]. (9) Lastly, the ratio of total export-import volumes to GDP (Open) is used to measure the influence of regional openness on the local environment according to previous studies [55,56]. We anticipate that a higher degree of openness may cause better environmental performance by facilitating the regional technological innovation. Following some literature [10,13], we use the natural log transformation for most variables during the empirical analysis, except those ratio indicators such as S_coal, S_SOE and S_HI, etc.

3.2.3. Samples and Data Source

Our samples consist of a panel of 30 provincial regions covering the period of 2000–2013. These 30 provinces are divided into three groups. The eastern provinces include Beijing, Tianjin, Hebei, Liaoning, Shanghai, Jiangsu, Zhejiang, Fujian, Shandong, Guangdong, and Hainan. The western ones include Inner Mongolia, Qinghai, Ningxia, Shaanxi, Sichuan, Chongqing, Guizhou, Yunnan, Guangxi, Gansu and Xinjiang. The central ones include Jilin, Heilongjiang, Shanxi, Henan, Anhui, Jiangxi, Hubei and Hunan. The firms referred to in our study are only those industrial enterprises above the designated size (the annual sales are not less than 5 million yuan before 2010, and not less than 20 million yuan since 2011. Tibet, Hong Kong, Macau and Taiwan are excluded due to data constraints. We collect the data from a number of official sources, including a few Chinese national yearbooks [57,58,59,60,61] and statistical yearbooks of each province. Table A1 in Appendix describes the data sources of each variable in detail, and all acronyms of variables are defined in the above paragraphs. Table 1 reports the descriptive statistics for all variables.
Table 1. Descriptive statistics.
VariableObservationsMeanStd. Dev.MinMaxUnit
SO2_GDP420136.316121.8814.394640.461Tons per 108 yuan
COD_GDP42037.88451.6730.515477.328Tons per 108 yuan
Water_GDP42012.5088.6380.80152.611Tons per 104 yuan
Gas_GDP4202.0621.5660.29718.129m3 per yuan
Sum_rule42043.33331.0466.000191.000Pieces
Regulator_perfirm4201.0550.7170.1024.413Persons per firm
Inves_output4200.1860.1550.0081.083%
S_college4207.5335.2851.6439.46%
L4202444.1241630.484262.1006580.400Persons
Engery_GDP4201.7030.9160.6215.176Tons per 104 yuan
S_HI4200.7210.1130.3700.954
S_SOE4200.4670.2060.1070.891
GDPSK4200.1270.3340.0002.823108 yuan per square kilometer
K_L42010.9739.0881.49149.161104 yuan per person
S_coal4200.5550.1420.1350.825
Open4200.3390.4300.0401.840
Notes: If prices are involved, the data is at 2000 constant price. For structure variables, the current year’s price is adopted. Referring to Zhang et al. [62] and Huang et al. [63], we compute gross fixed capital by the perpetual inventory method.

4. Empirical Results

In this section, we report the results of the provincial interactive behavior, namely the environmental costs of economic growth, as well as the estimated econometric models. We also compare the cases of the eastern and western areas to examine the hypotheses proposed in Subsection 2.2.

4.1. PI and Environmental Regulation

To make it easy to compare, we set the pollution emission scale in 2000 equivalent to the value of 100 and calculate the emission index of each industrial pollutant from 2000 to 2013 in China, which shows that there exists large difference in the variation of the emissions of the four industrial pollutants during this period. Figure 1a shows that the emission index of a kind of regulated pollutant (COD) was reduced substantially to approximately 50 in 2013. However, the emission index of SO2 increased quickly to approximately 140 before 2006 and then was reduced gradually to 110 in 2013. The emission change of waste water is similar to that of SO2. The emission volume of waste gas has continued increasing since 2000, and it grew faster than the GDP (see Figure 1b). The fast-growing emission of waste gas and its emission accumulation may be the main source of air pollution, which helps to explain why many cities in China have experienced severe haze in recent years. Although much progress has been achieved in the emission abatement of COD, the emissions of unregulated pollutants such as waste gas are still rising, which should be paid more attention. All of these findings indicate that the severity of different pollutants covers a wide range, and then the empirical results based on them may be different.
Figure 1. Change in emission volume of pollutants. Notes: We set the emission scale in 2000 equivalent to 100.
Sustainability 08 00171 g001
Table 2 reports the average PI computed with different pollutants respectively each year. For the sake of comparing and analyzing conveniently, we also set the PI in 2000 equivalent to 100. Figure 2 sketches the change in PI calculated by using the four pollutants respectively in the period of 2000–2013. The results indicate that most PIs have been reduced substantially except that of waste gas (Gas_GDP). Specifically, the PI of Gas_GDP has increased to approximately 130, which indicates that the environmental costs of economic growth have increased from this perspective. However, others have been reduced to less than 40 in 2013, which provides indications of the lower environmental costs of economic growth from these pollutants’ perspective. If one merely considers a single kind of pollutant, a full-scale observation may not be reached, which implies related heterogeneity should be taken into account.
Table 2 reports the average PI in the eastern and western areas, which enables a comparison between them. The PI of the western area is far worse than that of eastern one in all of the indicators in this study. For example, the average emission of SO2 per capita GDP (SO2_GDP) in the western area was 324.881 (116.007) in 2000 (2013), while it was only 105.906 (22.939) in the eastern area in 2000 (2013). This result implies that the western area overpaid the environmental costs about three times (five times) the size of the eastern area in 2000 (2013). Moreover, the gap between the two areas is enlarged, although their average emission intensities are both reduced. Similar evidence could be found in the cases of COD_GDP and Gas_GDP, etc.
Table 2. PI (pollution intensity) from 2000 to 2013.
YearSO2_GDPCOD_GDPWater_GDPGas_GDP
NationalEastWestNationalEastWestNationalEastWestNationalEastWest
2000205.965105.906324.88186.95541.900137.69421.03014.90125.3661.7241.1142.314
2001176.11187.607276.98170.27630.292114.54619.35015.21722.7631.7631.2502.259
2002164.21781.530262.82553.35225.25282.48317.76114.06720.7451.7651.2152.296
2003181.46181.663303.94047.53221.30275.26416.38112.66319.5091.8031.2112.323
2004168.83673.032280.74940.76718.85763.21314.83811.88517.3401.9291.2172.701
2005174.11071.401289.38444.61218.41773.96115.09811.81419.1391.8981.2882.481
2006165.99662.154287.45139.09614.82265.72912.98510.14615.9952.1311.3932.959
2007140.11752.095242.22933.14212.07956.46911.7838.79615.1142.2201.3893.209
2008116.59042.411201.67927.0149.15546.52210.4197.72713.6832.0711.2192.861
200997.36734.994167.18423.2338.01439.8989.1266.90111.7672.0311.2352.908
201087.28331.373149.51820.1067.05934.5638.0526.04810.1072.5101.2614.059
201188.27530.572153.64516.9595.82831.5616.9715.6858.1722.5671.4223.731
201275.69626.499132.02514.5925.22127.2306.0524.7237.0112.2481.2153.373
201366.39822.939116.00712.7464.49524.0475.2684.0796.1122.2031.3183.253
Figure 2. PI from 2000 to 2013. Notes: We set the PI in 2000 equivalent to 100.
Sustainability 08 00171 g002
Table 3 displays the variation of the environmental regulation variables. The average number of local environmental bylaws and rules (Sum_rule) continued to rise from 2000 to 2013, and increased from approximately 23 in 2000 to 61 in 2013. However, the number of staff in the environmental protection departments per industrial firm above the designated size (Regulator_perfirm) remained relatively stable in this period, of which the average value was about one in most years. The average investment in the treatment of industrial pollution per capita industrial output (Inves_output) went down from 0.39% in 2000 to 0.13% in 2013, although, in fact, the scale of investment increased during this period. The above results indicate that local governments have made progress in legislation for environmental protection; however, the invested capital aimed at protecting the environment did not keep up with the GDP growth. Compared with the western area, the eastern area shows higher scale in the variable of Sum_rule, which indicates more stringent regulation in these regions. However, the cases of the other two variables are complicated to some extent. The result indicates that the western area has more environmental human resources per firm than the eastern area, which could lead to more stringent regulation in the west. However, we should realize the reason behind it is that the number of firms is relatively small in the west. Similarly, although the Inves_output of the western area is relatively high, its abstract amount of investment in the treatment of industrial pollution is far smaller than that of the eastern area.
Table 3. Three kinds of environmental regulation from 2000 to 2013.
YearSum_ruleRegulator_perfirmInves_output
Whole NationEastWestWhole NationEastWestWhole NationEastWest
200023.33322.00019.3641.0810.6321.2520.3900.2380.512
200126.16725.00020.8181.1690.6211.4030.2430.1380.323
200230.26727.50025.6361.2130.6171.4690.2320.1450.284
200333.73331.00028.2731.1980.5691.4540.1870.1430.234
200436.90035.20030.2731.0050.4891.2730.2190.1180.305
200539.60037.40032.0911.0640.5191.3310.2230.1750.261
200643.03340.80033.3641.0040.5181.2840.2260.1370.300
200745.63344.40035.3641.0020.5661.2890.1870.0960.258
200847.83346.80037.0910.8810.5061.1640.1630.0770.252
200949.50049.10038.4550.8910.5681.1450.1380.0560.221
201054.26750.10049.0000.8770.5791.1180.0910.0410.149
201156.03352.40050.3641.1990.8641.5610.0870.0530.141
201258.53355.60052.4551.1070.8271.4070.0920.0690.145
201361.83360.00055.9091.0790.8131.3670.1300.0730.195
Notes: The unit of Inves_output is %. The indicators of central area are not reported due to space limitation, the data of which is available upon request.

4.2. Econometric Analysis

4.2.1. Results of Full Samples

4.2.1.1. Proper Econometric Models

Firstly we investigate the spatial interdependence of PI with the two standard spatial auto-correlation tests of Moran’s I [64] and Geary’s C [65]. In the interest of brevity, Table 4 summarizes the results in 2013. Moran’s I statistic shows that the variables (SO2_GDP and COD _GDP) are spatially auto-correlated at the 10% statistical significance level. Geary’s C shows similar results, indicating the necessity of using the spatial econometric models for the empirical analysis. To get robust results, we carry out further test procedures for all dependents.
Table 4. Spatial auto-correlation of dependents (2013).
VariableMoran’s I TestGeary’s C Test
Statisticp-ValueStatisticp-Value
SO2_GDP0.2360.0070.5470.048
COD_GDP0.1420.0360.5380.138
Water_GDP−0.0070.7960.7280.179
Gas_GDP0.0940.2350.7490.165
Notes: The two-tail test is used to compute p-values. The null hypothesis is that the distribution of variables in different provinces is considered to be spatially independent.
We perform the Lagrange multiplier (LM) test and the robust LM test for the null hypothesis of no spatially lagged dependent variable and no spatially correlated error term. For example, when using the natural log transformation of SO2_GDP as the dependent variable, the LM test results reject the null hypothesis of no spatial lag and no error dependence, indicating that the spatial Durbin model (SDM) specification should be tested. However, the SDM is a general spatial model, which can be interpreted as a spatial autoregressive model (SAR) or a spatial error model (SEM), and we further perform the Wald test to determine the appropriate model (see details in Appendix). The Wald test of the spatial lag and spatial error indicates that both SAR and SEM are rejected, implying that the general SDM is the most proper model to describe the data [66]. Moreover, we execute the Hausman test to make a choice between the fixed and the random effects model and find that random effects should be considered in most cases of our study.

4.2.1.2. Strategic Interaction: RBD or RGD

Note that if the RBD argument is the case, it can be inferred that ρ should be positive and the PI should increase, indicating higher environmental costs. However, if the RGD is the case, ρ should also be positive, while the PI should decrease. Otherwise, if the regions perform different strategies and lack competition, ρ should be negative or statistically insignificant. The above logic enables us to observe the regional interactions and examine the proposed hypotheses. The primary interest of this paper is the spatial autoregressive coefficient ρ , which reveals the strategic interaction of samples. As shown in Table 5, the coefficients (ρ) in all models are significantly negative, which implies that the samples perform differentiation strategies. In sum, the RBD hypothesis is not supported at the national level, which is in line with the predictions from our theoretical analysis. Moreover, the RGD hypothesis is also not supported in the observation period of 2000–2013 at the national level.

4.2.1.3. Direct Effects of Environmental Regulation and Control Variables

The empirical studies relying on the simple spatial regression estimation (which is called point estimation by LeSage and Pace [33]) may lead to biased conclusions because they do not represent the marginal effect of a certain change in an independent variable [33,64]. LeSage and Pace suggested that a more appropriate way should be taken through direct, indirect, and total effects. The direct effects gauge the impact that a certain variation in an independent variable has on the dependent variable of a sample. The indirect effects examine the impact of a change in the independent variables of other provinces on the dependent variable of a certain province, and they are also known as spatial spillover effects. The total effects are the combination of direct effects and indirect effects [67]. Previous literature [67,68] provided the corresponding statistical test. The statistical significance of the direct and indirect effects is obtained by simulating the distribution using the variance-covariance matrix implied by the maximum likelihood estimated coefficients.
Table 5. Direct, indirect and total effects of full samples.
(1)(2)(3)(4)
ln_SO2_GDPln_COD_GDPln_Water_GDPln_Gas_GDP
Panel A: Direct Effects
ln_Sum_rule−0.535 *** (−3.997)0.325 (1.338)−0.488 *** (−3.421)0.162 (1.178)
ln_Regulator_perfirm0.230 *** (6.271)0.542 *** (7.992)0.088 ** (2.123)0.023 (0.618)
Inves_output0.061 (0.735)0.371 ** (2.330)0.181 * (1.865)0.048 (0.503)
S_college−0.006 (−0.817)0.005 (0.394)−0.024 *** (−3.198)−0.027 *** (−3.950)
ln_L−0.120 (−1.160)−0.466 ** (−2.624)0.165 (1.527)−0.200 ** (−2.461)
ln_GDPSK0.033 (0.458)0.142 (1.052)−0.038 (−0.411)−0.057 (−1.036)
ln_Engery_GDP0.832 *** (8.255)0.652 *** (3.783)0.784 *** (7.735)0.679 *** (7.057)
S_HI−1.205 *** (−4.181)−2.031 *** (−4.195)−0.719 ** (−2.380)0.335 (1.266)
S_SOE−0.359 ** (−2.422)−0.353 (−1.299)0.135 (0.828)−0.503 *** (−3.481)
ln_K_L−0.289 *** (−3.604)−0.323 ** (−2.186)−0.050 (−0.555)−0.065 (−0.873)
S_coal1.091 *** (4.035)1.412 *** (2.952)0.450 (1.476)0.555 ** (2.084)
Open0.017 (0.202)0.021 (0.135)−0.055 (−0.552)0.064 (0.747)
Panel B: Indirect Effects
ln_Sum_rule−1.686 (−1.576)5.632 *** (3.171)1.711 * (1.895)2.361 ** (2.377)
ln_Regulator_perfirm0.294 (1.499)0.044 (0.138)−0.394 ** (−2.304)0.429 ** (2.163)
Inves_output−0.639 (−1.425)−1.863 ** (−2.421)−0.734 * (−1.779)−0.920 * (−1.923)
S_college0.027 (1.090)−0.042 (−1.160)0.008 (0.398)0.036 (1.583)
ln_L−1.697 ** (−2.121)−4.311 *** (−3.487)0.678 (1.016)−0.782 (−1.170)
ln_GDPSK0.766 (1.671)1.011 (1.464)0.702 * (1.761)0.458 (1.234)
ln_Engery_GDP2.758 *** (3.474)0.523 (0.456)1.161 * (1.837)0.521 (0.709)
S_HI−17.277 *** (−6.535)−6.905 * (−1.979)−3.548 * (−1.969)−0.616 (−0.305)
S_SOE4.494 *** (4.364)1.099 (0.718)2.153 *** (2.685)−1.522 (−1.613)
ln_K_L−0.736 (−1.037)−4.458 *** (−3.888)−1.023 * (−1.731)−1.060 (−1.660)
S_coal4.268 ** (2.428)5.597 * (2.040)2.717 * (1.822)0.114 (0.065)
Open0.904 ** (2.311)2.094 *** (3.127)0.279 (0.821)0.170 (0.431)
Panel C: Total Effects
ln_Sum_rule−2.220 * (−1.958)5.958 *** (3.177)1.224 (1.286)2.523 ** (2.393)
ln_Regulator_perfirm0.523 ** (2.729)0.586 * (1.923)−0.306 * (−1.904)0.453 ** (2.347)
Inves_output−0.578 (−1.250)−1.492 * (−1.874)−0.553 (−1.330)−0.872 * (−1.768)
S_college0.021 (0.797)−0.038 (−0.952)−0.016 (−0.767)0.009 (0.366)
ln_L−1.816 ** (−2.129)−4.777 *** (−3.620)0.843 (1.202)−0.982 (−1.368)
ln_GDPSK0.800 * (1.766)1.153 * (1.733)0.664 * (1.793)0.401 (1.085)
ln_Engery_GDP3.590 *** (4.278)1.175 (0.973)1.945 *** (2.936)1.200 (1.549)
S_HI−18.482 *** (−6.811)−8.937 ** (−2.616)−4.268 ** (−2.451)−0.281 (−0.139)
S_SOE4.135 *** (3.854)0.746 (0.476)2.288 *** (2.794)−2.025 ** (−2.070)
ln_K_L−1.025 (−1.400)−4.781 *** (−4.064)−1.073 * (−1.793)−1.125 * (−1.707)
S_coal5.359 *** (2.909)7.009 ** (2.448)3.167 ** (2.055)0.669 (0.364)
Open0.921 ** (2.288)2.115 *** (3.139)0.224 (0.682)0.234 (0.592)
ρ −0.250 * (−1.867)−0.443 *** (−2.942)−0.628 *** (−4.071)−0.304 ** (−2.002)
Hausman test & p-value26.024 [0.406]18.493 [0.821]28.045 [0.306]22.324 [0.617]
Notes: 1. ***, ** or * denotes significance at the level of 1%, 5% or 10%, respectively. The t-values of coefficients are reported in the parentheses; 2. Considering the endogeneity between regulation intensity variables and the pollution intensity, as well as the time-lag effects of environmental regulation, we use a one-year lag of all the regulation intensity variables; 3. “ln_” indicates the form of the variables after a natural log transformation; 4. According to the Hausman test, the reported models (1)–(4) are random effects models, so the year and provincial fixed effects are not reported.
Table 5 summarizes the estimation results of the direct, indirect and total effects of regulation intensity variables and other control variables. We report the direct effects in a simple way based on Panel A. It shows that Sum_rule (in natural logarithm transformation with a one-year lag) is significantly and negatively associated with the PIs of SO2, suggesting that the higher number of local environmental bylaws and rules may help to decrease the PIs of SO2. However, it is not the case for the model using Gas_GDP (Model (4) in Table 5) as the dependent variable. As a whole, the above results indicate that environmental legislation is effective in reducing PI, i.e., curtailing the environmental costs, especially in the cases of regulated pollutants.
Regarding other environmental regulation variables, i.e., Regulator_perfirm and Inves_output, we have a surprising finding: No evidence supports the effectiveness of the environmental staff and the invested capital for the reduction of environmental costs. Among all models, the coefficients of Regulator_perfirm (in natural log form with a one-year lag) in most cases are significantly positive, except for Gas_GDP (see Table 5). We also perform the estimation only using Regulator_perfirm as the regulation variable and find that the results are robust. The comparison between western and eastern areas may help us understand the above counterintuitive results. The PI of the western area is higher (see Table 2) than that of the eastern area, and Regulator_perfirm in the western area is also relatively high (see Table 2 and Table 3), which leads to a positive correlation between the two variables. However, this result implies that the higher input of environmental human resources does not lead to a lower PI, although it is intuitive that higher Regulator_perfirm may help to reduce pollutant emissions. The result is meaningful for policymakers with the implication that increasing the number of environmental staff blindly may not be an effective strategy. Further measures should be taken to avoid overstaffing the environmental protection departments in the western area. We have similar findings for the variable of Inves_output (with a one-year lag), the coefficients of which are insignificant in most models, such as the model with SO2_GDP, although the coefficient is significant in the case of COD_GDP. The results are also understandable based on the fact that the Inves_output and PI of the western area are higher than those of the eastern area. Higher environmental capital investment does not lead to a lower PI, implying that environmental capital investment is inefficient in the western area of China.
The observation of the other variables may provide some evidence on the driving forces of PI. The S_college is significantly and negatively associated with PI in the models with Water_GDP or Gas_GDP, suggesting that informal regulation plays a positive role in environmental protection. The coefficients of L are significantly negative in the models with COD_GDP or Gas_GDP, indicating that the scale effect works for only two pollutants, i.e., COD and waste gas. The GDPSK is insignificantly associated with PI in all models, implying a weak connection between the intensity of economic activity and PI.
In regard to the technique effect, we find that the coefficients of Engery_GDP are significantly positive in all models. Note that a lower Engery_GDP is better, so the results indicate that higher energy efficiency will lead to better environmental performance.
While the results of the composition effects are mixed, the coefficients of S_HI are significantly negative in some models, such as those with COD_GDP or SO2_GDP, and they are insignificant in the other models. This result seems somewhat surprising and counterintuitive because the results indicate that a high share of heavy industrial output in total industrial output may be associated with a lower PI in terms of COD and SO2. However, this behavior is understandable for two reasons: The first one is related to the environment-economic indicator, i.e., the PI we used as the dependent variable. Although heavy industry causes a lot of pollution, it is also currently a major source of GDP in China, which means that both the numerator and denominator of the PI may be high. Therefore, the PI may not be high, which results in the outcome that a large share of heavy industrial output may not lead to a high PI. The second reason is that those pollutants mainly generated by heavy industry have obligatory emission reduction targets, which means that governments have to exert stringent environmental standards on them. The combination of these two reasons may cause the result of PI being negative with the variable (S_HI).
The coefficients of S_SOE are also negative in some models such as those with SO2_GDP or Gas_GDP, hinting that SOEs are positive with pollutant abatement. Because SOEs are nationally owned in China, the country will pay for the costs of environmental governance. The managers of SOEs will gain political records by better performance of environmental governance, and they do not pay for it. Therefore, managers are motivated to invest in the environment and execute stringent environmental standards to reduce pollution. The SOEs may have less negative environmental impact than private firms or others, which causes the phenomenon that the higher the proportion of SOE in a region, the lower the PI may be.
However, it is interesting that the role of K_L is two-sided and depends on whether the pollutants are constrained by emission reduction targets. The coefficients are significantly negative in the models using regulated pollutant variables (SO2_GDP and COD_GDP) as the dependent variables separately, while they are insignificantly negative in the models with unregulated ones (Water_GDP and Gas_GDP).
Moreover, S_coal is positively associated with the PI in most models except the model using Water_GDP as the dependent variable, which supports the consensus that coal consumption is one of the most predominant sources of severe pollution problems in China. In the end, the coefficients of Open are insignificant, indicating that the regional openness has little influence on the PI.
In short, we find strong evidence that technical progress in energy utilization and endowment structure are the important driving forces to lower environmental costs in terms of most pollutants. We also find that the informal environmental regulation, scale effects, economic agglomeration and property right structure have positive effects on the decrease of the PI of some pollutants. In addition, the effectiveness of environmental regulation variables relies on the variety of the pollutants, which implies that the heterogeneity related to pollutant emission regulation does matter to some extent.

4.2.1.4. Spillover Effects and Total Effects of Environmental Regulation

Panel B of Table 5 reports the estimation results of the spillover effects. We focus on the spillover effects of the regulation intensity variables. The coefficients of Sum_rule are significantly positive in the models using Water_GDP or Gas_GDP as the dependent, which indicates that the local PI is negatively influenced by environmental legislation of adjacent regions, especially for those related to regulated pollutants. The coefficients of Regulator_perfirm are significantly negative only in the model with Water_GDP and significantly positive in the model with Gas_GDP. It implies that the large scale of input on the environmental human resources in the contiguous regions may lead to a low PI of waste water in the local region, while it is the opposite for the PI of waste gas. In addition, the coefficients of Inves_output are significantly negative in most models except the model with SO2_GDP, which indicates that environmental investment in the adjacent regions may help to lower the PIs of COD, waste water and waste gas in the local region. The above results reveal that the input of neighboring regions on the environmental capital investment shows effective spillover effects in reducing the PI of the local region. In all, the spillover effects also rely on the types of environmental intensity variables and the pollutants observed in the models.
With respect to the total effects, we have mixed findings (see Panel C of Table 5). The coefficient of Sum_rule is significantly negative in the model with SO2_GDP, while it is significantly positive in the model using Gas_GDP as the dependent. The results indicate that the environmental legislation exerts a positive influence on the PI of regulated pollutants, such as SO2. The coefficients of Regulator_perfirm are significantly positive in most models, such as those with the SO2_GDP or COD_GDP, indicating the overstaffing of environmental human resources. In addition, the total effects of Inves_output are significantly negative in the models with COD_GDP or Gas_GDP, which shows that it helps to lower the PI in terms of total effects. The above results indicate that the environmental protection institutions and the capital invested for environmental protection are more effective in reducing PI, while the input in environmental human resources is inefficient.

4.2.2. Results of Subsamples: Different Areas

We divide the samples into three groups according to the geographic location. The first one lies in the west of China and includes 11 provincial units, while the second lies in the east and includes 11 provincial units. Another one with only 8 provinces refers to the central area of China. The western regions are undeveloped, while the eastern regions are relatively developed. In addition, the economic development level of the central ones is between those of the former two. The western and eastern groups provide us with good samples to test for the existence of RBD or RGD. We carry out test procedures and find that the SDM is the most proper one. Table 6 reports the spatial autoregressive coefficient ρ in the western area and the eastern area (see details of the models in Appendix). For the western area, ρ is significantly negative in most models except the model using Gas_GDP as the dependent (the ρ of which is insignificantly negative), indicating that the samples perform differentiation strategies. This finding does not support the conjecture that undeveloped regions are inclined to the RBD.
Table 6. The ρ in different areas.
(1)(2)(3)(4)
ln_SO2_GDPln_COD_GDPln_Water_GDPln_Gas_GDP
National−0.250 * (−1.867)−0.443 *** (−2.942)−0.628 *** (−4.071)−0.304 ** (−2.002)
Western−0.491 *** (−4.839)−0.683 *** (−6.638)−0.599 *** (−5.729)−0.145 (−1.338)
Central−0.121 (−1.321)0.119 (1.414)0.075 (0.875)−0.198 ** (−2.342)
Eastern0.212 *** (2.830)0.157 ** (1.984)0.077 (0.965)−0.062 (−0.745)
Notes: ***, ** or * denotes significance at the level of 1%, 5% or 10%, respectively. “ln_” indicates the form of the variables after a natural log transformation.
For the eastern area, ρ is significantly positive in the models with SO2_GDP or COD_GDP, indicating that the samples perform similar strategies in regional competition. Combined with the decreasing PIs of the three pollutants shown in Table 2, there is some evidence to support the RGD hypothesis in the east of China. However, China’s central government set up targets on the abatement of the SO2 and COD, i.e., respectively 10% decrease of those two pollutants in 2010 compared with the scale in 2005. The targets were assigned to provincial units, which could bring top-down pressure to the samples. On the one hand, the competition among regions and the desire for environmental protection will bring bottom-up pressure to the local governments, which should be a source of RGD. However, on the other hand, if the decrease in emissions is dominated by top-down pressure, i.e., mandatory orders from the central government, similar strategies taken by the eastern provinces would no longer show enough evidence to support RGD. To figure out this issue, we compute the growth rate of the emission volumes of the three pollutants (see Table 7) since 2005. The average annual growth rates of SO2 and COD in the eastern area are −2.0% and −4.7%, respectively, since 2005, and their cumulative growth rates are −21.8% and −26.2% during the period of 2006–2010. The cumulative decrement rates of emissions are far more than the assigned targets (10%), which implies that there is an abatement competition on some related pollutants in the eastern area. This finding also provides stronger evidence to support the RGD argument in the developed regions, as proposed in the theoretical analysis.
Table 7. Growth of some industrial pollutants since 2005.
All SamplesEastern Samples
Yearly GrowthCumulative Growth since 2005Yearly GrowthCumulative Growth since 2005
SO2CODSO2CODSO2CODSO2COD
200514.6%8.8%--10.6%10.0%--
20063.0%−2.6%3.0%−2.6%−1.3%−6.8%−1.3%−6.8%
2007−4.1%−5.4%−1.3%−7.9%−5.2%−7.1%−6.4%−13.4%
2008−6.9%−10.5%−8.2%−17.5%−8.5%−16.0%−14.3%−27.2%
2009−6.3%−3.9%−13.9%−20.7%−7.7%−1.9%−21.0%−28.6%
2010−0.1%−1.1%−14.0%−21.6%−1.1%3.3%−21.8%−26.2%
20118.2%−18.4%−7.0%−36.0%6.7%−15.3%−16.5%−37.5%
2012−5.2%−4.6%−11.8%−39.0%−5.7%−2.3%−21.3%−39.0%
2013−4.0%−5.6%−15.4%−42.4%−5.6%−6.3%−25.7%−42.8%
Average−0.1%−4.8% −2.0%−4.7%
However, it is worth noting that ρ is insignificant in the models with unregulated pollutants, such as waste water or waste gas, implying that the RGD argument is not supported in those cases. Therefore, we may conclude that the achievement in the emission abatement of the eastern provinces is associated with both the top-down pressure from the central government and the competition pressure from adjacent regions. Therefore, the adjacent competition mechanism has proven to be effective in such cases.
To check the robustness of our findings, this paper performs two tests as follows. First, we use a two-year lag of environmental regulation variables in robustness tests instead of a one-year lag. We find that the regression results are essentially in agreement with those that have been reported in previous sections (the results of the robustness tests are not reported due to space limitations but are available upon request). Second, we replace the adjacent weights matrix with the inverse distance weights matrix. Basically, it shows that the results in the previous sections are robust. Our result is consistent with LeSage and Pace [34] and indicates the specification of the spatial weights matrix should have no effect on the effects estimates.

5. Conclusions

In contrast to previous studies that focused on either environmental or economic enforcement in regional competition, this paper focuses on the results of competition in a comprehensive way. Using an environment-economic indicator, we study how the interaction of regions influences the balance of economic growth and environmental protection in China based on the proposed RBD and RGD hypotheses. Noticing that the empirical results of arguments regarding the RBD or RGD in China may rely on the heterogeneity of pollutants and regions, we differentiate two types of industrial pollutants and test the hypotheses. Our results contribute to the literature in three ways. First, the RBD is not the case at the national level, and provincial governments do perform different strategies for environmental protection in China. We suggest that this result should be due to the heterogeneity among regions in the largest developing country. Second, the RGD hypothesis is supported in the eastern area; however, this result is only the case for pollutants with obligatory emission reduction targets, such as SO2 and COD. The results imply that the selective competition mechanism has been established in China. In the end, we cast new light on the driving forces of environmental costs. Although, on average, the national PI has decreased and environmental performance has improved, we find that some methods of environmental regulation have contributed little to these achievements. In particular, the current environmental staff and capital investment for environmental protection do not lead to better environmental performance. Only increasing environmental legislation has been effective in reducing PI, especially for pollutants with obligatory reduction targets.
The previously mentioned empirical results offer some implications for policymakers. The existence of the RGD may lead to better balance of environment and economy. However, in China, it is the case only for pollutants with obligatory emission reduction targets in the developed eastern regions, which implies that top-down pressure from the central government is necessary right now. To achieve quick improvements in environmental protection, a combination of top-down pressure from the central government and bottom-up pressure from adjacent competitors may be a more effective approach. On the other hand, more attention should be paid to the pollutants whose emission volumes have been growing fast in recent years, such as waste gas. The control of toxic components such as SO2 does not guarantee that the emissions of all toxic components will be reduced. Therefore, establishing obligatory abatement targets for pollutants such as waste gas and waste water should be considered. The effectiveness of environmental regulation should also be reexamined. We find that Chinese regional environmental staff and capital investment have not exerted powerful effects in environmental protection thus far, which implies a low efficiency of human resources and capital investment in China. However, this also implies that the potential of these two inputs could be more fully explored for pollutant abatement.
As stated in our analysis, the concepts of green and black development incorporate economic and environmental elements. Therefore, future research with a more systematic analysis of RBD or RGD is warranted as it might be inadequate just from the perspective of pollution intensity in this paper. Furthermore, a data-driven approach proposed by Piribauer [69] to treat structural heterogeneity in spatial autoregressive models could be considered as a future extension of the research. In the end, to provide more robust and fruitful results, city-level data and other environmental regulation variables should be examined in further studies.

Acknowledgments

The authors sincerely appreciate the helpful comments on the early drafts of this paper offered by the two anonymous referees. All remaining errors are the authors’. The research in this paper is jointly funded by the National Natural Science Foundation of China (41571524; 41461118), National Social Science Foundation of China (14ZDB144) and CICSU Collaborative Innovation Center for the Development of Modern Services and New Urbanization in Hunan Province.

Author Contributions

All authors conceived and designed the research. Jiejin Xia collected and processed the data. Jianhuan Huang performed the theoretical analysis, analyzed the data, and wrote the manuscript.

Conflicts of Interest

The authors declare no conflict of interest.

Appendix

A1. The Determinants of Environmental Costs of Economic Growth

We suppose that the economic production takes the Cob-Douglas production function as follows:
Y = A K α L δ
where Y is the economic output of a region; K and L represent capital stock and labor employed, respectively; A is the total factor productivity; α and δ are related coefficients.
As analyzed in Subsection 3.2.2, the pollutant emission is a function of the scale effect (SE), the technique effect (TE), the composition effect (CE) and environmental regulation (ER). Therefore, we have:
E = e ( ER , SE , TE , CE , )
where ϕ refers to other determinants. Combining Equations (A1) and (A2), we have:
P I = E Y = e ( E R , S E , C E , T E , ϕ ) A K α L δ
Supposing the function of E takes the form of the log-linear model, we have:
ln ( P I ) = β 1 ln ( E R ) + β 2 ln ( S E ) + β 3 ln ( T E ) + β 4 ln ( C E ) ln ( A ) α ln ( K / L ) ( α + δ ) ln ( L ) + ε = β 0 + β 1 ln ( E R ) + β 2 ln ( S E ) + β 3 ln ( T E ) + β 4 ln ( C E ) + β 5 ln ( L ) + β 6 ln ( K / L ) + ε
where β k (k = 1, 2, …, 6) are the coefficients, and β 0 = ln ( A ) , β 5 = ( α + δ ) , β 6 = α . We regard L (labor) as a measure of the scale effect, while K/L (capital-labor ratio) is a measure of the composition effect. Then the variables of the determinants can be written as follows:
β X i t = β 1 ln ( E R i t ) + β 2 ln ( S E i t ) + β 3 ln ( T E i t ) + β 4 ln ( C E i t )

A2. Spatial Econometric Models and the Specification Test

To observe the spatial interaction effects of the economic phenomenon, many methods were suggested in previous literature. Among them, Moran’s I [64] and Geary’s C [65] are widely used. If the key variable is spatially auto-correlated significantly, further tests should be taken for choosing proper econometric models. To a space-time model with a panel of N observations over T time periods, the panel form of the general nesting spatial model (GNS) with spatial specific and time-period specific effects is as follows [32,33]:
y i t = a + ρ j = 1 , i j N w i j y j t + β X i t + θ j = 1 , i j N w i j X j t + s i + u t + ε i t
ε i t = λ j = 1 , i j N w i j ε j t + ξ i t
where α is the constant term and ρ is the spatial autoregressive coefficient, while θ , β and λ represent fixed but unknown parameters; λ is the coefficient of the spatial error term; w i j denotes the weight describing the spatial arrangement of the samples. This paper uses the spatial adjacent matrix, i.e., w i j = 1 , if two provinces share a common border and zero otherwise. Then the spatial weights matrix W is row-stochastic and the row-sums of W equal unity. S i is regional fixed effects and u t is time fixed effects, while εit is the error term.
The most frequently used panel models are the special cases of GNS. When λ = 0 and ρ θ 0 , GNS turns to the spatial Durbin model (SDM). When ρ = 0 and λ θ 0 , the model turns to the spatial Durbin error model (SDEM). When λ θ = 0 and ρ 0 , the model takes the form of the spatial autoregressive model (SAR). When λ = 0 ρ 0 and θ = ρ β , the model turns to the spatial error model (SEM). When λ ρ = 0 and θ 0 , it turns to the spatial lag of X model (SLX). In the end, when λ ρ θ = 0 , the model turns to the general panel model without spatial interaction effects as follows:
y i t = a + β X i t + s i + u t + ε i t
The final selected form of model is determined by a series of statistical tests using the data of the empirical study as follows.
According to Florax et al. [70], Mur and Angula [71] and Elhorst [66], we adopt the following test procedure to figure out the most proper model to describe the quantitative relationship among data.
(i)
Estimate the panel model without spatial interaction effects (Equation (A8)). We use the classic LM test proposed by Anselin [32], as well as the robust LM test proposed by Anselin et al. [72], to verify the existence of spatial error effect ( L M   E ) or spatial lag effect ( L M   L ), and then turn to step (ii) if the results reject the hypothesis H0 that assumes the absence of spatial interaction effects; otherwise, turn to step (iii).
(ii)
Estimate the panel SDM model (Equation (A6)). We test hypotheses H 0 1 : θ = 0 and H 0 2 : θ = ρ β . If hypothesis H0 in step (i) is rejected and both these two hypotheses are also rejected, then the SDM is the most suitable method to characterize the data. If hypothesis H0 of L M   L and hypothesis H 0 1 : θ = 0 cannot be rejected, then the spatial autoregressive model is the most proper method to describe the data. If hypothesis H0 of L M   E and hypothesis H 0 2 : θ = ρ β cannot be rejected, then the spatial error model is the most appropriate. In addition to the above three kinds of possibilities, SDM should be adopted to get robust results.
(iii)
Estimate the SLX model, i.e., add the term θ j = 1 , i j N w i j X j t to Equation (A8), and test hypothesis H 0 : θ = 0 . If the hypothesis cannot be rejected, then the model without spatial interaction effects is the best. Otherwise, the SLX is the proper one.

A3. Tables

Table A1. Variables and their measures.
VariableMeasureAbbr.
Dependent variablePollution intensityThe ratio of pollutant emission volumes over economic output (GDP)PI
Key independent variableLocal environmental bylaws and rulesThe number of local environmental bylaws and rulesSum_rule
Staff of environmental protection departments per firmThe number of employees in the environmental protection departments per industrial firm above the designated sizeRegulator_perfirm
Investment in treating industrial pollutionThe investment in the treatment of industrial pollution per capita industrial outputInves_output
Control VariableInformal regulationThe share of people with the college degree or above in the populationS_college
Capital intensityThe ratio of gross fixed capital per workerK_L
LaborTotal number of employeesL
GDP per square kilometerGross domestic product per square kilometer of urban landsGDPSK
Energy consumption intensityEnergy consumption per capita GDPEngery_GDP
Property structureShare of industrial output generated by state-owned enterprises (SOEs)S_SOE
Industrial structureShare of heavy industrial output in the whole industrial outputS_HI
Energy structureShare of coal in energy consumptionS_coal
OpennessThe ratio of total export-import volumes over GDPOpen
Table A2. Variables and data sources.
VariableDefinition/Source
PIPollution intensity, the ratio of pollutant emission volumes to GDP.
GDPAt 2000 constant price. The data source is the China Statistical Yearbook for Regional Economy, 2001–2014.
Engery_GDPEnergy consumption per capita GDP. The data of energy consumption is from the China Energy Statistical Yearbook, 2001–2014.
LLabor. The data is from the China Statistical Yearbook, 2001–2014.
K_LThe ratio of capital to labor. The amount of capital is computed with fixed capital using the perpetual inventory method. The data comes from the China Statistical Yearbook, 2001–2014 and the China Compendium of Statistics (1949–2008). At 2000 constant price.
GDPSKGDP per square kilometer of urban lands. The data comes from the China Statistical Yearbook for Regional Economy, 2001–2014.
S_HIShare of heavy industrial output in GDP. The data is from the China Industrial Economy Statistical Yearbook, 2001–2013.
S_coalShare of coal in the total energy consumption. The data is from the China Industrial Economy Statistical Yearbook, 2001–2014.
S_SOEShare of industrial output generated by SOEs. The data is from the China Industrial Economy Statistical Yearbook, 2001–2014.
OpenThe ratio of total export-import volumes over GDP. The source is the China Statistical Yearbook for Regional Economy, 2001–2014.
Table A3. Correlation of dependent variables.
ln_SO2_GDPln_COD_GDPln_Water_GDPln_Gas_GDP
ln_SO2_GDP1
ln_COD_GDP0.8061
ln_Water_GDP0.6590.8431
ln_Gas_GDP0.7150.4930.2671
Notes: It shows that there are high correlations among most of the dependent variables. “ln_” indicates the form of the variables after a natural log transformation.
Table A4. Correlation of independent variables.
ln_Sum_ruleln_Regulator_perfirmInves_outputS_collegeln_Lln_K_Lln_Engery_GDPS_SOEln_GDPSKS_HIS_coal
ln_Regulator_perfirm−0.1681
Inves_output−0.2070.3771
S_college0.236−0.411−0.3371
ln_L0.373−0.229−0.22−0.2671
ln_K_L0.315−0.384−0.450.778−0.3111
ln_Engery_GDP−0.1410.6330.552−0.346−0.37−0.3191
S_SOE−0.4150.6340.48−0.164−0.441−0.4120.5931
ln_GDPSK0.356−0.73−0.4410.5630.3020.516−0.706−0.6761
S_HI0.02940.3860.2040.314−0.4540.2720.5480.443−0.2591
S_coal0.1290.3470.329−0.4680.271−0.4250.5410.123−0.3140.0271
Open0.134−0.694−0.2920.622−0.06770.492−0.553−0.3690.683−0.139−0.595
Notes: We use the natural log transformation for most variables in the estimation except those structural/proportional indicators such as S_coal, S_SOE and S_HI, etc. It shows that there are low correlations among the independent variables. For example, the maximum correlation coefficient is 0.778 between ln_K_L and S_college, which is smaller than 0.8. Therefore, we use all the independent variables at the same time in the empirical estimation.
Table A5. Estimated results for total regions (point estimation).
(1)(2)(3)(4)
ln_SO2_GDPln_COD_GDPln_Water_GDPln_Gas_GDP
ln_Sum_rule−0.565 *** (−3.935)0.502 * (1.909)−0.405 ** (−2.558)0.209 (1.481)
ln_Regulator_perfirm0.237 *** (6.543)0.544 *** (8.170)0.067 * (1.687)0.031 (0.852)
Inves_output0.053 (0.604)0.307 * (1.887)0.147 (1.538)0.026 (0.274)
S_college−0.005 (−0.708)0.004 (0.293)−0.024 *** (−3.196)−0.026 *** (−3.862)
ln_L−0.142 (−1.330)−0.609 *** (−3.206)0.198 (1.599)−0.219 ** (−2.525)
ln_GDPSK0.043 (0.581)0.171 (1.338)−0.008 (−0.089)−0.045 (−0.873)
ln_Engery_GDP0.878 *** (8.706)0.670 *** (3.608)0.833 *** (7.519)0.694 *** (6.834)
S_HI−1.483 *** (−5.685)−2.264 *** (−4.737)−0.878 *** (−3.077)0.328 (1.251)
S_SOE−0.300 ** (−2.004)−0.318 (−1.156)0.233 (1.433)−0.537 *** (−3.456)
ln_K_L−0.296 *** (−3.597)−0.470 *** (−3.144)−0.098 (−1.059)−0.089 (−1.185)
S_coal1.161 *** (4.141)1.595 *** (3.118)0.590 * (1.895)0.554 ** (2.078)
Open0.033 (0.394)0.089 (0.571)−0.039 (−0.419)0.066 (0.785)
W×ln_Sum_rule−2.224 * (−1.749)7.869 *** (3.393)2.441 * (1.740)2.993 ** (2.404)
W×ln_Regulator_perfirm0.420 * (1.762)0.316 (0.716)−0.554 ** (−2.155)0.551 ** (2.263)
W×Inves_output−0.747 (−1.355)−2.420 ** (−2.370)−1.045 * (−1.746)−1.141 * (−1.924)
W×S_college0.031 (1.094)−0.058 (−1.109)−0.003 (−0.106)0.037 (1.288)
W×ln_L−2.060 ** (−2.218)−6.250 *** (−3.719)1.193 (1.134)−1.102 (−1.319)
W×ln_GDPSK0.929 * (1.793)1.498 (1.601)1.069 * (1.809)0.592 (1.294)
W×ln_Engery_GDP3.527 *** (3.984)1.072 (0.663)2.287 ** (2.347)0.901 (1.033)
W×S_HI−21.333 *** (−8.550)−10.672 ** (−2.344)−5.943 ** (−2.165)−0.733 (−0.302)
W×S_SOE5.358 *** (4.635)1.321 (0.619)3.452 *** (2.733)−2.051 * (−1.690)
W×ln_K_L−0.952 (−1.160)−6.414 *** (−4.265)−1.626 * (−1.789)−1.413 * (−1.801)
W×S_coal5.514 ** (2.510)8.402 ** (2.098)4.545 * (1.919)0.422 (0.195)
W×Open1.123 ** (2.420)2.946 *** (3.443)0.406 (0.802)0.244 (0.502)
ρ −0.250 * (−1.867)−0.443 *** (−2.942)−0.628 *** (−4.071)−0.304 ** (−2.002)
R-squared0.9650.9090.9070.920
Corr-squared0.8080.5860.3560.812
Log-likelihood129.809128.43287.211114.140
LM test for no spatial lag & p-value46.798 *** [0.000]1.195 [0.274]8.332 *** [0.004]0.503 [0.478]
Robust LM test for no spatial lag & p-value53.505 *** [0.000]49.706 *** [0.000]32.429 *** [0.000]4.001 ** [0.045]
LM test for no spatial error & p-value4.962 ** [0.026]11.139 *** [0.001]0.415 [0.519]9.074 *** [0.003]
Robust LM test for no spatial error & p-value11.670 *** [0.001]59.650 *** [0.000]24.512 *** [0.000]12.572 *** [0.000]
Wald spatial lag test & p-value127.731 *** [0.000]71.717 *** [0.000]53.554 *** [0.000]26.613 *** [0.009]
Wald spatial error test & p-value128.370 *** [0.000]65.948 *** [0.000]48.717 *** [0.000]28.833 *** [0.004]
Hausman test & p-value26.024 [0.406]18.493 [0.821]28.045 [0.306]22.324 [0.617]
Notes: 1. ***, ** or * denotes significance at the level of 1%, 5% or 10%, respectively. The t-values of coefficients are reported in the parentheses; 2. Considering the endogeneity between regulation intensity variables and the pollution intensity as well as the time-lag effects of environmental regulation, we use a one-year lag of all the regulation intensity variables; 3. “ln_” indicates the form of the variables after a natural log transformation; 4. According to the Hausman test, models (1)–(4) are random effects models, so the year and provincial fixed effects are not reported. Meanwhile the constant term is not reported.

References

  1. Zheng, X.Y.; Yu, Y.H.; Wang, J.; Deng, H.H. Identifying the determinants and spatial nexus of provincial carbon intensity in China: A dynamic spatial panel approach. Reg. Environ. Chang. 2014, 4, 1651–1661. [Google Scholar] [CrossRef]
  2. Li, H.B.; Zhou, L.A. Political turnover and economic performance: The incentive role of personnel control in China. J. Public Econ. 2005, 89, 1743–1762. [Google Scholar] [CrossRef]
  3. Yang, H.S.; Chen, S.L.; Zhou, Y.Z. Local Government Competition and Environmental Policy––Empirical Evidence from Province’s Governments in China. South China J. Econ. 2008, 6, 15–30. (In Chinese) [Google Scholar]
  4. Zhang, W.B.; Zhang, L.F.; Zhang, K.Y. The competition form and evolution of China’ provincial environmental regulation intensity––Based on the analysis of a two-regime spatial Durbin model with fixed effects. Manag. World 2010, 12, 34–44. (In Chinese) [Google Scholar]
  5. Li, S.L.; Chu, S.B.; Shen, C. The competition of local governments, the environmental regulation and regional ecological efficiency. World Econ. 2014, 4, 88–110. (In Chinese) [Google Scholar]
  6. Devereux, M.P.; Lockood, B.; Redoano, M. Horizontal and vertical indirect tax competition: Theory and some evidence from the USA. J. Public Econ. 2007, 91, 451–479. [Google Scholar] [CrossRef]
  7. Albert, S.-O. Expenditure spillovers and fiscal interactions: Empirical evidence from local governments in Spain. J. Urban Econ. 2006, 59, 32–53. [Google Scholar]
  8. Agrawal, D.R. The tax gradient: Spatial aspects of fiscal competition. Am. Econ. J. Econ. Policy 2015, 2, 1–30. [Google Scholar] [CrossRef]
  9. Emilie, C.; Martial, F.; Gregoire, R. Decentralization in Africa and the nature of local governments’ competition: Evidence from Benin. Int. Tax Public Financ. 2015, 22, 1048–1076. [Google Scholar]
  10. Wang, W.J.; Zhang, J.T.; Qin, C.L. Fiscal Decentralization, Competition between Local Governments, and the Economic Growth of FDI. Manag. World 2007, 3, 13–23. (In Chinese) [Google Scholar]
  11. Emilie, C. Yardstick competition in a federation: Theory and evidence from China. China Econ. Rev. 2012, 23, 878–897. [Google Scholar]
  12. Yu, Y.H.; Zhang, L.; Li, F.H.; Zheng, X.Y. On the determinants of public infrastructure spending in Chinese cities: A spatial econometric perspective. Soc. Sci. J. 2011, 3, 458–467. [Google Scholar] [CrossRef]
  13. He, L.; Bao, X. Fiscal Expenditure Competition of China’s Local Governments: The Characteristics and Its Effects on Capital Allocation. Int. J. u- e-Serv. Sci. Technol. 2015, 2, 91–100. [Google Scholar]
  14. Ebeid, M.; Rodden, J. Economic Geography and Economic Voting: Evidence from the US States. Br. J. Political Sci. 2006, 36, 527–547. [Google Scholar] [CrossRef]
  15. Engel, K.H. State Environmental Standard-Setting: Is There a “Race” and Is It “To the Bottom”? Hastings Law J. 1997, 48, 271–398. [Google Scholar]
  16. Vogel, D. Trading up: Consumer and Environmental Regulation in a Global Economy; Harvard University Press: Cambridge, MA, USA, 1995. [Google Scholar]
  17. Meyer, S.M. The Economic Impact of Environmental Regulation. J. Environ. Law Pract. 1995, 3, 4–15. [Google Scholar]
  18. Konisky, D.M. Regulatory Competition and Environmental Enforcement: Is There a Race to the Bottom? Am. J. Political Sci. 2007, 51, 853–871. [Google Scholar] [CrossRef]
  19. Konisky, D.M. Inequities in Enforcement? Environmental Justice and Government Performance. J. Policy Anal. Manag. 2009, 28, 102–121. [Google Scholar] [CrossRef]
  20. Wilson, J.D. Capital Mobility and Environmental Standards: Is There a Theoretical Basis for a Race to the Bottom? MIT Press: Cambridge, MA, USA, 1996; pp. 393–427. [Google Scholar]
  21. Woods, N.D. Interstate Competition and Environmental Regulation: A Test of the Race-to-the-Bottom Thesis. Soc. Sci. Q. 2006, 87, 174–189. [Google Scholar] [CrossRef]
  22. Fredriksson, P.G.; Millimet, D.L. Strategic Interaction and the Determination of Environmental Policy across U.S. States. J. Urban Econ. 2002, 51, 101–122. [Google Scholar] [CrossRef]
  23. Li, Y.Y.; Shen, K.R. The reduction effect of pollution control policy in China––Based on the empirical analysis of provincial industrial pollution data. Manag. World 2008, 7, 7–17. (In Chinese) [Google Scholar]
  24. Hu, A.G. Innovating Green Development in China; China Renmin University Press: Beijing, China, 2012. (In Chinese) [Google Scholar]
  25. Xu, G.Y. The Paradigm Transition from Black Development to Green Development. West Forum 2014, 1, 53–60. (In Chinese) [Google Scholar]
  26. Du, M.Z.; Wang, B.; Wu, Y.R. Sources of China’s economic growth: An empirical analysis based on the BML index with green growth accounting. Sustainability 2014, 6, 5983–6004. [Google Scholar] [CrossRef]
  27. Zhou, L.A.; Tao, J. Government Size, Market Development and Corruption. Econ. Res. J. 2009, 1, 57–69. (In Chinese) [Google Scholar]
  28. Song, M.L.; Song, Y.Q.; An, Q.X.; Yu, H.Y. Review of environmental efficiency and its influencing factors in China: 1998–2009. Renew. Sustain. Energy Rev. 2013, 20, 8–14. [Google Scholar] [CrossRef]
  29. Vogel, D. Environmental Regulation and Economic Integration. J. Int. Econ. Law 2000, 3, 265–279. [Google Scholar] [CrossRef]
  30. The Tenth Five-year Plan Outline of National Economic and Social Development of the People’s Republic of China. Available online: http://www.npc.gov.cn/wxzl/gongbao/2001-03/19/content_5134505.htm (accessed on 15 March 2001).
  31. The Eleventh Five-year Plan Outline of National Economic and Social Development of the People’s Republic of China. Available online: http://www.gov.cn/gongbao/content/2006/content_268766.htm (accessed on 14 March 2006).
  32. Anselin, L. Lagrange multiplier test diagnostics for spatial dependence and spatial heterogeneity. Geogr. Anal. 1988, 20, 1–17. [Google Scholar] [CrossRef]
  33. LeSage, J.; Pace, R.K. Introduction to Spatial Econometrics; Chapman & Hall/CRC: Boca Raton, FL, USA, 2009. [Google Scholar]
  34. LeSage, J.P.; Pace, R.K. The biggest myth in spatial econometrics. Econometrics 2014, 2, 217–249. [Google Scholar] [CrossRef]
  35. Elhorst, J.P. Spatial Panel Data Models. In Handbook of Applied Spatial Analysis; Fischer, M.M., Getis, A., Eds.; Springer: New York, NY, USA, 2010; pp. 377–407. [Google Scholar]
  36. Stiebale, J. Do financial constraints matter for foreign market entry? A firm-level examination. World Econ. 2011, 34, 123–153. [Google Scholar] [CrossRef]
  37. Vergara, R. Taxation and private investment: Evidence for Chile. Appl. Econ. 2010, 42, 717–725. [Google Scholar] [CrossRef]
  38. Jesús, C.C.; Martin, F. Spatial filtering, model uncertainty and the speed of income convergence in Europe. J. Appl. Econom. 2013, 28, 720–741. [Google Scholar]
  39. Piribauer, P.; Manfred, M.F. Model uncertainty in matrix exponential spatial growth regression models. Geogr. Anal. 2015, 47, 240–261. [Google Scholar] [CrossRef]
  40. Cole, M.A.; Elliott, R.J.R. Determining the trade––Environment composition effect: The role of capital, labor and environmental regulations. J. Environ. Econ. Manag. 2003, 46, 363–383. [Google Scholar] [CrossRef]
  41. Michael, T.R. Pollution Intensity of GDP and Trade Policy: Can the World Bank Be Wrong? World Dev. 1996, 24, 471–479. [Google Scholar]
  42. Maria, L. Economic structure and pollution intensity within the environmental input-output framework. Energy Policy 2007, 35, 3410–3417. [Google Scholar]
  43. Wursthorn, S.; Poganietz, W.-R.; Schebek, L. Economic-environmental monitoring indicators for European countries: A disaggregated sector-based approach for monitoring eco-efficiency. Ecol. Econ. 2011, 70, 487–496. [Google Scholar] [CrossRef]
  44. Holdren, J.P.; Ehrlich, P.R. Human Population and the Global Environment: Population growth, rising per capita material consumption and disruptive technologies have made civilization a global ecological force. Am. Sci. 1974, 62, 282–292. [Google Scholar] [PubMed]
  45. Grossman, G.M.; Krueger, A.B. Economic growth and the environment. Q. J. Econ. 1995, 110, 353–377. [Google Scholar] [CrossRef]
  46. He, J. Pollution haven hypothesis and environmental impacts of foreign direct investment: The case of industrial emission of sulfur dioxide (SO2) in Chinese provinces. Ecol. Econ. 2006, 60, 228–245. [Google Scholar] [CrossRef]
  47. Mu, Z.L.; Bu, S.C.; Xue, B. Environmental legislation in China: Achievements, challenges and trends. Sustainability 2014, 6, 8967–8979. [Google Scholar] [CrossRef]
  48. Yuan, Y.J.; Xie, R.H. Research on the effect of environmental regulation to industrial restructuring––Empirical test based on provincial panel data of China. China Ind. Econ. 2014, 8, 57–69. (In Chinese) [Google Scholar]
  49. Wang, D.T.; Chen, W. Foreign direct investment, institutional development and environmental externalities: Evidence from China. J. Environ. Manag. 2014, 135, 81–90. [Google Scholar] [CrossRef] [PubMed]
  50. Luo, N.S.; Li, J.J.; Luo, F.Z. Empirical Analysis on the Relationship between the China Urbanization and Regional Eco-efficiency. China Popul. Resour. Environ. 2013, 23, 53–60. (In Chinese) [Google Scholar]
  51. Wang, B.; Wu, Y.R.; Yan, P.F. Environmental Efficiency and Environmental Total Factor Productivity Growth in China’s Regional Economies. Econ. Res. J. 2010, 5, 95–109. (In Chinese) [Google Scholar]
  52. Cole, M.A.; Elliott, R.J.R. FDI and the Capital Intensity of “Dirty” Sectors: A Missing Piece of the Pollution Haven Puzzle. Rev. Dev. Econ. 2005, 9, 530–548. [Google Scholar] [CrossRef]
  53. Chen, S.Y. The evaluation indicator of ecological development transition in China’s regional economy. Ecol. Indic. 2015, 51, 42–52. [Google Scholar] [CrossRef]
  54. Cole, M.A.; Elliott, R.J.R.; Zhang, J. Growth, foreign direct investment, and the environment: Evidence from Chinese cities. J. Reg. Sci. 2011, 51, 121–138. [Google Scholar] [CrossRef]
  55. Chintrakarn, P.; Millimet, D.L. The Environmental Consequences of Trade: Evidence from Subnational Trade Flows. J. Environ. Econ. Manag. 2006, 52, 430–453. [Google Scholar] [CrossRef]
  56. McAusland, C.; Millimet, D.L. Do National Borders Matter? Intranational Trade, International Trade, and the Environment. J. Environ. Econ. Manag. 2013, 65, 411–437. [Google Scholar] [CrossRef]
  57. National Bureau of Statistics of China. China Statistical Yearbook; China Statistics Press: Beijing, China, 2001–2014.
  58. The Editorial Board of China Environment Yearbook. China Environment Yearbook; The Press of China Environment Yearbook: Beijing, China, 2001–2014.
  59. National Bureau of Statistics of China. China Statistical Yearbook for Regional Economy; China Statistics Press: Beijing, China, 2001–2014.
  60. National Bureau of Statistics of China. China Energy Statistical Yearbook; China Statistics Press: Beijing, China, 2001–2014.
  61. National Bureau of Statistics of China. China Compendium of Statistics (1949–2008); China Statistics Press: Beijing, China, 2010.
  62. Zhang, J.; Wu, G.Y.; Zhang, J.P. The estimation of China’s provincial capital stock: 1952–2000. Econ. Res. J. 2004, 10, 35–44. (In Chinese) [Google Scholar]
  63. Huang, J.H.; Yang, X.G.; Cheng, G.; Wang, S. A comprehensive eco-efficiency model and dynamics of regional eco-efficiency in China. J. Clean. Prod. 2014, 67, 228–238. [Google Scholar] [CrossRef]
  64. Moran, P.A. Notes on continuous stochastic phenomena. Biometrika 1950, 37, 17–23. [Google Scholar] [CrossRef] [PubMed]
  65. Geary, R.C. The contiguity ratio and statistical mapping. Inc. Stat. 1954, 5, 115–145. [Google Scholar] [CrossRef]
  66. Elhorst, J.P. Spatial Econometrics: From Cross-Sectional Data to Spatial Panels; Springer Briefs in Regional Science; Springer-Verlag: Berlin, Germany; Heidelberg, Germany, 2014. [Google Scholar]
  67. Elhorst, J.P. Applied spatial econometrics: Raising the bar. Spat. Econ. Anal. 2010, 5, 9–28. [Google Scholar] [CrossRef]
  68. Elhorst, J.P.; Fréret, S. Evidence of political yardstick competition in France using a two-regime spatial Durbin model with fixed effects. J. Reg. Sci. 2009, 49, 931–951. [Google Scholar] [CrossRef]
  69. Piribauer, P. Heterogeneity in spatial growth clusters. Empir. Econ. 2015, 10, 1–22. [Google Scholar] [CrossRef]
  70. Florax, R.J.G.M.; Folmer, H.; Rey, S.J. Specification searches in spatial econometrics: The relevance of Hendry’s methodology. Reg. Sci. Urban Econ. 2003, 33, 557–579. [Google Scholar] [CrossRef]
  71. Mur, J.; Angulo, A. Model selection strategies in a spatial setting: Some additional results. Reg. Sci. Urban Econ. 2009, 39, 200–213. [Google Scholar] [CrossRef]
  72. Anselin, L.; Bera, A.K.; Florax, R.; Yoon, M.J. Simple diagnostic tests for spatial dependence. Reg. Sci. Urban Econ. 1996, 26, 77–104. [Google Scholar] [CrossRef]

