Article

Have Changes to Unused Land in China Improved or Exacerbated Its Environmental Quality in the Past Three Decades?

1
Institute of Remote Sensing and Digital Earth, Chinese Academy of Sciences, Beijing 100101, China
2
University of Chinese Academy of Sciences, Beijing 100049, China
*
Author to whom correspondence should be addressed.
Sustainability 2016, 8(2), 184; https://0-doi-org.brum.beds.ac.uk/10.3390/su8020184
Submission received: 15 December 2015 / Revised: 4 February 2016 / Accepted: 14 February 2016 / Published: 20 February 2016

Abstract

:
Inappropriate land use has caused a series of environmental disasters such as floods and sand storms, and some of them involved unused land changes with highly localized distributions in arid and semi-arid regions with fragile ecosystems. As the third-rank category of first-level land use/cover in China, unused land (UL) is now playing an increasingly important role in protection of the natural environment and sustainable utilization of land resources. In this article, we assessed the effects on regional eco-environments employing a quantitative EL (ecological effect index) model, which can be used to evaluate and represent the contribution of UL changes to the eco-environmental quality. Results show that UL changes generally contributed to the deterioration of eco-environmental quality during the study period. Some major contributors to improving eco-environmental quality were transformation of sandy land and saline-alkali lands to grasslands, expansion of water bodies in UL areas, and reclamation of farmland in UL areas (except for marsh lands). In contrast, the main contributors to worsening eco-environmental quality were grassland degradation to UL (except marshes), reclamation of marsh areas, and shrinkage of water bodies to leave desert or saline-alkali land. Some suggestions are provided about UL management, utilization, and protection issues.

1. Introduction

Terrestrial ecosystems have always been under the influence of natural environmental factors, and of human activities since the appearance of human societies, and the extent of the latter has been steadily increasing [1]. Land use/cover changes (LUCC) combine both natural conditions and anthropogenic influence, and have been considered as one of the most important factors influencing the environment [2,3,4]. Since 1992, research on LUCC has emerged as the core of global environmental change and sustainability research, such as the International Institute of Applied Systems Analysis (IIASA), the International Geosphere-Biosphere Program (IGBP) and International Human Dimensions Program on Global Environmental Change (IHDP) [5,6,7]. Scholars also focus on the eco-environmental effects of land-use change and eco-environmental security patterns as well as on the classification of land-use/land-cover types, analysis and evaluation of LUCC in typical regions, dynamic monitoring of LUCC through RS and GIS and LUCC modeling at regional or global scales, but existing research pays insufficient attention to regional ecological processes [8]. Moreover, the research has been mostly focused on hotspot types such as farmlands and urban expansion instead of changes in unused land. On the other hand, a series of environmental problems (i.e., land degradation, drought, flooding, and desertification) arose due to unsustainable utilization of land and excessive consumption of natural resources coupled with climate change throughout the world, and some problems were related to changes in unused land (UL) [3,9,10,11,12], such as the conversion of over-grazing grassland to UL and the reclamation from marsh land.
Researchers found that excessive pursuit of high land-use benefits and meeting the demand of food production, such as reclaiming farmland from grasslands or wetlands and lakes, likely resulted in serious environmental degradation [13,14,15,16,17,18,19,20] and brought about a series of environmental effects. Some effects included the formation of desert and loess, aggravation of soil erosion and degradation of wetlands’ ecological service function. This was especially true in some places with vulnerable ecosystems [21,22,23], most of which feature lower annual precipitation, low vegetation coverage, land desertification, etc., and is generally susceptive to climate change and disturbance of human activities. Researchers have gradually studied and analyzed eco-environmental effects brought about by land use changes throughout the world [24,25,26], but most of existing LUCC research focuses on a qualitative approach and single factor analysis of environmental elements, with few attempts at integrated quantitative analysis and evaluation of the ecological effects of LUCC [8]. The lack of quantitative analysis models may cause some to discount the scientific reliability of their results. Moreover, published research has mostly been focused on areas of regional scale (e.g., county, province, and watershed) [22,23,27,28,29,30]. The lack of larger scale study areas (e.g., country), results in a lack of scientific data to support the work of decision makers.
Herein, we define unused land (UL) as the currently remaining unutilized land by human being and still under original and natural status, including that which is difficult to utilize by human beings under present technical and natural conditions, such as sandy lands, Gobi, saline-alkali land, bare rock, etc. In fact, the UL often provides a full array of ecosystem services that are essential for local communities. The definition of UL in this paper derives from the land-use classification system used by the national land-use/cover database of China (at 1:100,000 scale), which was developed by the Chinese Academy of Sciences and involved visual interpretation method based on professional knowledge [5]. Zhang et al. [5] circumstantiated this hierarchical classification system of 25 land-use classes with six first-level types, which integrated land use and land cover information as a whole and is suitable for visual interpretation. Among them, UL includes sandy land (covered with less than 5% vegetation cover), Gobi (gravel-covered land with less than 5% vegetation cover), saline-alkali land (land with saline and alkali accumulation and sparse vegetation), swampland (land with a permanent mixture of water and herbaceous or woody vegetation that covers extensive areas), bare soil (bare exposed soil with less than 5% vegetation cover), bare rock (bare exposed rock with less than 5% vegetation cover), and other unused land (other land types such as alpine desert, tundra, etc.).
Over the past three decades, the UL of China has been exposed to dramatic changes, most of which were related to ecological restoration of grasslands in UL areas, degradation of grasslands to sand or other UL types, and reclamation of farmland from UL by new occupation [31]. Scientists, land managers and decision-makers may want to know whether these remarkable UL changes contributed to the deterioration of the local environment or slow it down, or even improve them as well as the locations of UL changes and their evolvement process. The answer to this question is very significant if we are to guarantee sustainable land-use management even development for society. Some regional research has shown that dramatic land-use changes related to UL in China have had a negative impact on regional eco-environmental quality. These have included flooding of the Yangzi River in 1998, sandstorms, droughts, non-point source pollution, and declining water quality [32]. On the other hand, some places showed trends of improvement after ecological restoration projects were implemented [32]. Unfortunately, most of the pertinent research lacked quantitative evaluation of the effects on eco-environmental quality at country scale, meaning that a clear answer to whether the UL changes of China improved or exacerbated eco-environmental quality over the past three decades, is unavailable.
As mentioned above, studies about proper utilization and protection of UL play an important role in improving ecological conservation and in ensuring ecological security. Therefore, the aim of this article was to assess the effects of UL changes to the environment from the late 1980s to 2010, by quantitative modeling of eco-environmental quality in relation to changes of UL.

2. Methodology and Data

2.1. Database and Treatment

The UL change data used in this study were retrieved from the time-serial land-use dataset, and other secondary data (including topographic maps at 1:100,000 scale and the administrative boundary maps) were used to help the analysis and revision. We extracted the information about UL changes during the period of the late 1980s to 2010 from the national land-use database (at 1:100,000 scale) of China. This source was constructed by the Chinese Academy of Sciences and represented the land use situation of China in the late 1980s, 1995, 2000, 2005, 2008 and 2010 [5], using mainly Landsat Thematic Mapper and employing the experts’ visual interpretation method. Zhang et al. [5] elaborated the construction and the update as well as the quality control. The accuracy for each “first-level land use/land cover type” is above 95.41% [5], which means the dynamic accuracy of UL in each update process is very high and can be used as a useful data source for assessing regional eco-environmental response to UL changes.
In this article, the term “eco-environmental quality” means the degree of good or bad on eco-environment, which is based on the theory of ecology and reflects the suitability of the eco-environment to human survival and the sustainable development of the social and economic fabric of society within a specific spatial extension and temporal duration. To a certain extent, land-use types can reflect characteristics of different eco-environment and represent different eco-environment quality [8]. Therefore, scholars [33,34,35,36,37,38,39,40] proposed the valuation method for the eco-environmental quality owned by land-use types, which can realize the quantitative analysis of regional eco-environmental changes and spatial features. Some scholars [33,34,39] synthesized study results in the different regions to summarize the main ecological process and the value of ecosystem effects. This way of studying eco-environmental effects used only the first-level ecosystem classification, without considering marked differences among eco-environmental effects of land use at the second level. In order to analyze the eco-environmental responses to land use changes as accurately as possible, in this study, we evaluate the eco-environmental quality of regional land-use types integrating the proportional relation of global mean economic value of ecosystem service functions proposed by Costanza [33], those for China revised by Xie [34,39] and the fuzzy valuation of regional eco-environment quality [35,37,38,41,42] based on Delphi Expert Consultation method and Analytic Hierarchy Process method to define the fuzzy value of eco-environmental quality for each second level land-use type, as shown in Table 1 [35,37,38,41,42].
To analyze the main spatial-temporal characteristics of the regional eco-environment change caused by UL changes, we selected some related data reflecting natural environment changes and human activities, including some socio-economic data such as population and gross domestic product (GDP) collected from the China Statistical Yearbook (1980–2010). Also included were meteorological data downloaded from the China Meteorological Data Sharing Service System, which include annual time-series data of temperature and precipitation from 756 national weather stations during 1980–2010.

2.2. Methods for Ecological Response Index to UL Changes

Any kind of land-use change generally reflects a shift in the corresponding ecological value, which can lead to a partial increase or decrease in the regional ecological value. In this study, we used an index model of ecological effects to quantify eco-environmental responses to UL changes. In this way, we were able to separate ecological responses to UL changes, associated with various land use changes. The index was calculated as follows (Equation (1)) [35,37,38,41,42]:
E L i j = ( C j C i ) × L U i j i = 1 n j = 1 n [ | C j C i | × L U i j ] × 100 % , ( i j )
where E L i j stands for the index of ecological responses to UL change from i th land use type to j th. Here, C i and C j are eco-environmental quality values for land use i and j , respectively; L U i j is the change area transforming from land use i to j over the study period; n is the number of all the UL types in this region; and E L i j stands for the contribution rate of UL change to regional eco-environment changes. This is of reference value for governments in regulating and adjusting land use. When the parameter E L i j > 0 , it indicates that the land-use change transforming from i to j improves local ecological environment, whereas when E L i j < 0 , it indicates that the land use change converting from i to j deteriorates the regional ecological environment.

3. Results and Discussion

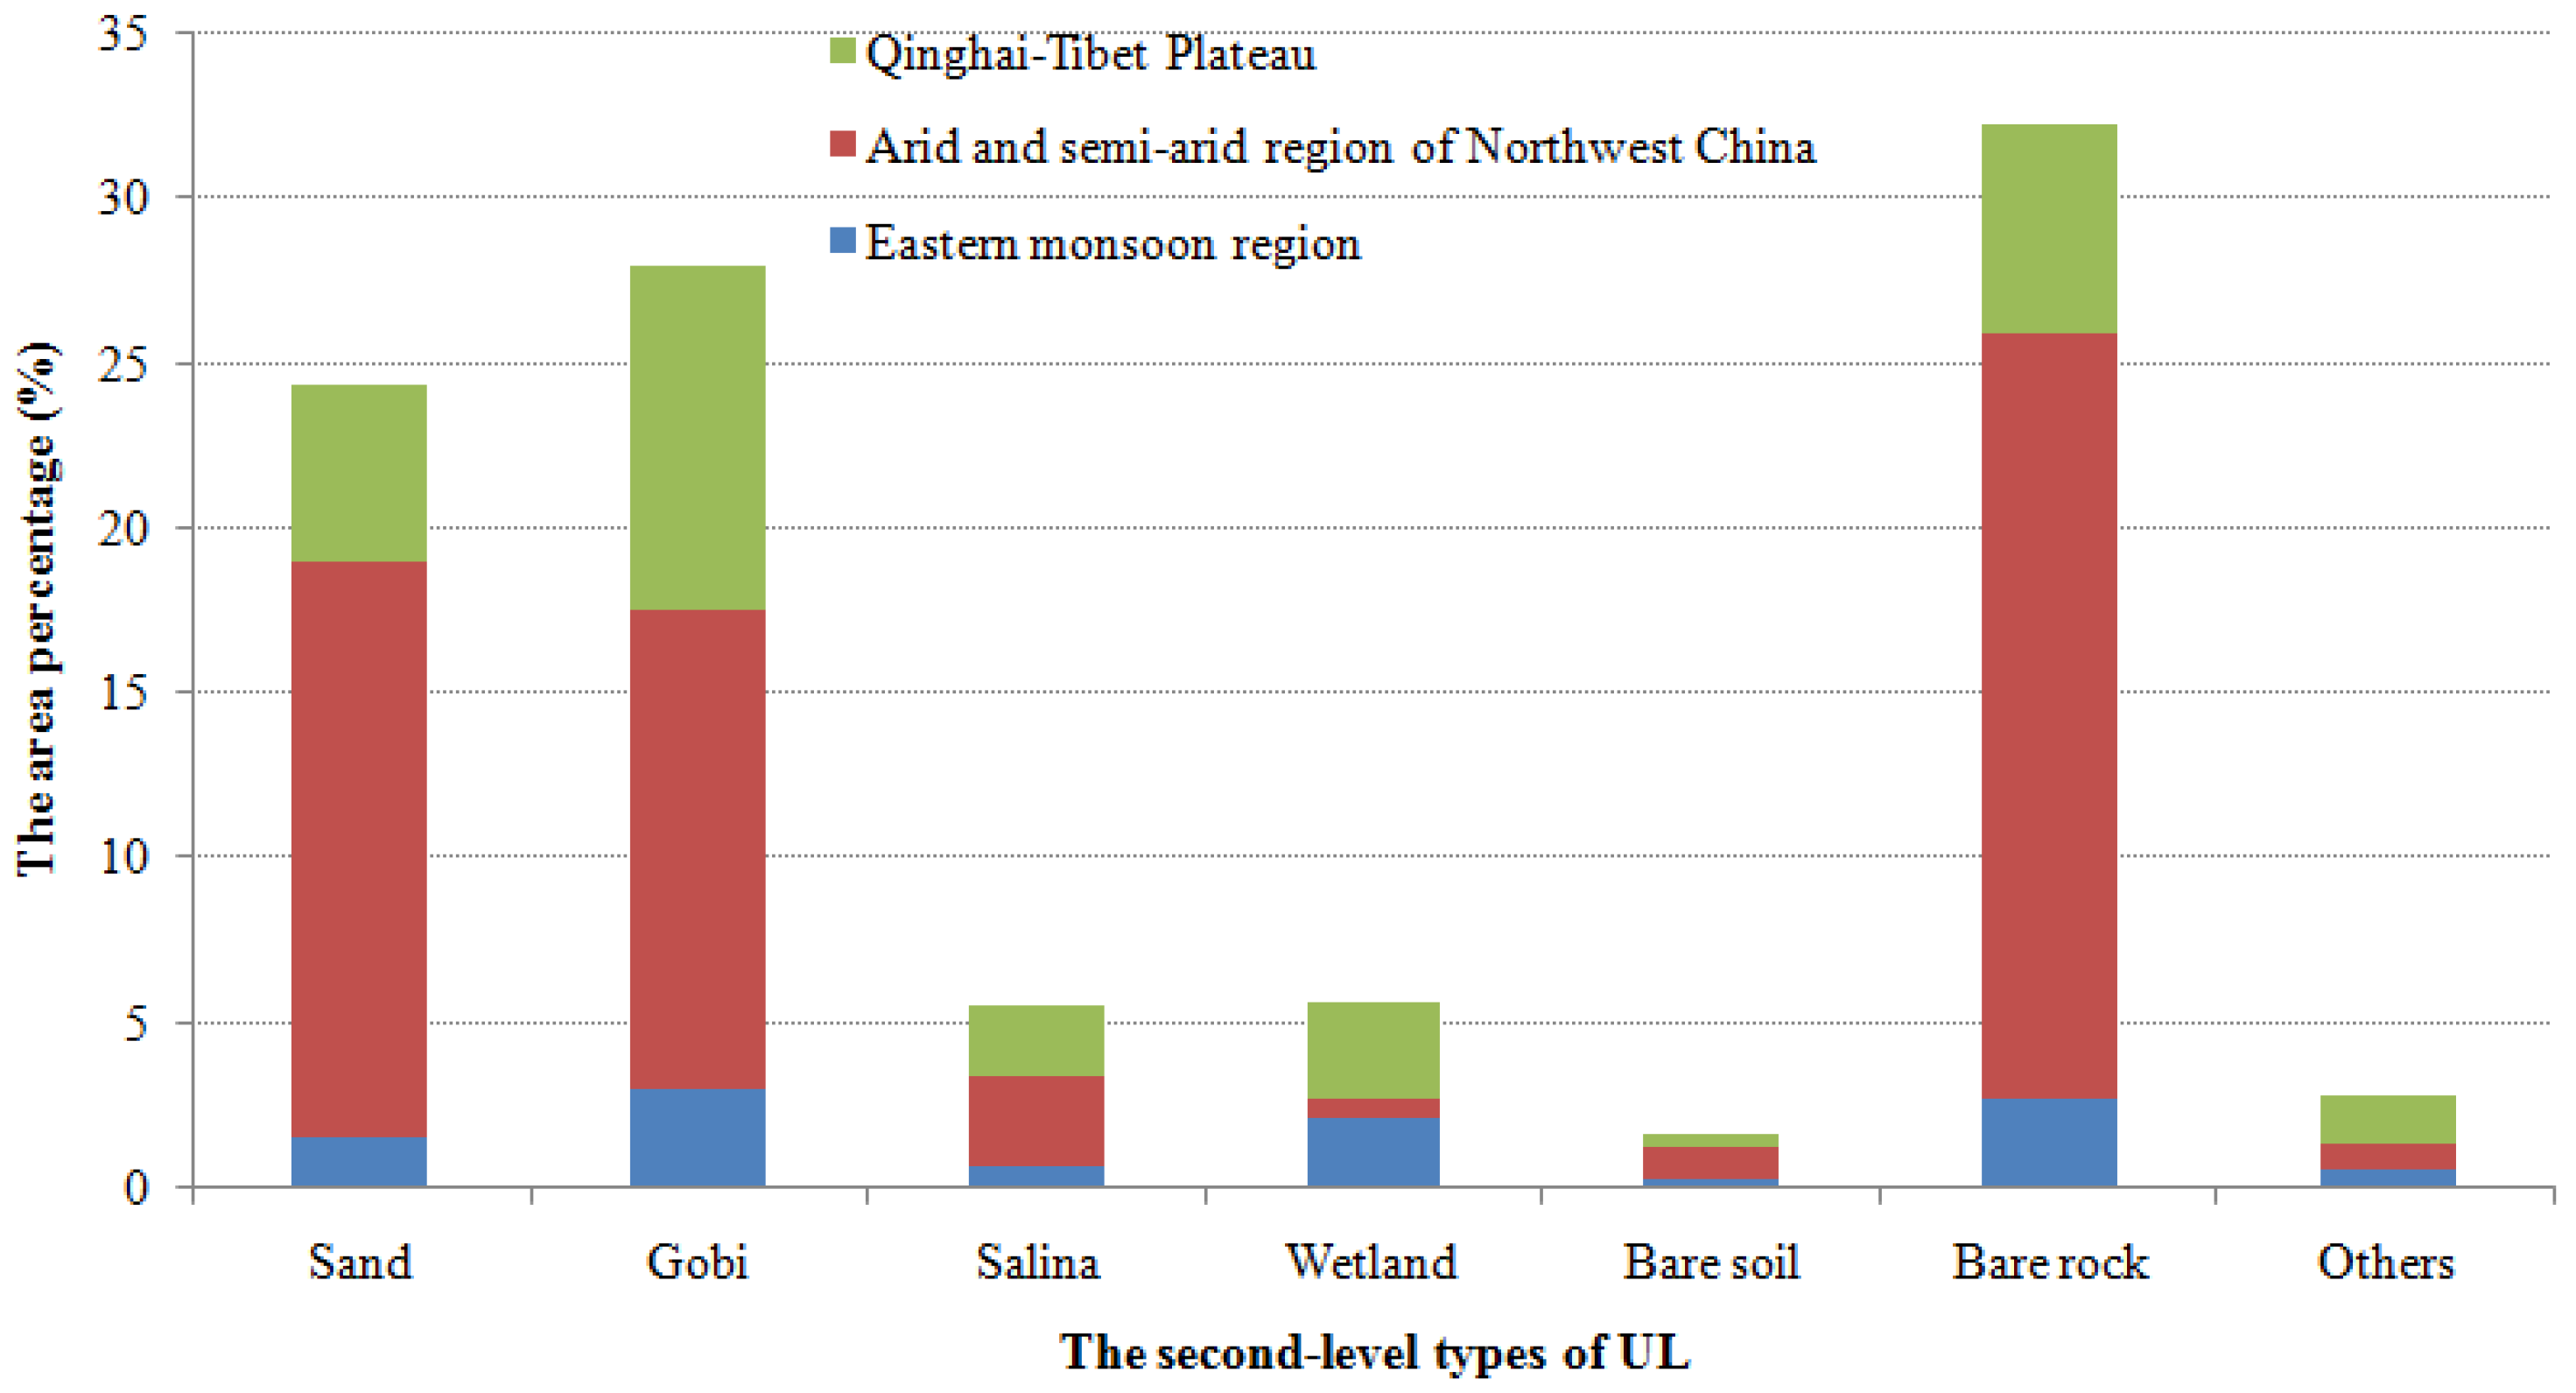
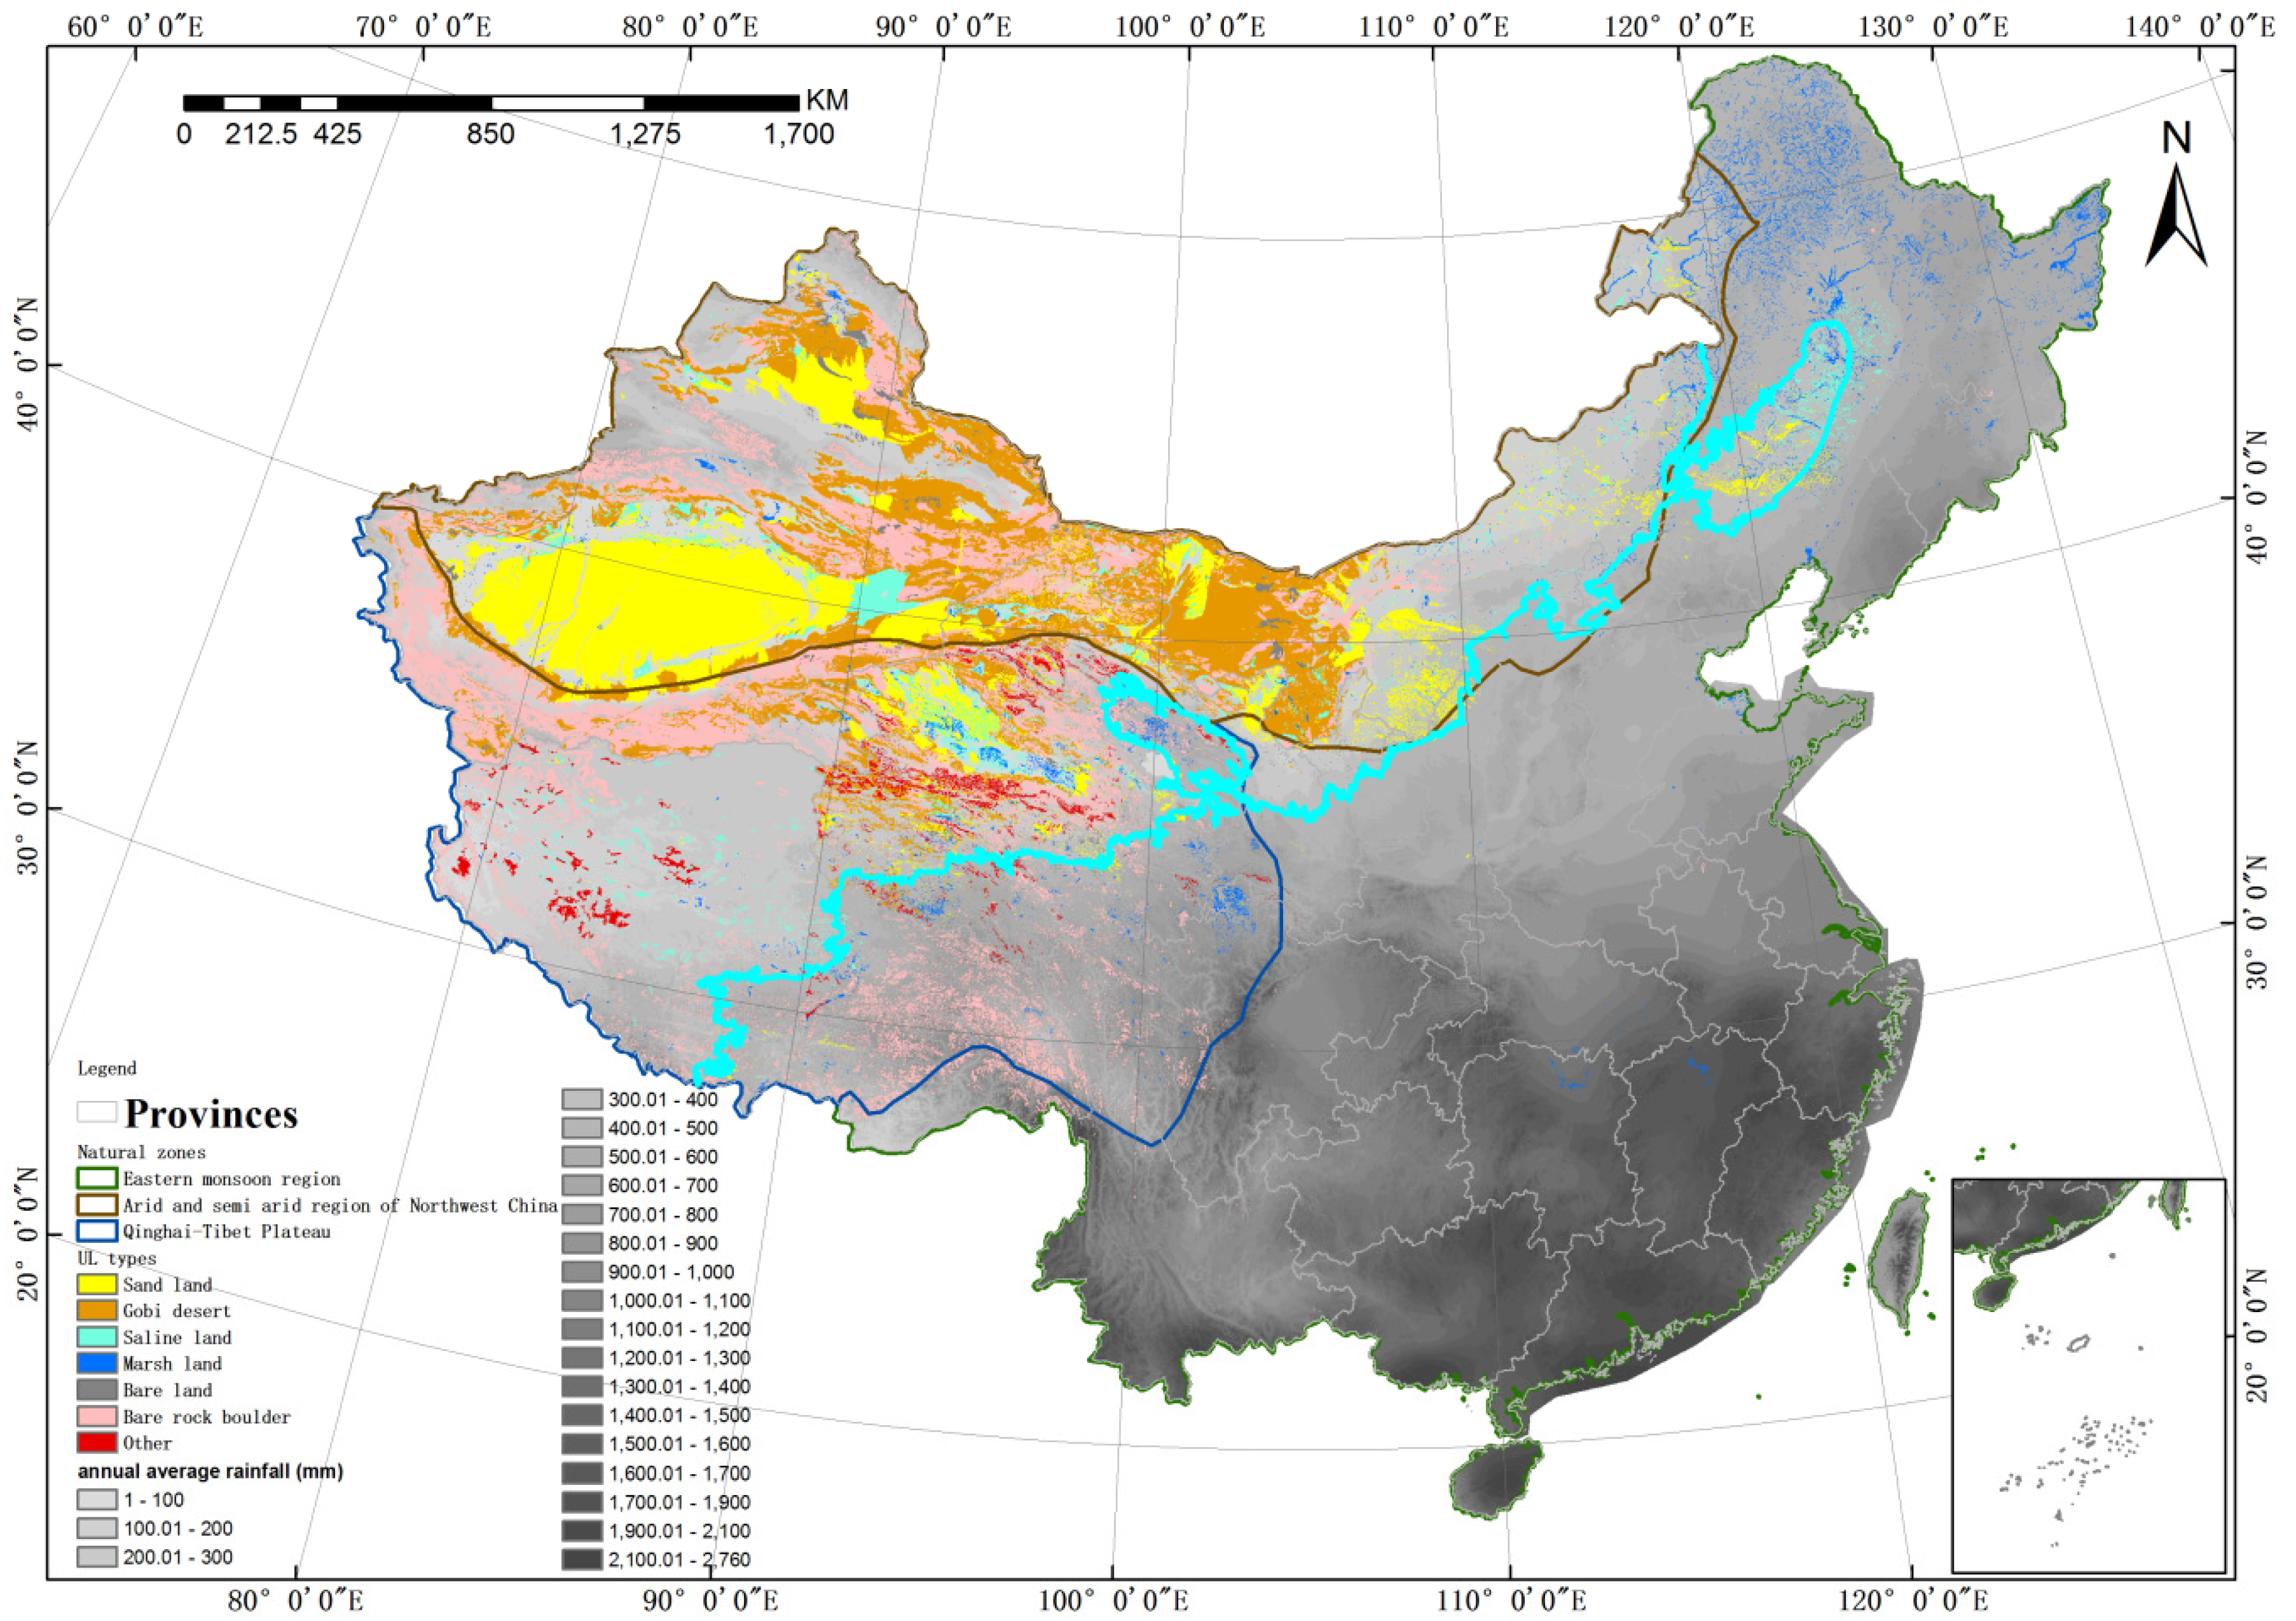
3.1. The Status of UL in China and Its Environment in 2010

The UL of China has been the third-largest category of first-level land use/cover over the past three decades, accounting for almost a quarter of the total [5]. These areas occupy areas with highly localized distributions in the arid and semi-arid regions of Northwest China (Figure 1 and Figure 2). These include Xinjiang with the largest UL area (about 51.29% of total UL area in 2010) and Inner Mongolia autonomous region with the second largest UL area (about 16.47% of total UL area), followed by the Qinghai-Tibet Plateau (Qinghai Province and Tibet autonomous region) with the third largest UL area (about 12.64%) [31]. These places have a common feature, a low population density less than 30 people/km2 (Figure 3). As shown in Figure 2, it is very clear that the area of UL increases gradually from southeast to northwest because of influences from both natural factors and human activities. It is also obvious that most of the UL regions have fragile ecosystems with little annual precipitation (mostly <400 mm; Figure 2, Table 2), low annual average air temperature (about 6 °C), less vegetation coverage (average EVI of 0.1434; Figure 4, Table 2) and higher elevation (average of 2248.85 m). Among all UL types, the average annual rainfall of sand areas was the least, followed by Gobi areas, whereas wetland areas had the most rainfall (though only 442.91 mm) and the highest EVI value (0.4360).
In summary, UL is a dominant landscape type in China, but is mainly located in arid and semi-arid regions, and the Qinghai-Tibet Plateau, with fragile ecosystems. These areas suffer from frequent natural disasters, such as snowstorms, dust storms, desertification, and soil erosion [43].

3.2. Ecological Effect Caused by Dynamic Change of UL

Based on the transfer matrix of UL changes [31], we calculated the ELs of each kind of UL changes using Equation (1). Results show that UL changes led to a marked deterioration of the eco-environment, with a contribution rate of 29.20% in China during the study period (Table 3). However, a trend towards improving the general eco-environment quality in other areas was also found. For example, the contribution rate of all of factors improving eco-environmental quality increased gradually from 37.50% from the late 1980s to 2000, to 62.36% from 2008 to 2010, while the rate of deterioration decreased from 62.50% to 37.63%.
The ecological response index to UL change indicated that the contribution rates of various kinds of UL changes to regional eco-environment quality were different. Considering both the social and the economic development features of China, we summarized all UL changes as 21 types of driving force so that each contribution rate to regional eco-environment changes could be evaluated quantitatively (Table 3). Among them, ten types of UL change improved regional eco-environment quality and others contributed to the deterioration of local ecosystems.
As shown in Table 3, converting sand and saline land to grassland was the most important contributor of improving region eco-environmental quality, with an increasing contribution rate from 16.39% from the late 1980s to 2000, to 21.71% for 2008–2010. This may be because that various eco-environmental restoration projects have been implemented since 1983 [44,45] and gradually shown a long-term positive effect on the environmental quality. Furthermore, UL (except marsh land) overtaken by water body expansion, and reclaiming UL (except marsh land) for farmland also brought about an important positive effect on the regional environmental quality, with an increasing contribution rate from 7.71% and 2.98%, to 14.96% and 16.30%, respectively. This was because water resources were very important natural factors affecting the eco-environment quality of the arid and semi-arid region. As shown in Figure 5, the change of the annual precipitation in the arid and semi-arid region, or Xinjiang and Qinghai-Tibet (with an increase of 4.87 mm, 9.02 mm and 6.96 mm per decade, respectively), was helpful for improving regional eco-environment quality. It was also noted that the contribution rate of built-up development in UL areas (except swampland) increased markedly from 0.62% in the late 1980s to 2000, to 5.80% in 2008–2010.
In contrast, some UL changes led to deterioration of regional eco-environment quality, mainly including grasslands degenerating into UL (except marshland), reclaiming farmland from marsh, and converting water bodies to desert. Among these negative factors, the contribution rate of grassland degradation ranked first during the first three monitoring periods (about 25.31%, 31.68%, and 28.91%, respectively). Developing farmland from marsh ranked second, especially in the first two monitoring periods (about 18.01% and 14.67%, respectively). However, in the last two monitoring periods, the shrinkage of water bodies played a dramatic role in deteriorating regional eco-environment (about 14.44% and 8.39%, respectively). This was followed by reclaiming farmland from marsh (9.36%) for 2005–2008, and reduction of marsh by built-up construction (7.24%) for 2008–2010. All of these changes indicated that meadow degradation, reclaiming farmland from marsh, and the shrinkage of water bodies were the main driving forces for eco-environmental deterioration. Sun and Wang [46] also reported that over-trampling and over-grazing, driven by economic interests, resulted in meadow degradation or desertification. Some was so extreme that some of the degraded grassland cannot be restored. The shrinkage of wetlands in both developed and developing countries due to intensive human activities, has resulted in destructive changes to the ecological environment, such as increasing frequency of drought, decreasing river runoff, and falling groundwater levels [47,48]. Changes of environmental factors in China during the study period, such as a significant decrease of annual precipitation in China with a significant decrease of 6.11 mm per decade, and a universal increase of annual mean air temperature throughout China with an increase of 0.45 °C per decade, to some extent aggravated negative changes to regional eco-environment quality, especially in Inner Mongolia which witnessed a remarkable decrease of 10.35 mm per decade and a significant increase of 0.52 °C per decade (Figure 5).

3.3. Spatial Differences in Ecological Response to UL Changes

Eco-environmental responses to UL changes in each province of China exhibited temporal and spatial heterogeneity over the study period. As shown in Figure 6, it is very clear that the eco-environmental response to UL changes in both northwest and northeast provinces was remarkable, as indicated by the index of ecological response to UL changes. Among these provinces, the EL value of Xinjiang, Gansu, and Tianjin was constant and remarkably positive throughout the study period, and especially that of Xinjiang increased dramatically from 1.29% to 24.71%. Xinjiang was followed by Gansu province (0.41% in the late 1980s to 2000, and 4.81% for 2008–2010). This means that the UL changes happening in Xinjiang, Gansu, and Tianjin were more helpful for improving the local ecological environment than for deteriorating it. Results also indicated that grassland restoration and reclamation from UL (except swampland) in these provinces were their main UL changes, and mainly contributed to improvement of regional environmental quality.
In contrast, the UL changes that happened in Inner Mongolia Autonomous Region and Heilongjiang Province gradually and dramatically deteriorated local eco-environment quality throughout the study period. The EL values there decreased from −12.37% and −11.90%, to −3.13% and −2.13%, respectively. Corresponding UL changes in these regions included grassland degradation, desertification, and reclamation of farmland from wetlands, which contributed to deterioration of the regional ecosystems.
Moreover, in the other provinces of China, the EL exhibited fluctuations. In some provinces, the EL values were negative during the first periods of monitoring, and positive in the last periods (e.g., Jilin and Qinghai). Others were positive at first, then negative later (e.g., Shandong and Shannxi). In still other areas with very little UL, such as Hebei and Hubei, changes were not regular. In Jilin Province, UL changes related to cultivation in wetland areas were the main contributors of deterioration in the local environmental quality during the early study period. In contrast, it was grassland degradation due to over-grazing in Qinghai Province, which contributed most to deterioration of the local ecosystems there.

3.4. Analyzing the Driving Forces of Eco-Environmental Quality Changes Caused by UL Changes

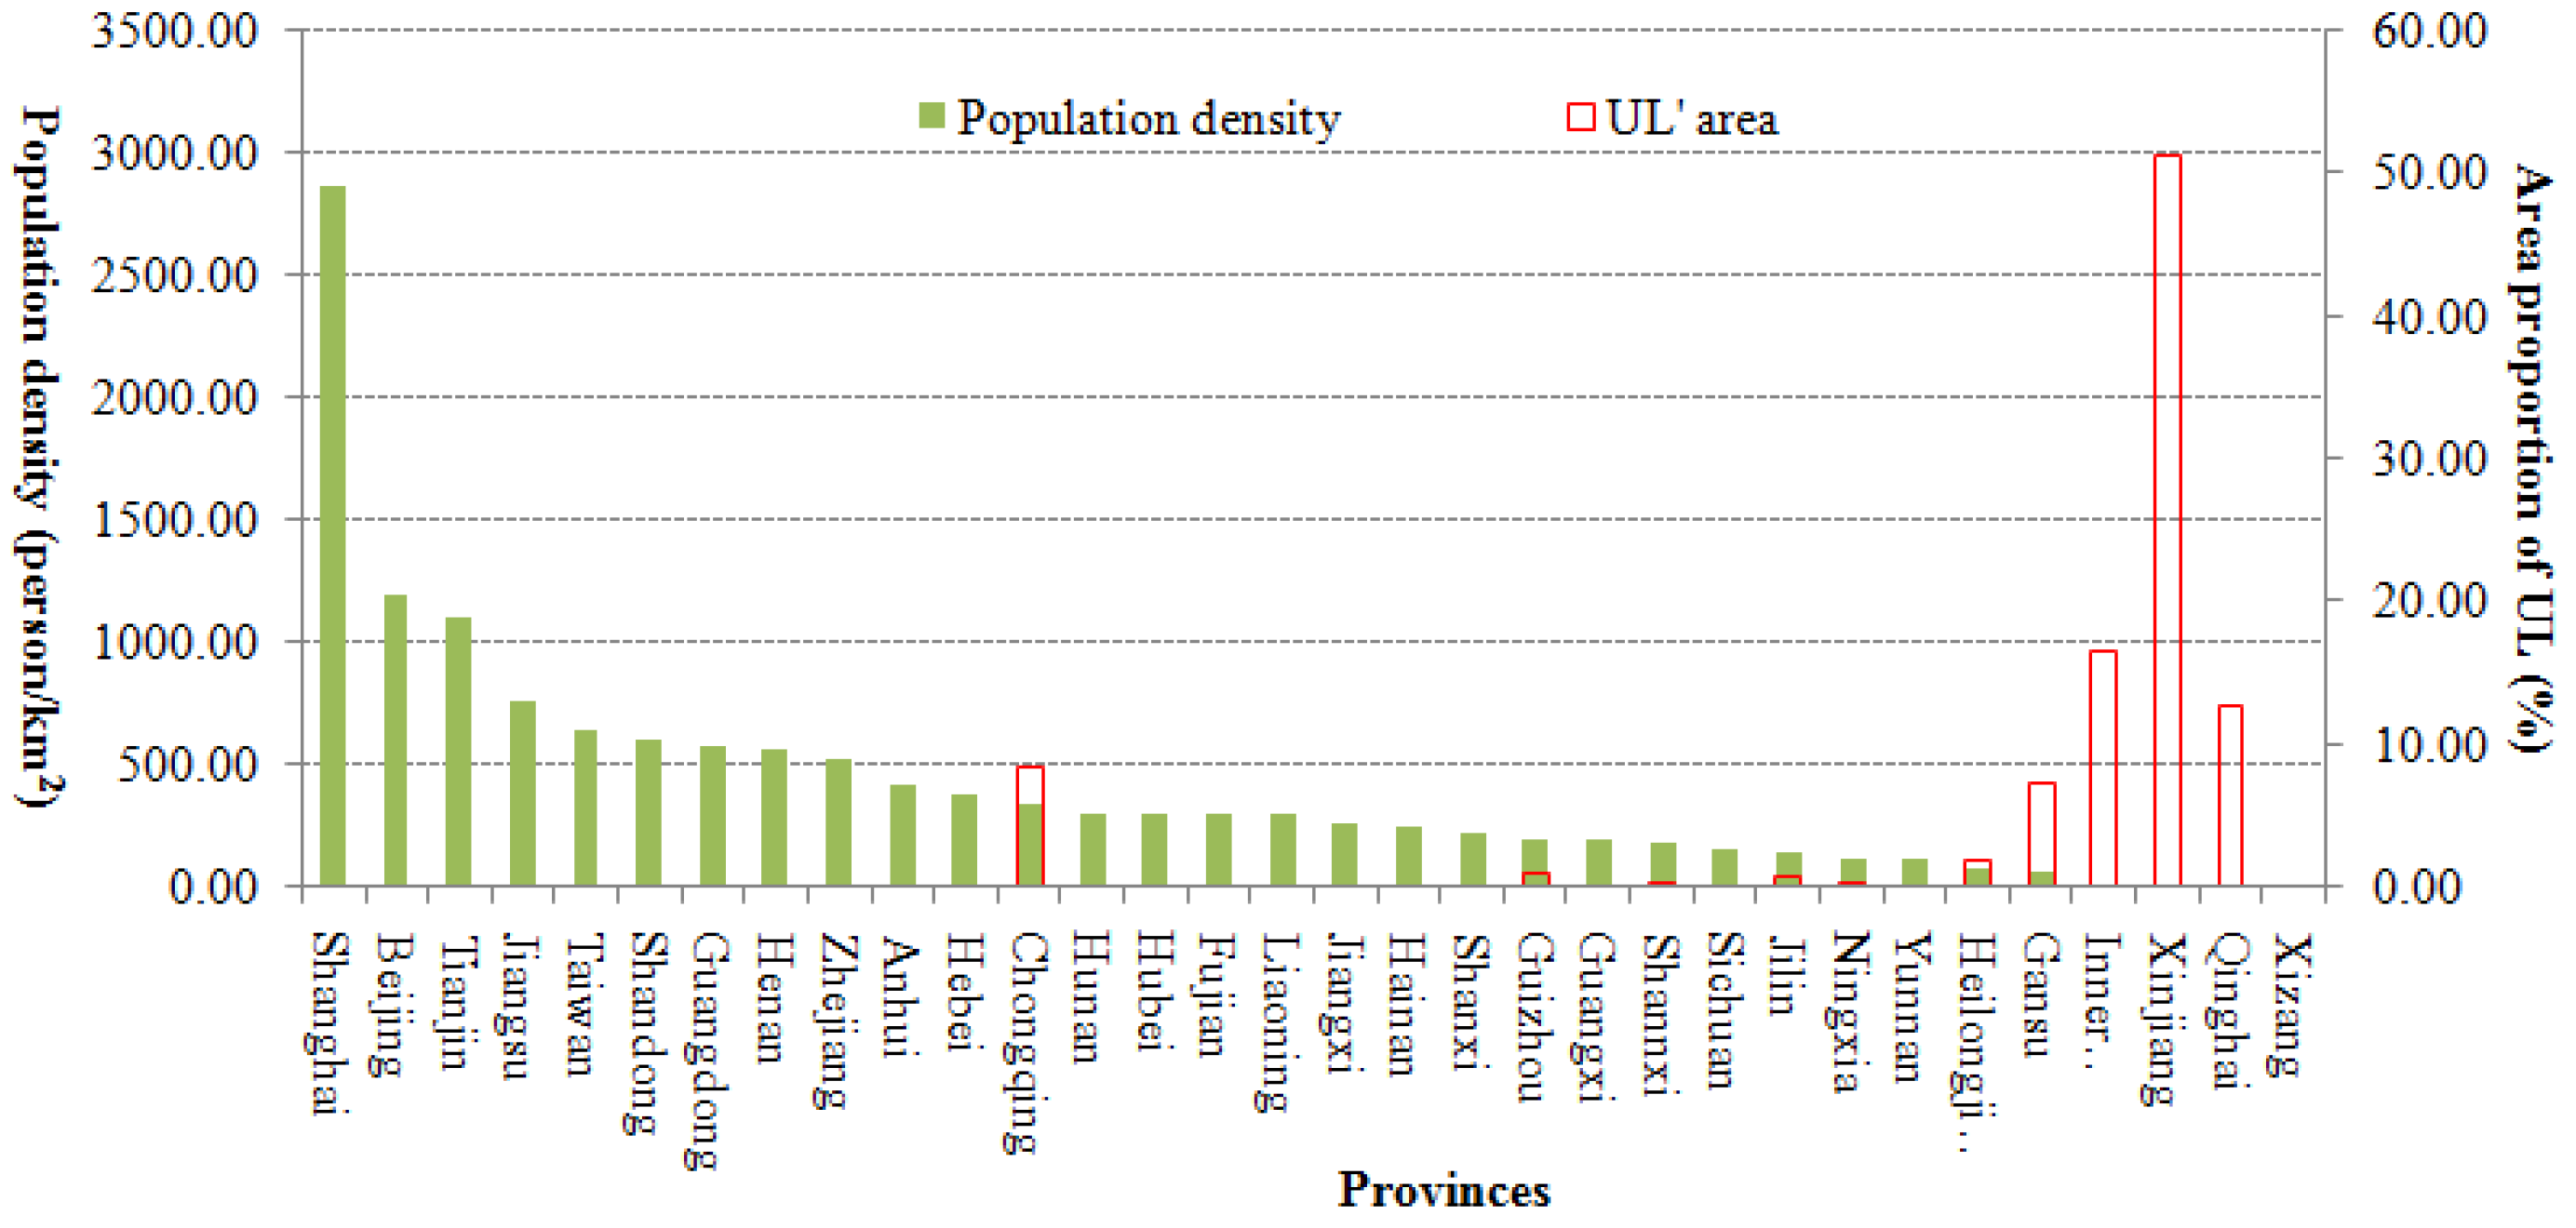
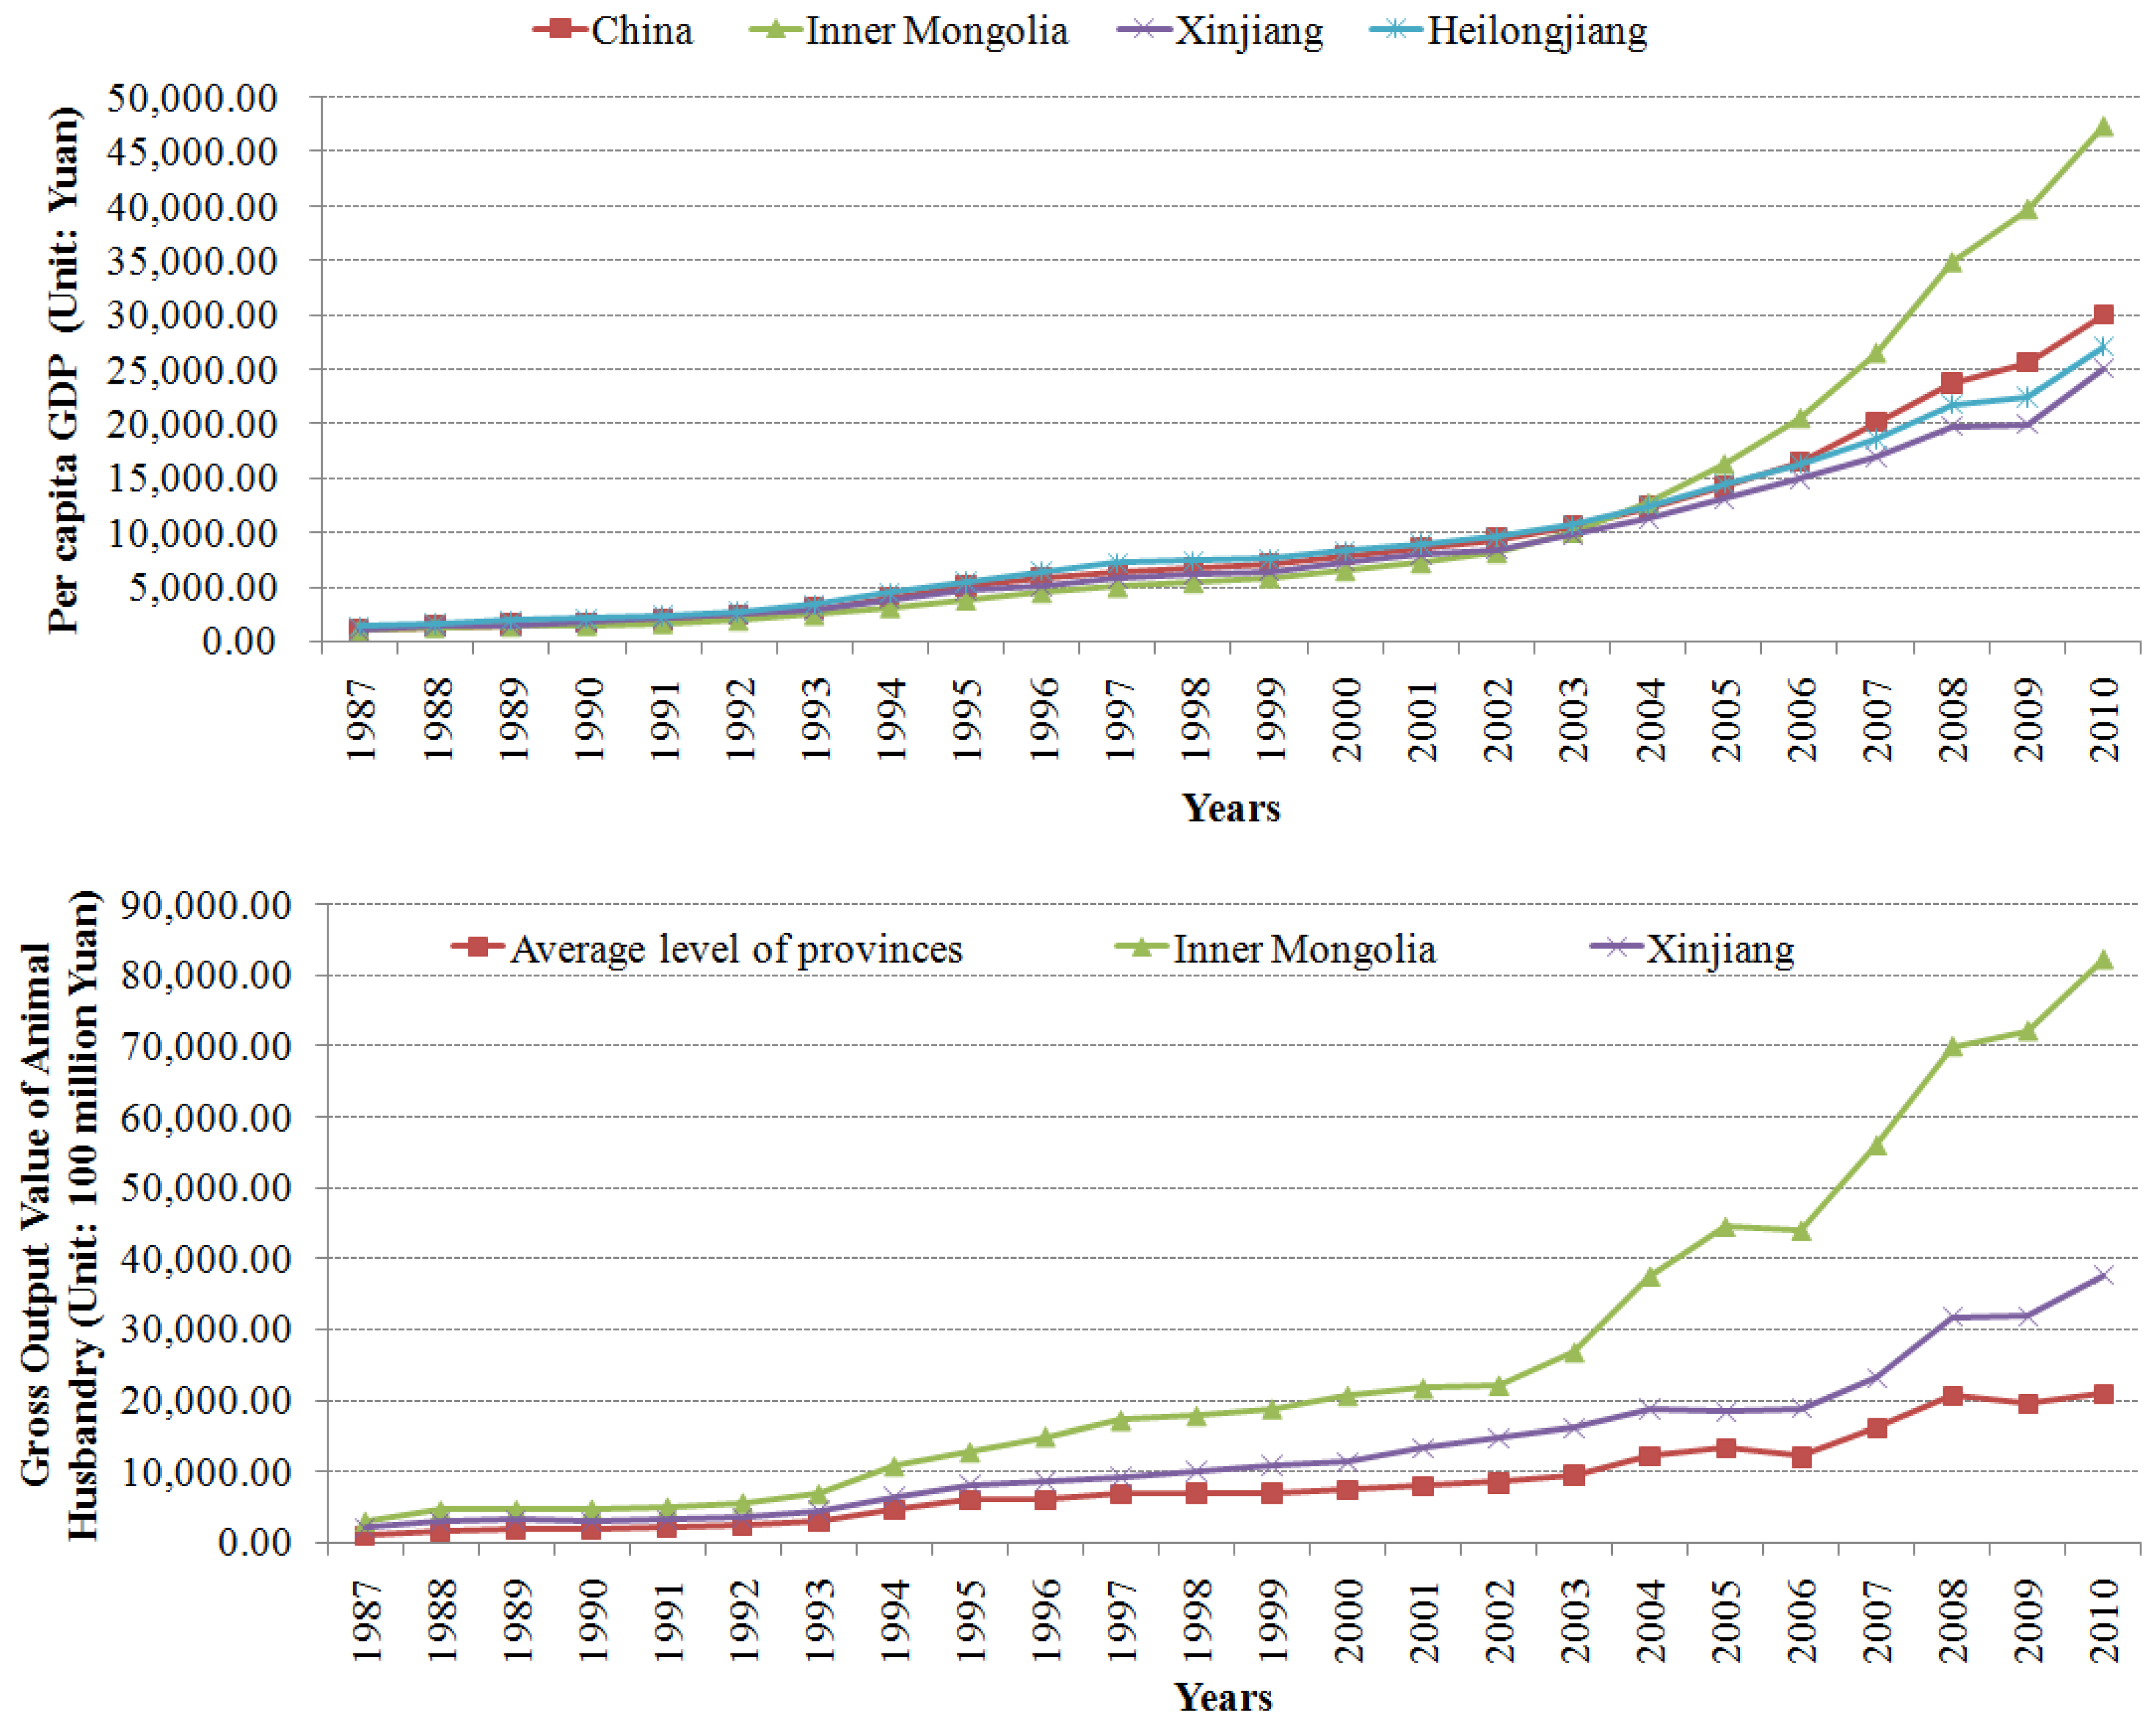
3.4.1. Socio-Economic Factors and Relevant Policies

UL changes contributed generally to the exacerbation of regional environment quality during the study period. Some factors came from human activities, and some came from regional climate changes. Yi et al. [31] said that since the reform and opening up of China, UL has been occupied continuously by other land-use types because of rapidly economic development, industrialization, urbanization and the demand for recovering regional ecological services. This is particularly true in China’s ecologically fragile areas, such as Xinjiang and Inner Mongolia. With the rapid increase in population (about 1093 million in 1987 and 1340.91 million in 2010) and rapid development of the economy (GDP 1205.86 billion CNY in 1987 and 40,120.20 billion CNY in 2010), the demand for land increased unavoidably. This resulted was a continual decrease of UL net area and increase of the area of other land-use types, which can cause the change of regional environment quality to some extent. For example, the reclaiming farmlands in the marsh areas and the over-grazing of grasslands met the demand of food or economy, but contributed to the deterioration regional environment. As one of the main animal husbandry areas, the Inner Mongolia owned the higher gross output value of annual husbandry than that of the average level of provinces (Figure 7), which has become the ineludible factor causing grassland degradation because of over grazing.
During the study period, UL changes in Inner Mongolia, Xinjiang, and Heilongjiang were more intense than those in other provinces [30], which was indicated by their respective socio-economic changes, such as per capita GDP (Figure 7), the Gross Output value of animal husbandry, and number of livestock (year-end) (Figure 7). As shown in Figure 6, the per capita GDP of China increased significantly throughout the study period. The figures for Heilongjiang Province were always above the Chinese average, before 2006. This corresponded to local EL changes and UL changes, such as the marked negative EL values of Heilongjiang caused mainly by wetland reclamation before 2006.
It is also very clear that the gross output value of animal husbandry in both Inner Mongolia and Xinjiang was greater than the Chinese mean, as shown in Figure 7. For Inner Mongolia, this gap broadened obviously from 1994 to 2003; after which, the figure was about three times higher than for China, and even four times in 2010. As an important animal husbandry zone, and with growth of its human population, the EL changes in Inner Mongolia (grassland degradation) were all in response to increasing animal husbandry.
Furthermore, the increasing demands for ecological service also resulted in transformation of UL to grassland and of farmland to wetland. Local governments and landholders paid gradually more attention to improvement of eco-environment construction, to limitation of developing land and promotion of intensive land use than ever before. Actually, the Chinese government has implemented several ecological restoration projects since 20th century [44,45], including several soil conservation projects managed by the Ministry of Water Resources of the People’s Republic of China since 1983, the returning farmland to forests or grassland project since 1999, the grazing forbidden project since 2003 [49], the Beijing-Tianjin Sandstorm Source Area Comprehensive Control program since 1998, the Grain for Green project, the Wetland Protection project since 1998 and Three-North Protective Forest Program since 2001. Obviously, the implementation of these projects generated a significant impact on regional eco-environment, which was reflected in the change of total EL value from −62.50% to −37.63% in response to UL changes.

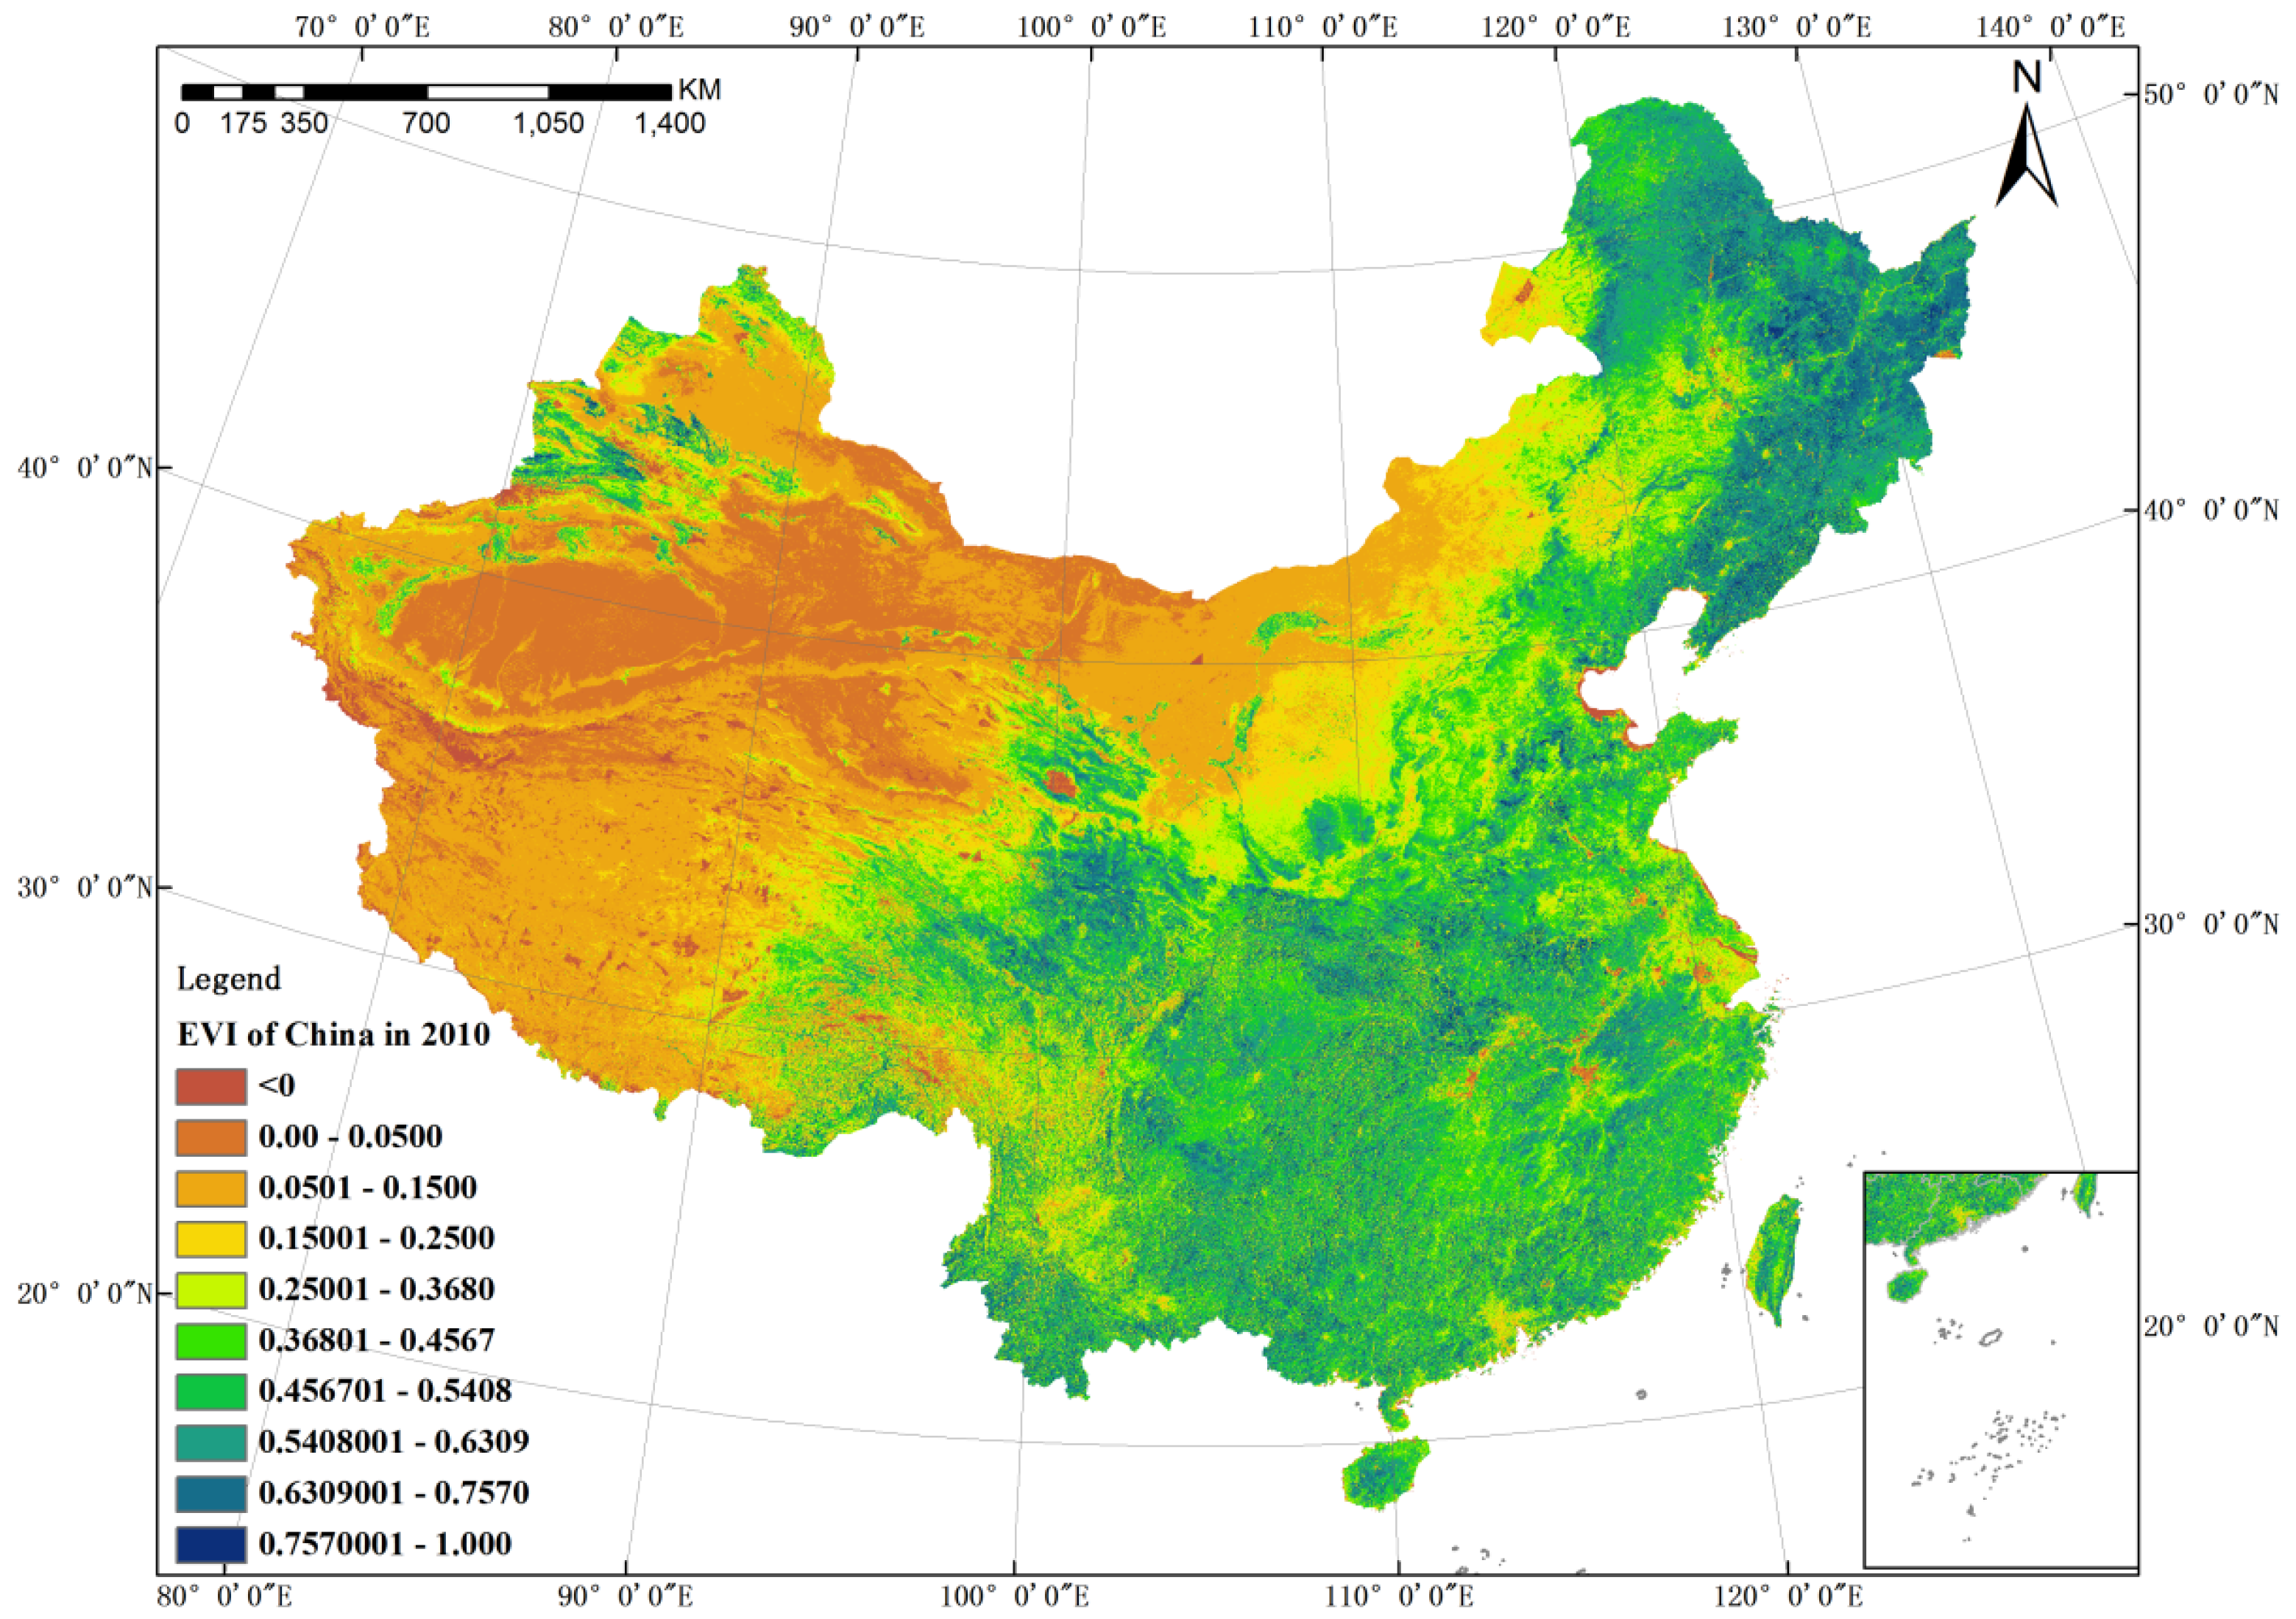
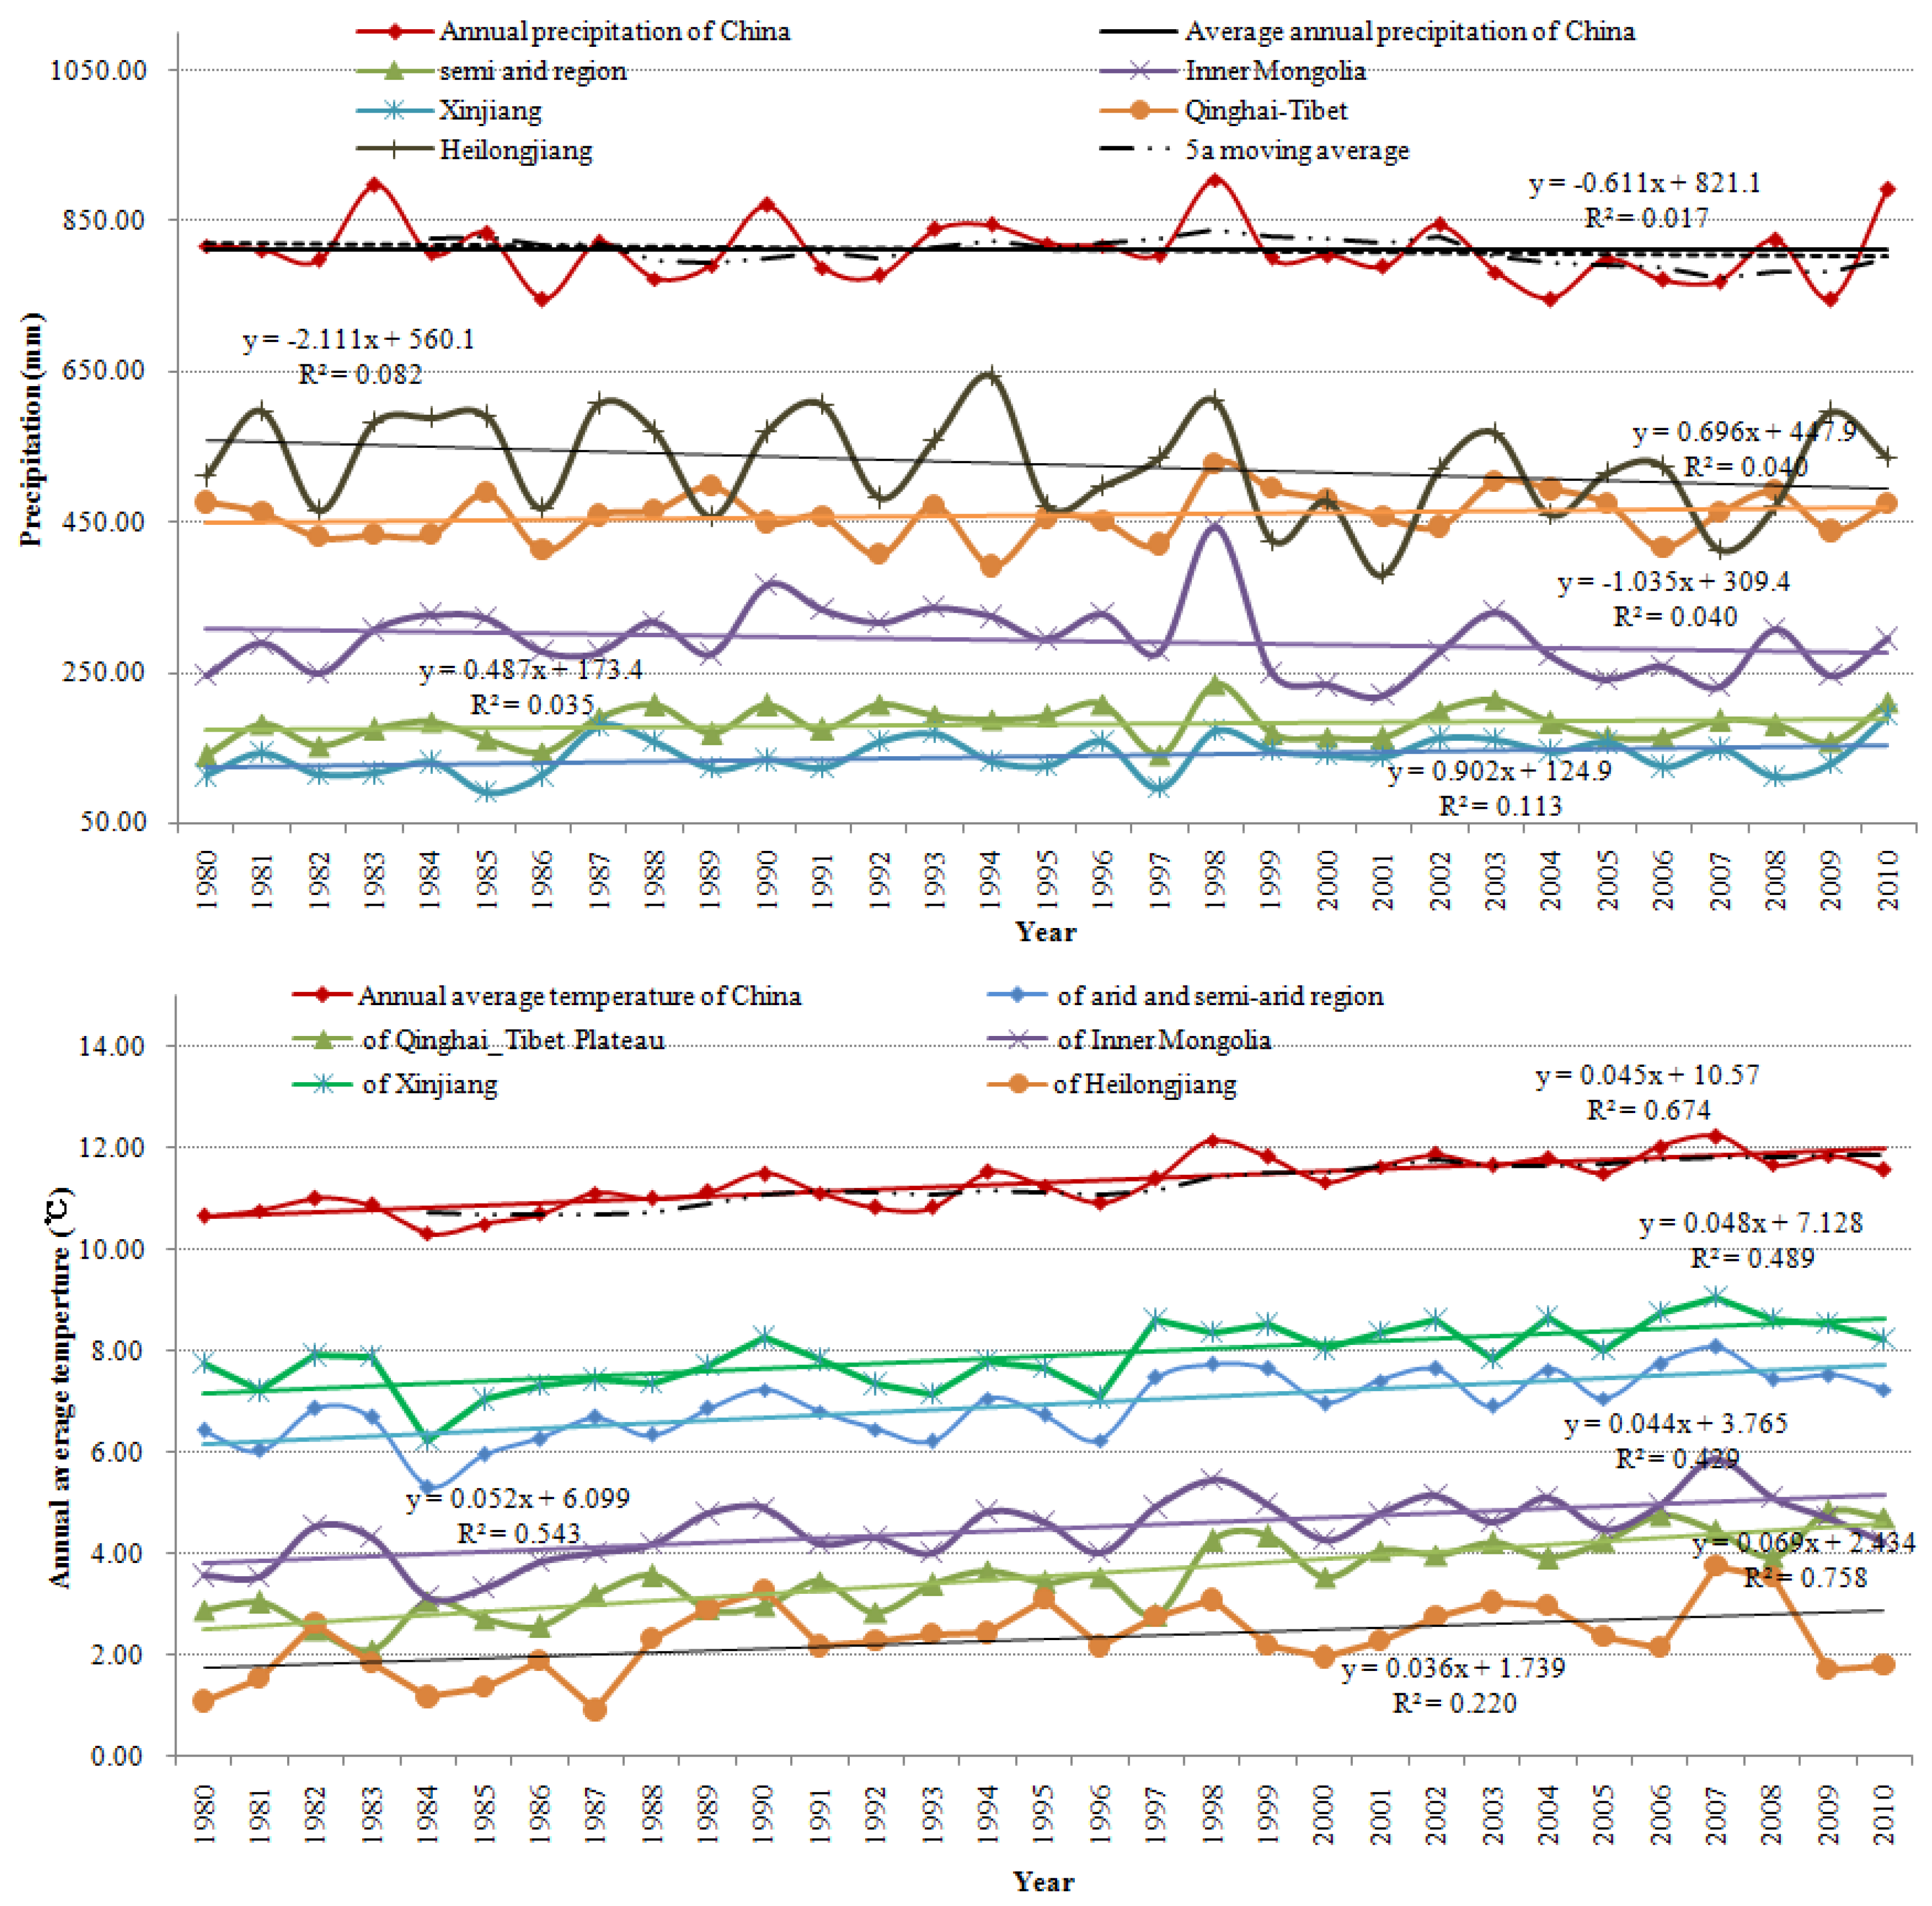
3.4.2. Changes of Environmental Factors Related to UL

Both regional precipitation and air temperature are sensitive natural factors in vulnerable ecosystems. Coupled with average annual precipitation and the annual mean air temperature from 1980 to 2010 in different regions (Figure 5), we found that the study area has exhibited generally a gradual warming trend with decreasing precipitation. The average annual precipitation of China decreased generally at a rate of 6.11 mm/decade from 1980 to 2010. In particular, there was a dramatic decrease in Inner Mongolia (10.35 mm/decade) and in Heilongjiang (21.11 mm/decade), which was reflected in EL changes in both regions and was adverse to improving the regional eco-environment quality coupled with some of their UL changes. In contrast, there was a generally opposite trend in the arid and semi-arid regions and on the Qinghai-Tibet Plateau with increases of 4.87 and 6.96 mm/decade, respectively, in areas with most of the UL in China. The annual mean air temperature of China increased at a rate of 0.45 °C/decade, and the figure for the arid and semi-arid regions and for the Qinghai-Tibet Plateau, all increased. Generally, this means that there was an adverse natural condition for utilizing UL in China, particularly in Inner Mongolia, which contributed to the aggravation of regional eco-environment quality. However, there were still some places where changes in regional natural factors were propitious for UL utilization. For example, the regional average annual precipitation increased 9.02 mm/decade in Xinjiang, with an increase of 0.48 °C/decade in annual mean air temperature. This provided huge potential for utilizing previously UL areas, and changes of its EL value bore witness to fulfillment of the potential.
A decrease in regional rainfall may make desertification of grassland areas more likely, particularly in arid and semi-arid regions, such as Inner Mongolia. Meanwhile, the average annual rainfall of Xinjiang Autonomous Region was only 139.36 mm from 1980 to 2010, which was reflected in degradation of grasslands to UL (accounted for >22% of the total increase in area of Chinese UL, except during 2000–2005, which was the second largest). This kind of UL change lowered directly or indirectly the regional eco-environmental quality. Therefore, it is still risky to utilize UL and sustainability should be considered first.

4. Conclusions

Based on the national land-use database (at a scale of 1:100,000), we employed an ecological response index model to assess the effects of UL changes on local environmental quality over the past three decades. The conclusion drawn was that dramatic changes of UL in China generally deteriorated regional eco-environment quality during the study period, but the contribution rate of deterioration caused by UL changes was decreasing gradually.
In summary, some UL changes in China dramatically deteriorated regional eco-environmental quality over past three decades. These manifested as dramatic grassland degradation to UL in the arid and semi-arid regions of Northwestern China (e.g., Inner Mongolia and Xinjiang Autonomous Region), marsh reclamation for farmland, the shrinkage of water bodies to form desert or saline areas (coupled to natural changes such as decreasing precipitation and warming). Conversely, some UL changes were helpful for improving eco-environmental quality, including mainly the return of sand and saline lands to grasslands due to the implementation of ecological restoration projects, expansion of water bodies due to natural changes, and reclaiming farmland from sand and Gobi areas. This implies that we should develop and exploit UL according to local eco-environmental conditions. Therefore, for the utilization of UL, managers or users should first conduct evaluations of applicability, and then combine this with knowledge of the natural geographical environment and climatic background, before deciding whether to utilize or protect. As for farmland reclamation in UL areas, the emphasis should be on improving the productivity of arable land. Especially, when considering wetland reclamation for farmland where there is good water and warm conditions, protecting the natural ecological service functions of wetlands should be considered first. However, when considering developing and using UL in arid and semi-arid areas, such as in Inner Mongolia, with trends of warming and decreasing precipitation in a fragile eco-environment, the focus should be on protecting ecological function rather than on haphazard development.

Acknowledgments

The UL data were gathered and made available by nine institutes under the Chinese Academy of Sciences, including the Institute of Remote Sensing and Digital Earth, the Institute of Mountain Hazards and Environment, the Northeast Institute of Geography and Agroecology, the Xinjiang Institute of Ecology and Geography, the Institute of Geodesy and Geophysics, the Cold and Arid Region Environmental and Engineering Research Institute, the Institute of Geographic Sciences and Natural Resources Research, and the Institute of Soil Science. These data serve as a solid foundation for the completion of this paper, and the authors are grateful for them. This study was founded under National Key Technologies R&D Program of China (No. 2013BAC03B01).

Author Contributions

Ling Yi carried out most of the analyses and drafted the manuscript. Zengxiang Zhang and Xiaoli Zhao participated in the design of the study and helped develop the algorithm. The other authors updated the dataset in the north and south parts of China from 2008 to 2010. All authors have read and approved the final manuscript.

Conflicts of Interest

The authors declare no conflict of interest.

References

  1. Yang, H.F.; Mu, S.J.; Li, J.L. Effects of ecological restoration projects on land use and land cover change and its influences on territorial NPP in Xinjiang, China. Catena 2014, 115, 85–95. [Google Scholar] [CrossRef]
  2. Vitousek, P.M. Global Environmental-Change—An Introduction. Annu. Rev. Ecol. Syst. 1992, 23, 1–14. [Google Scholar] [CrossRef]
  3. Vitousek, P.M.; Mooney, H.A.; Lubchenco, J.; Lubchenco, A.; Melillo, J.M. Human Domination of Earth’s Ecosystems. Urban Ecol. 2008, 277, 3–13. [Google Scholar]
  4. Krausmann, F.; Haberl, H.; Schulz, N.B.; Erb, K.-H.; Darge, E.; Gaube, V. Land-use change and socio-economic metabolism in Austria—Part I: Driving forces of land-use change: 1950–1995. Land Use Policy 2003, 20, 1–20. [Google Scholar] [CrossRef]
  5. Zhang, Z.X.; Wang, X.; Zhao, X.L.; Liu, B.; Yi, L.; Zuo, L.; Wen, Q.; Liu, F.; Xu, J.; Hu, S. A 2010 update of National Land Use/Cover Database of China at 1:100,000 scale using medium spatial resolution satellite images. Remote Sens. Environ. 2014, 149, 142–154. [Google Scholar] [CrossRef]
  6. Lambin, E.F. Monitoring forest degradation in tropical regions by remote sensing: Some methodological issues. Glob. Ecol. Biogeogr. 1999, 8, 191–198. [Google Scholar] [CrossRef]
  7. Turner, B.L.; Lambin, E.F.; Reenberg, A. The emergence of land change science for global environmental change and sustainability. Proc. Natl. Acad. Sci. USA 2007, 104, 20666–20671. [Google Scholar] [CrossRef] [PubMed]
  8. Peng, J.; Wang, Y.L.; Wu, J.S.; Yue, J.; Zhang, Y.; Li, W. Ecological effects associated with land-use changes in China’s southwest agricultural landscape. Int. J. Sustain. Dev. World Ecol. 2006, 8, 315–325. [Google Scholar] [CrossRef]
  9. Tilman, D.; Balzer, C.; Hill, J.; Befort, B.L. Global food demand and the sustainable intensification of agriculture. Proc. Natl. Acad. Sci. USA 2011, 108, 20260–20264. [Google Scholar] [CrossRef] [PubMed]
  10. Lambin, E.F.; Meyfroidt, P. Global land use change, economic globalization, and the looming land scarcity. Proc. Natl. Acad. Sci. USA 2011, 108, 3465–3472. Available online: http://www.pnas.org/cgi/doi/10.1073/pnas.1100480108 (accessed on 15 December 2015). [Google Scholar] [CrossRef] [PubMed]
  11. Godfray, H.C.J.; Crute, I.R.; Haddad, L.; Lawrence, D.; Muir, J.F.; Nisbett, N.; Pretty, J.; Robinson, S.; Toulmin, C.; Whiteley, R. The future of the global food system. Philos. Trans. R. Soc.: B—Biol. Sci. 2010, 365, 2769–2777. [Google Scholar] [CrossRef] [PubMed] [Green Version]
  12. Turner, B.L.; Meyer, W.B.; Skole, D.L. Global Land-Use Land-Cover Change—Towards an Integrated Study. Ambio 1994, 23, 91–95. Available online: http://0-www-jstor-org.brum.beds.ac.uk/stable/4314168 (accessed on 15 December 2015). [Google Scholar]
  13. Wu, X.; Shen, Z.Y.; Liu, R.M.; Ding, X. Land Use/Cover Dynamics in Response to Changes in Environmental and Socio-Political Forces in the Upper Reaches of the Yangtze River, China. Sensors 2008, 8, 8104–8122. [Google Scholar] [CrossRef]
  14. Biederbeck, V.O.; Janzen, H.H.; Campbell, C.A.; Zentner, R.P. Labile soil organic matter as influenced by cropping practices in an arid environment. Soil Biol. Biochem. 1994, 26, 1647–1656. [Google Scholar] [CrossRef]
  15. Lal, R.; Singh, B.R. Effects of soil degradation on crop productivity in East Africa. J. Sustain. Agr. 1998, 13, 15–36. [Google Scholar] [CrossRef]
  16. Zhao, W.Z.; Xiao, H.L.; Liu, Z.M.; Li, J. Soil degradation and restoration as affected by land use change in the semiarid Bashang area, northern China. Catena 2005, 59, 173–186. [Google Scholar] [CrossRef]
  17. Moebius-Clune, B.N.; Van Es, H.M.; Idowu, O.J.; Schindelbeck, R.R.; Kimetu, J.M.; Ngoze, S.; Lehmann, J.; Kinyangi, J.M. Long-term soil quality degradation along a cultivation chronosequence in western Kenya. AgrEcosyst Environ. 2011, 141, 86–99. [Google Scholar] [CrossRef]
  18. Asafu-Adjaye, J. Biodiversity Loss and Economic Growth: A Cross-Country Analysis. Contemp. Econ. Policy 2003, 21, 173–185. [Google Scholar] [CrossRef] [Green Version]
  19. Alkemade, R.; van Oorschot, M.; Miles, L.; Nellemann, C.; Bakkenes, M.; ten Brink, B. GLOBIO3: A Framework to Investigate Options for Reducing Global Terrestrial Biodiversity Loss. Ecosystems 2009, 12, 374–390. [Google Scholar] [CrossRef]
  20. Dotterweich, M.; Stankoviansky, M.; Minar, J.; Koco, Š.; Papčo, P. Human induced soil erosion and gully system development in the Late Holocene and future perspectives on landscape evolution: The Myjava Hill Land, Slovakia. Geomorphology 2013, 201, 227–245. [Google Scholar] [CrossRef]
  21. Qi, S.Z.; Wang, T. Current Status and Causes of Land Desertification in Middle and Lower Reaches of Heihe River Basin. J. Soil Water Conserv. 2003, 17, 98–101,109. (In Chinese) [Google Scholar]
  22. Qi, S.Z.; Luo, F. Land-use change and its environmental impact in the Heihe River Basin, arid northwestern China. Environ. Geol. 2006, 50, 535–540. [Google Scholar] [CrossRef]
  23. Qi, S.Z.; Li, X.Y.; Duan, H.P. Oasis land-use change and its environmental impact in Jinta Oasis, arid northwestern China. Environ. Monit. Assess. 2007, 134, 313–320. [Google Scholar] [CrossRef] [PubMed]
  24. Qi, S.Z.; Luo, F. Environmental degradation problems in the Heihe River Basin, northwest China. Water Environ. J. 2007, 21, 142–148. [Google Scholar] [CrossRef]
  25. Meshesha, D.T.; Tsunekawa, A.; Tsubo, M.; Ali, S.A.; Haregeweyn, N. Land-use change and its socio-environmental impact in Eastern Ethiopia’s highland. Reg. Environ. Change 2014, 14, 757–768. [Google Scholar] [CrossRef]
  26. Bucala, A. The impact of human activities on land use and land cover changes and environmental processes in the Gorce Mountains (Western Polish Carpathians) in the past 50 years. J. Environ. Manag. 2014, 138, 4–14. [Google Scholar] [CrossRef] [PubMed]
  27. Tang, Z.; Engel, B.A.; Pijanowski, B.C.; Lim, K.J. Forecasting land use change and its environmental impact at a watershed scale. J. Environ. Manag. 2005, 76, 35–45. [Google Scholar] [CrossRef] [PubMed]
  28. Yuan, F. Land-cover change and environmental impact analysis in the Greater Mankato area of Minnesota using remote sensing and GIS modeling. Int. J. Remote Sens. 2008, 29, 1169–1184. [Google Scholar] [CrossRef]
  29. Rosen, A.M. The impact of environmental change and human land use on alluvial valleys in the Loess Plateau of China during the Middle Holocene. Geomorphology 2008, 101, 298–307. [Google Scholar] [CrossRef]
  30. Sanli, F.B.; Balcik, F.B.; Goksel, C. Defining temporal spatial patterns of mega city Istanbul to see the impacts of increasing population. Environ. Monit. Assess. 2008, 146, 267–275. [Google Scholar] [CrossRef] [PubMed]
  31. Yi, L.; Zhang, Z.X.; Wang, X.; Liu, B.; Zuo, L.; Zhao, X.; Wang, J. Spatial-temporal change of major reserve resources of cultivated land in China in recent 30 years. Trans. Chin. Soc. Agric. Eng. 2013, 29, 1–12. (In Chinese) [Google Scholar]
  32. Yang, X.C.; Xu, B.; Jin, Y.X.; Qin, Z.; Ma, H.; Li, J.; Zhao, F.; Chen, S.; Zhu, X. Remote sensing monitoring of grassland vegetation growth in the Beijing–Tianjin sandstorm source project area from 2000 to 2010. Ecol. Indic. 2015, 51, 244–251. [Google Scholar] [CrossRef]
  33. Costanza, R.; d’Arge, R.; de Groot, R.; Farber, S.; Grasso, M.; Hannon, B.; Limburg, K.; Naeem, S.; O’Neill, R.V.; Paruelo, J.; et al. The value of the world’s ecosystem services and natural capital. Nature 1997, 387, 253–260. [Google Scholar] [CrossRef]
  34. Xie, G.D.; Lu, C.X.; Yu, X.; Zheng, D. The Economic Evaluation of Grassland Ecosystem Services in Qinghai-Tibet Plateau. J. Mt. Res. 2003, 21, 50–55. (In Chinese) [Google Scholar]
  35. Li, X. The urban land use transformations and associated effects on eco-environment in northwest China arid region: A case study in Hexiregion,Gansu province. Quat. Sci. 2003, 23, 280–290. (In Chinese) [Google Scholar]
  36. Liu, Y.S.; Gao, J.; Yang, Y.F. A holistic approach towards assessment of severity of land degradation along the Great Wall in Northern Shaanxi Province, China. Environ. Monit. Assess. 2003, 82, 187–202. [Google Scholar] [CrossRef] [PubMed]
  37. Yang, S.H.; Yan, H.L.; Guo, L.Y. The Land Use Change and Its Eco-environmental Effects in Transitional Agro-pastoral Region—A Case Study of Yulin City in Northern Shaanxi Province. Prog. Geogr. 2004, 23, 49–55. (In Chinese) [Google Scholar]
  38. Hao, H.M.; Ren, Z.Y. Land Use/Land Cover Change (LUCC) and Eco-Environment Response to LUCC in Farming-Pastoral Zone, China. Agric. Sci. China 2009, 8, 91–97. (In Chinese) [Google Scholar] [CrossRef]
  39. Xie, G.D.; Zhen, L.; Lu, C.X.; Xiao, Y.; Chen, C. Expert knowledge based valuation method of ecosystem services in China. J. Nat. Resour. 2008, 23, 911–919. (In Chinese) [Google Scholar]
  40. Zhang, J.P.; Chang, X.L.; Li, J.Y.; Cai, M.Y. Temporal and spatial changing of cropland in farming-pastural zone. J. Arid Land Resour. Environ. 2008, 22, 25–30. (In Chinese) [Google Scholar]
  41. Song, G.; Li, N.; Li, J.; Liu, H.J.; Song, S.M. The land use/cover change and its eco-environmental effects the interaction mechanism in Jiansanjiang. Econ. Geogr. 2011, 31, 816–821. (In Chinese) [Google Scholar]
  42. Chi, S.; Zhang, H. The Area Changes of Land Use and Ecological Environment Effect of Right-Wing Central Banner of Kerqin Region. Jilin Norm. Univ. J. 2013, 4, 93–98. (In Chinese) [Google Scholar]
  43. Chen, Y.; Tang, H. Desertification in north China: Background, anthropogenic impacts and failures in combating it. Land Degrad. Dev. 2005, 16, 367–376. [Google Scholar] [CrossRef]
  44. Gao, J.X.; Yang, Z.P. Restoration of ecological functions: Goal and orientation of ecological restoration in China. J. Ecol. Rural Environ. 2015, 31, 1–6. (In Chinese) [Google Scholar]
  45. Miao, L.J.; Jiang, C.; Xue, B.; Liu, Q.; He, B.; Nath, R.; Cui, X. Vegetation dynamics and factor analysis in arid and semi-arid Inner Mongolia. Environ. Earth Sci. 2015, 73, 2343–2352. [Google Scholar] [CrossRef]
  46. Sun, G.; Wang, M. Study on Relation and Distribution Between Vegetative Coverage and Land Degradation in Inner Mongolia. J. Arid Land Resour. Environ. 2008, 22, 140–144. (In Chinese) [Google Scholar]
  47. Mitsch, W.J.; Gosselink, J.G. The value of wetlands: importance of scale and landscape setting. Ecol. Econ. 2000, 35, 25–33. [Google Scholar] [CrossRef]
  48. Wang, Z.M.; Huang, N.; Luo, L.; Li, X.; Ren, C.; Song, K.; Chen, J.M. Shrinkage and fragmentation of marshes in the West Songnen Plain, China, from 1954 to 2008 and its possible causes. Int. J. Appl. Earth Obs. Geoinf. 2011, 13, 477–486. [Google Scholar] [CrossRef]
  49. Wang, O. Agricultural Ecological Compensation Mechanism in Grazing Forbidden Area. China Popul. Resour. Environ. 2006, 16, 33–38. (In Chinese) [Google Scholar]
Figure 1. The constituted proportion of all types of UL in three natural zones of China in 2010.
Sustainability 08 00184 g001
Figure 2. Distribution of China’s unused land in 2010 and of the average annual precipitation from 1980 to 2010 (the bright blue line is the rainfall contour line of 400 mm).
Sustainability 08 00184 g002
Figure 3. The area and population density of UL in each province, in 2010.
Sustainability 08 00184 g003
Figure 4. The enhanced vegetation index (EVI) of China on 12 July 2010.
Sustainability 08 00184 g004
Figure 5. Linear trend analysis of average annual precipitation and annual mean air temperature from 1980 to 2010 in China and in the Arid and Semi-arid region, Qinghai-Tibet Plateau region, Inner Mongolia Autonomous Region, and Xinjiang Autonomous Region.
Sustainability 08 00184 g005
Figure 6. Contribution rate changes of each province’s ecological response to UL changes from the late 1980s to 2010.
Sustainability 08 00184 g006
Figure 7. The per capita GDP and the gross output value of animal husbandry in China and the main provinces with major UL changes from the late 1980s to 2010.
Sustainability 08 00184 g007
Table 1. Land use classification and eco-environmental quality values of different land-use types.
Land Use TypesSub-TypesCLand Use TypesSub-TypesC
No.NameNo.NameNo.NameNo.Name
1Farmland11Paddy field0.304Water bodies45Beach0.45
12Dry-farming land0.2546Flood plain0.55
2Woodland21Forest land0.955Built-up land51Urban land0.20
22Shrub land0.6552Rural settlements0.20
23Sparse woodland0.4553Other built-up0.15
24Other woodland0.406Unused land (UL)61Sandy land0.01
3Grassland31High coverage grassland0.7562Gobi0.01
32Moderate coverage grassland0.4563Saline-alkali land0.05
33Low coverage grassland0.2064Swampland0.65
4Water bodies41Stream and rivers0.5565Bare soil0.05
42Lakes0.7566Bare rock 0.01
43Reservoir and ponds0.5567Other UL0.01
44Glacier and perennial snowfields0.90
Note: C stands for eco-environmental quality value.
Table 2. The relevant natural environmental value of different UL types.
Average Annual Rainfall a (mm)Annual Average Temperature a (°C)Average Elevation b (m)EVI c
Sand84.19.571293.30.0686
Gobi99.597.171734.340.0639
Salina144.226.151691.220.116
Wetland442.912.281253.80.436
Bare soil149.66.331587.720.112
Bare rock294.235.833516.470.0962
Others267.121.34665.10.1113
Average211.685.522248.850.1434
a The average annual rainfall and the annual average temperature were calculated according to weather station data from 1980 to 2010. b Average elevation data were derived from the DEM (30 m × 30 m) grid obtained from the State Bureau of Surveying and Mapping of China. c EVI was the enhanced vegetation index derived from MODIS’s EVI on 12 July 2010 (downloaded from the NASA's website).
Table 3. Driving forces and contribution rates to the regional eco-environment dynamic in China. %.
Factors Improving the Eco-EnvironmentThe Late 1980s to 20001995 to 20002000 to 20052005 to 20082008 to 2010
Returning sand and saline land to grassland16.3910.9311.4227.6521.71
Increasing water area7.7111.7710.4712.6214.96
Reclaiming farmland from sand and Gobi2.982.148.6611.9616.30
Returning sand and bare soil into woodland2.831.472.021.310.34
Converting sand and saline land into marsh2.873.010.790.990.27
Returning farmland to marsh2.013.640.851.540.66
Returning middle and low coverage grasslands to marsh1.762.722.221.360.92
Sand and Gobi occupied by built-up areas0.620.341.252.795.80
Returning reservoir and ponds to marsh0.280.170.660.561.38
Other0.060.100.130.060.04
Total37.5036.3138.4360.8062.36
Factors deteriorating the eco-environmentThe late 1980s to 20001995 to 20002000 to 20052005 to 20082008 to 2010
Grassland degradation to desert−25.31−31.68−28.91−5.35−5.13
Reclaiming farmland from marsh−18.01−14.67−7.41−9.36−7.02
Water area conversion to desert −7.80−4.53−12.44−14.44−8.39
Marsh degradation to sand and Saline land−5.26−5.30−1.36−0.36−0.20
Marsh degradation to grasslands −2.54−3.50−2.75−2.97−2.56
Leaving uncultivated land to form sand and saline land−1.36−2.08−6.55−0.70−0.91
Logging woodland degradation to sand and saline land−1.30−1.26−0.96−3.41−4.67
Marsh occupied by reservoir and ponds−0.45−0.19−0.52−0.87−1.51
Marsh occupied by built-up areas−0.31−0.29−0.65−1.74−7.24
Saline land degradation to sand−0.15−0.180.020.000.00
Other0.00−0.02−0.010.00−0.02
Total−62.50−63.69−61.58−39.20−37.63

