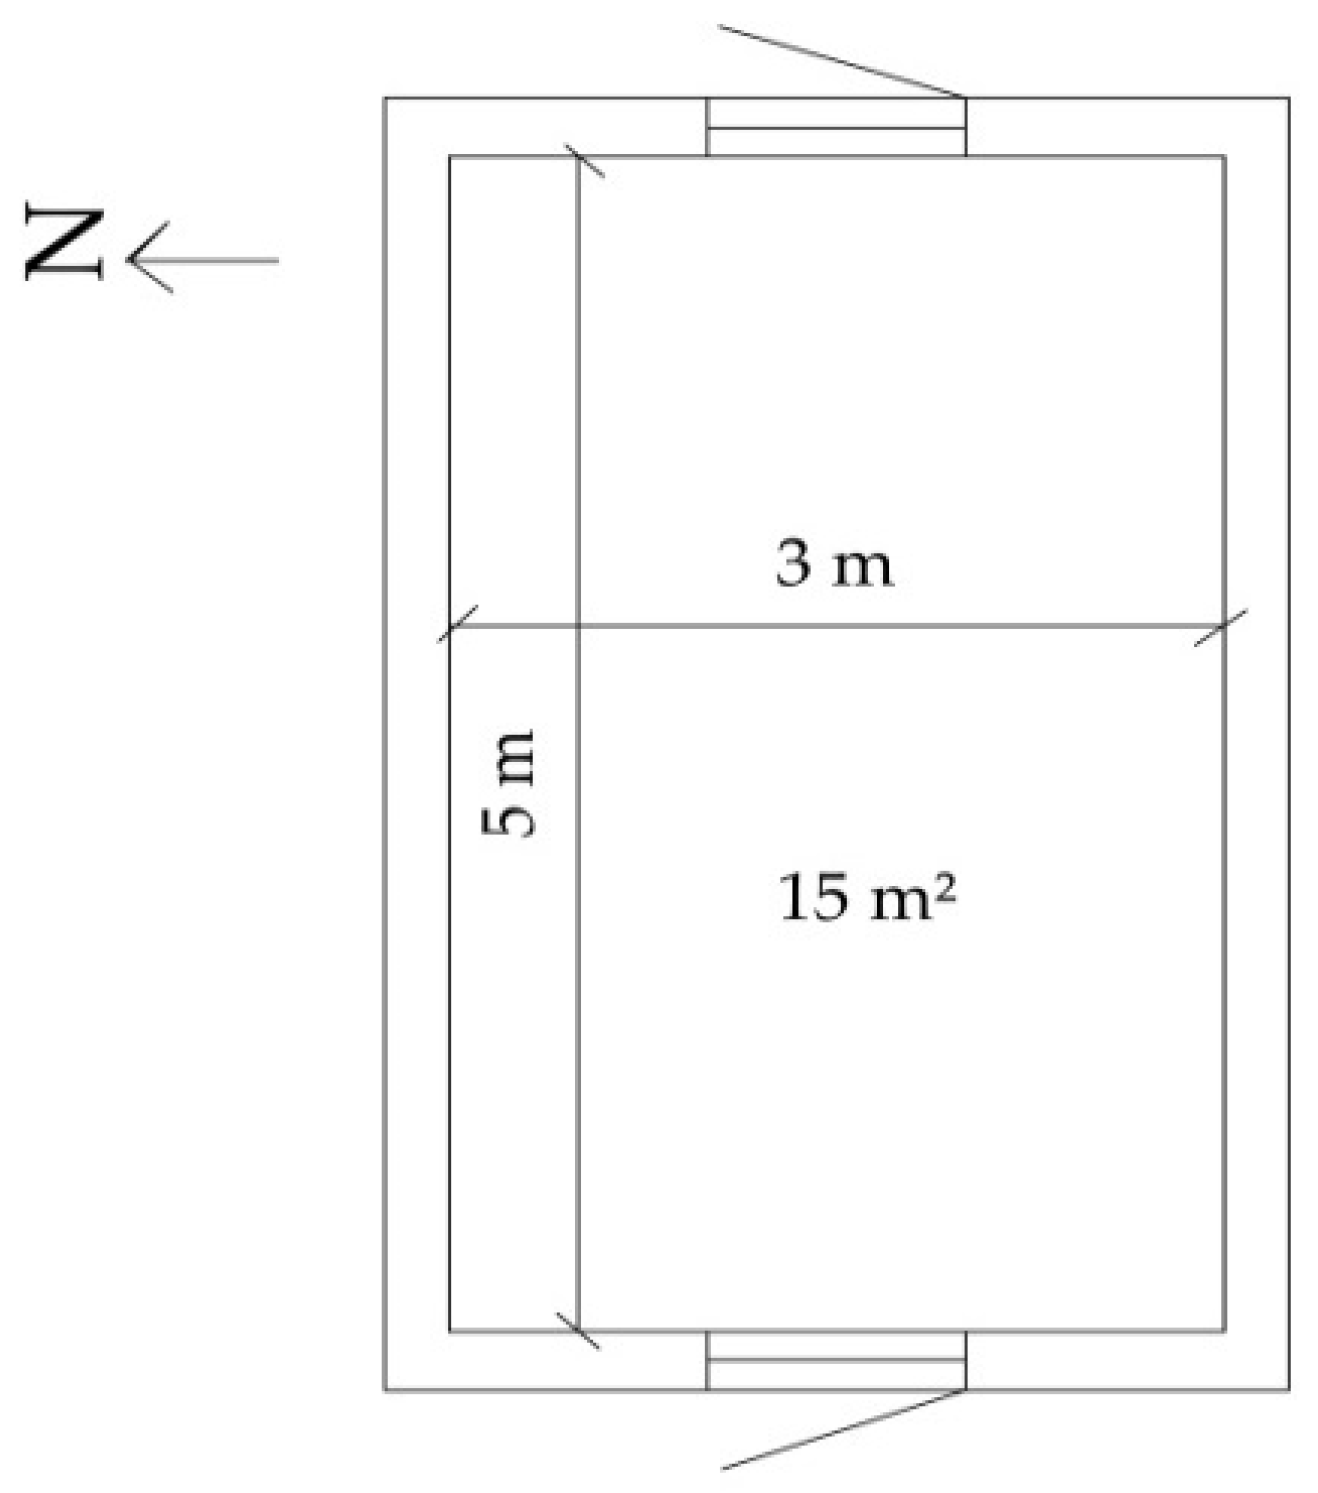
Figure 1.
Plan of the naturally-ventilated model office with dimensions (3.0 m × 5.0 m × 3.0 m).
Figure 1.
Plan of the naturally-ventilated model office with dimensions (3.0 m × 5.0 m × 3.0 m).
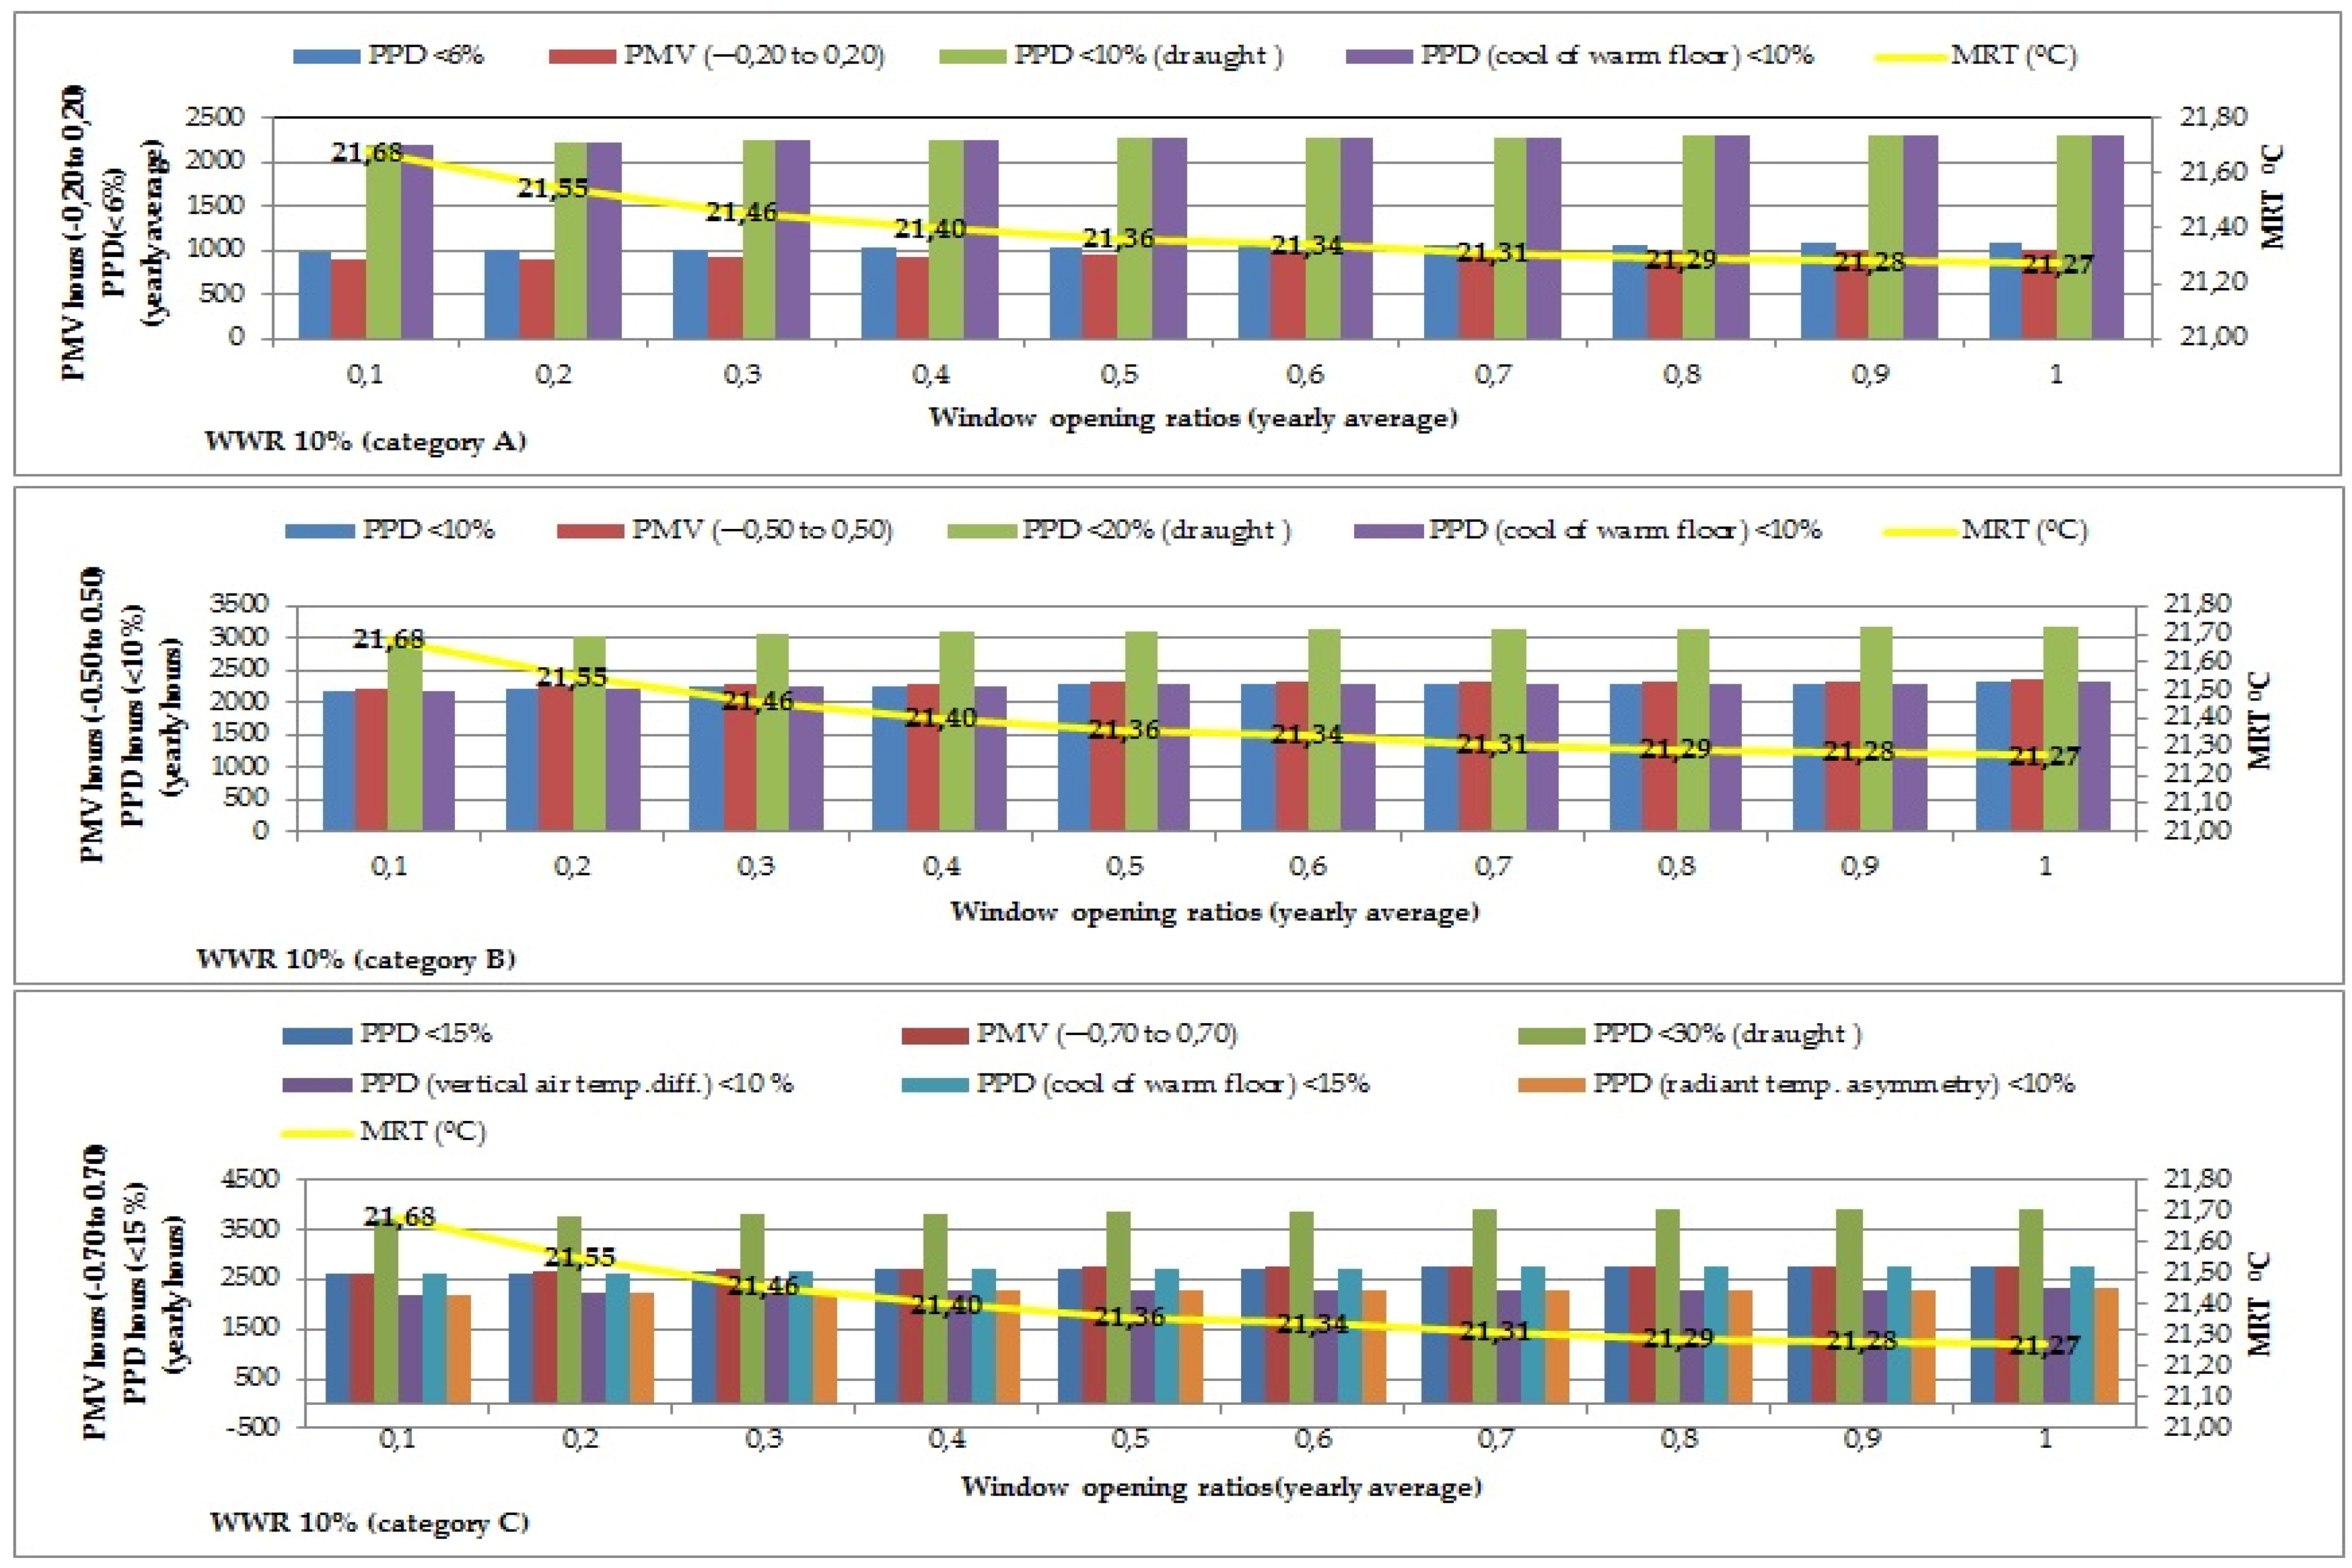
Figure 2.
Predicted Mean Vote (PMV) and Predicted Percentage of Dissatisfied People (PPD) for categories A,B, and C by means of hours (out of 8760 h in a whole year) for WWR 10% with all window opening ratios (from 0.1 to 1) with M: 1.2 met, air speed of 0.15–0.3 m/s, clothing value with 0.6–0.95 clo.
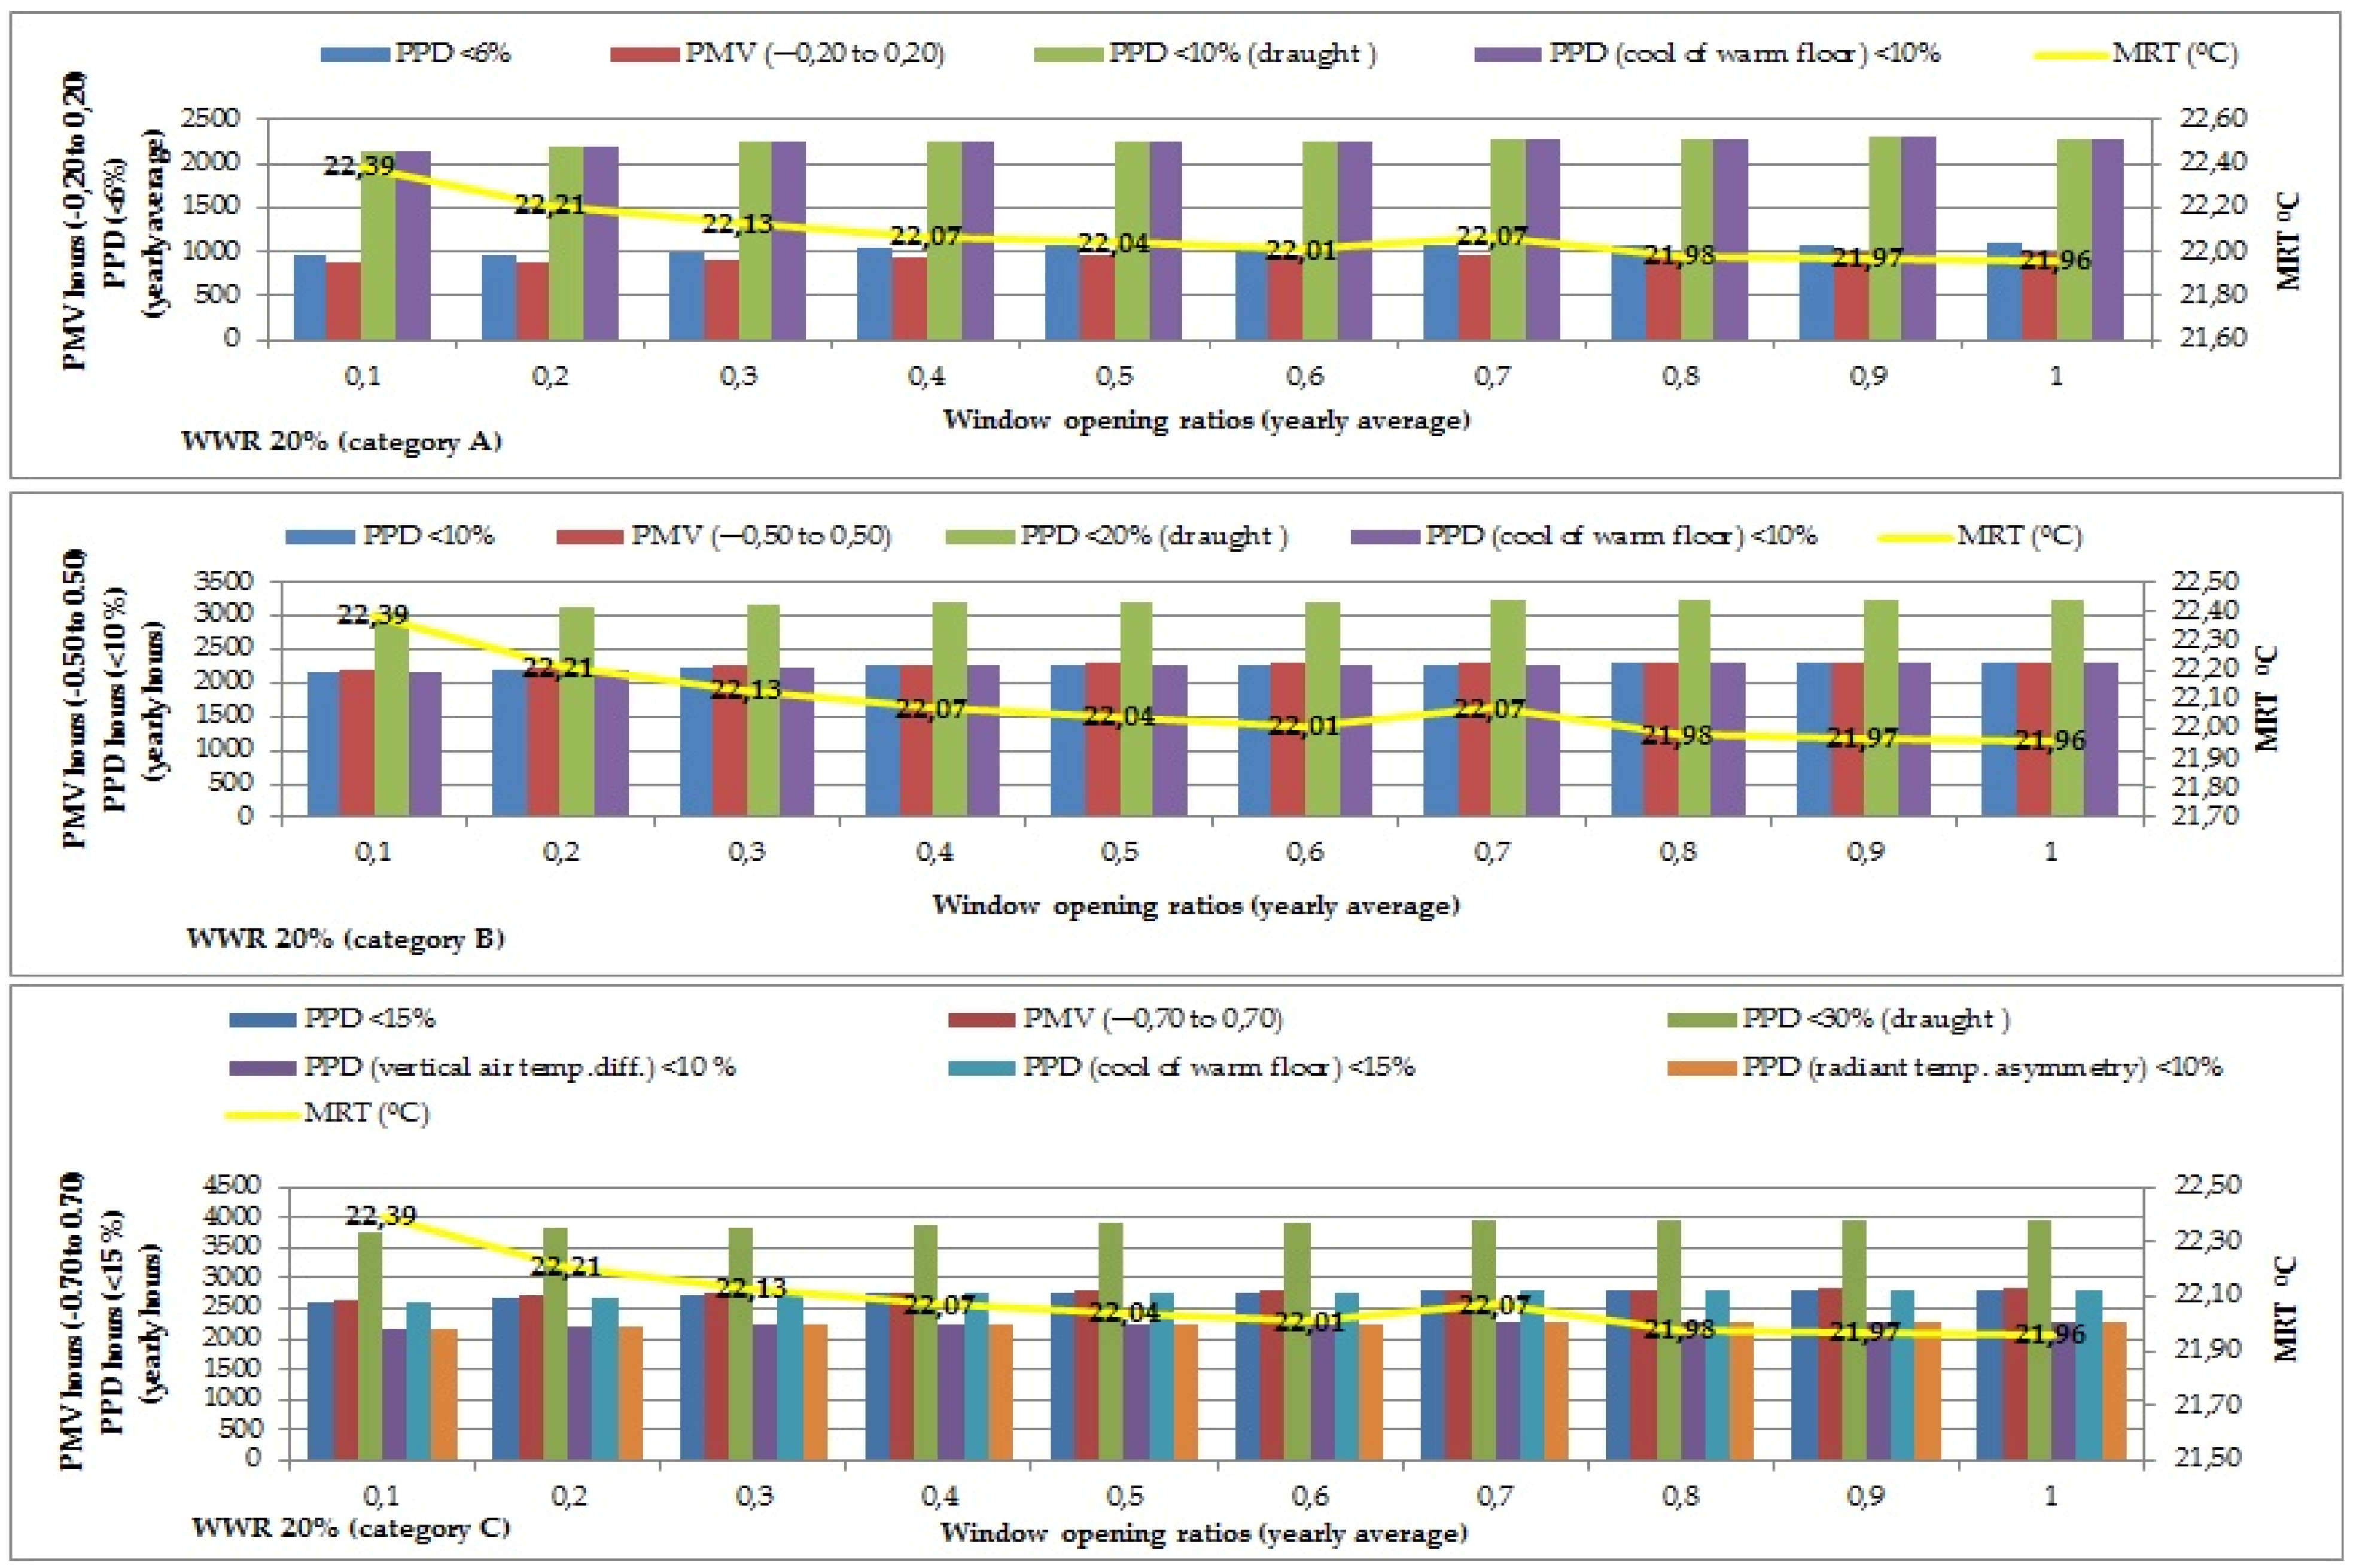
Figure 3.
Predicted Mean Vote (PMV) and Predicted Percentage of Dissatisfied People (PPD) for categories A,B, and C by means of hours (out of 8760 h in a whole year) for WWR 20% with all window opening ratios (from 0.1 to 1) with M: 1.2 met, air speed of 0.15–0.3 m/s, clothing value with 0.6–0.95 clo.
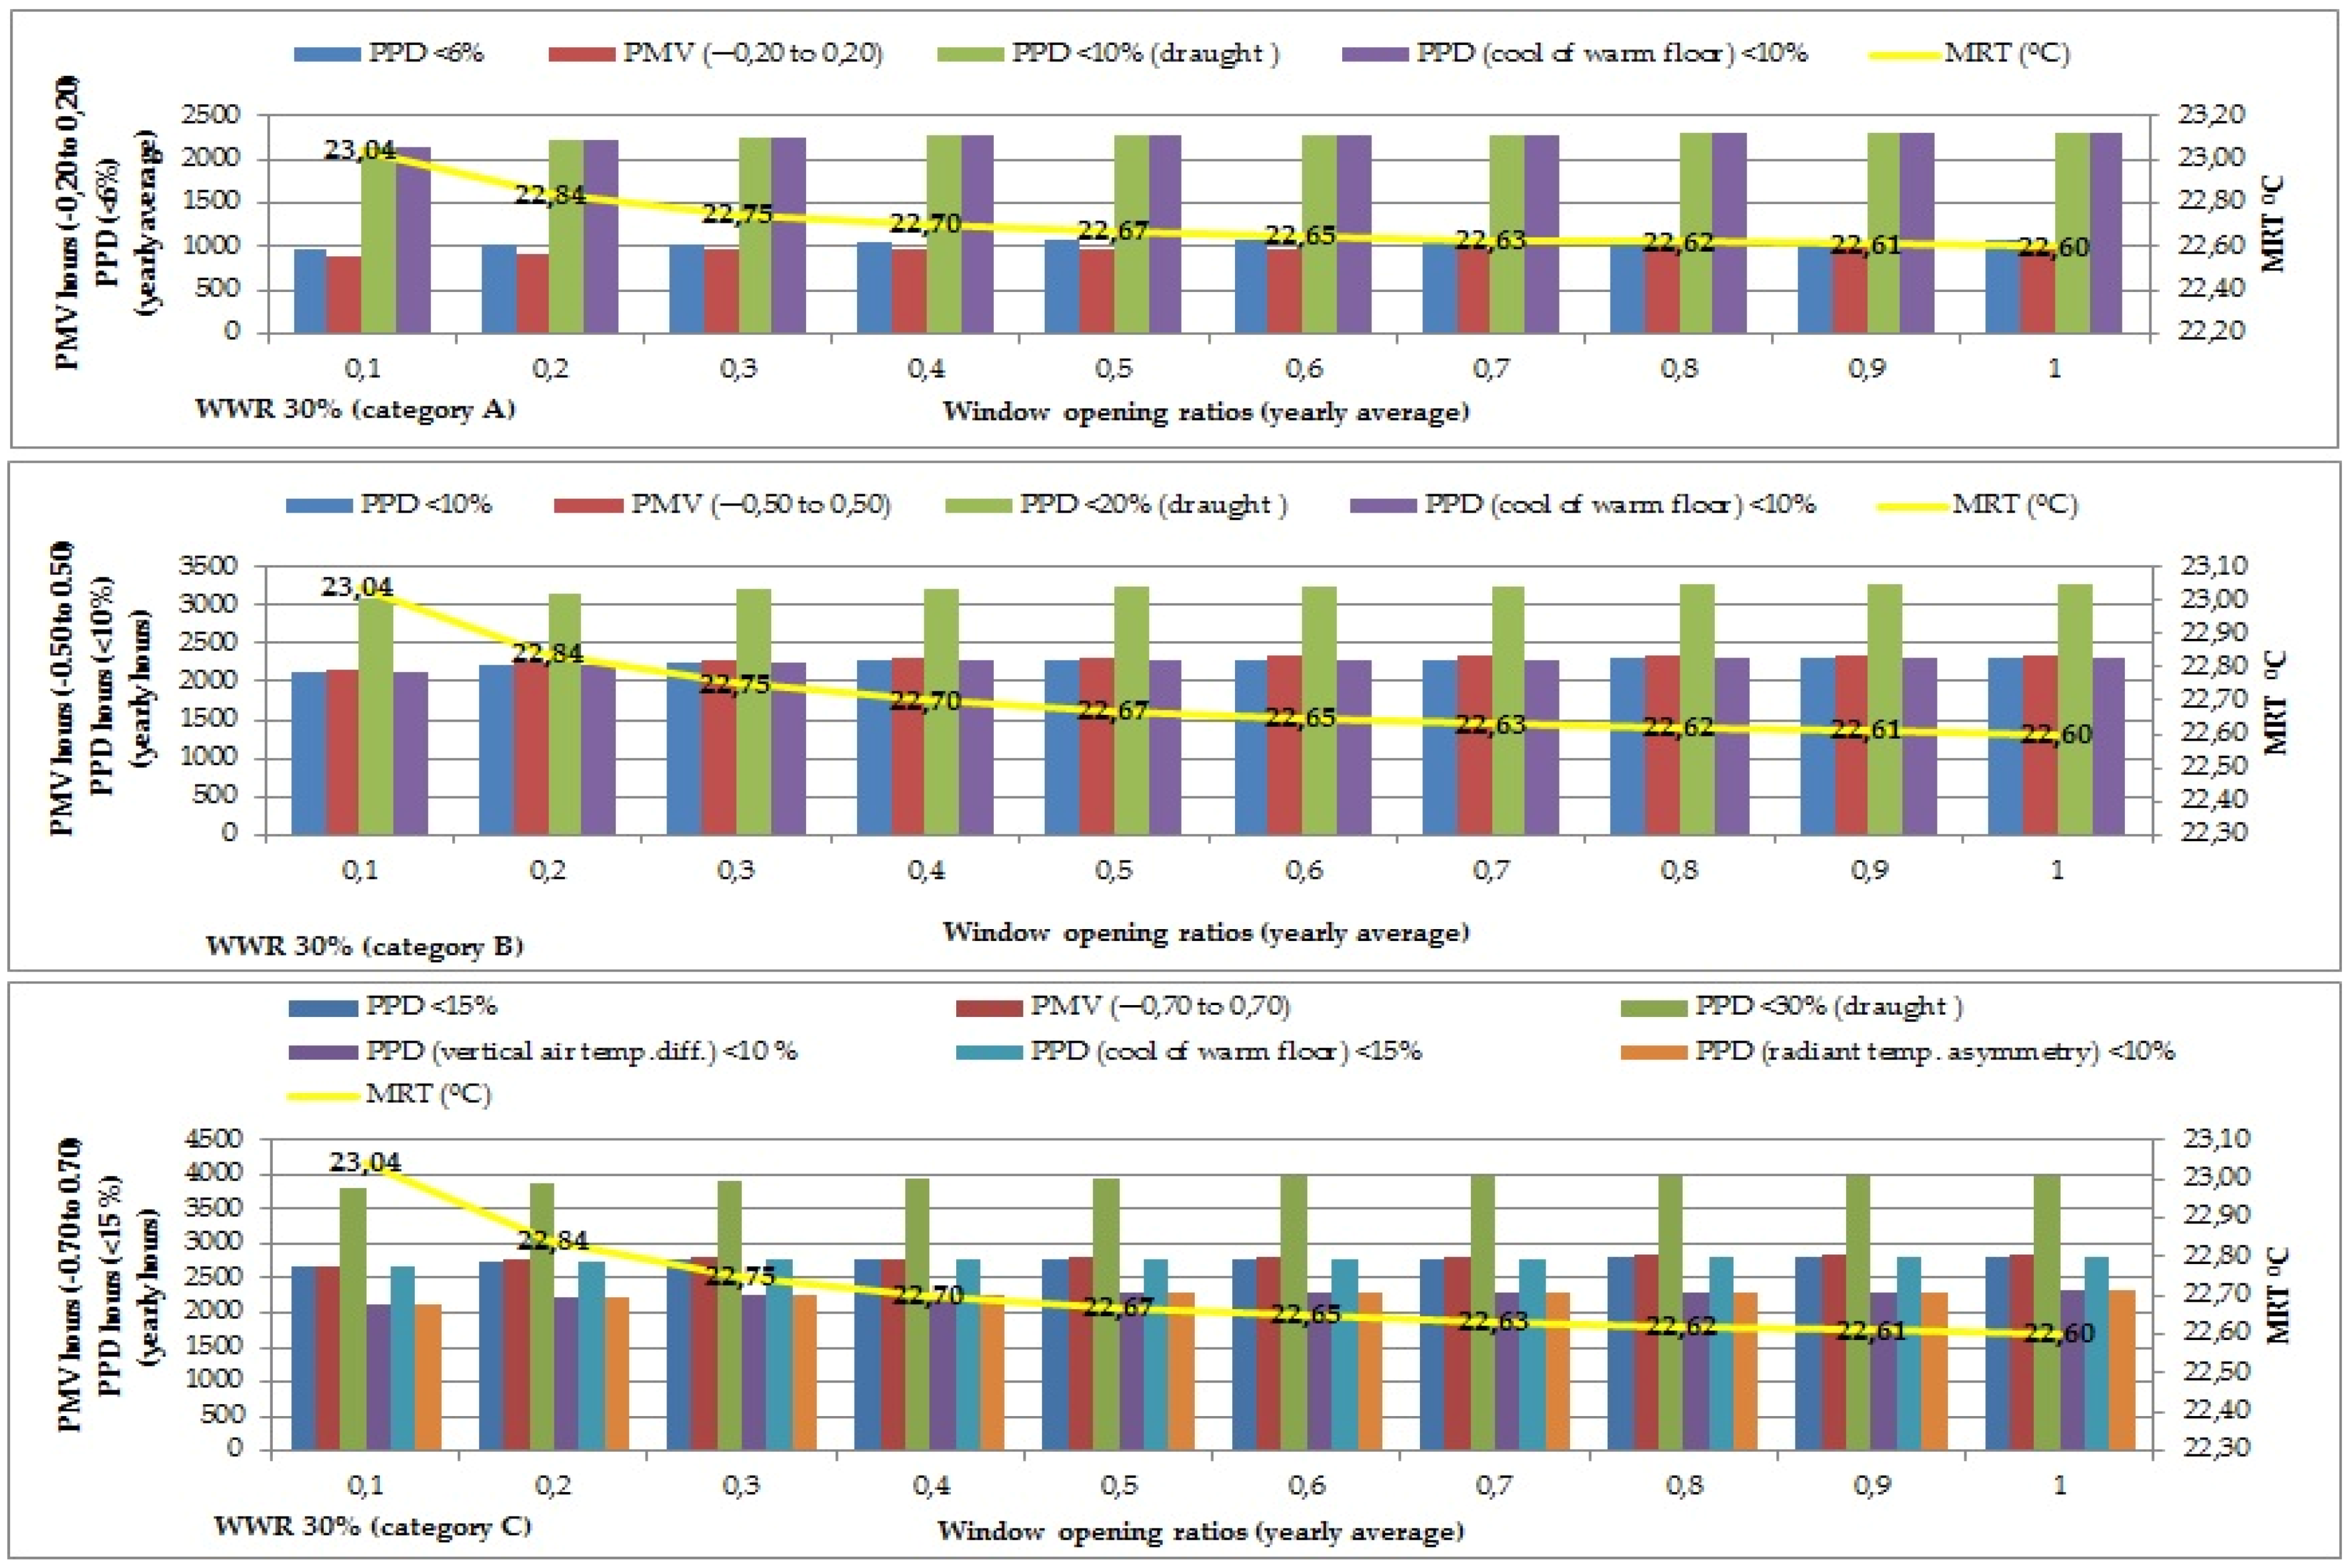
Figure 4.
Predicted Mean Vote (PMV) and Predicted Percentage of Dissatisfied People (PPD) for categories A,B, and C by means of hours (out of 8760 h in a whole year) for WWR 30% with all window opening ratios (from 0.1 to 1) with M: 1.2 met, air speed of 0.15–0.3 m/s, clothing value with 0.6–0.95 clo.
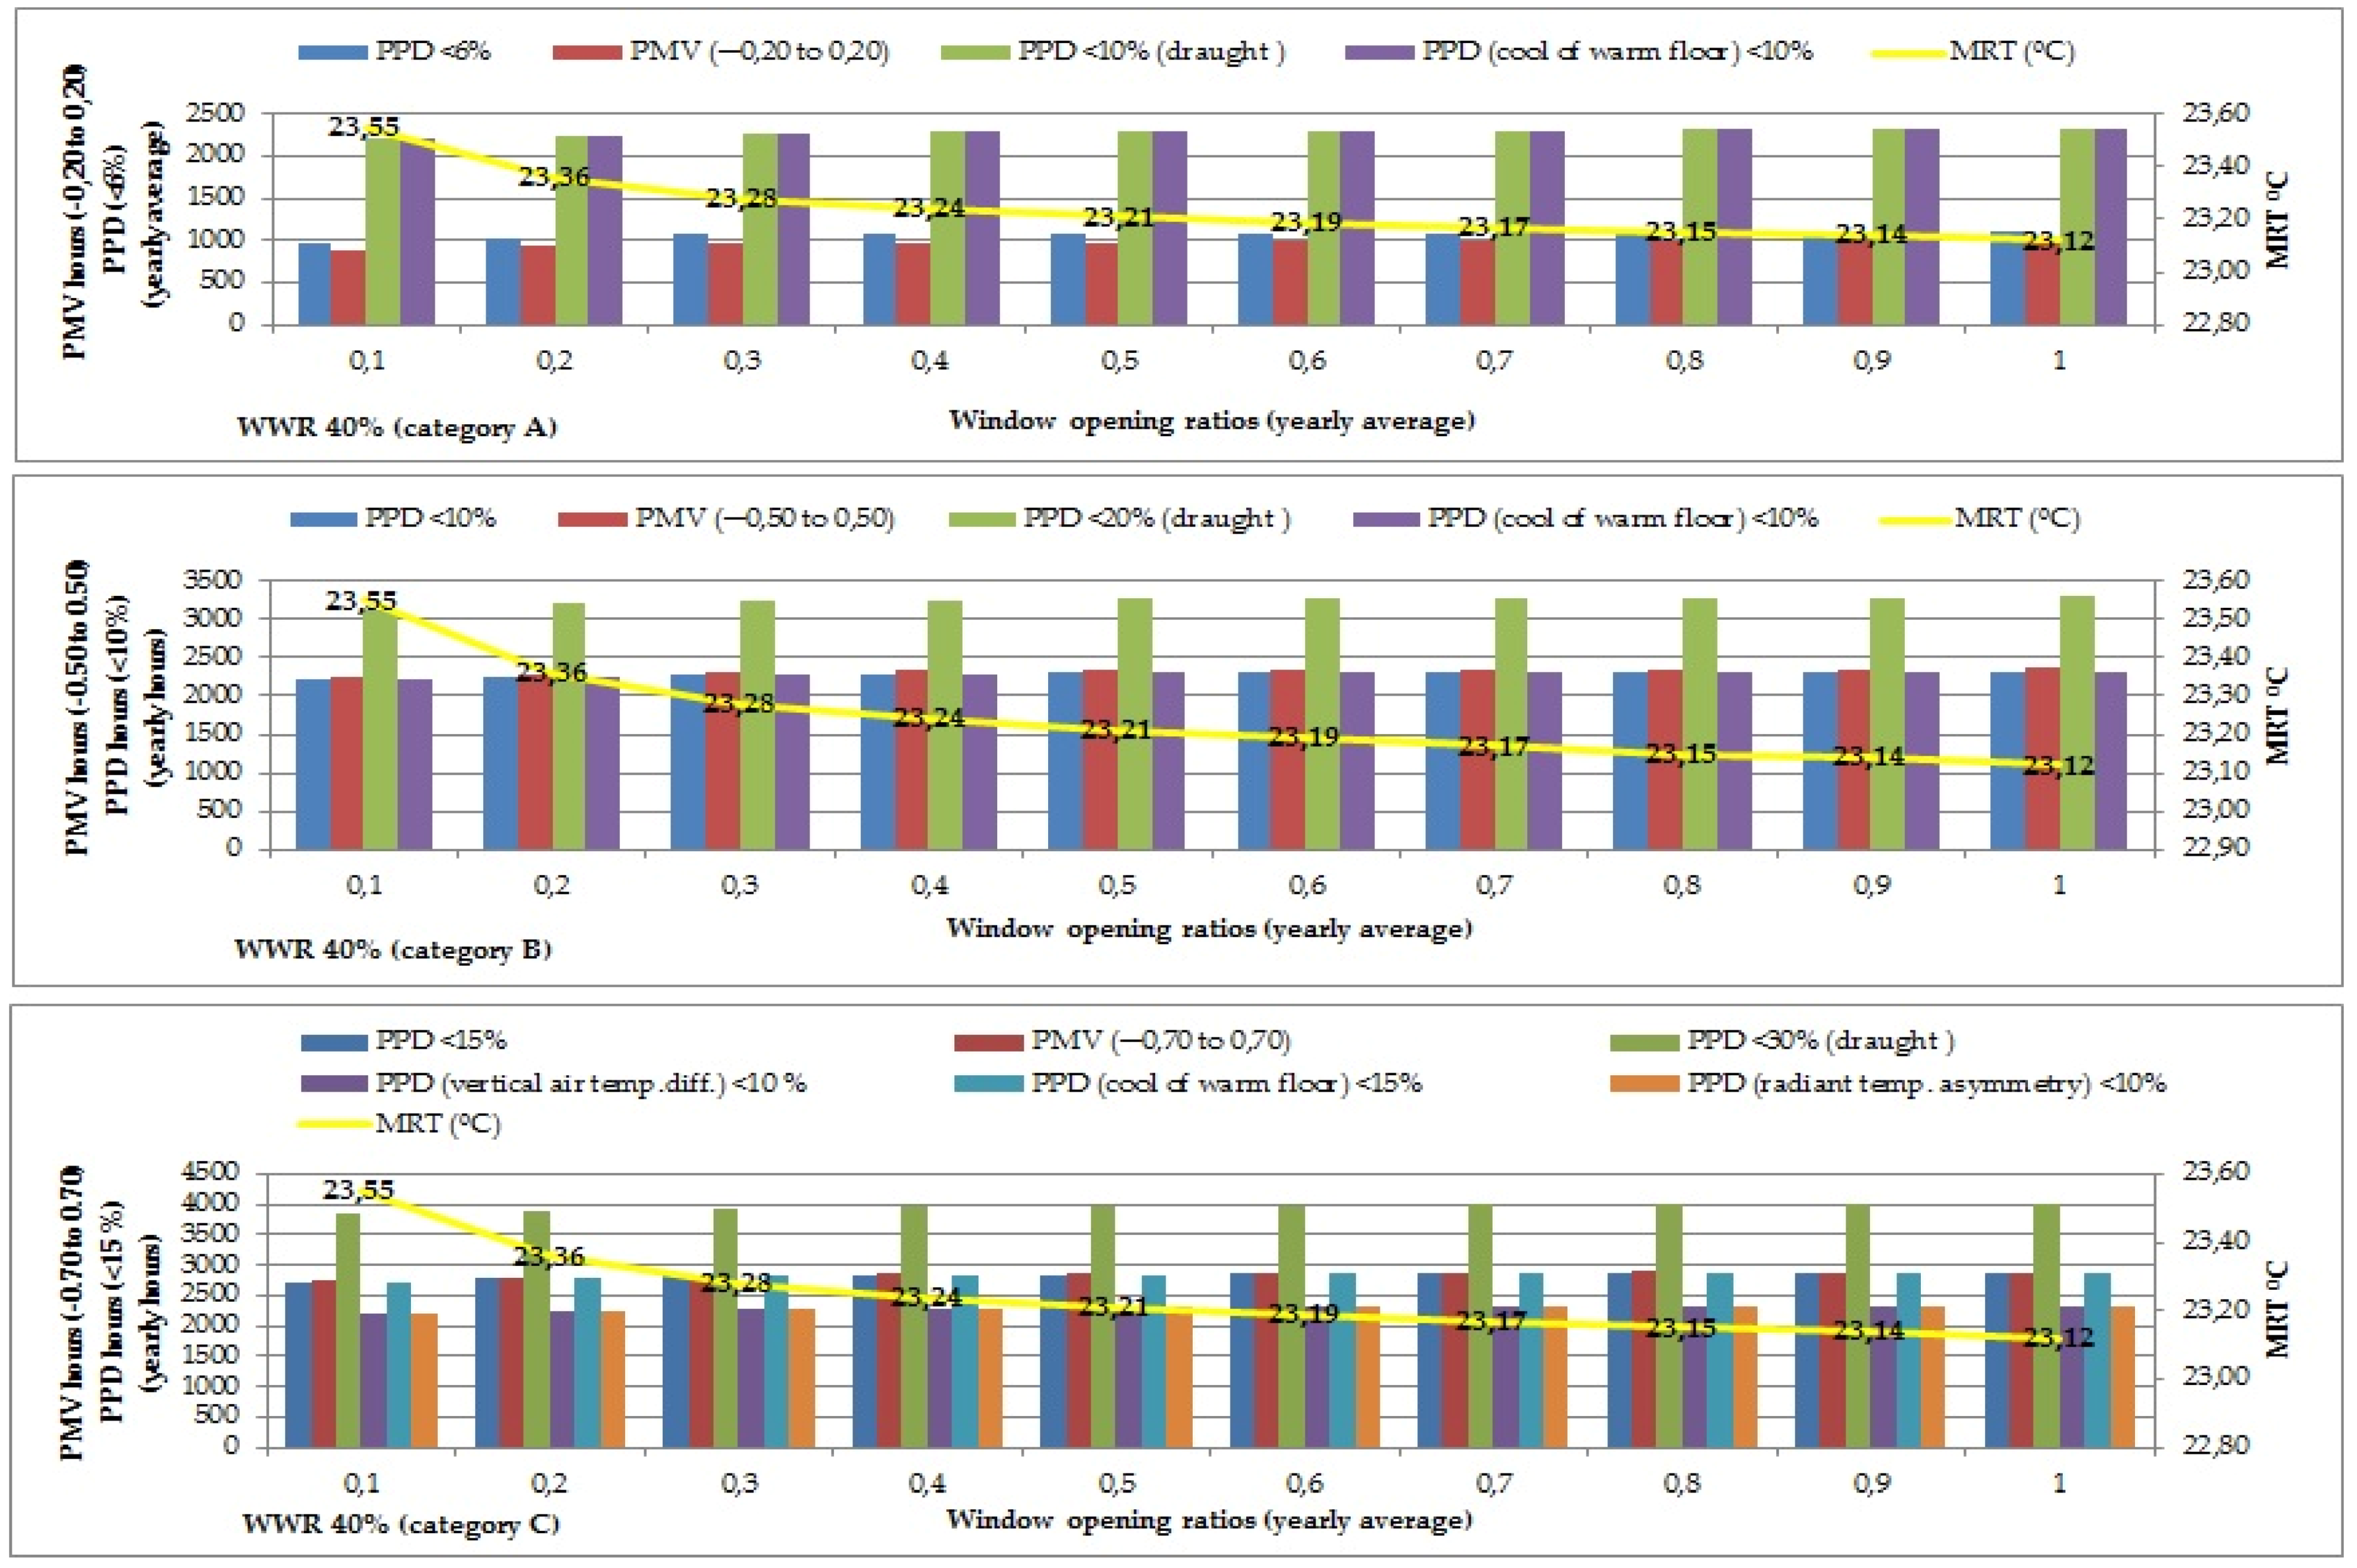
Figure 5.
Predicted Mean Vote (PMV) and Predicted Percentage of Dissatisfied People (PPD) for categories A,B, and C by means of hours (out of 8760 h in a whole year) for WWR 40% with all window opening ratios (from 0.1 to 1) with M: 1.2 met, air speed of 0.15–0.3 m/s, clothing value with 0.6–0.95 clo.
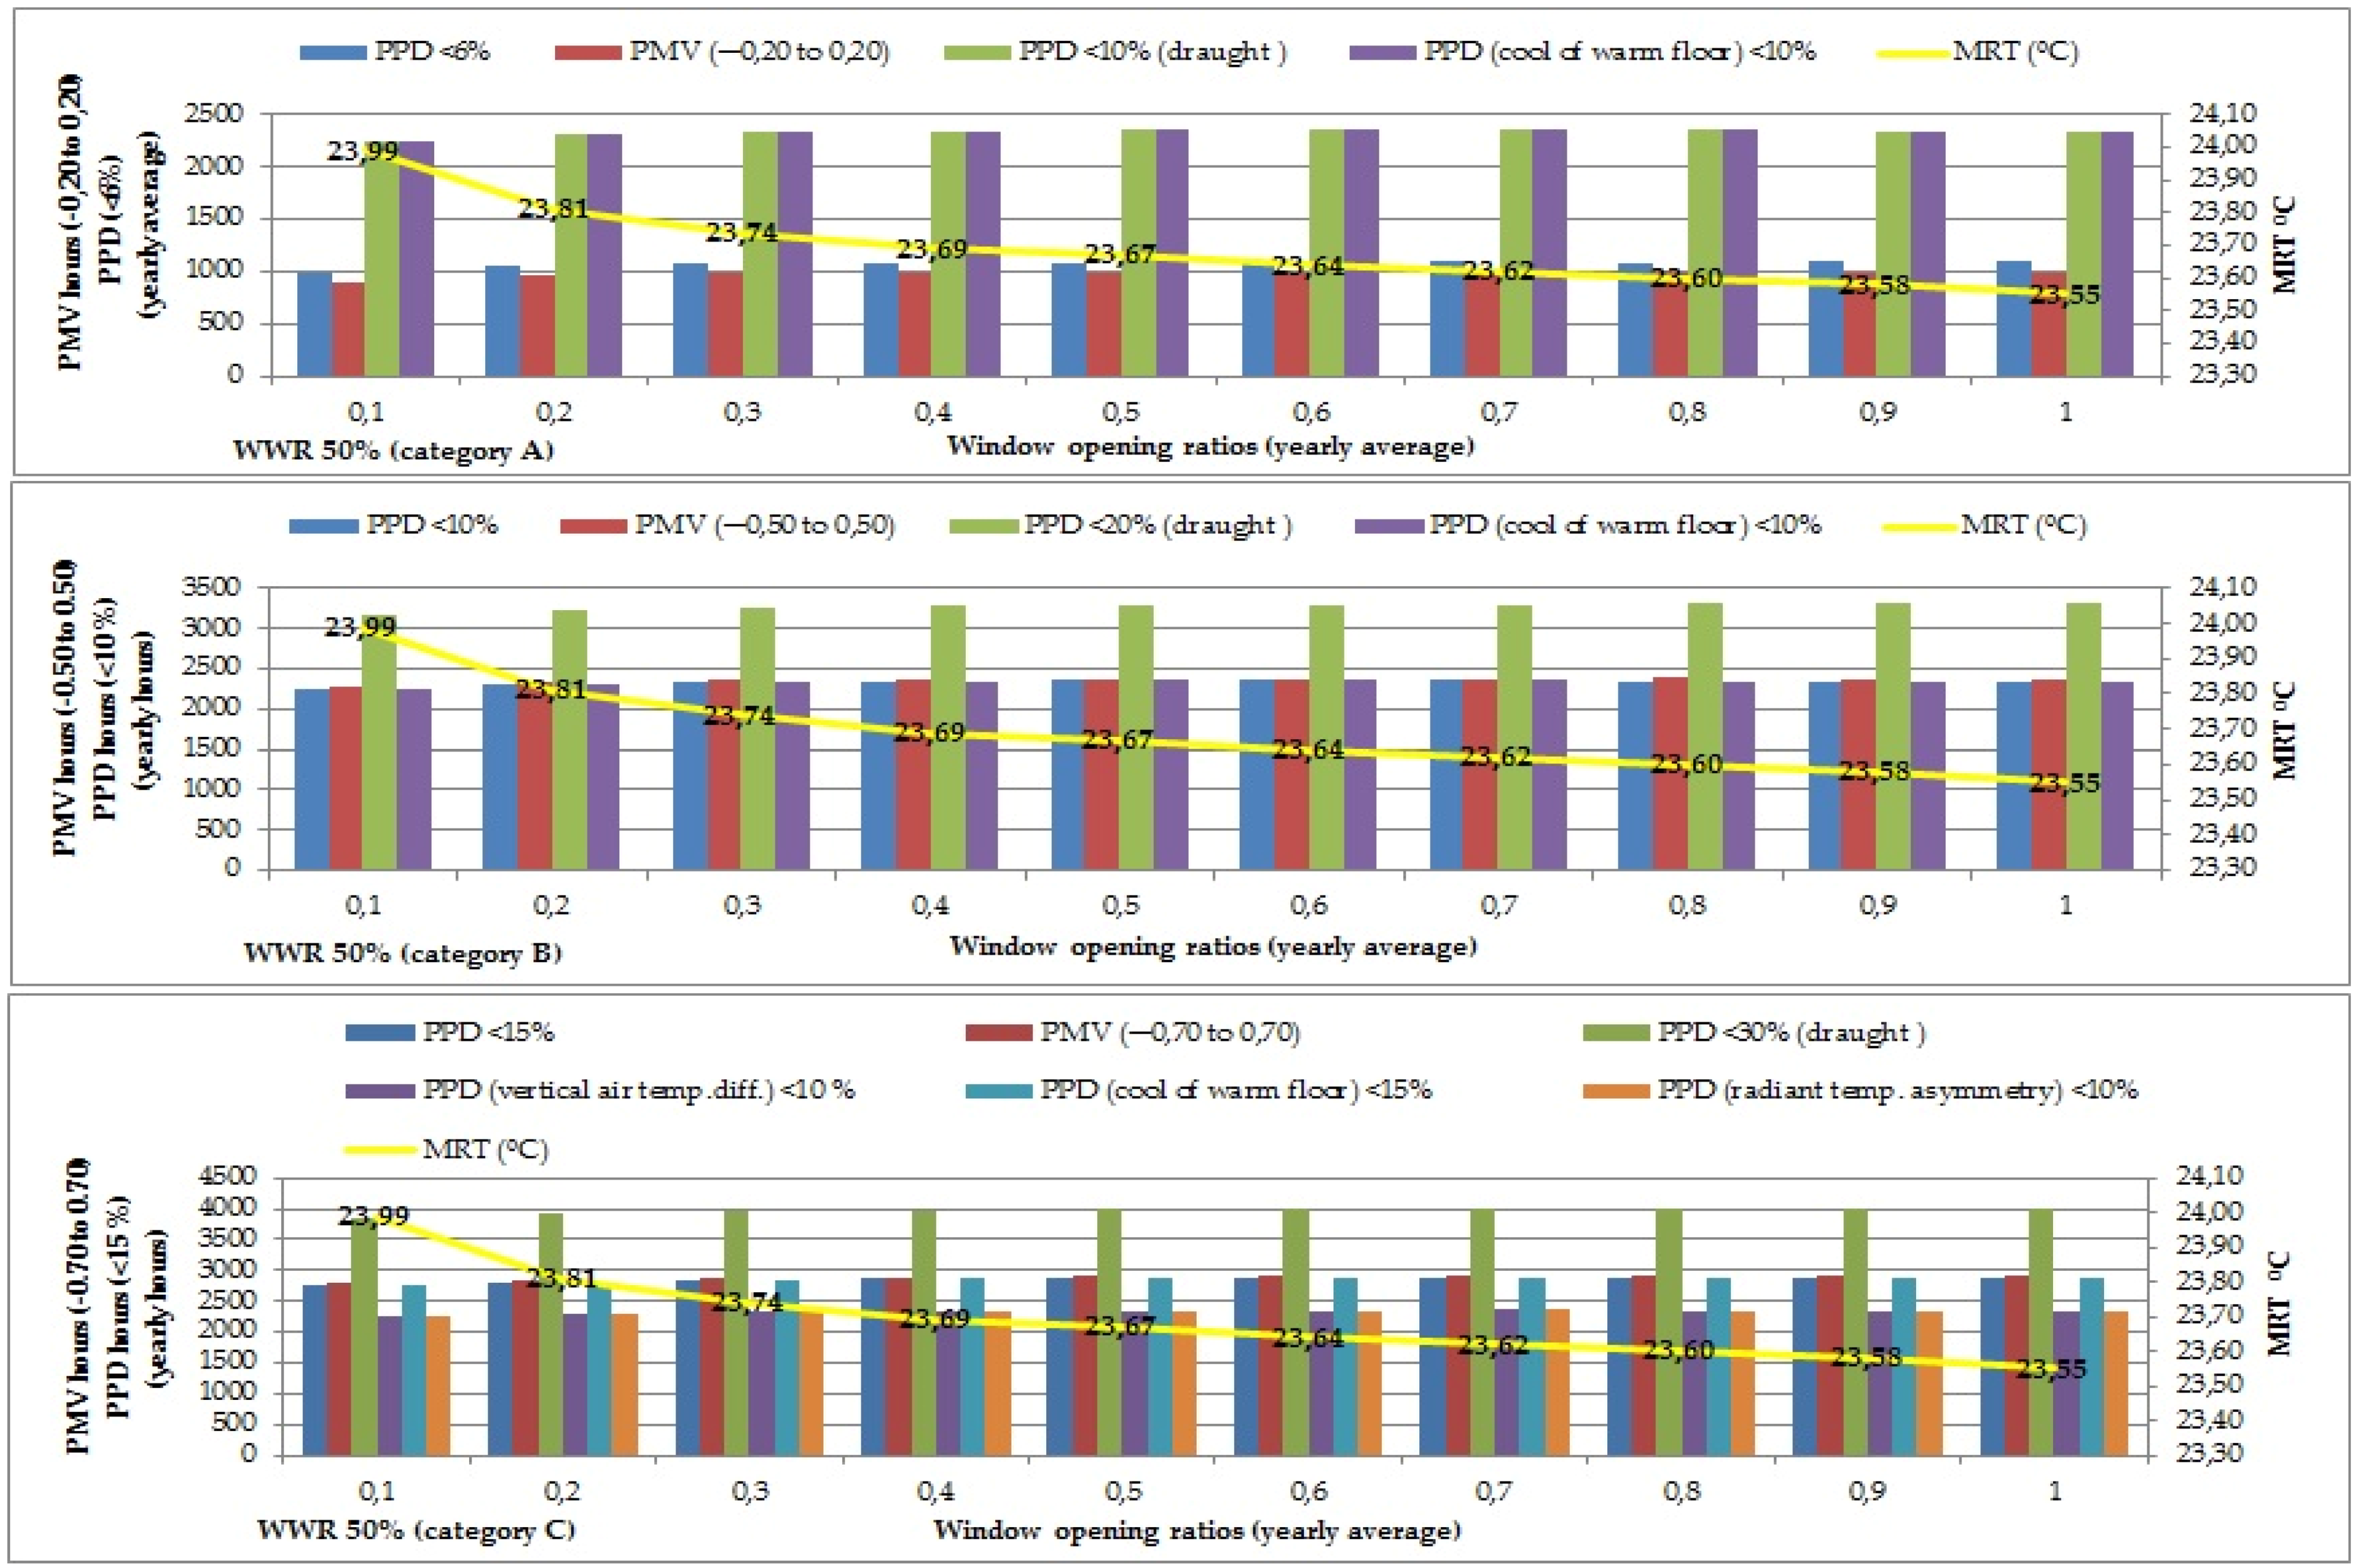
Figure 6.
Predicted Mean Vote (PMV) and Predicted Percentage of Dissatisfied People (PPD) for categories A,B, and C by means of hours (out of 8760 h in a whole year) for WWR 50% with all window opening ratios (from 0.1 to 1) with M: 1.2 met, air speed of 0.15–0.3 m/s, clothing value with 0.6–0.95 clo.
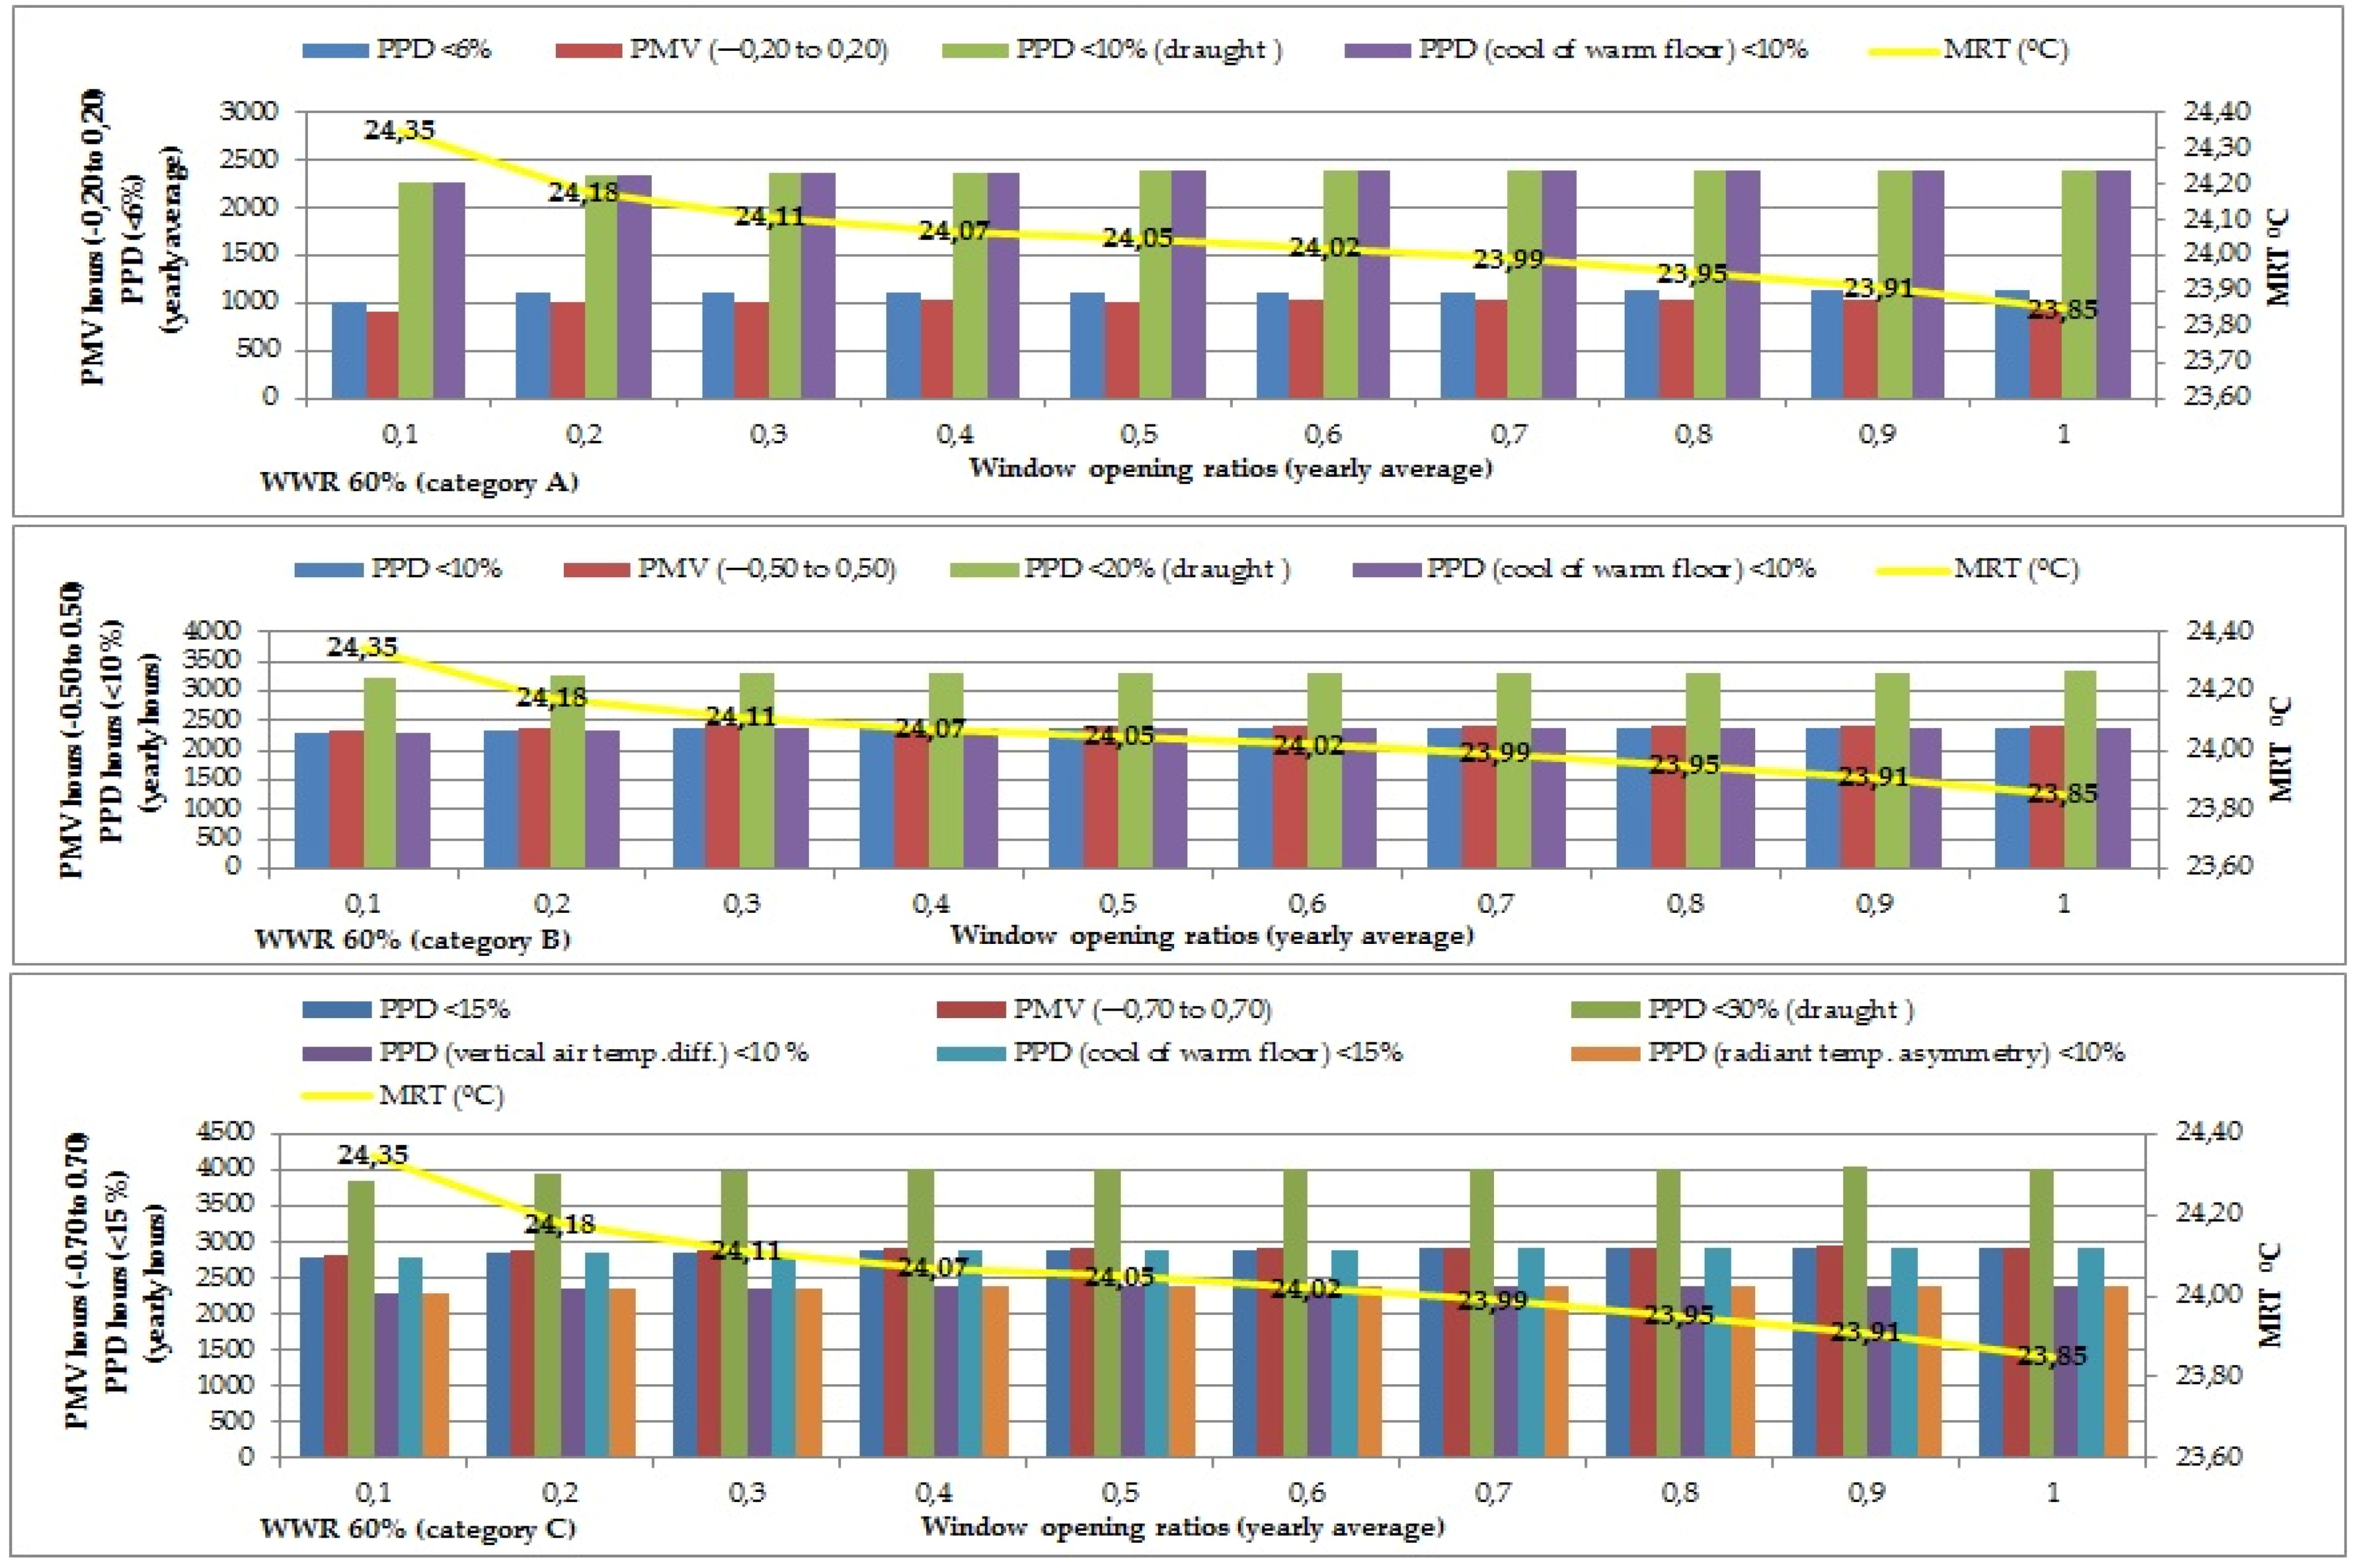
Figure 7.
Predicted Mean Vote (PMV) and Predicted Percentage of Dissatisfied People (PPD) for categories A,B, and C by means of hours (out of 8760 h in a whole year) for WWR 60% with all window opening ratios (from 0.1 to 1) with M: 1.2 met, air speed of 0.15–0.3 m/s, clothing value with 0.6–0.95 clo.
Figure 8.
Predicted Mean Vote (PMV) and Predicted Percentage of Dissatisfied People (PPD) for categories A,B, and C by means of hours (out of 8760 h in a whole year) for WWR 70% with all window opening ratios (from 0.1 to 1) with M: 1.2 met, air speed of 0.15–0.3 m/s, clothing value with 0.6–0.95 clo.
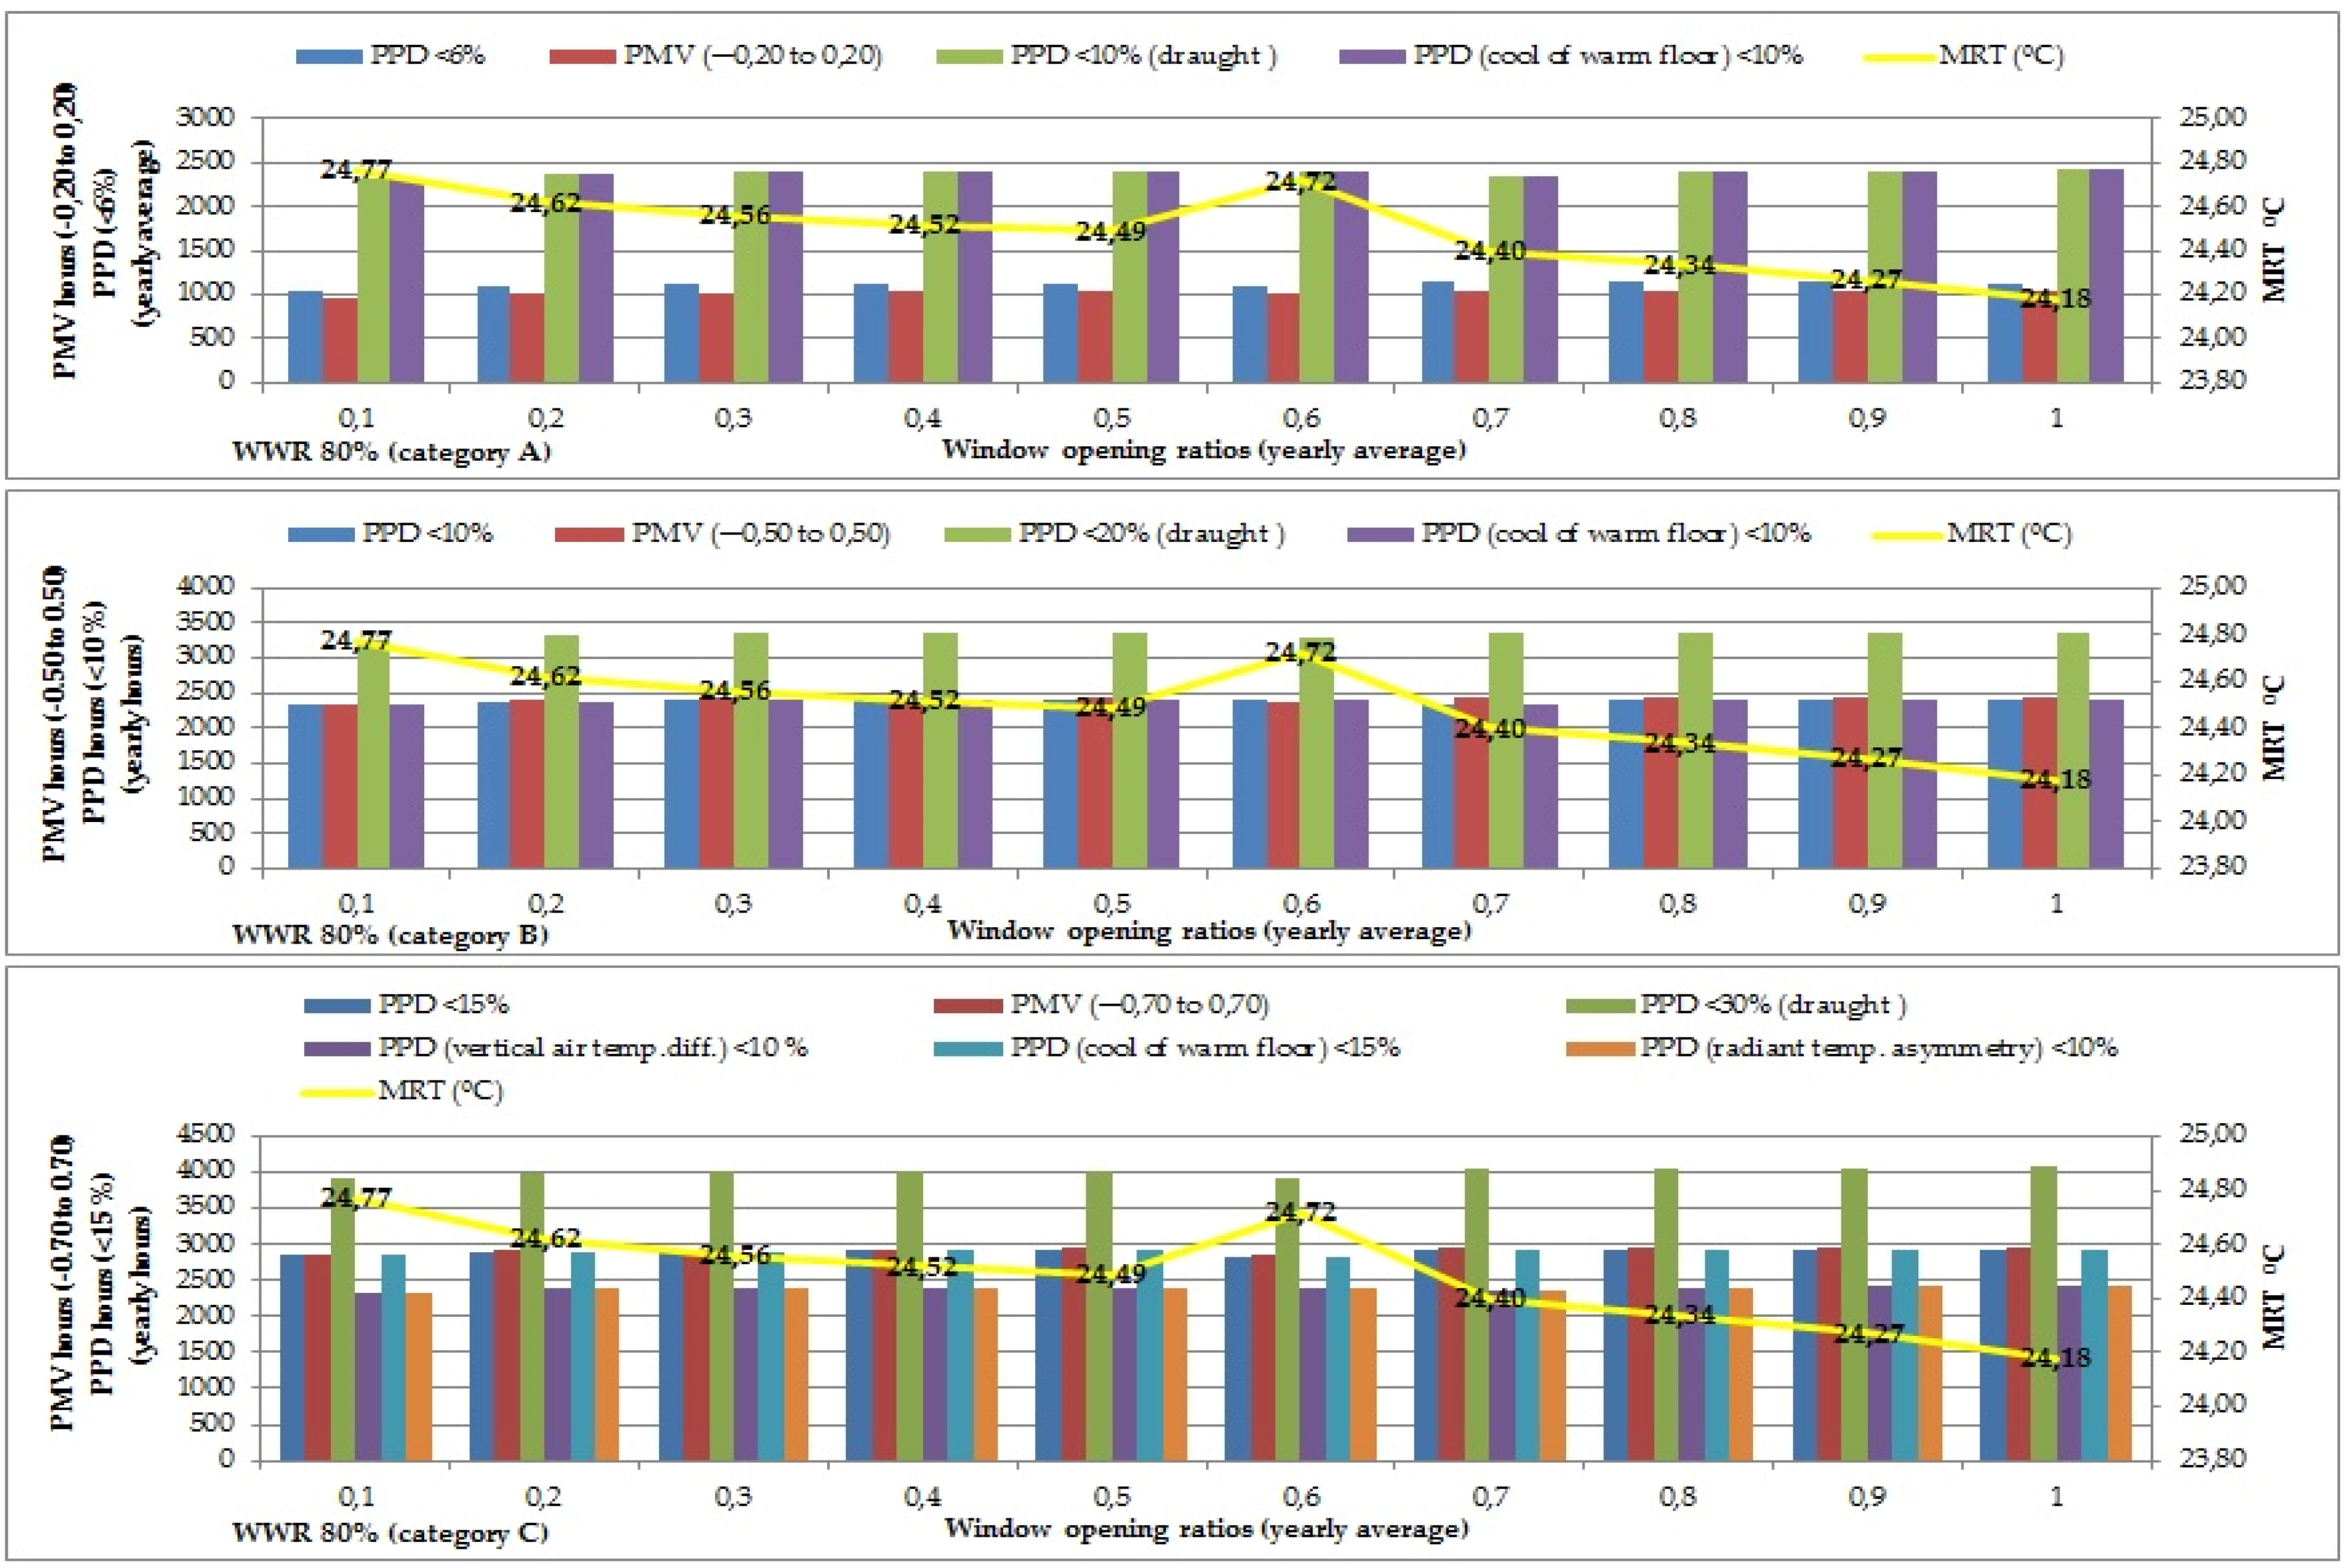
Figure 9.
Predicted Mean Vote (PMV) and Predicted Percentage of Dissatisfied People (PPD) for categories A,B, and C by means of hours (out of 8760 h in a whole year) for WWR 80% with all window opening ratios (from 0.1 to 1) with M: 1.2 met, air speed of 0.15–0.3 m/s, clothing value with 0.6–0.95 clo.
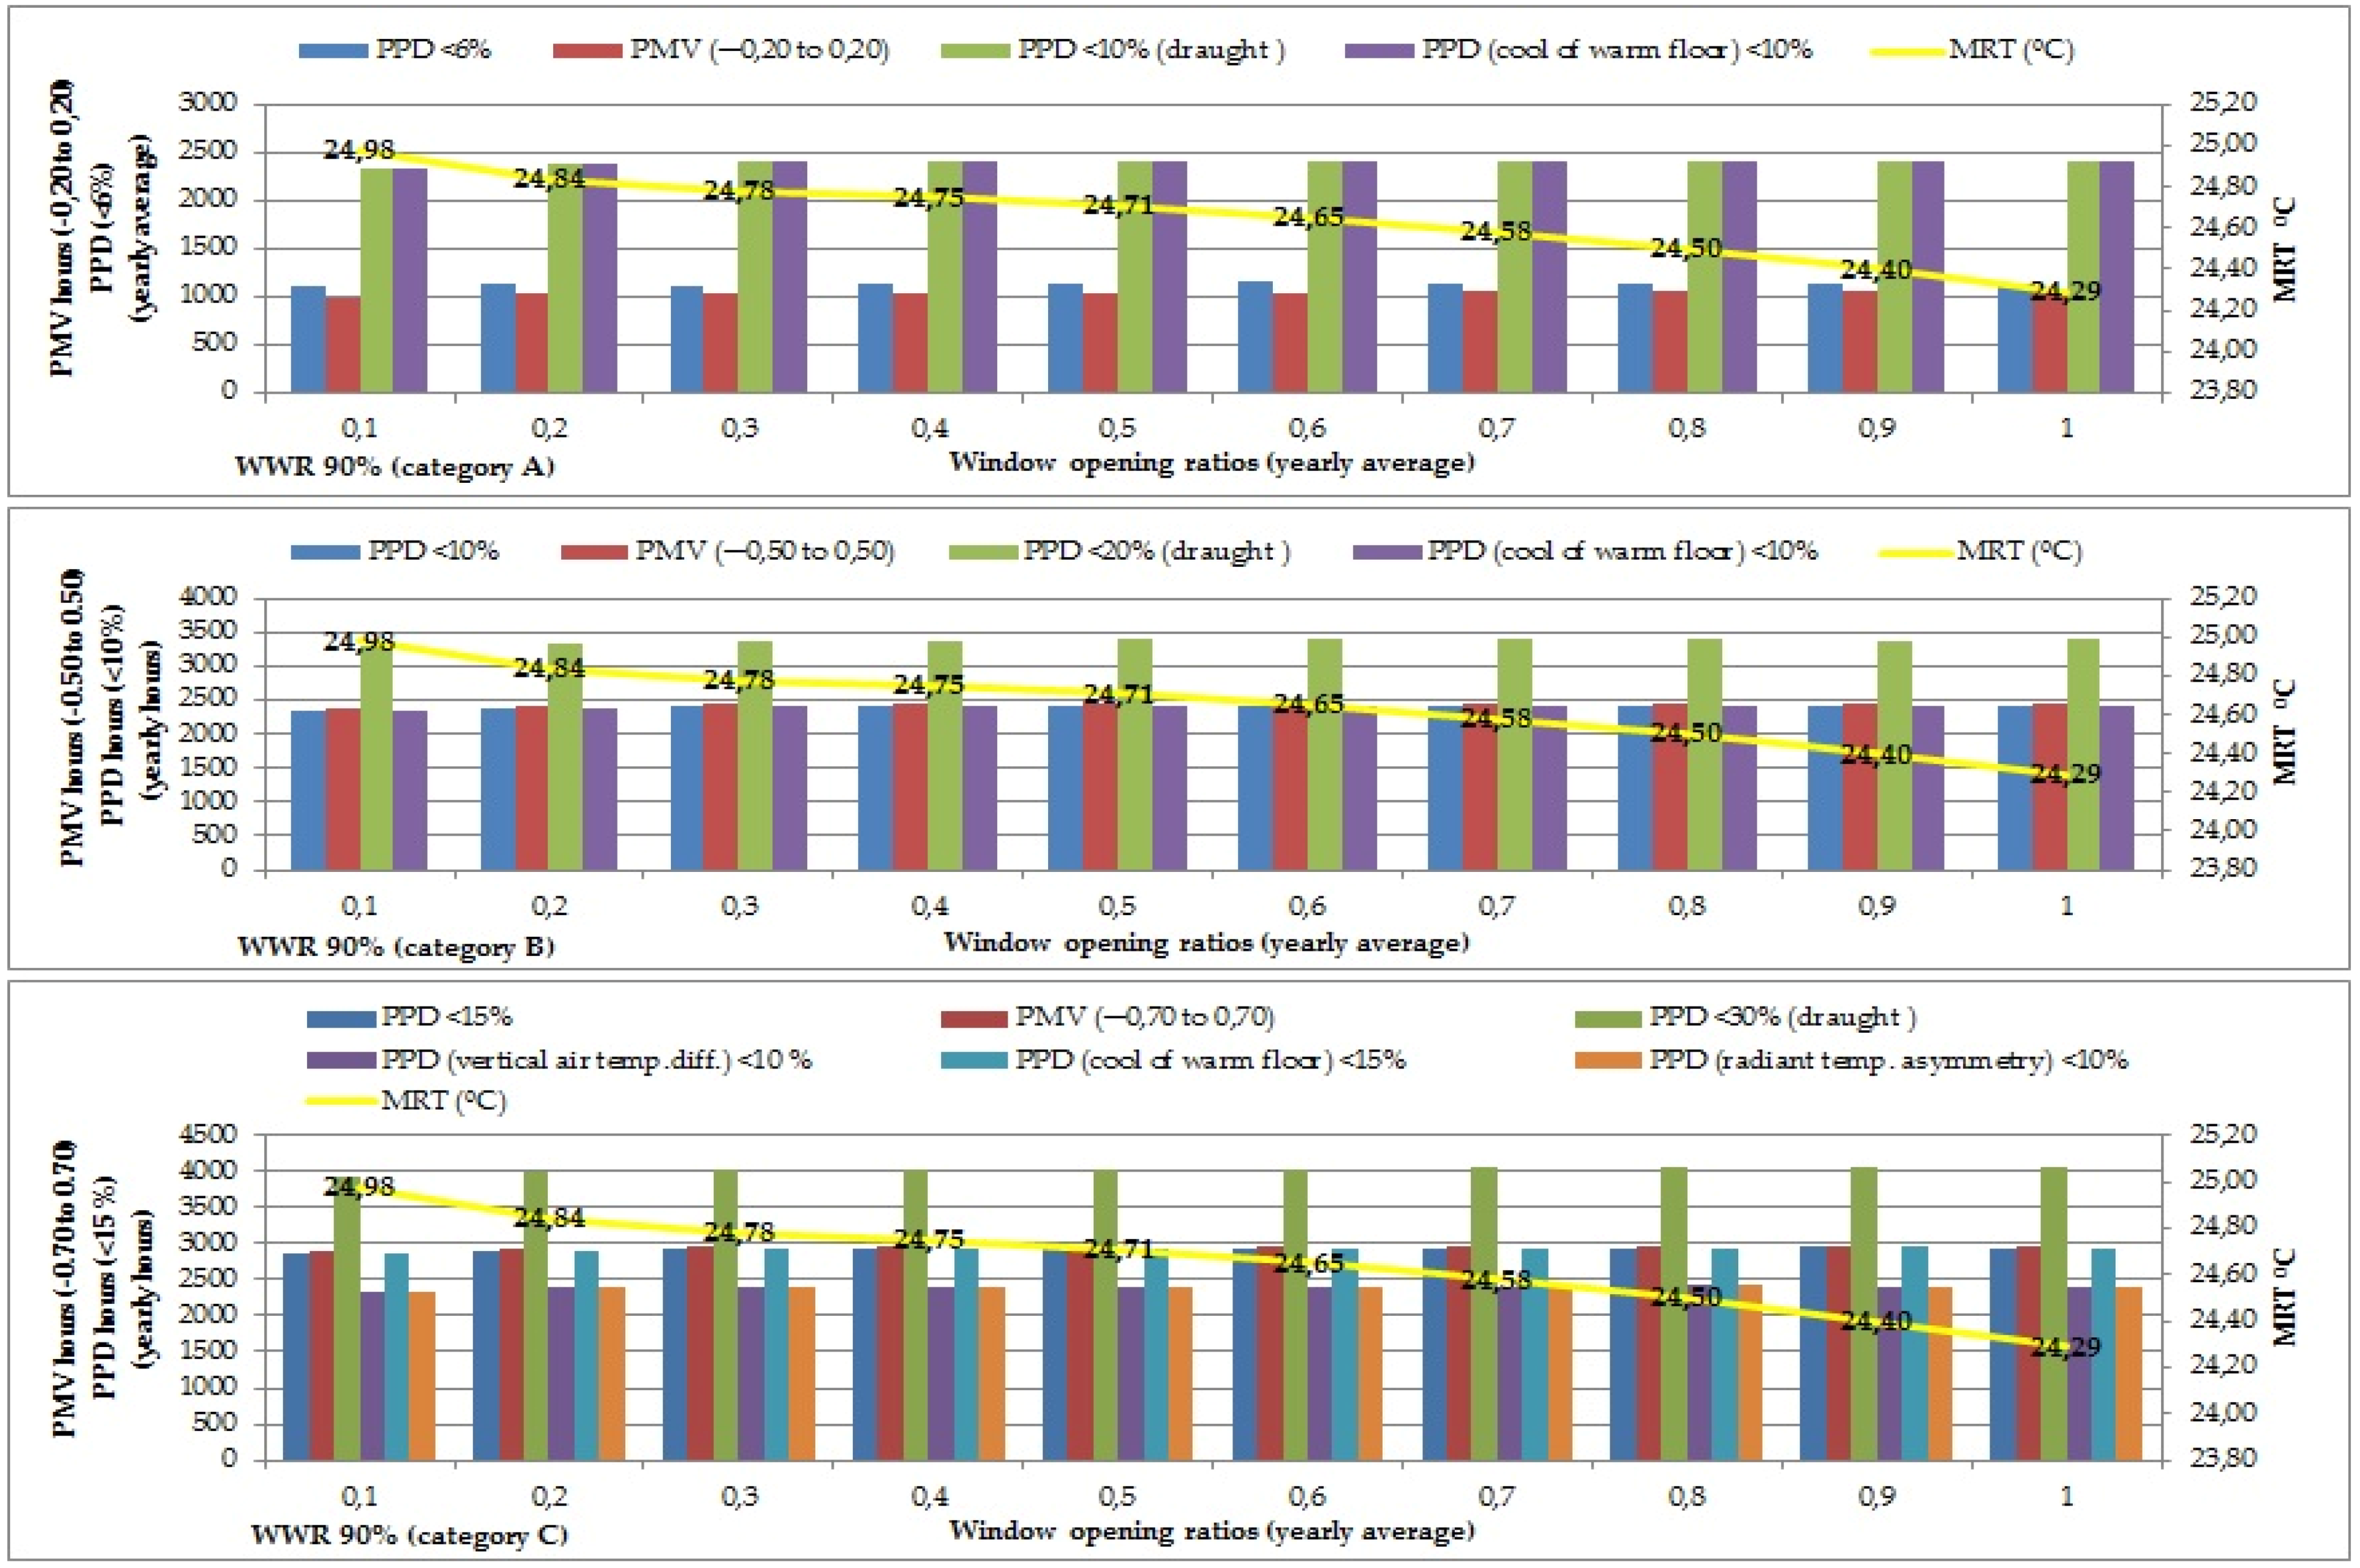
Figure 10.
Predicted Mean Vote (PMV) and Predicted Percentage of Dissatisfied People (PPD) for categories A,B, and C by means of hours (out of 8760 h in a whole year) for WWR 90% with all window opening ratios (from 0.1 to 1) with M: 1.2 met, air speed of 0.15–0.3 m/s, clothing value with 0.6–0.95 clo.
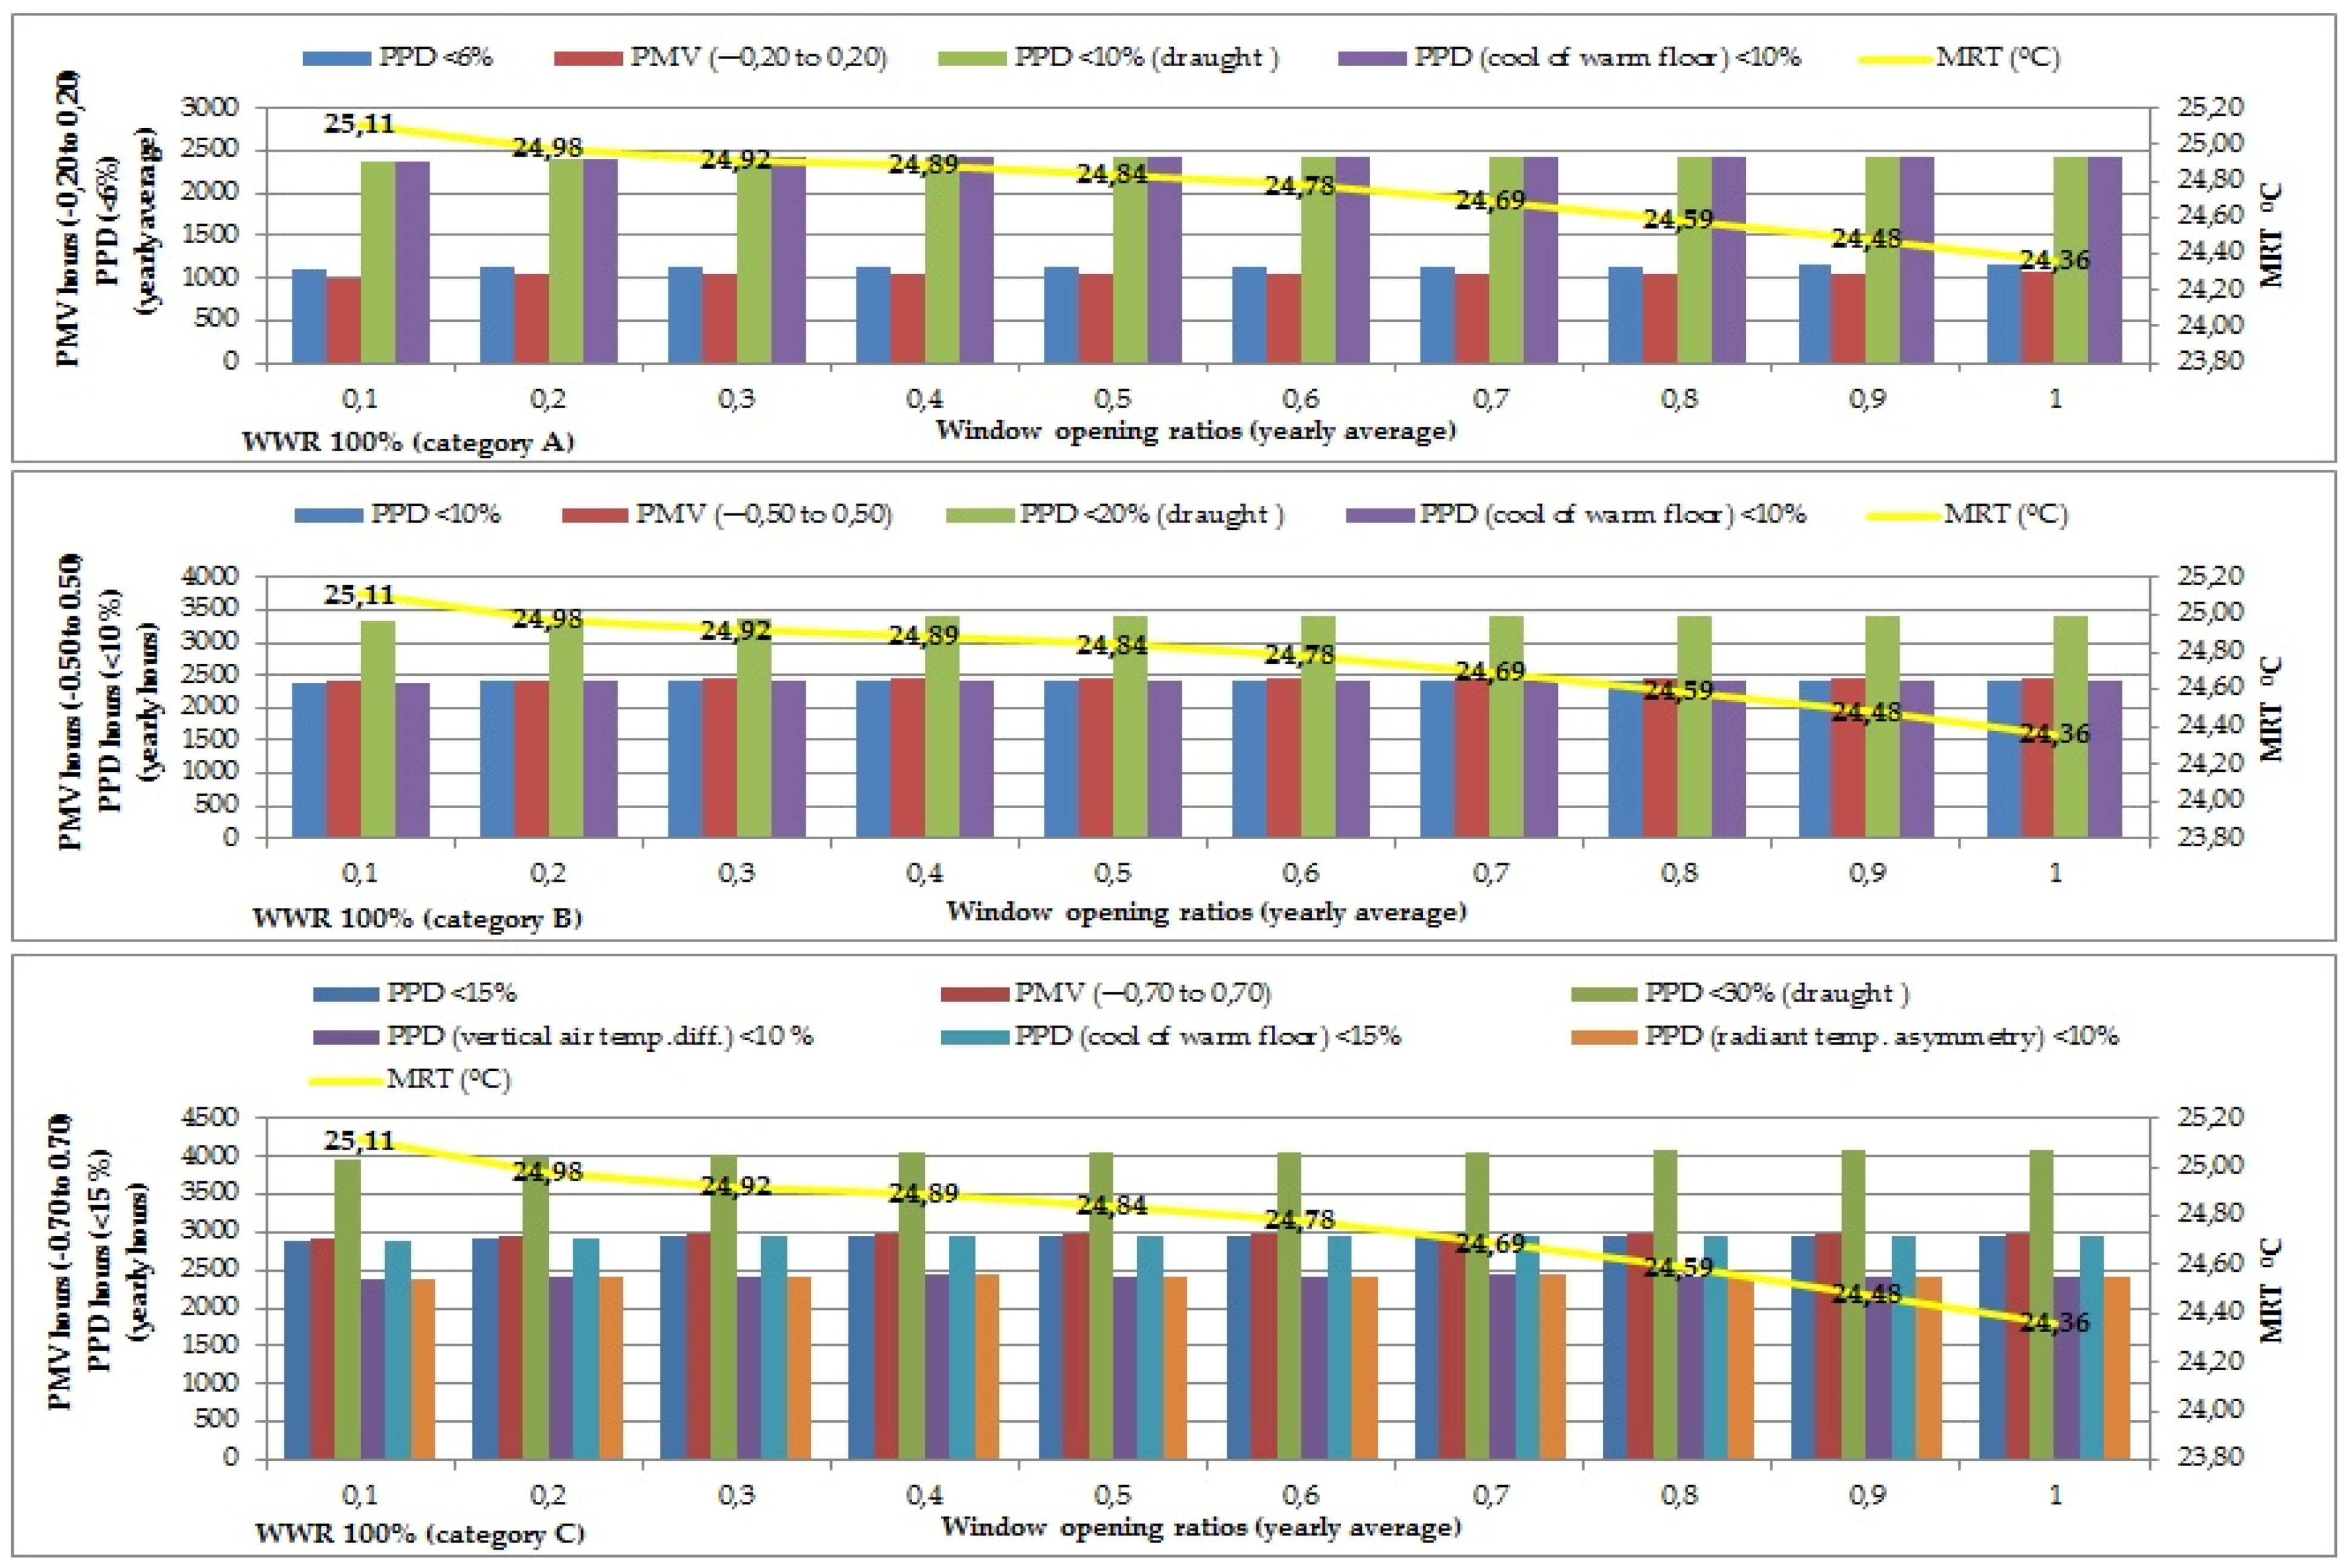
Figure 11.
Predicted Mean Vote (PMV) and Predicted Percentage of Dissatisfied People (PPD) for categories A,B, and C by means of hours (out of 8760 h in a whole year) for WWR 100% with all window opening ratios (from 0.1 to 1) with M: 1.2 met, air speed of 0.15–0.3 m/s, clothing value with 0.6–0.95 clo.
Table 1.
Classification of thermal environments proposed by ISO 7730 [
3] and EN 15251 [
4].
Table 1.
Classification of thermal environments proposed by ISO 7730 [3] and EN 15251 [4].
| Thermal State of The Body as a Whole | Local Discomfort |
|---|
| Category | Predicted Percentage of Dissatisfied (%) | Predicted Mean Vote Range | Percentage of Dissatisfied (PD) Due to Draught (%) | PD Due to Vertical Air Temperature Difference (%) | PD Due to Cool or Warm Floor (%) | PD Due to Radiant Temperature Asymmetry (%) |
|---|
| 1 (A) | <6 | −0.20 to 0.20 | <10 | <3 | <10 | <5 |
| 2 (B) | <10 | −0.50 to 0.50 | <20 | <5 | <10 | <5 |
| 3 (C) | <15 | −0.70 to 0.70 | <30 | <10 | <15 | <10 |
| 4 (D) (EN 15251) | >15 | <−0.70 or >0.70 | |
Table 2.
Shows used properties of opaque construction layers with U-values for the simulated office.
Table 2.
Shows used properties of opaque construction layers with U-values for the simulated office.
| Category | U-Value (W/m2K) | Solar Absorptance | Emissivity | Conductance (W/m2K) | Time Constant |
|---|
| Ext. Surface | Int. Surface | External | Internal |
|---|
| Ground floor | 0.283 | 0.760 | 0.500 | 0.910 | 0.900 | 0.297 | 127.999 |
| Walls | 1.135 | 0.400 | 0.400 | 0.900 | 0.900 | 1.407 | 4.920 |
| Ceiling | 1.01 | 0.700 | 0.500 | 0.900 | 0.900 | 1.251 | 13.749 |
Table 3.
Shows used properties of glass construction layers with U-values for the simulated office.
Table 3.
Shows used properties of glass construction layers with U-values for the simulated office.
| | U-Value (W/m²K) | Solar Transmittance | External Solar Absorptance | Internal Solar Absorptance | Light Transmittance | Time Constant |
|---|
| Ext. Surf. | Int. Surf. | Ext. Surf. | Int. Surf. |
|---|
| Windows (clear 6-12-6 double glazing low E) | 1.803 | 0.498 | 0.173 | 0.135 | 0.227 | 0.097 | 0.760 | 0 |
Table 4.
In category A, when WWR percentages are as follows, no thermal comfort is obtained.
Table 4.
In category A, when WWR percentages are as follows, no thermal comfort is obtained.
| Window Opening Ratio | January | February | March | July | August | December |
|---|
| 0.1 | 10% to 80% | 10% to 60% | 10% to 20% | 10% | 10% to 50% | 10% to 30% |
| 0.2 | 10% to 70% | - | 10% to 20% |
| 0.3 | - | 10% |
| 0.4 & 0.5 (half) | 10% to 90% | 10% to 80% | - | 10% to 20% |
| 0.6 | 10% to 70% | - | - |
| 0.7 | 10% to 80% | - | - |
| 0.8 | 10% to 100% | 10% to 90% | - | - |
| 0.9 & 1 (full) | 10% to 100% | 10% to 100% | - | - |
Table 5.
In category A, when WWR percentages are as follows, thermal comfort is obtained.
Table 5.
In category A, when WWR percentages are as follows, thermal comfort is obtained.
| Window Opening Ratio | January | February | March | April & May & June | July | August | September & October & November | December |
|---|
| 0.1 | 90% to 100% | 70% to 100% | 30% to 100% | 10% to 100% | 20% to 100% | 60% to 100% | 10% to 100% | 40% to 100% |
| 0.2 | 80% to 100% | 10% to 100% | 30% to 100% |
| 0.3 | 20% to 100% |
| 0.4 | 100% | 90% to 100% | 30% to 100% |
| 0.5 (half) |
| 0.6 | 80% to 100% | 10% to 100% |
| 0.7 | 90% to 100% |
| 0.8 & 0.9 & 1 (full) | - | 100% |
Table 6.
In category B, when WWR percentages are as follows, no thermal comfort is obtained.
Table 6.
In category B, when WWR percentages are as follows, no thermal comfort is obtained.
| Window Opening Ratio | January | February | March | August | December |
|---|
| 0.1 | 10% to 50% | 10% to 30% | 10% | 10% to 20% | 10% |
| 0.2 | 10% to 40% | 10% |
| 0.3 to 0.5 (half) | |
Table 7.
In category B, when WWR percentages are as follows, thermal comfort is obtained.
Table 7.
In category B, when WWR percentages are as follows, thermal comfort is obtained.
| Window Opening Ratio | January | February | March | April & May & June & July | August | September & October & November | December |
|---|
| 0.1 | 60% to 100% | 40% to 100% | 30% to 100% | 10% to 100% | 30% to 100% | 10% to 100% | 20% to 100% |
| 0.2 | 50% to 100% | 20% to 100% | 20% to 100% |
| 0.3 to 0.7 | 10% to 100% |
| 0.8 to 1 (full) | 70% to 100% |
Table 8.
In category C, when WWR percentages are as follows, no thermal comfort is obtained. (It should be noted that the following values show minimum non-thermal comfort ranges for the fourth category of EN 15251 [
4]).
Table 8.
In category C, when WWR percentages are as follows, no thermal comfort is obtained. (It should be noted that the following values show minimum non-thermal comfort ranges for the fourth category of EN 15251 [4]).
| Window Opening Ratio | January | February | December |
|---|
| 0.1 | 10% to 40% | 10% to 20% | 10% |
| 0.2 to 1 (full) | - |
Table 9.
In category C, when WWR percentages are as follows, thermal comfort is obtained. (It should be noted that the following values show minimum thermal comfort ranges for the fourth category of EN 15251 [
4]).
Table 9.
In category C, when WWR percentages are as follows, thermal comfort is obtained. (It should be noted that the following values show minimum thermal comfort ranges for the fourth category of EN 15251 [4]).
| Window Opening Ratio | January | February | March to November | December |
|---|
| 0.1 | 50% to 100% | 30% to 100% | 10% to 100% | 20% to 100% |
| 0.2 to 1 (full) | 10% to 100% |


