2.1. Construction Waste Management Performance Indicators
C & D waste is defined as the waste that arises from construction, renovation, and demolition activities [
27]. It may also include surplus and damaged products and materials arising in the course of construction work or used temporarily during the process of on-site activities [
28]. Sometimes, it is called construction waste, representing inclusively the surplus materials generated by site clearance, excavation, construction, refurbishment, renovation, demolition, and road works [
10].
There is another stream of research viewing that C & D waste should include non-value-adding works in construction [
29] such as over engineering, excessively thick floors, or wasteful activities [
30] such as unreasonable construction process, or unnecessary idling time. This view can be traced back to Ohno who defined waste as “any human activity which absorbs resources but creates no value” [
31], and it was also supported by the studies [
29,
32,
33] and many lean construction advocators [
34]. This view enables researchers to consider both material losses and non-value-adding works but, in this paper, construction waste refers to solid and tangible waste. In some economies such as the United Kingdom and Hong Kong, C & D waste is further classified into inert and non-inert parts. Inert waste is defined as refuse, reject, or residue material that does not undergo biological, chemical, physical, or radiological transformation such as concrete waste while non-inert waste defines waste which decomposes or rots when deposited in landfills (including most household wastes) [
35]. Non-inert waste is thus also called organic waste while the inert part is called inorganic waste.
In comparison with other pollutants such as dust and noise, C & D waste is easy to see, as well as relatively easy to measure [
33]. The cliché “you cannot improve what you cannot measure” offers a rationale for the research effort to identify proper CWM performance indicators. It is vital that CWM is closely monitored, and its performance is presented unambiguously for developing good CWM practices. To this end, a universal indicator that would facilitate benchmarking CWM performance across different economies is desired.
Waste generation rate (WGR) is one of the indicators that can serve the above purpose. The WGR can be calculated by dividing the waste in volume (m
3) or quantity (tons) by either the amount of virgin materials purchased, or the amount required by the design, or per m
2 of gross floor area (GFA) [
33]. A WGR can: (a) provide quantitative information for benchmarking different CWM practices at a project level; (b) help raise people’s awareness of waste management in the construction industry, e.g., by timing the WGR with GFA, it is possible to calculate total quantity of C & D waste and thus inform people of the negative impacts that construction activities have on the environment; and (c) assist contractors with developing effective CWM strategies by benchmarking it across different projects [
10]. Indeed, there were studies investigating WGRs in different economies and comparing them with those in others, with a view to identifying the consequence of using different construction techniques, work procedures, and common practices [
5,
8,
10,
33,
36,
37]. However, the problem is that most of the empirical studies on WGR have a relatively small sample [
10] or sampled relatively small sites due to the difficulties involved in conducting a survey on large-scale projects [
38]. Results of such studies thus cannot justifiably be generalized to calculate the waste generation on other projects or at a macro level,
i.e., herein to treat the construction industry in an economy as a whole.
The volume of C & D waste logged in various statistical resources is considered an ideal indicator for measuring and comparing CWM across different economies. Prolific studies have reported the amount of C & D waste generated in different economies. For example, in addition to the aforementioned reports on C & D waste generation in the EU-27 member countries, United States, the United Kingdom, Hong Kong, and China, Tam [
9] reported that C & D waste forms 19% and 14% of the waste disposed of at landfills in Germany and Finland. These C & D waste volumes, either in absolute terms or as a ratio of overall MSW, reflect the overall C & D waste across different economies. However, the studies cannot reflect the efficiency of CWM practices. Moreover, the amount or ratio of C & D waste is influenced by not only CWM practices but also a country’s profile such as economy scale, population, territory, and waste management behaviors [
10]; these practices should be considered in a cross-jurisdictional comparison.
It is thus proposed that ratio indicators such as C & D waste per GDP should be added. Together with the C & D waste volume indicators introduced above, they can help draw a big picture of CWM as well as reflect the efficiency of CWM practices in an economy. In summary, the performance indicators of CWM at a macro level can be listed as follows:
I1: Total C & D waste volume (million tons)
I2: Total inert C & D waste volume (million tons)
I3: Total non-inert C & D waste volume (million tons)
I4: Total volumes of C & D waste reduced, reused, and recycled (million tons)
I5: Total volume of C & D waste landfilled (million tons)
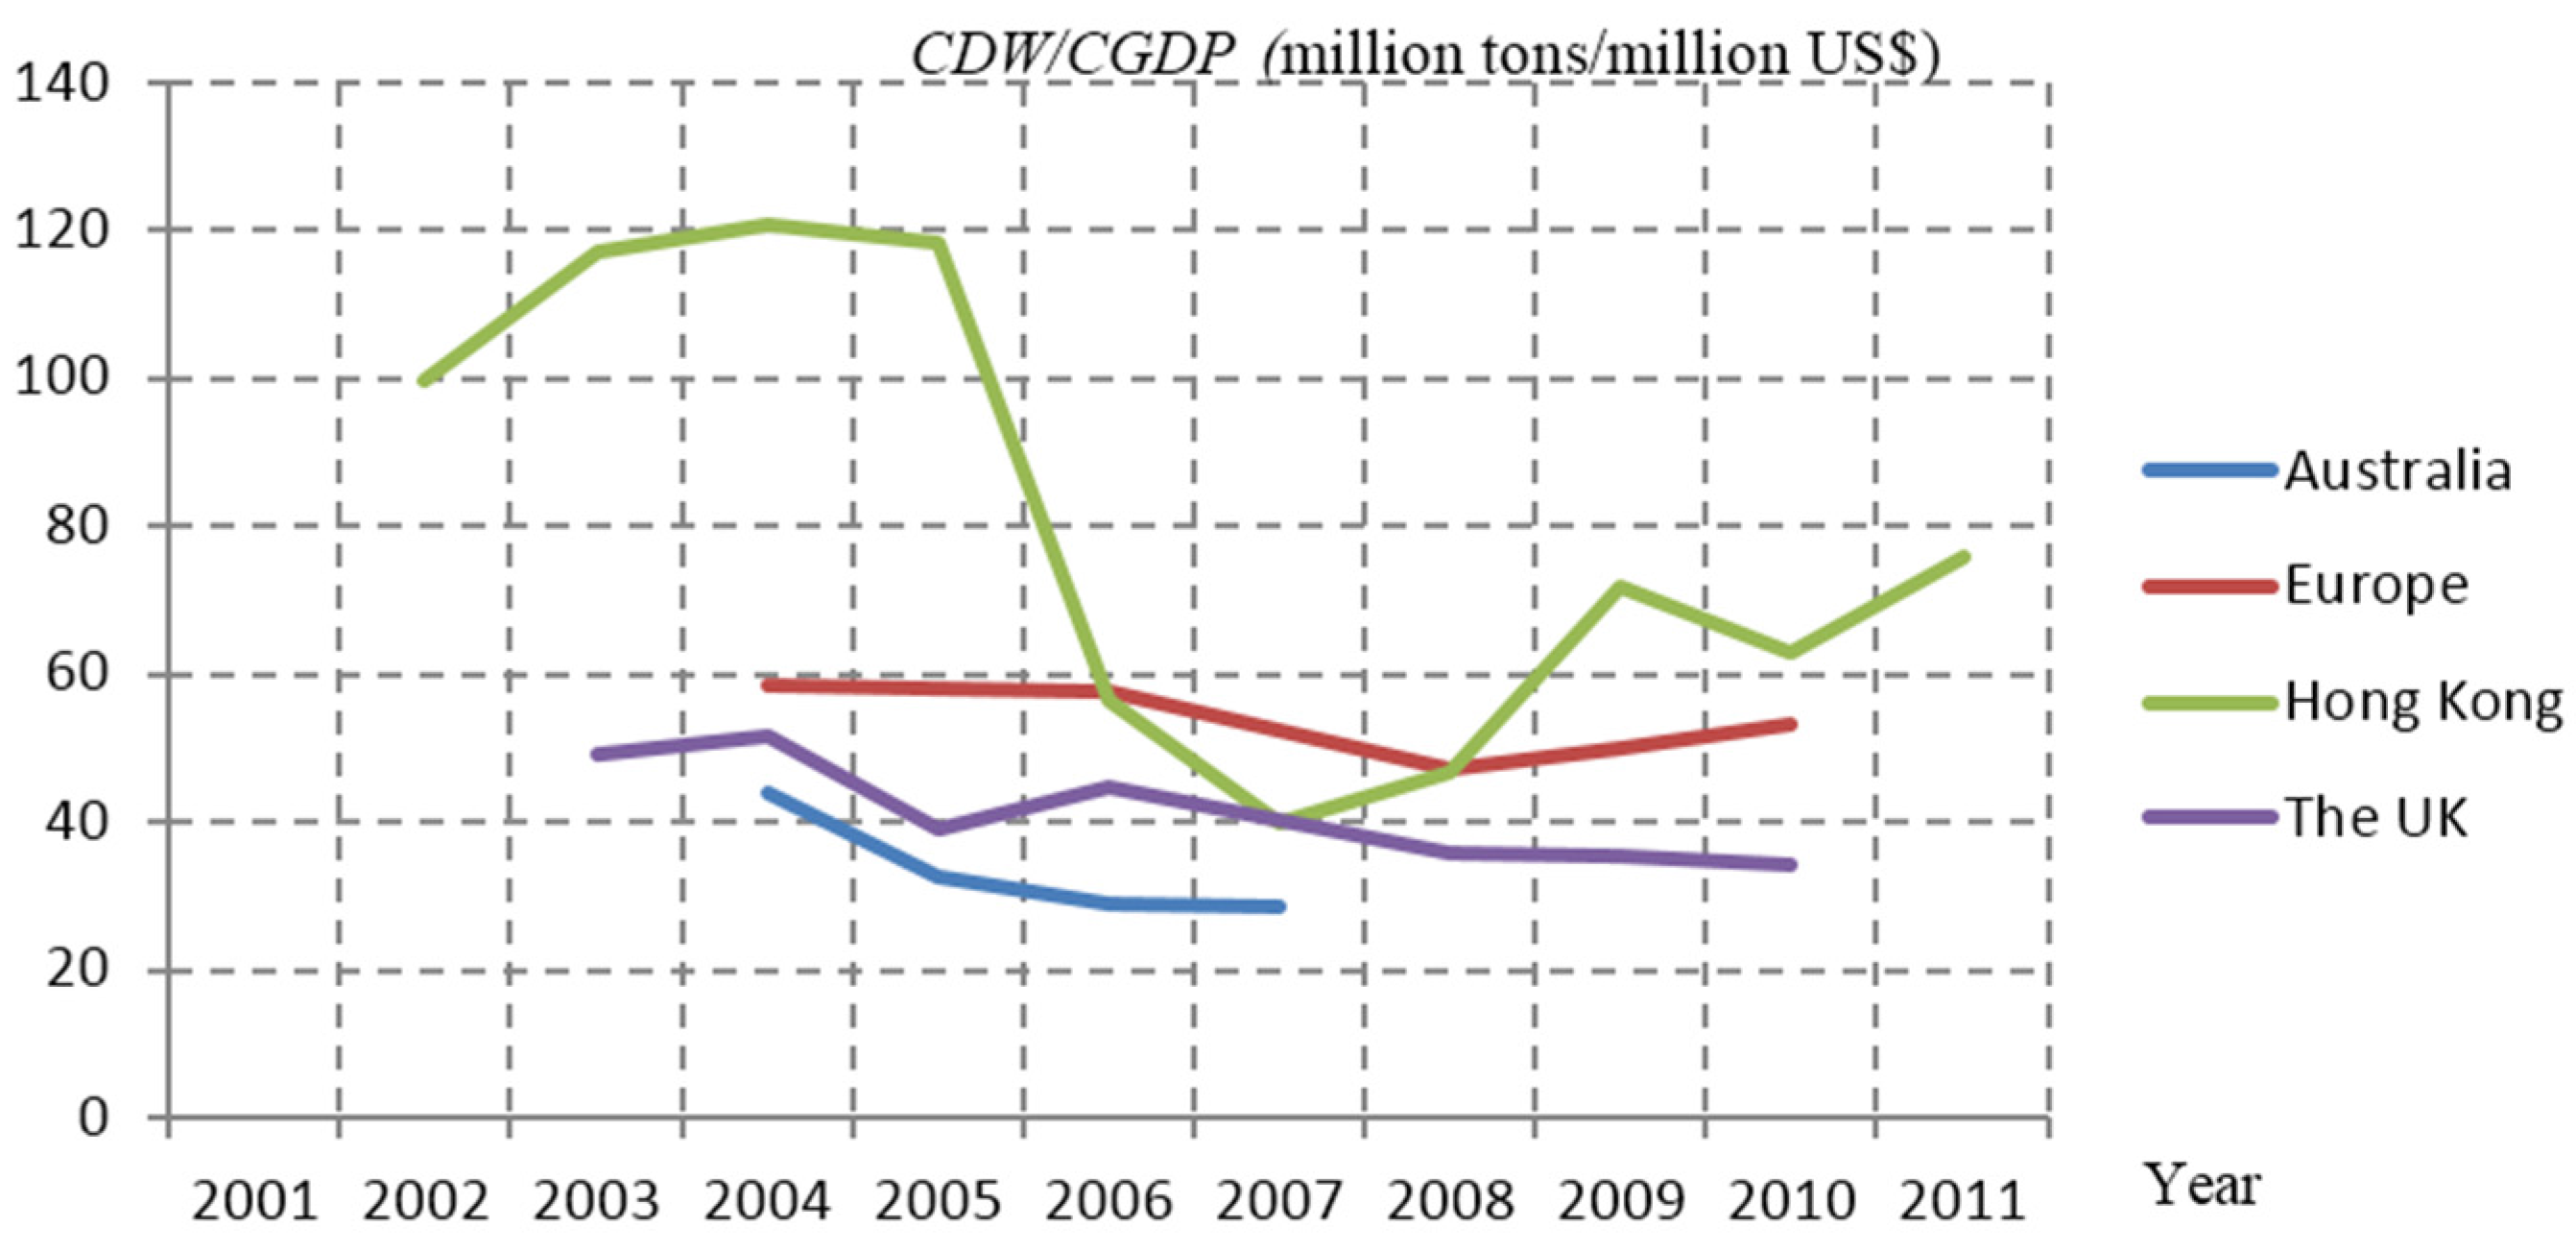
I6: C & D waste generation per construction GDP (CDW/CGDP) (million tons/million US$)
Particularly, the ratio I6: C & D waste generation per construction GDP (CDW/CGDP) (million tons/million US$) is introduced as an indicator that can be used to compare CWM practices across different jurisdictions. Here, CGDP is the gross domestic product contributed by a nation’s construction sector measured in million US$. It is a monetary measure of the value/worth of construction works. In producing every unit (e.g., million US$) of construction worth, construction unavoidably will generate a certain amount of waste. Hence, the indicator can be used to gauge which nation’s construction sector is less or more wasteful in terms of C & D waste generation. Actually, other ratio indicators such as C & D waste reduced/reused/recycles per construction GDP (I4/CGDP) or C & D waste landfilled per construction GDP (I5/CGDP) can be used for probing into CWM performance in different countries. However, the selection of these performance indicators is largely dependent on data availability. As can be seen later, not all countries’ data is readily available for calculating the ratio indicators.
2.2. Prevailing C & D Waste Management Practices
There are two generic practices for dealing with C & D waste. From a technical point of view, environmental engineers investigate how “hard” technologies can help manage C & D waste,
i.e., through introduction of prefabrication, using metal formwork, and using recycled aggregate for different concrete applications. By appreciating that C & D waste is also a social issue, “soft” economical or managerial measures have gained momentum [
39]. For example, based on the “polluter pays principle (PPP)”, some governments have implemented a waste charging scheme as a major economic policy to impose a levy to the direct polluters who should be responsible for C & D waste disposal. Similarly, there is an “extended producer responsibility (EPR)” suggesting that material vendors should be responsible for the waste generated from their supplies. In this paper, CWM practices refer to any technologies (e.g., cast in-situ, prefabrication, and recycling technologies), work procedures (e.g., on-site waste sorting), and other economical or managerial approaches (e.g., designing out waste, and waste disposal charging) that are relevant to CWM. It is assumed that different CWM practices would explain the variations of CWM performance amongst different economies.
CWM practices can also be categorized by the “3Rs” principle, which is known as the hierarchy of CWM. The principle refers to the 3Rs of reduce, reuse, and recycle, which classify waste management strategies according to their desirability [
40]. The 3R principle is meant to be a hierarchy, arranged in ascending order of their adverse impacts to the environment from low to high. Reduction is considered as the most effective and efficient method for managing C & D waste. It cannot only minimize the generation of C & D waste, but also reduce the cost for waste transporting, disposal, and recycling [
41,
42]. Researchers have proposed various solutions for waste reduction, which can be generally summarized into five categories [
43,
44], encompassing: (1) reducing waste through government legislation; (2) reducing waste by design; (3) developing an effective waste management system; (4) use of low waste technologies; and (5) improving practitioners’ attitude toward waste reduction. Reuse means using the same material in construction more than once, including using the material again for the same function (e.g., formwork in construction) [
45] and new-life reuse for a new function (e.g., using the cut-corner steel bar for shelves; using the stony fraction for road base material) [
46]. It is the most desirable option after reduction because a minimum processing and energy use is achieved [
40]. When reduction and reuse become too costly, recycling is desired. Tam [
9] summarized that recycling can offer three benefits: (a) reducing the demand for new resources; (b) cutting down transport and production energy cost; and (c) utilizing waste which would otherwise be lost to landfill sites. The 3Rs could take place in a specific stage (e.g., inception, design, construction, maintenance, and demolition) or throughout the whole life-cycle of a construction project.
Notably, there are some major green evaluation systems such as the Building Research Establishment Environmental Assessment Method [
47], Green Globes System [
48], the Hong Kong Building Environmental Assessment Method [
49], the Leadership in Energy and Environmental Design [
50], the Green Star Environmental Rating System [
51], the Green Mark Assessment [
52], and the GB Tool [
53]. Striving for earning the “green points” in these systems will directly encourage avoidance, reduction, reuse, or recycling of C & D waste. These green evaluation systems thus have impacts on CWM. To this end, this study considers the adoption of various green evaluation systems as an emerging CWM practice, but examines it as an overarching practice that could take place in any of the following four types:
P1: Avoid (e.g., waste minimization design, renovation instead of demolition)
P2: Reduce (e.g., using low waste construction technologies, deconstruction)
P3: Reuse (e.g., on-site sorting and reuse, cutting formwork for other uses)
P4: Recycle (e.g., setting up waste sorting plants, processing waste as aggregates)
2.3. Economic Profiles in Relation to C & D Waste Management
The CWM practices would not explain all variations in CWM performance across different economies. The causal relationship between the CWM practices and their performance is also influenced by the economic background, in particular its construction profile. For example, the main C & D waste in Hong Kong is concrete and wasted timber formwork while this may not be the same in the United Kingdom or the United States where cast
in situ is not commonly adopted. Similarly, different development stages of an economy will have different implications to C & D waste generation. For example, Bergsdal, Bohne [
54] reported that in Norway demolition was the smallest C & D activities, contributing only 8% in 1998 while construction and renovation contributed 52% and 40% respectively to waste generation. In China, owing to the urbanization, demolition is the major culprit for waste generation [
17,
55], while in Hong Kong relative balanced activities between demolition and new construction can be seen owing to the renewal of the decayed urban areas. Therefore, the economic and construction profiles will be identified as the control variables for this cross-jurisdictional analysis.
Intuitively, the bigger GDP of an economy, the more construction is needed to provide the infrastructure demanded by the economic activities. It is also comprehensible that the more construction projects, the more C & D waste may be generated in general. As shown below, five major control variables that might be in relation to C & D waste management are identified. Particularly, the ratio variables (
C2 and
C4) are introduced to eliminate the effects of population and construction workers on the variations of CWM performance:
C1: Total GDP (billion US$)
C2: GDP per capita (US$)
C3: Total construction output (million US$)
C4: Construction productivity (million US$)
C5: Construction of new buildings (numbers)
C6: Development stages of an economy (0 = Underdeveloped, 1 = developing, and 2 = developed)
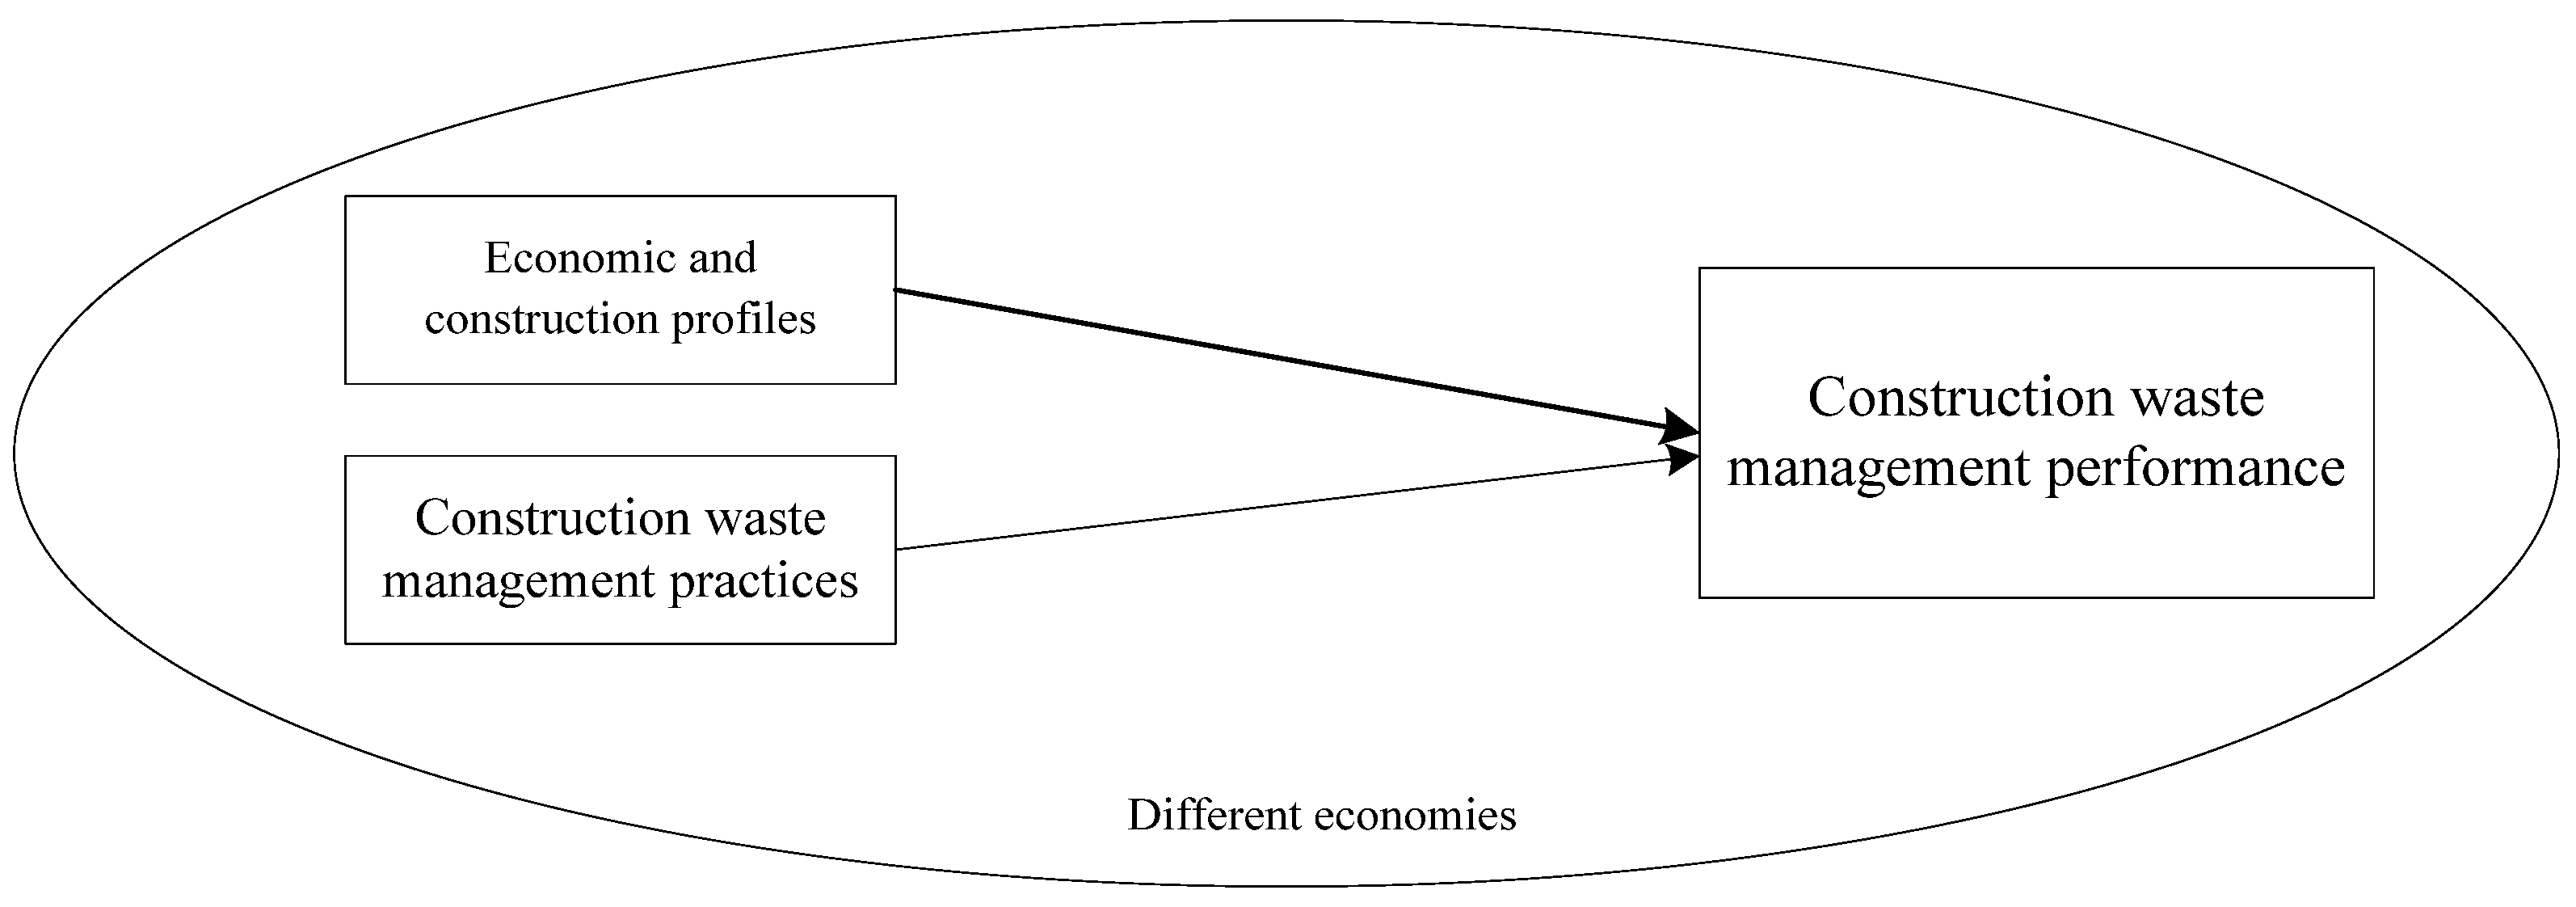
Based on the above analyses, an analytic framework for this cross-jurisdictional study is developed and illustrated in
Figure 1. It assumes that different CWM practices have an effect on CWM performance. Meanwhile, economic and construction profiles should also be at play, though more in the backdrop, to impact CWM performance. By following this analytic framework, indicators for the profiles, practices, and performance can be identified and measured and their relationships can be statistically analyzed. It is iterated at this juncture that the aim of this research is to find the links between CWM performance indicators and CWM practices by putting them in different economic profiles with a view to deriving the best CWM practices that can be shared by international waste management community.


