1. Introduction
Phragmites is an invasive species of particular concern in the wetlands of the North American Great Lakes [
1,
2]. It is a cosmopolitan species of wetland grass native to every continent except Antarctica [
3]. The Great Lakes region has a long history of biological invasions with over 40% of established exotic species being wetland plants, although it is not known exactly when the initial invasion started [
4]. At least 10% of invasive species in this region have caused well-documented environmental problems and substantial economic losses [
4]. One such problematic invasive species is Phragmites, an aggressive non-native genotype [
2] that has expanded throughout the Great Lakes [
5] and other regions. This rapid expansion of a monotypic plant community has resulted in adverse ecological, economic, and social impacts on the natural resources and people of the Great Lakes. In the context of the Phragmites invasion, scientists and land managers need efficient methods to detect and appraise the severity and progression of the infestation [
6]. Few studies have documented the presence of Phragmites or tracked the invasion process from early stages to the subsequent large-scale changes in the plant community [
5,
7].
Vegetation classification for wetland with Landsat images is still a challenge [
8,
9]. Over the land covers with different vegetation compositions, the same plant type may exhibit different spectral features while different vegetation types may show similar spectra, which makes it difficult to extract vegetation information from remote sensing images with an acceptable accuracy. Therefore, one of the most critical problems concerning the classification of images is how to obtain training samples with high quantity and quality [
10,
11].
Current efforts of Phragmites invasion research from sustainable development viewpoints include: (i) the development of remote sensing techniques to evaluate the extent, structure, and composition of wetlands species [
12], in places such as the Detroit River; (ii) the mapping of land cover and habitats for the conservation and management of biodiversity [
13,
14]; (iii) the assessment of the ecological influence of Phragmites and its patterns of distribution [
15]; and (iv) the analysis of the spatiotemporal variations of the invasive species [
16,
17].
Combined with Landsat TM images, DOQQ (Digital Orthophoto Quarter Quads), images of the USGS (United States Geological Survey), and NAIP (National Agriculture Imagery Program) images of the USDA (United States Department of Agriculture), this paper presents an automatic sample recognition algorithm (iterative intersection analysis algorithm; IIAA), to study the invasion and changing dynamics of Phragmites in the Detroit River International Wildlife Refuge (DRIWR).
2. Study Area and Data Sources
2.1. Study Area
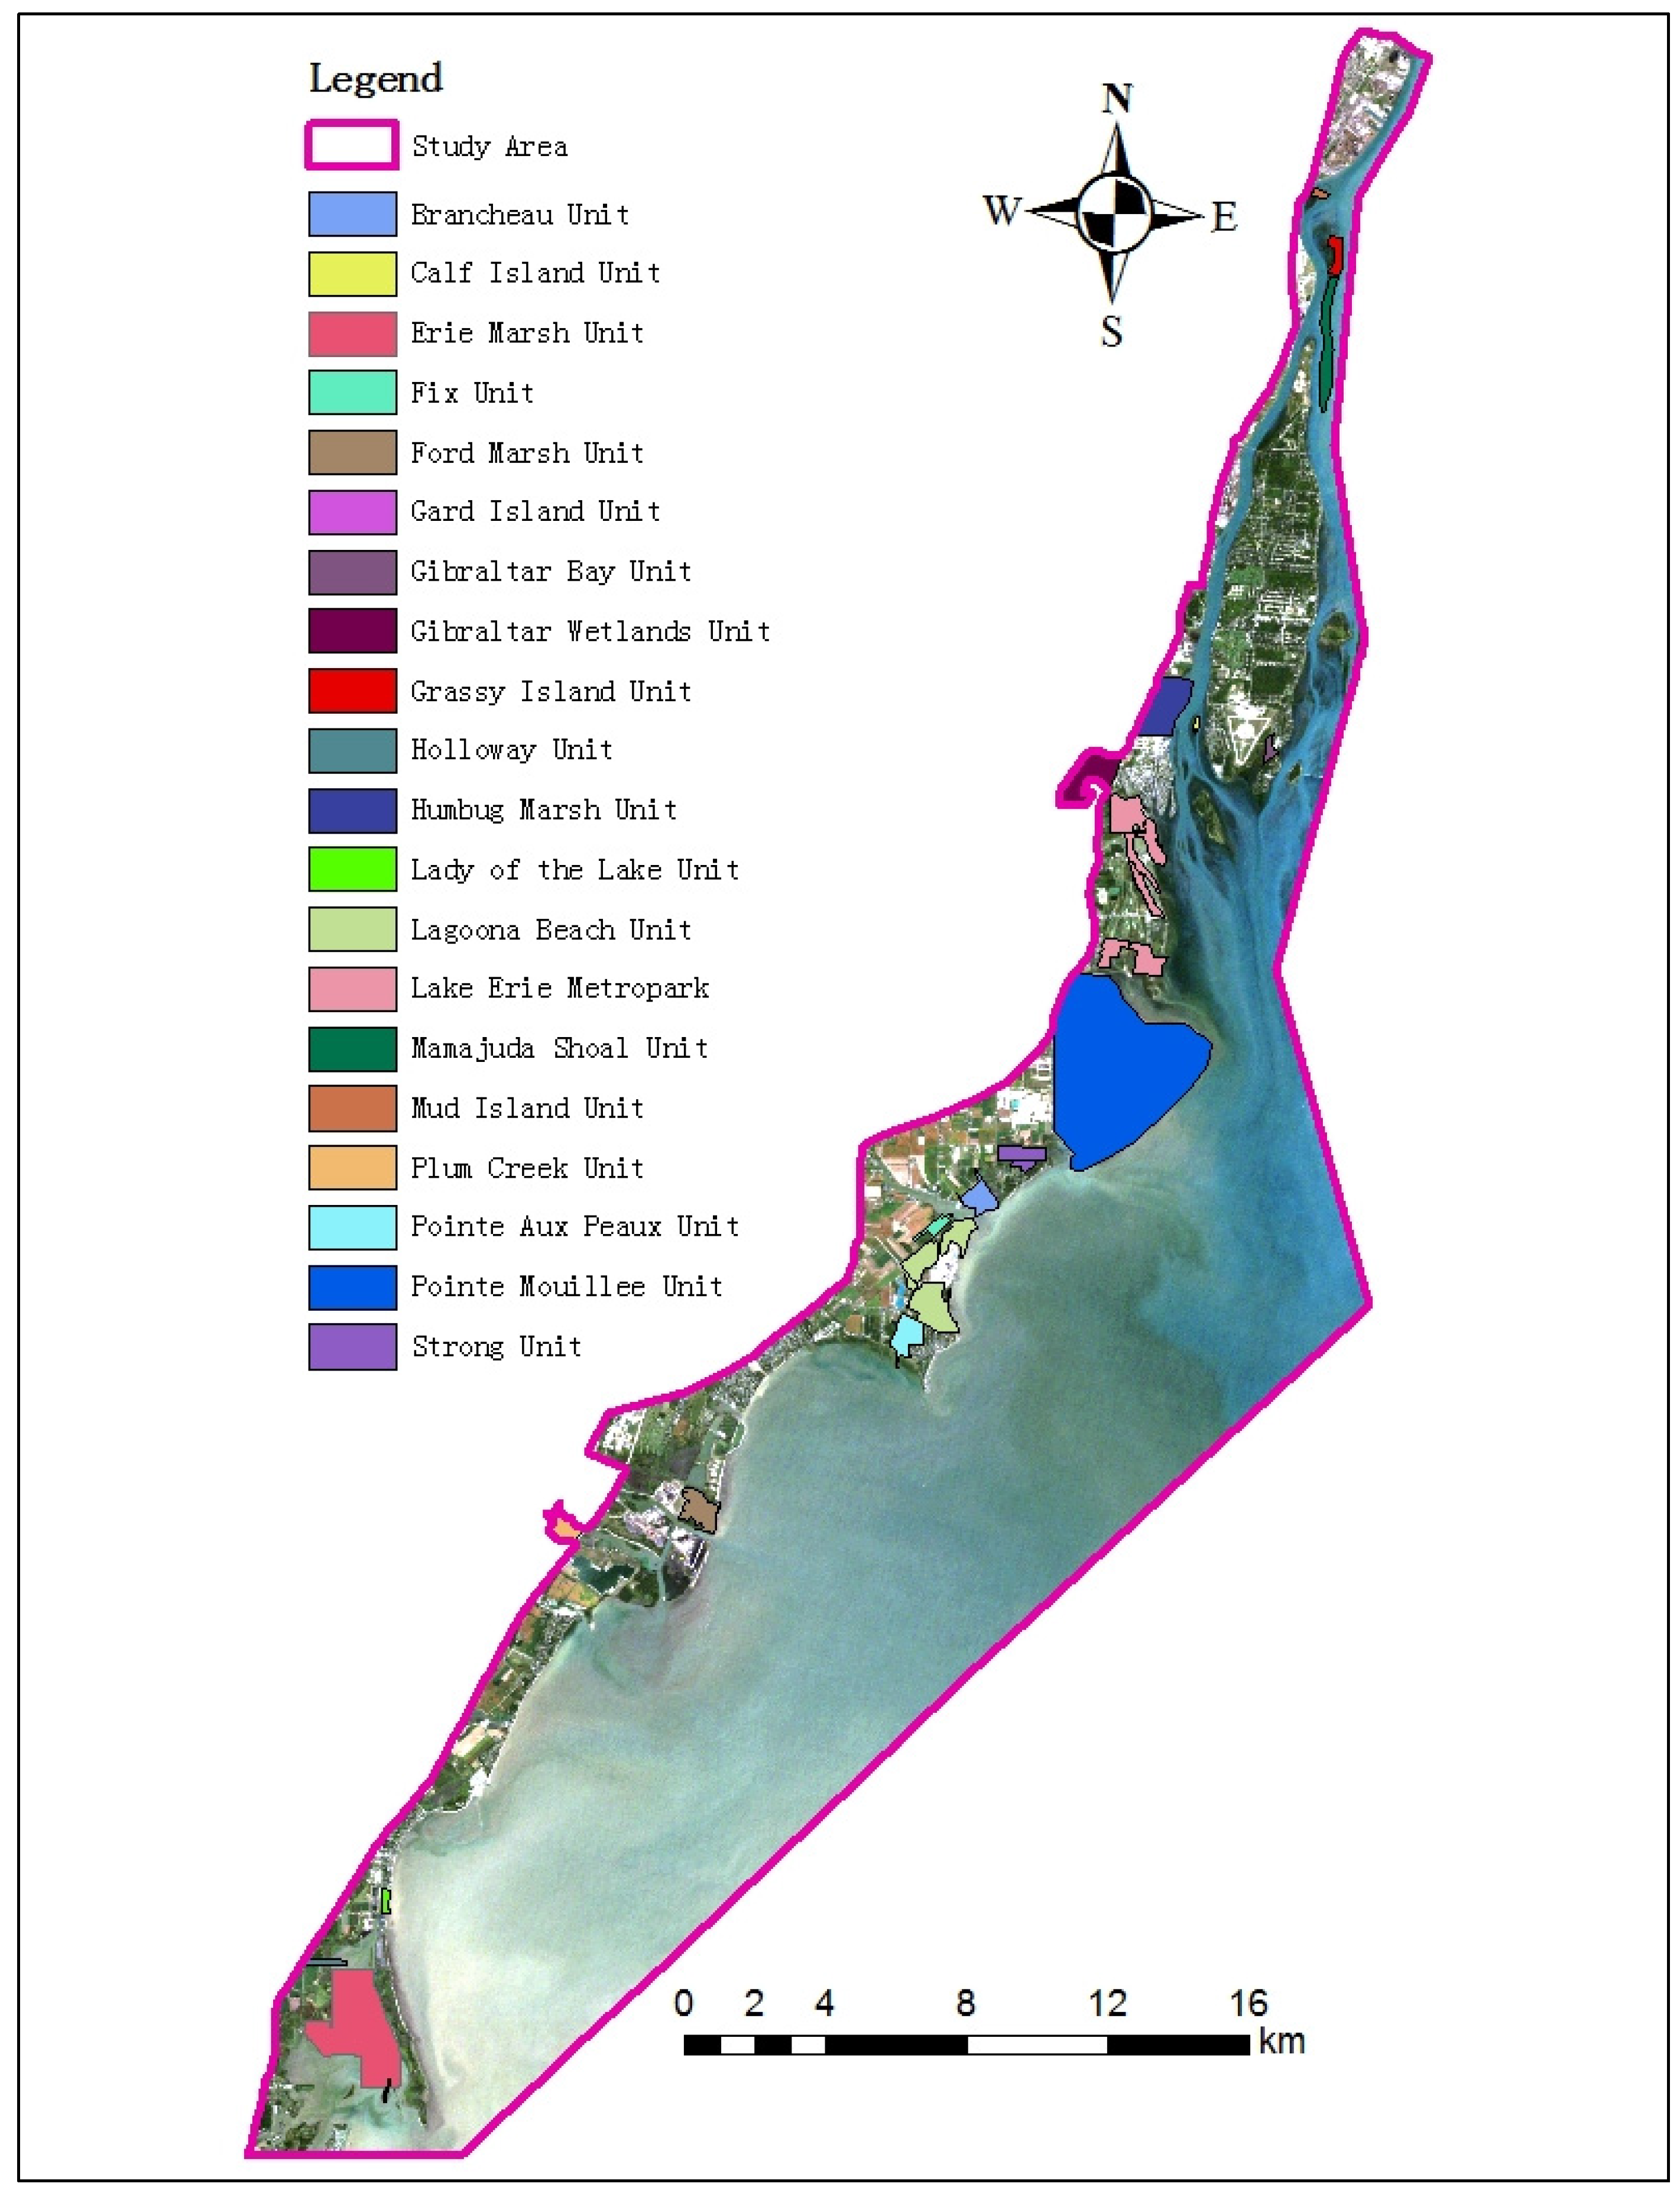
The study area of the DRIWR is situated within the area bounded by 41°43′–42°16′ N, 83°06′–83°30′ W (
Figure 1). The DRIWR occupies 51 miles of the Lake Erie shoreline and contains thousands of acres of wetlands. The DRIWR is well populated with
Phragmites australis (giant Phragmites cane), grass, shrubs, trees, cattail, marshland, cropland, and various other types of vegetation. Many of these wetland areas have been invaded by Phragmites over a number of years. Previous studies and on site surveys have revealed that the invasion of Phragmites presents a severe threat to plants indigenous to the wetland ecosystem.
2.2. Data Sources
In this paper, Landsat TM data were used to detect the changes of Phragmites distribution. The data are freely available with a long time-series, and the spatial resolution is 30 m. Autumn is the best season for monitoring changes in Phragmites and, thus, all images from 1 August to 15 October during the study period were downloaded for this study [
18]. The acquisition times are shown in
Table 1. NAIP and DOQQ 1-meter spatial resolution images were downloaded from
www.michigan.gov/cgi for the selection of training samples. The number of DOQQ and NAIP images used are shown in
Table 2.
A total of 25 vegetation/soil transects were planned for 20 of the DRIWR’s management units (shown in
Figure 1). Twenty-four of these units were staked using rust-proof painted eight-foot steel rebar. The transect planned for some units could not be staked due to the lack of an existing formal agreement between DRIWR and the Nature Conservancy, who own the land. Thus, 22 transects were staked and data collected for 13 DRIWR units. The locations of transect stakes, vegetation community boundaries, soil samples, and field photos were all georeferenced using GPS. Detailed transect field data collection forms were devised and implemented by the data collection team.
3. Methodology and Processing Techniques
The quality and quantity of the training samples are very important for image classification. There are two approaches for collecting training samples, which are gathering ground reference points (GRPs) through ground truth and obtaining surrogates of GRPs by the extraction from image data, or their combination [
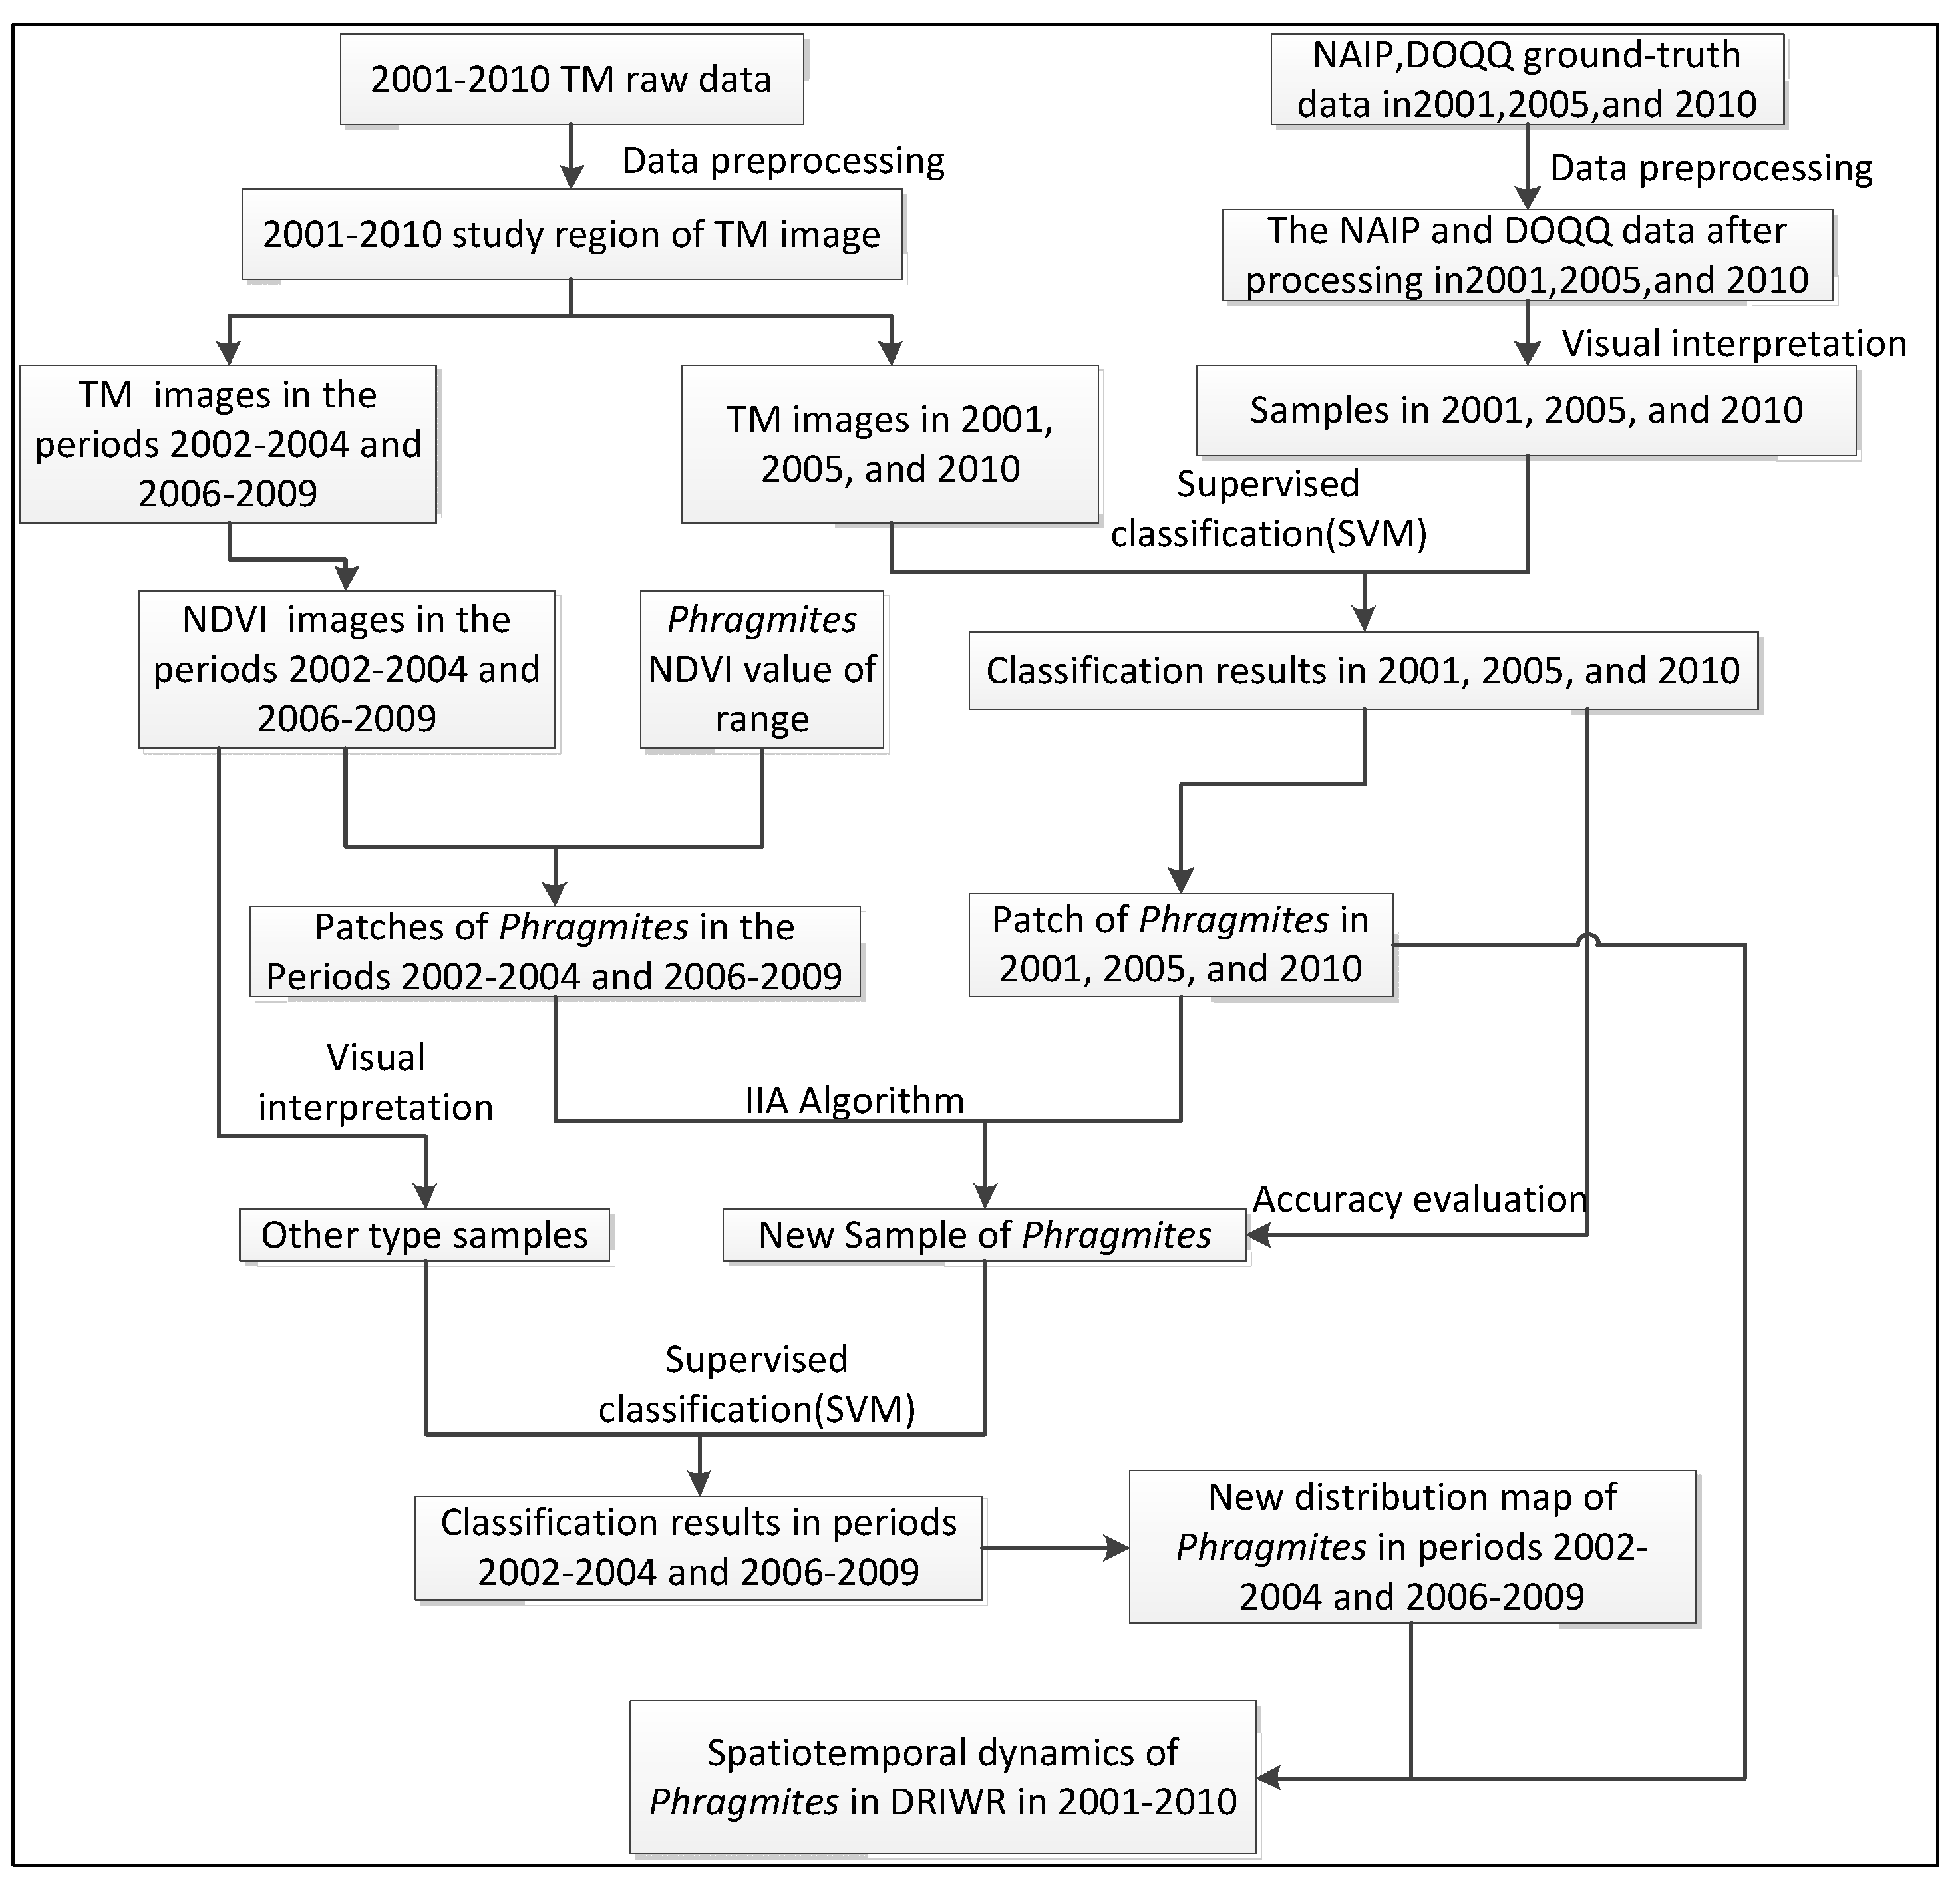
19]. In many cases, the number of training samples is insufficient to support the training of a classification algorithm. Therefore, in this paper a new IIAA is proposed to resolve the problem of the lack of historical training samples. The basic principles are as follows:
where
C1: Phragmites patches extracted by classified result of the 2001 TM image.
C5: Phragmites patches extracted by classified result of the 2005 TM image.
C10: Phragmites patches extracted by classified result of the 2010 TM image.
C2, C3, C4, C6, C7, C8, C9: Phragmites patches extracted by TM-NDVI value.
C11: the intersection of Phragmites patches based on TM-NDVI value.
C22: the intersection of Phragmites patches extracted by classification.
C: the intersection of C11 and C22.
This work verified the algorithm with samples based on the interpretation of the 2001, 2005, 2010 high-resolution aerial imagery, and ground-truth data. The data preprocessing, classification, statistics, vector data processing, and iterative intersection were completed using Exelis VIS ENVI5.1 (supplier: ESRI, Beijing, China; Manufacturer: Boulder, Colorado, USA)and ESRI ArcMap 10.1 (supplier: ESRI, Beijing, China; Manufacturer: Broomfield, Colorado, USA). The specific details of the process are shown in
Figure 2.
3.1. Data Preprocessing
Various image processing and vector GIS techniques were used for the analysis of the TM images, aerial images, and field information. The processing details are as follows:
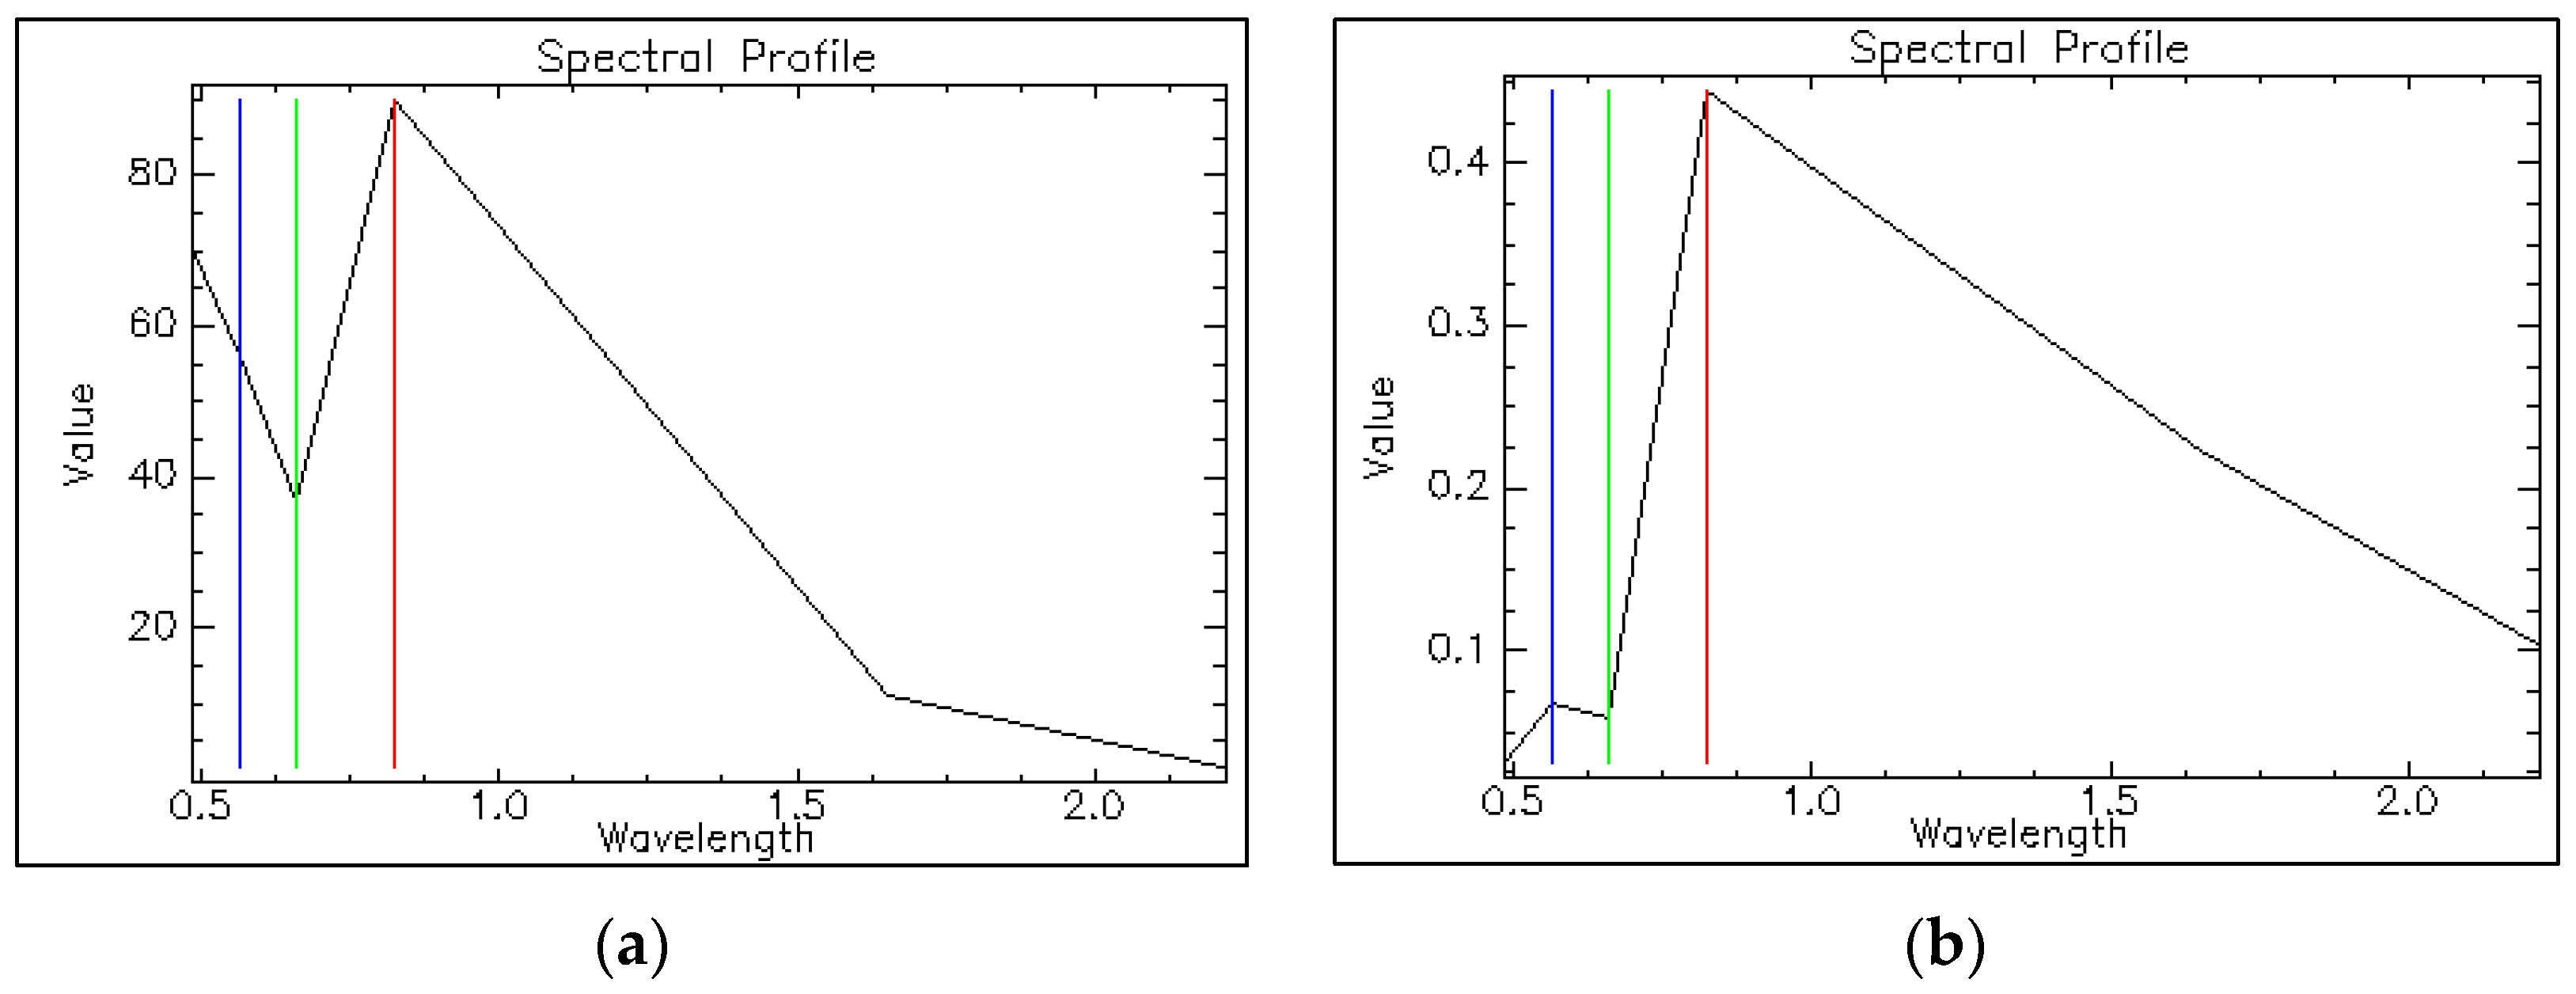
3.1.1. Atmospheric Correction
In order to study surface properties using imaging spectrometer data, accurate removal of atmospheric absorption and scattering effects is required. In the past thirty years, atmospheric correction algorithms have evolved from earlier empirical line methods and flat field methods to more recent methods based on rigorous radiative transfer modeling approaches. The FLAASH module in ENVI probably provides the most accurate means for compensating for atmospheric effects. In this paper, the FLAASH module was selected for the atmospheric correction of the Landsat TM5 images (2000–2010). The vegetation spectral profiles before and after the atmospheric correction process are shown in
Figure 3a,b, respectively.
3.1.2. Geometric Correction and Image Cropping
The images used in this paper were corrected into the UTM, zone 17 North Projection, using the WGS-84 system. Geo-referencing was followed by image-to-image registration in order to detect changes in the Landsat TM5 images. Resampling was performed using the nearest-neighbor method. Since our study area is smaller than the entire Landsat image, we cropped the original image using the study area vector to reduce the computational time. The resultant subset image can be seen in
Figure 1.
3.2. Preparation of Training Samples
The samples were collected with field surveys and sample extraction from NAIP and DOQQ images. For the purposes of this paper, nine different sample types were collected. The field samples were an important source of ground-reference data for developing the training signatures. However, because of the limitations of the spatial distribution, quantity of field transects, and restrictions on acquisition time, only 70 reference points were selected from the field transects in July 2010. Additional ground-reference data, especially for 2000, 2005, and 2010, were extracted through the visual interpretation of NAIP and DOQQ imagery.
3.3. Supervised Classification of the 2001, 2005, and 2010 TM Images
With the results of the sample extraction and the field survey, a support vector machine (SVM) supervised classification system was used to classify the TM images of 2001, 2005, and 2010. SVM is a state-of-the-art learning algorithm that has solid theoretical foundations in statistical learning theory [
20,
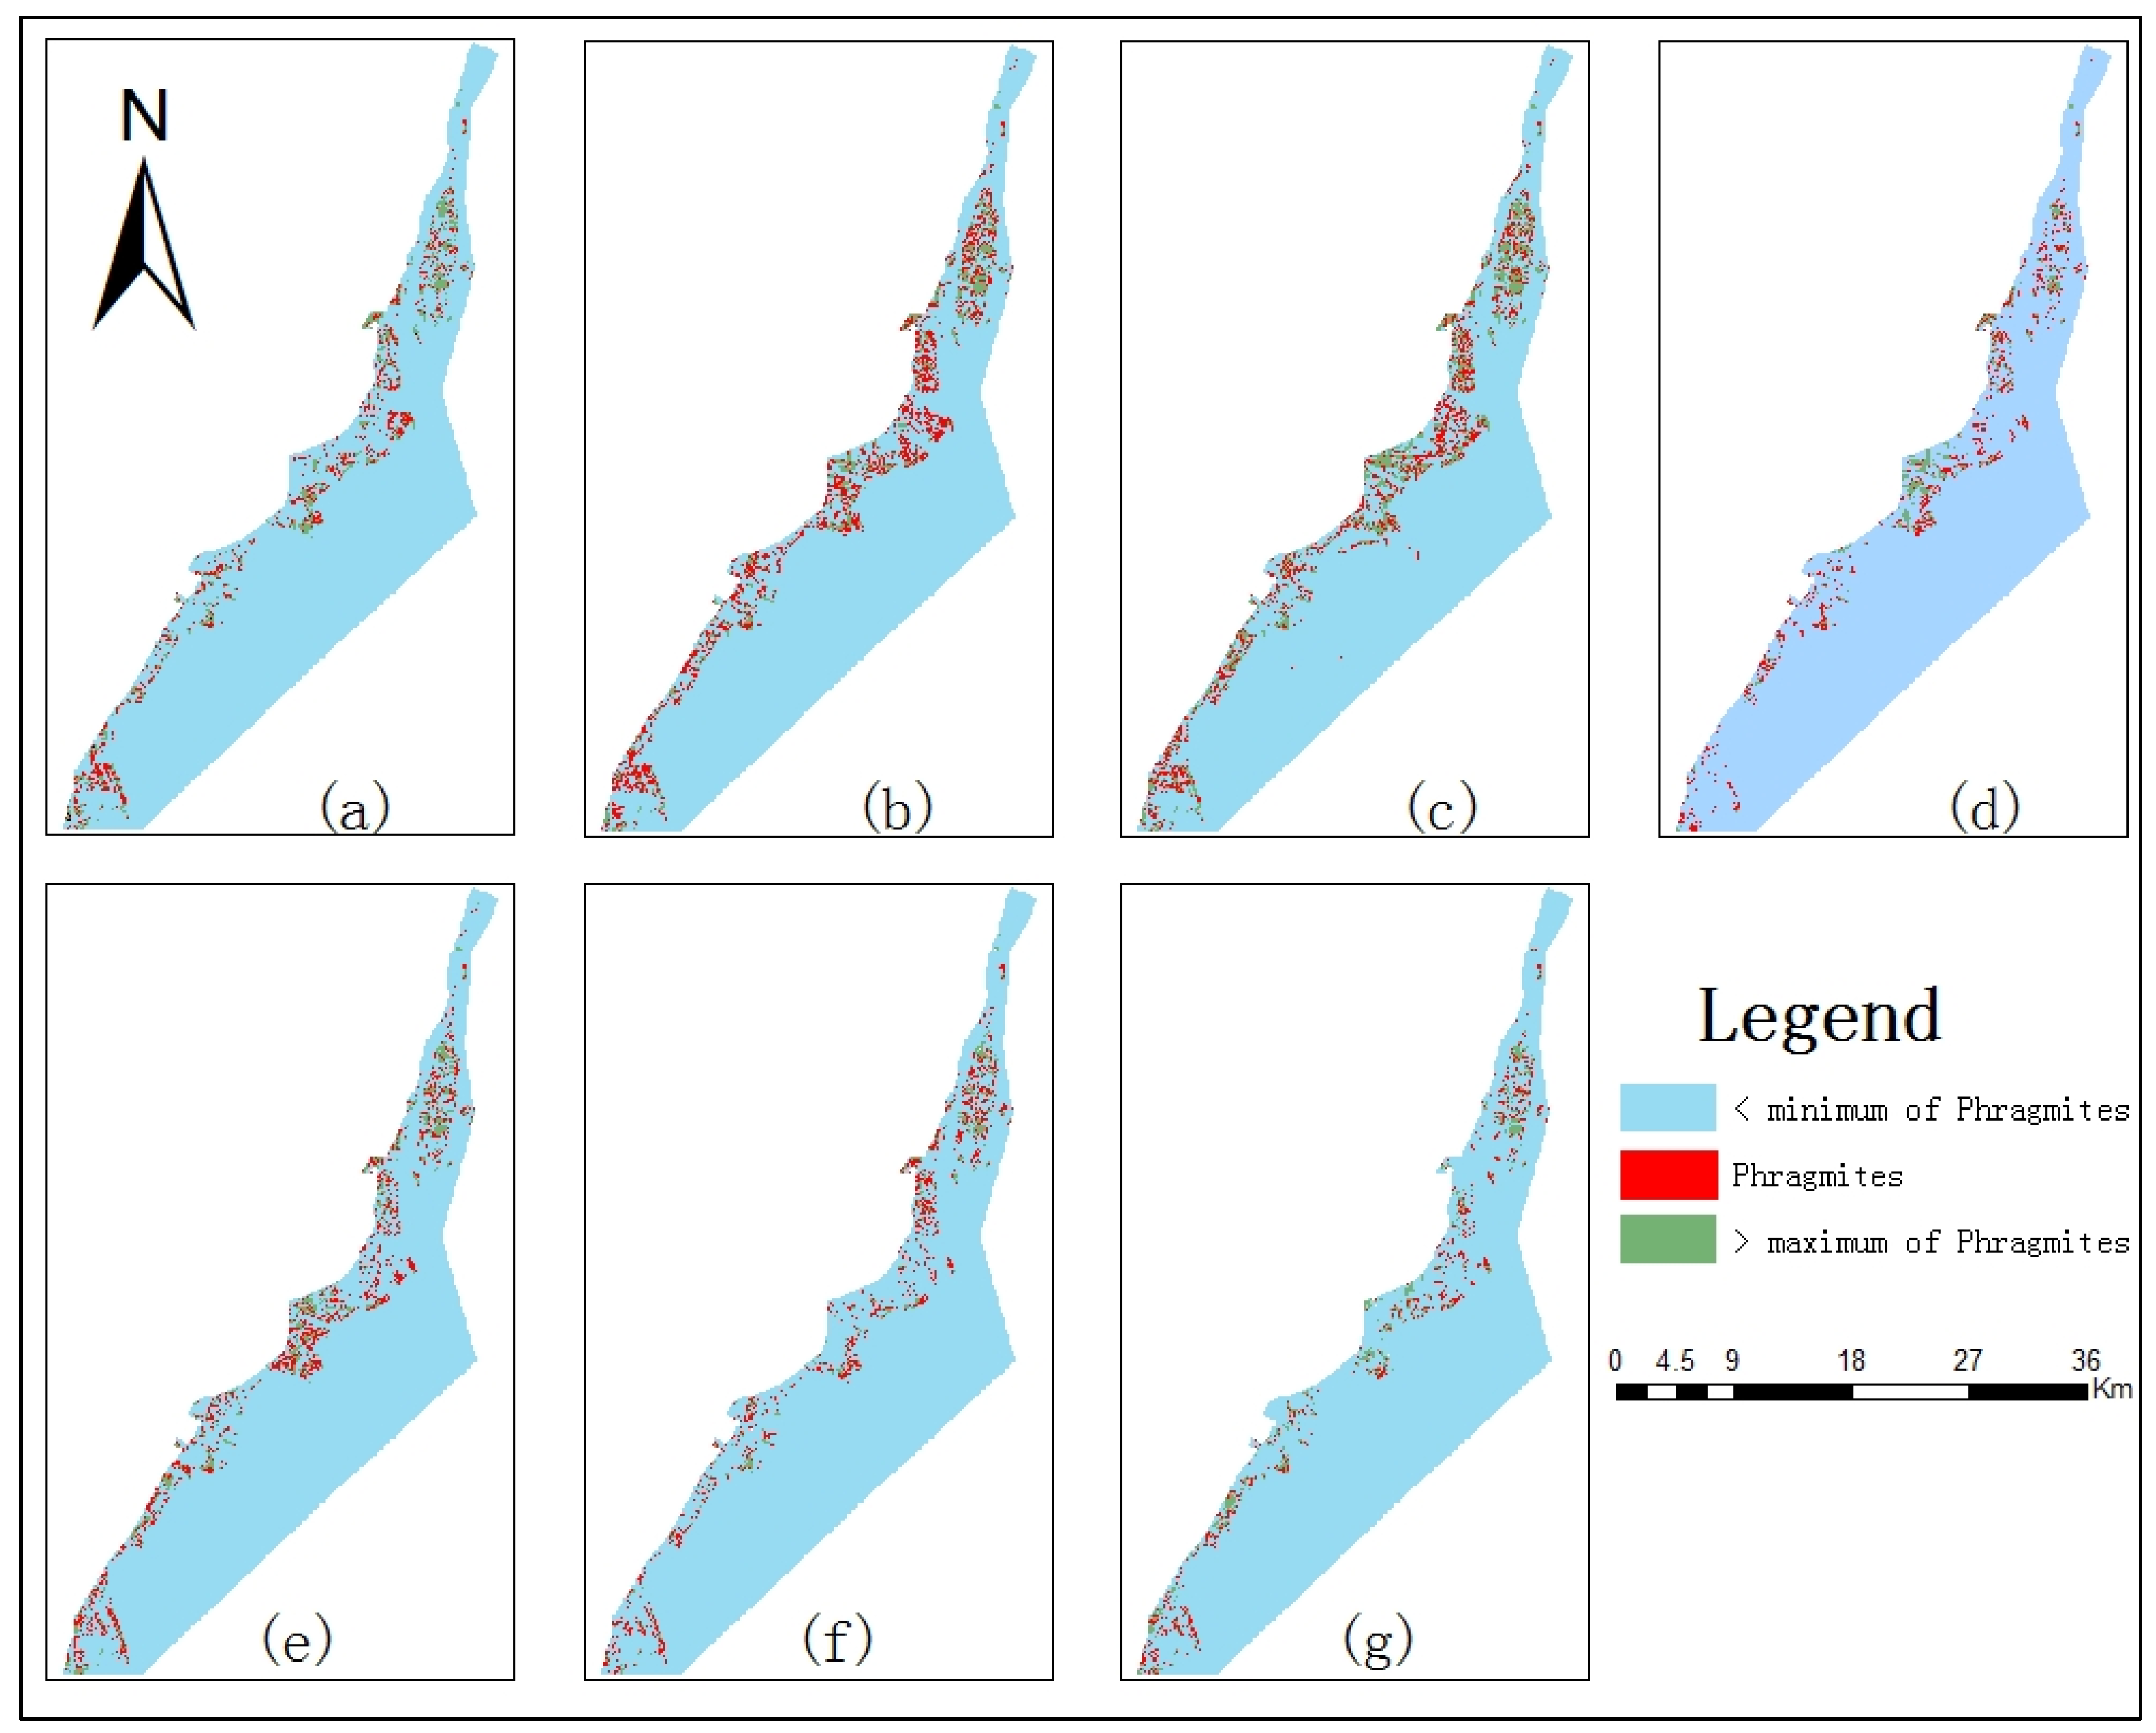
21]. SVM fixes decision functions based on structural risk minimization instead of the minimization of the misclassification of the training set to avoid over fitting. This work adopted the supervised classification of ENVI 5.1 and selected the SVM classifier for classification. The classification results are shown in
Figure 4. Based on the validation samples extracted from NAIP and DOQQ images, the precision of the classification results can be evaluated using confusion matrices. The accuracy of the identification of Phragmites is shown in
Table 3 and
Table 4.
3.4. Extraction of Information on Rough Phragmites Patches from Other Years
Remote sensing images with high spatial resolution were available only for 2001, 2005, and 2010, from which it was easy to obtain training samples. In order to obtain training samples for the other years, rough Phragmites patches were acquired by following four steps:
- (i)
Obtain NDVI images of our study area.
- (ii)
Label Phragmites patches in these TM images, based on historical data of 2002–2009 and information offered by residents and wetlands protection organizations.
- (iii)
Calculate the minimum, maximum, average, and standard deviations of the labeled patches from Step (ii); the statistics are shown in
Table 3.
- (iv)
Employ the density slicing function of ENVI 5.1 to extract rough information of Phragmites patches with the maximum or minimum values from
Table 3. The results are shown in
Figure 5.
3.5. Collection of Accurate Samples Using IIAA Based on Rough Phragmites Patches
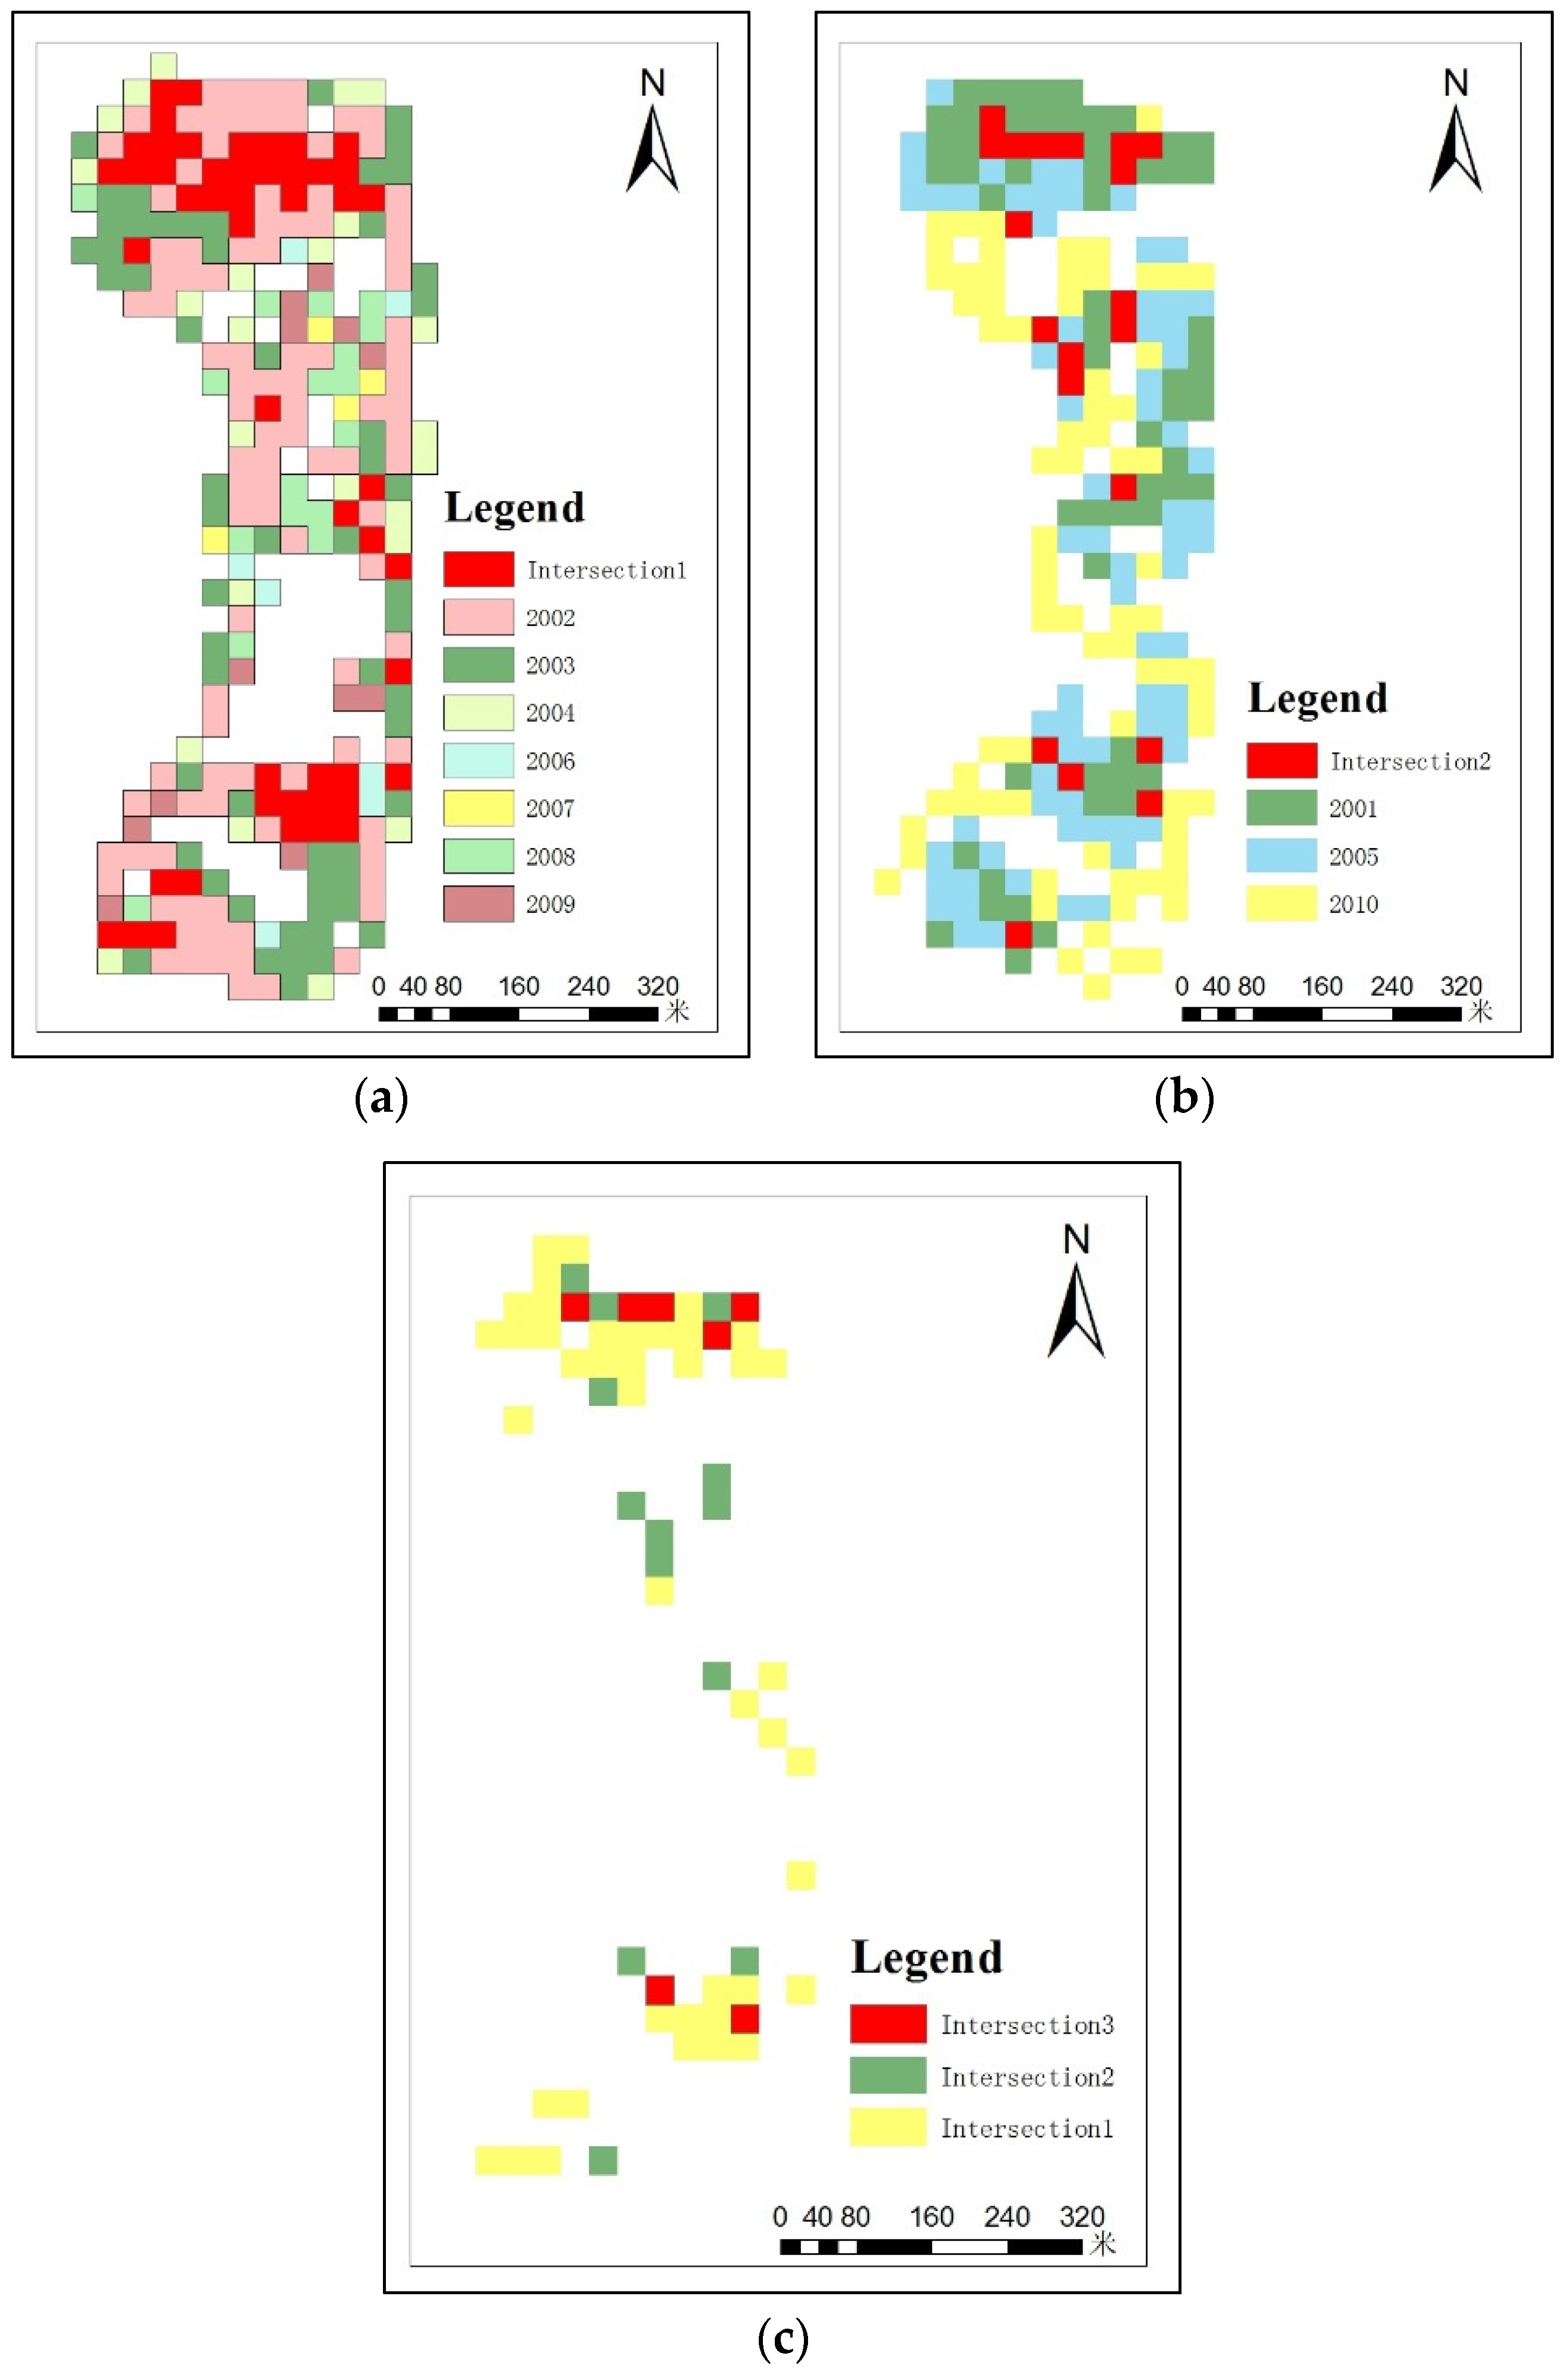
We take the Grassy Island in the study area as an example. This process includes four specific steps:
- (i)
Rough data of Phragmites patches were exported to vector data, and then imported into ArcMap10.2 of ESRI to obtain the intersection area using a GIS overlay analysis function. The result of the intersection is shown in
Figure 6a.
- (ii)
The Phragmites areas obtained from the classification of the 2001, 2005, and 2010 images and ground-truth data were converted to vector data, and imported to ArcMap10.2 to calculate their intersection area using GIS intersection function. The result of the intersection is shown in
Figure 6b.
- (iii)
The intersection function was employed again to obtain the intersection result for the period 2001–2010. The result of intersection area is shown in
Figure 6c.
- (iv)
Based on the intersection result, seven pixels were identified as Phragmites samples on Grassy Island (shown in
Figure 6c), and a total of 60 pixels were extracted from the entire study area.
3.6. Accuracy Evaluation of the Newly Extracted Phragmites Samples
In order to evaluate the accuracy of the newly extracted Phragmites samples, we replaced the original samples from 2001, 2005, and 2010 with the new samples. These were used as training samples and classified again; the classification results are shown in
Table 4. It can be seen that the accuracy of the new samples is on par with that of the original samples.
Table 5 shows a comparison of the original and newly-extracted areas of Phragmites, where the relative error is less than 1.5%.
3.7. Supervised Classification of 2002–2004 and 2006–2009 TM Images
Phragmites samples for the seven years from 2002–2004 and 2006–2009 were extracted using the IIAA method in
Section 3.5. Samples of the other eight types were extracted by visual interpretation of the TM images. The number of samples is not restricted, but it should ensure that Phragmites could be classified effectively. The supervised classification of TM images used the SVM classification method described in
Section 3.3. Finally, the specific extraction results of Phragmites areas are shown in
Table 6.
3.8. Analysis of Change in Phragmites During 2001–2010
Figure 7 illustrates the statistical analysis results of
Table 6, which reveals the trend of change of Phragmites from 2001 to 2010. Generally, the area of Phragmites grew steadily, except for a drastic decline in 2009, after which it began to increase again. The reason for the abrupt decline in 2009 was because some organizations removed some Phragmites through burning or treatment with herbicide. In 2009, roughly 1000 acres were treated at the Point Mouillee State Game Area as a result of NOAA stimulus funds, and during the same period, the treatment of Phragmites occurred in some other units, e.g., the strong and humbug units [
22].
4. Conclusions
Training samples had a great influence on the performance and accuracy of image-based vegetation classification [
9,
10]. It was a critical step in the careful design and proper extraction technique for obtaining an identifiable land-cover map by describing various feature classes as training and testing datasets, when remotely-sensed data were being used to study plant species invasion. Three types of image data that were easily accessible and had no, or very low, costs were tested in this paper. One was the airborne NAIP image, one was the DOQQ image, and the other one was the Landsat satellite image. The NAIP and DOQQ images had higher spatial resolutions, but lower spectral resolutions, and they were good image sources for visual interpretation to extract GRPs and to validate image classification performances. In addition, the experiments conducted in our paper also confirmed that visual interpretation results based on NAIP and DOQQ images were in agreement with GRPs but, unfortunately, we only have NAIP and DOQQ images of 2001, 2005, and 2010 years. For obtaining enough samples of 2002–2004 and 2006–2009, in this paper, a reliable new sample extraction method, name XXX (IIAA), was developed and evaluated.
The case study was done on Grassy Island of DRIWR, which was seriously invaded by Phragmites. Seven Phragmites pixels were identified by using IIAA based on the intersection between patches of Phragmites in the periods 2002–2004, 2006–2009, and patches of Phragmites in 2001, 2005, and 2010. Then, 60 pixels of Phragmites were extracted, adopting the same method in the entire study area. In order to evaluate the accuracy of the newly extracted Phragmites samples, we replaced the original Phragmites samples in the image of 2001, 2005, and 2010 with these 60 pixels. These were used as training samples to classify TM images, and the evaluated accuracy of experimental results show that it obtained a similar classification precision. In addition, as observed in
Table 5, the relative error of Phragmites areas is very small. This means that the use of TM images in conjunction with other high-resolution images and ground-truth data is suitable for the analysis of the invasion and dynamic change of Phragmites. Combined with training samples of other land cover types, supervised classification was employed to detect the changes of Phragmites areas. The result showed that Phragmites distribution areas increased from 5156 to 6817 acres in the period from 2001 to 2010, which is similar with reference [
23].
Finally, although the classification result illustrated that the sample extraction results using IIAA in comparison with the outcomes from NAIP and DOQQ was satisfactory, there were still several limitations that need to be addressed. For instance, in our study, Phragmites samples for the seven years from 2002–2004 and 2006–2009 were extracted using the IIAA method, but the training samples of the other eight types were extracted by visual interpretation. To some extent, different sample extraction methods may affect the accuracy of Phragmites area extraction. In order to verify or validate that the IIAA can be used in different conditions, more experiments should be addressed in other study areas, including different plant samples to be extracted by the IIAA method. In addition, it should help if some systematic approaches for collecting GRPs were implemented. All of these will be explored in our works in the future.
Acknowledgments
This work was partially funded by grants from the NSFC (#41501441), the Education Department of Hebei Province (Grant YQ2013012, QN2014184, QN2015105), and supported by a grant from the Science and Technology Department of Hebei Province (D2015402134; 14964206D-06). Appreciation is extended to Yichun Xie at Eastern Michigan University for the collection of field data, aerial photo interpretation, and algorithm instruction.
Author Contributions
Haixin Liu and Anbing Zhang performed the new algorithm research and wrote the paper. Xiaoliang Meng provided advice and suggestions, analyzed the data and wrote the paper. Tao Jiang and Xinxia Liu contributed the ground-based data and satellite remote sensing data collection and processing.
Conflicts of Interest
The authors declare no conflict of interest.
References
- Marks, M.; Lapin, B.; Randall, J. Phragmites australis (P. communis): Threats, management, and monitoring. Nat. Area. J. 1994, 14, 285–294. [Google Scholar]
- Galatowitsch, S.M.; Anderson, N.O.; Ascher, P.D. Invasiveness in wetland plants in temperate North America. Wetlands 1999, 19, 733–755. [Google Scholar] [CrossRef]
- Pengra, B.W.; Johnston, C.A.; Loveland, T.R. Mapping an invasive plant, Phragmites australis, in coastal wetlands using the EO-1 Hyperion hyperspectral sensor. Remote Sens. Environ. 2007, 108, 74–81. [Google Scholar] [CrossRef]
- Mills, E.L.; Leach, J.H.; Carlton, J.T.; Secor, C.L. Exotic species in the Great Lakes: A history of biotic crises and anthropogenic introductions. J. Great Lakes Res. 1993, 19, 1–54. [Google Scholar] [CrossRef]
- Wilcox, K.L.; Petrie, S.A.; Maynard, L.A.; Meyer, S.W. Historical distribution and abundance of Phragmites australis at Long Point, Lake Erie, Ontario. J. Great Lakes Res. 2003, 29, 664–680. [Google Scholar] [CrossRef]
- Byers, J.E.; Reichard, S.; Randall, J.M.; Parker, I.M.; Smith, C.S.; Lonsdale, W.M.; Atkinson, I.A.E.; Seastedt, T.R.; Williamson, M.; Chornesky, E.; et al. Directing research to reduce the impacts of nonindigenous species. Conserv. Biol. 2002, 16, 630–640. [Google Scholar] [CrossRef]
- Lynch, E.A.; Saltonstall, K. Paleoecological and genetic analyses provide evidence for recent colonization of native P. australis populations in a Lake Superior wetland. Wetlands 2002, 22, 637–646. [Google Scholar] [CrossRef]
- Baker, C.; Lawrence, R.; Montagne, C.; Patten, D. Mapping wetlands and riparian areas using Landsat ETM+ imagery and decision-tree-based models. Wetlands 2006, 26, 465–474. [Google Scholar] [CrossRef]
- Xie, Y.; Sha, Z.; Bai, Y. Classifying historical remotely sensed imagery using a tempo-spatial feature evolution (T-SFE) model. ISPRS J. Photogramm. Remote Sens. 2010, 65, 182–190. [Google Scholar] [CrossRef]
- Chi, M.M.; Qian, Q.; Atli Benediktsson, J. Cluster-based ensemble classification for hyper spectral remote sensing images. Geosci. Remote Sens. Symp. 2008, 1, 209–212. [Google Scholar]
- Zhang, A.; Xie, Y. A chaos-theory-based data-mining technique for image endmember extraction: Laypunov Index and Correlation Dimension (L&D). IEEE Trans. Geosci. Remote Sens. 2014, 52, 1935–1947. [Google Scholar]
- Artigas, F.J.; Yang, J.S. Hyperspectral remote sensing of marsh species and plant vigour gradient in the New Jersey Meadowlands. Int. J. Remote Sens. 2005, 26, 5209–5220. [Google Scholar] [CrossRef]
- Phinn, S.; Roelfsema, C.; Dekker, A.; Brando, V.; Anstee, J. Mapping seagrass species, cover and biomass in shallow waters: An assessment of satellite multi-spectral and airborne hyper-spectral imaging systems in Moreton Bay (Australia). Remote Sens. Environ. 2008, 112, 3413–3425. [Google Scholar] [CrossRef]
- Vincent, R.K.; Qin, X.; McKay, R.M.L.; Miner, J.; Czajkowski, K.; Savino, J.; Bridgeman, T. Phycocyanin detection from Landsat TM data for mapping cyanobacterial blooms in Lake Erie. Remote Sens. Environ. 2004, 89, 381–392. [Google Scholar] [CrossRef]
- Poulin, B.; Davranche, A.; Lefebvre, G. Ecological assessment of Phragmites australis wetlands using multi-season SPOT-5 scenes. Remote Sens. Environ. 2010, 114, 1602–1609. [Google Scholar] [CrossRef] [Green Version]
- Blossey, B. Before, during and after: The need for long-term monitoring in invasive plant species management. Biol. Invas. 1999, 1, 301–311. [Google Scholar] [CrossRef]
- Hestir, E.L.; Khanna, S.; Andrew, M.E.; Santos, M.J.; Viers, J.H.; Greenberg, J.A.; Rajapakse, S.S.; Ustin, S.L. Identification of invasive vegetation using hyperspectral remote sensing in the California Delta ecosystem. Remote Sens. Environ. 2008, 112, 4034–4047. [Google Scholar] [CrossRef]
- Bernthal, T.W.; Willis, K.G. Using Landsat7 imagery to map invasive Phragmites canary grass (Phalaris arundinacea): A landscape level wetland monitoring methodology. In Final Report to the U.S. Environmental Protection Agency Region V. PUB-SS-992; Wisconsin Department of Natural Resources: Madison, WI, USA, 2004; p. 98. [Google Scholar]
- Xie, Y.; Zhang, A.; Welsh, W. Mapping Wetlands and Phragmites Using Publically Available Remotely Sensed Images. Photogramm. Eng. Remote Sens. 2015, 81, 69–78. [Google Scholar] [CrossRef]
- Vapnik, V.N. Statistical Learning Theory; John Wiley & Sons: New York, NY, USA, 1998. [Google Scholar]
- Ding, S.F.; Qi, B.B.; Tan, H.Y. An overview on theory and algorithm of Support Vector Machines. J. Univ. Electr. Sci. Technol. China 2011, 1, 2–8. [Google Scholar]
- Environmental Assessment for Control of Phragmites australis in Western Lake Erie Coastal Marshes, 2 November 2010. The Nature Conservancy in Ohio Oak Openings Project Office. Available online: http://120.52.73.77/www.fws.gov/midwest/documents/EADraft-TNCGLRIWLEPhragmitesControl8Jul11.pdf (accessed on 8 July 2011).
- Xie, Y.; Zhang, A. Development of Remote Sensing Methods for Detection of Invasive Wetland Plants. In Proceedings of the State of the Strait International Conference, Eastern Michigan University, Ypsilanti, MI, USA; 2012; Volume 1, pp. 22–27. [Google Scholar]
© 2016 by the authors; licensee MDPI, Basel, Switzerland. This article is an open access article distributed under the terms and conditions of the Creative Commons by Attribution (CC-BY) license (http://creativecommons.org/licenses/by/4.0/).


