Article

Environmental Efficiency Analysis of Listed Cement Enterprises in China

1
School of Economics and Management, Beihang University, Beijing 10191, China
2
Faculty of Business and Law, Leeds Beckett University, Leeds LS1 3HE, UK
3
Business School, University of Hertfordshire, Hatfield AL10 9EU, UK
*
Author to whom correspondence should be addressed.
Sustainability 2016, 8(5), 453; https://0-doi-org.brum.beds.ac.uk/10.3390/su8050453
Submission received: 28 March 2016 / Revised: 28 April 2016 / Accepted: 3 May 2016 / Published: 7 May 2016

Abstract

:
China’s cement production has been the highest worldwide for decades and contributes significant environmental pollution. Using a non-radical DEA model with slacks-based measure (SBM), this paper analyzes the environmental efficiency of China’s listed cement companies. The results suggest that the average mean of the environmental efficiency for the listed cement enterprises shows a decreasing trend in 2012 and 2013. There is a significant imbalance in environmental efficiency in these firms ranging from very low to very high. Further investigation finds that enterprise size and property structure are key factors. Increasing production concentration and decreasing the share of government investment could improve the environmental efficiency. The findings also suggest that effectively monitoring pollution products can improve environmental efficiency quickly, whereas pursuit for excessive profitability without keeping the same pace in energy saving would cause a sharp drop in environmental efficiency. Based on these findings, we proposed that companies in the Chinese cement sector might consider restructuring to improve environmental efficiency. They also need to make a trade-off between profitability and environmental protection. Finally, the Chinese government should reduce ownership control and management interventions in cement companies.

1. Introduction

The Chinese economy has seen astonishing rates of development in the first three decades since its opening up in the early 1980s. This growth trend has been slowing down recently. An average growth rate of 9% for more than 30 years consumed a huge amount of construction materials including cement. This makes China responsible for 27.5% of the world’s carbon dioxide emissions in 2014, which is three times higher than in 1997 (BP, 2015) [1]. In line with the rapid economic growth, cement production in China reached a new record level of 2500 million tons in 2014, constituting 59.81% of the world’s cement production (USGS, 2015) [2].
As a typical energy and pollution intensive industry, the cement sector is considered one of China’s main contributors to energy consumption, greenhouse gas (GHG) emissions, SO2 emission, NOx emission and dust waste. With cement production, limestone calcination and burning fossil fuels produce large amounts of air pollutants, which have negative impacts on nature and human health. It was reported that the cement industry emitted CO2, SO2, NOx and dust waste accounting for 21.8%, 4.85%, 8% and 27.1%, respectively, of the total Chinese industrial emissions in 2010 [3].
In order for the Chinese government to keep its promise at the United Nations Climate Change Conference held in Copenhagen in 2009, the cement industry, alongside the metallurgy and chemical industries, must reduce greenhouse gas emissions by 40% to 45% by 2020 compared to the level of emissions in 2005. In addition to the implementation of relevant environmental laws and regulations, the National Development and Reform Commission (NDRC) launched guidelines in 2014 that require carbon emissions from steel and cement producers to stay at the same level by the end of 2020 as they were in 2015. Thus far, the Chinese government has launched a series of air pollution criteria for cement industry including encouraging using advanced kilns, renewable energy and new material. Cement industry in China faces huge pressure on conserving energy and reducing air pollution emission. Therefore, improving environmental efficiency in the cement companies has become an important national environment strategy.
Serious overcapacity problems also exist in the Chinese cement sector currently (e.g., only 66.8% capacity utilization in 2015 [4], which could lead to an overall industry profit shrinkage. As such, cement companies in China are facing a dilemma, i.e., how to keep profits increasing when requiring product and emission reductions? It is apparent that improving environmental efficiency should be a key reform strategy.
Substantial numbers of research on cement industry have been carried out however very few focus on its environmental efficiency at micro-level, also lack of research on the determinants of environmental efficiency at the firm level (see Section 2.1), with no comprehensive analysis about key influential factors on environmental efficiency. As all cement enterprises are required to comply with same emission criteria, the following questions are raised. What is the difference of the environmental efficiency among Chinese cement enterprises? Is it a right strategy that Chinese government implements the policy “Promoting large and shutting down small” to tackle pollution in the sector? Are there significant differences in terms of environmental efficiency for Chinese cement enterprises because a number of Chinese cement enterprises are still owned by the government? Do the state owned cement companies have higher environmental efficiency than private enterprises? The results from this study might answer some of these questions. The aim of this research is to analyze the environmental efficiency of China’s cement enterprises and identify important determinants affecting environmental efficiency in the sector. Using a two stage Data Envelopment Analysis (DEA) approach, this paper firstly examines environmental efficiency for 16 listed cement companies in China from 2008 to 2013 through a slack-based model (SBM) with undesirable outputs; then in the second stage, it explores influential factors from different perspectives relating to environmental efficiency in these firms using Tobit regression and bootstrap truncated regression models. We hope in this way, a more comprehensive understanding of environmental efficiency in China’s cement sector can be established. This study makes contributions to existing literature in three ways: Firstly, to the best of our knowledge, this paper uses a two stage DEA approach to estimate the environmental efficiency and influential factors at the listed cement firm level for the first time. The innovations in the analysis aim to highlight the environmental efficiency problems facing cement companies and offer guidance in technology reform and resource deployment. Secondly, it conducts an empirical analysis on the relationship of the corporate scale, property ownership and environmental efficiency, and explores how influential factors impact on the environmental efficiency of listed cement firms in China. The results have implications for policy makers in setting up industry policies and national environmental regulations to solve specific problems facing Chinese cement sector. Thirdly, although CO2 is the common undesirable output measured in environmental efficiency studies, we considered four undesirable outputs (CO2, SO2, NOX and dust waste) in line with the characteristics of cement industry. As such, this paper contributes to the extant literature by offering new evidence and insights.
The rest of this paper is organized as follows: Section 2 sets out a literature review in relation to environmental efficiency and undesirable output measurements, respectively; Section 3 establishes the analytic models, discusses sample selection and describes variables; Section 4 reveals the data analysis results and discussion; and, finally, Section 5 provides concluding remarks.

2. Literature Review

2.1. Measuring Environmental Efficiency

Under the pressure of climate change and energy shortages, governments in most countries have to promote regulations and policies in favor of environmental efficiency. As such, environmental efficiency research has constantly been a topical issue and has attracted significant attention in the academic debate. Research on environmental efficiency can be classified into four categories:
Exploration and application of the methods: Several methods have been developed or improved for analyzing environmental efficiency [5]. Currently, DDF and SBM are the most popular methods to estimate efficiency with undesirable outputs, which will be discussed in Section 2.2.
Impact of environmental policies on environmental efficiency: Several studies investigated the impacts of environmental policies and regulations on environmental efficiency. Some found that environmental regulations can help improve environmental efficiency [6], some suggested a negative influence [7], and others proved that different environmental policies may have different influences on environmental efficiency [8].
Undesirable outputs selection: CO2 is the common undesirable output in the extant literature [6,9,10] mainly because CO2 is the major byproduct of traditional energy combustion. However, we argue that undesirable outputs should be selected based on the aims of the research objectives and the characteristics of the industry targeted, for instance, waste water, waste gas and solid waste are used to measure the environmental efficiency in manufacturing [11] and SO2 is usually used in power industry [12].
Influencing variables analysis: These studies are generally focused on countries or regions [13], or an industry [7,11,14] or at firm level [6,15]. Variables used can be summarized as region related (e.g., regional technology investment intensity, and location), industry related (e.g., industry concentration and industrial structure) and firm related (e.g., enterprise scale and age, ownership, energy consumption, R&D, profit, labor capital structure, etc.).
With regards to the existing literature on the analysis of emissions reduction and environmental efficiency of cement industry, it can be summarized as follows:
Using various models to predict the reducing emission potential. For instance, conservation supply curve models (CSC) are used to estimate energy efficiency potential and CO2 emission reduction [16]. Scenario analysis is used to examine potential of energy conservation and emissions reduction [17].
Exploring factors of carbon emission, for example, log-mean divisa index (LMDI) decomposition method is used to explore what are the main factors responsible for the changes in energy consumption and CO2 emissions [18].
Improving techniques and replacing raw materials to reduce carbon emission, for example Lei [19] indicated that precalcining kiln could reduce pollution.
Environmental efficiency analysis: These studies, on the one hand, focused on analyzing environmental efficiency at macro level; for example Mandal et al. [20] conducted environmental efficiency of India’s cement sector using DDF, Long et al. [21] investigated total factor productivity, eco-efficiency and the determinants of Malmquist and Mamlquist–Luenberger in China’s cement manufacturers from 2005 to 2010; on the other hand, a debate on whether undesirable outputs should be included in the measurements of energy efficiency continues because some scholars argued that bias would appear when considering desirable outputs [22]. As such, researchers have tried to address this disadvantage by including undesirable outputs. Taking two examples here, Oggioni et al. [23] analyzed the eco-efficiency of 21 prototypes of cement industry from 2005 to 2008 in some countries using both DEA and directional distance function approach, meanwhile considering the inputs, and desirable and undesirable outputs. Riccardi et al. [24] assessed the efficiency of the high energetic and CO2 emissions intensive cement production processes in 21 countries using distance function and directional distance function, and compared two different efficiencies, one with and another without undesirable outputs. Therefore, the next section will accommodate an expanding review to the undesirable output measures in DEA (see Section 2.2).
From the discussion above, we understand that the first three aspects focus on cement production technique management and energy structure adjustment and the fourth is about the environmental efficiency analysis, however they are still not comprehensive and omissions can be found. Firstly, to our knowledge, these studies estimated the environmental efficiency at the macro level, either countries or regions [20,21,22,24]) but not at micro level (i.e., firm level). We argue that firm level research is necessary as firms are the primary units that emit pollution, are obligated to environmental regulations and make decisions on issues of efficiency and environmental management [25]. Secondly, most of these studies only select CO2 as undesirable output [21,23], while ignoring other factors such as SO2, NOX, dust waste, etc., which are also significant byproducts of cement production. Thirdly, few studies explore the variables that affect the environmental efficiency of cement industry. This paper, therefore, will fill out the gap by considering four undesirable outputs in environmental efficiency estimation and explore the influencing factors at the firm level.

2.2. Undesirable Outputs Measurement in DEA

Efficiency estimations can be measured from economic, operational and environmental perspectives. Common measures include parametric and nonparametric estimators. Both approaches have their advantages and disadvantages. As a parametric estimator, stochastic frontiers analysis (SFA) imposes restrict production function and takes random shock and error measurements into account. However, when using SFA, a specific function is needed to impose an assumption such as Cobb–Douglas equation. Furthermore, determining the specific error structure is also a difficulty in the implement of SFA.
DEA and FDH (Free Disposal Hull), as the typical nonparametric methods, require neither input nor output functions, it also does not require many data points. DEA is the most popular efficiency model and is widely used to estimate the efficiency of a system, it evaluates the relative efficiency using multiple input and output variables. The traditional DEA could be divided into two models, CCR and BCC models. The CCR model is based on constant returns to scale (CRS) assumption and estimates the overall technical efficiency (OTE) of decision-making units (DMUs) without considering the weight of variables [26]. The BCC model extends the CCR model under the variable returns to scale (VRS) assumption. Moreover, traditional DEA models are divided into input-oriented DEA model and output-oriented DEA model; the former fixing outputs to minimize inputs while the latter fixing one inputs to maximize outputs.
Despite their popularity, researchers have found a number of flaws in the DEA models in recent years. For example, under the assumption of minimizing inputs and maximizing outputs, the traditional DEA models are unable to perform well when considering any undesirable outputs. In order to tackle this issue, three measures have been used:
(1)
If the undesirable output has the same direction with input, the undesirable output can be treated as a certain input [27,28]. This reduces the number of undesirable outputs, and improves the environment condition.
(2)
Transforming the form of the undesirable outputs. The main transformation method uses multiplicative inverses (1/bad outputs) [29].
(3)
Adding additive inverses on undesirable outputs a sufficiently large positive vector. This method is widely used [23,30].
Distance function is another popular measure to deal with the undesirable outputs. Numerous types of distance function include radical distance function [31], hyperbolic distance function [32,33,34], the environmental distance function [35,36] and the directional distance function (DDF) [20,37,38] while the treatments on undesirable outputs of these method are different. However, the flaw of the distance function is the slacks of the indexes could not be found.
An alternative measurement named slacks based measures (SBM) was proposed by Tone [39]. Having similar non-oriented assumption with DDF, SBM model can measure the energy saving potential slacks and emission reducing slacks. A number of studies have extended it by including strong and weak disposability on pollution tackling [32,33,40]. A hyperbolic approach is used to measure the energy efficiency or environmental efficiency under different assumptions on the disposability of undesirable outputs. Under strong disposability, undesirable outputs reduction has little relation to desirable outputs, which means they can be reduced without cost. While under the weak disposability, the undesirable outputs reduction is related to the desirable outputs. Desirable outputs increase or inputs increase will bring about the undesirable outputs.
Considering the above discussion, this paper will use SBM model to estimate the environmental efficiency of listed cement manufacturers in China. The next section sets out the empirical models we use to analyze the data.

3. Methodology and Data

3.1. SBM Model

As discussed above, the main limitations of traditional DEA are that they do not calculate the slack of the inputs variables, outputs variables or undesirable outputs. In the context of analyzing environmental efficiency for pollutant industries like the cement industry, the pollutant outputs (e.g., carbon emission, waste, NOX, SO2, etc.), as the byproduct of the production process, cannot be ignored. As such, recent studies have used SBM model [40,41].
In our analysis, we refer the non-racial and non-oriented method in the SBM model developed by Tone [39].
In the context of discussing the cement production process in n DMUs with three factors: inputs, desirable outputs and undesirable outputs are denoted by three vectors: x R m , y g R s 1 , y b R s 2 . We define the metrics as follows:
X = [ x 1 , x 2 , , x n ] R m × n , Y g = [ y 1 g , y 2 g , , y n g ] R s 1 × n , Y b = [ y 1 b , y 2 b , , y n b ] R s 2 × n
The production possibility set (PPS) could be presented as follows:
P ( x ) = { ( y g , y b ) , x p r o d u c e ( y g , y b ) , x X λ , y g Y g λ , y b Y b λ , λ 0 }
where λ is a non-negative vector in Rn.
Considering undesirable outputs by referring to Cooper et al. [42] and Zhang and Choi [43], we applied the improved SMB model to deal with strong disposability and this process can be described as follows [44]:
min ρ = 1 1 m i = 1 m s i x i 0 1 + 1 s 1 + s 2 ( j = 1 s 1 s j + y j 0 g + j = 1 s 2 s r y r 0 b )
S . T . x i 0 = X λ + s i ,   i = 1 , 2 , , m y j 0 g = Y g λ - s j + , j = 1 , 2 , , s 1 y r 0 b = Y b λ + s r , r = 1 , 2 , , s 2 k = 1 n λ k = 1 λ , s i , s j + , s r 0
m, s 1 , and s 2 denote the number of input, desirable outputs and undesirable outputs, respectively . s i , s j + and s r are the slack variables of the inputs, desirable outputs and undesirable outputs, respectively. s i represents the input excess, s j + indicates the outputs shortfall, and s r denotes the undesirable outputs excess. Using the Charnes–Cooper transformation, it can be transformed into a linear model as follows:
min ϕ = t 1 m i = 1 m S i x i 0
S . T . t + 1 s 1 + s 2 ( j = 1 s 1 S j + y j 0 g + r = 1 s 2 S r y r 0 b ) = 1 t x 0 = X Λ + S i ,   i = 1 , 2 , , m ty 0 g = Y g Λ S j + , j = 1 , 2 , , s 1 ty 0 b = Y b Λ + S r , r = 1 , 2 , , s 2 k = 1 n Λ k = t Λ , S i , S j + , S r 0
where Λ = t λ , S i = t s i , S j + = t s j + , S r = t s r
An optimal solution of the model with ϕ = 1 , s i = s j + = s r = 0, means the DMUs are efficient without any adjustment, and no potential enhancement in optimal solution.
The pioneering model assumes that the undesirable outputs are unrelated to other variables, which is inconsistent with the production technology. Strong disposability allows for the fact that the undesirable outputs are freely disposable. The cement production is accompanied by the air pollution (CO2, SO2, NOx, etc.) and dust waste. The undesirable outputs are certainly proportional to the desirable outputs under the present production technology. The assumption of weak disposability held by Färe et al. [32] is more reasonable in cement production. The SBM model considering weak disposability presents the undesirable outputs are related to the slack of desirable outputs. The model is described as follows [44]:
min ρ = 1 1 m i = 1 m s i x i 0 1 + 1 s 1 + s 2 ( j = 1 s 1 s j + y j 0 g + j = 1 s 2 s r y r 0 b )
S . T . x 0 = X λ + s i ,   i = 1 , 2 , , m y 0 g = Y g λ - S j + , j = 1 , 2 , , s 1 ( 1 + 1 s 1 j = 1 s 1 s j + y 0 g ) y 0 b = Y b λ + s r , r = 1 , 2 , , s 2 k = 1 n λ k = 1 λ , s i , s j + , s r 0
The difference between Model (1) and Model (3) is the third constraint condition containing a coefficient related to the potential enhancement of desirable outputs. To comply with the weak disposability assumption, Model (3) indicates the undesirable outputs are proportional to the slack of desirable outputs as well as a non-radial, non-oriented measurement. The nonlinear model could be transformed to a linear equation based on the solution of Charnes–Cooper transformation scheme.
min ϕ = t 1 m i = 1 m S i x i 0
S . T . t + 1 s 1 + s 2 ( j = 1 s 1 S j + y j 0 g + r = 1 s 2 S r y r 0 b ) = 1 t x 0 = X Λ + S i ,   i = 1 , 2 , , m ty 0 g = Y g Λ S j + , j = 1 , 2 , , s 1 ( t + 1 s 1 j = 1 s 1 S j + y 0 g ) y 0 b = Y b Λ + S r , r = 1 , 2 , , s 2 k = 1 n Λ k = t Λ , S i , S j + , S r 0
where Λ = t λ , S i = t s i , S j + = t s j + , S r = t s r
The above models show that the cement enterprises’ environmental efficiency can be scaled between 0 and 1.

3.2. Regression Model

The second stage of our analysis is to identify the explanatory factors of the environmental efficiency using regression. Ordinary least squares (OLS), Tobit, and truncated regression are widely used in this second stage. The most popular approach relating the efficiency scores and contextual variables is Tobit model, which is an alternative method for OLS, when the dependent variables are either censored, or corner solution, or both.
Due to the fact that the environmental efficiency of the DMUs range from 0 to 1, the general estimation method as Ordinary Least Square will not be applicable. Based on the principle of maximum likelihood estimation, the Tobit regression model is known as truncated or censored regression model.
The Tobit model is controversial because of its problems of bias [45], and one aspect is the regression used as endogenously which is related to the explaining variables and input or output variables. If the correlativity existed, it would lead to the inconsistency in the estimator in the second stage [46]. The other aspect is the sample selection. Thus, Simar and Wilson [45] argued that compared with the Tobit model, the truncated and bootstrap truncated regressions are relatively unbiased.
In this study, the result will not lead to bias and inconsistent estimated results as the independent variables are irrelevant both to the variables used in the first stage and to the environmental efficiency scores, the sample selection in this paper is thus not random. As such, we could use the Tobit regression and the bootstrap truncated regression model as reference.
The function is written as follows:
y i * = i + β X i + ε i , i = 1 , 2 , ... n
y i = { y i * , y i * > 0 0 , y i * 0
where y i is the SBM efficiency score of the ith DMU.
In Equation (5), y i * is the latent variable, X i is the vector of independent variables, and β represents the vector unknown parameter, which measures the relationship between the independent variables and the latent variables. ε i is the stochastic error of the ith DMU, which complies with normal distribution ( ε i ~ N ( 0 , σ 2 ) ).

3.3. Sampling and Variables Description

The sample used in this study is from BvD database [47]. There are 27 listed Chinese cement companies in the database. For 10 of these companies, cement production is not their core business, and one company has merged with another firm. Therefore, we have selected 16 firms and the data collection covers 2008–2013 (the period of data coverage depended on data availability.).
The market share of these 16 listed cement firms in the whole cement sector in China is 13.54% in 2013 [48],the amount of clinker production from the 16 firms is divided by the total amount of clinker production from the sector in 2013). However, because the cement industry is a decentralized sector in China with mostly small factories whose data are difficult to access, it can be argued that our samples represent large scale Chinese cement companies employing advanced production techniques and management approaches. From our data analysis results, one can infer that the environmental efficiency for many small scale cement factories in China should be much lower than that in our sample companies.
With regard to the variables used, three inputs and five outputs (one desirable and four undesirable outputs) are included.
Input indexes. The input indexes are capital (proxy by annual total assets), labor (proxy by numbers of employees) and energy (proxy by energy consumption). The first two are considered as non-energy input variables and the last one is an energy input variable. Capital and labor inputs were collected from BvD database but energy consumption data are missing in the database. We thus calculated it using comparable comprehensive energy consumption criteria, which is regulated in GB16780-2007 [49]. We took 128 kgce/t as the criteria set by Tianjin Cement Industry Design and Research Institute Co., LTD., China Building Materials Science Research Institute and Hefei Cement Research and Design Institute in 2008. The formula is below:
E C = C P × C C E C
where EC is energy consumption, CP is the clinker production and CCEC (the comparable comprehensive energy consumption of clinker) is the energy consumption of per ton clinker production, which converts various energy into the comprehensive energy consumption of standard coal. The unit is kg of standard coal/ton (kgce/t). The energy consumption index includes all types of energy, such as coal, electricity, oil, etc.
Output indexes. As to the outputs index, the desirable output index is clinker production capacity, which is the proxy of the enterprise’s production capacity. It is collected from China cement web [48]. Considering the characteristics of cement industry, four undesirable outputs are included: carbon emission, SO2 emission, NOX emission and dust waste. These undesirable outputs are not available directly.
We therefore calculated the carbon emission following the BFSM (bottom-up factory-level sampling method), referring to the guidance in the 2006 IPCC [50]. Guidelines for National Greenhouse Gas Inventories and CBMA (China Building Material Academy) [51]. Cement emissions constitute of direct emissions and indirect emissions. Unlike previous methods, BFSM takes indirect emissions into consideration. Direct emissions are mainly from cement production process including fossil fuel combustion and calcium carbonate calcinations. Because coal and electricity are the main fossil fuels of the cement industry in China, the direct emissions account for almost 90% of all emissions [52]. The indirect emissions are those from raw material transportation and electrical motors and facilities.
The other three undesirable outputs are air pollutants produced by the clinker production. The emission factors adopted follow those used by Wang et al. [53]. The coefficients of SO2, NOX and dust waste are 0.4 kg/ton of clinker, 1.26 kg/ton of clinker and 0.15 kg/ton of clinker. The emission factors’ coefficients are estimated based on National Bureau of Statistics of China [54], emission regulations [55] and technical parameters [56].
Table 1 describes the means and standard deviation of the input and output variables used in the model of 2008 to 2013. It suggests that the absolute amount of inputs and the desirable output are increasing year by year. The growth rates are varied with the decrease since 2011 and a sharp decline in 2012. This indicates that the growth of cement manufacturers slows down in line with GDP growth in the same period. Furthermore, the large standard deviation in Table 1 shows that differences exist among the DMUs. The high standard deviation values result from the listed enterprises’ production disequilibrium. The growth rate of clinker production has been slowing down, which might attribute to the increasingly severe environmental limits and environmental protection consciousness.
In the next section, we set out the two stages of data analysis.

4. Results and Discussion

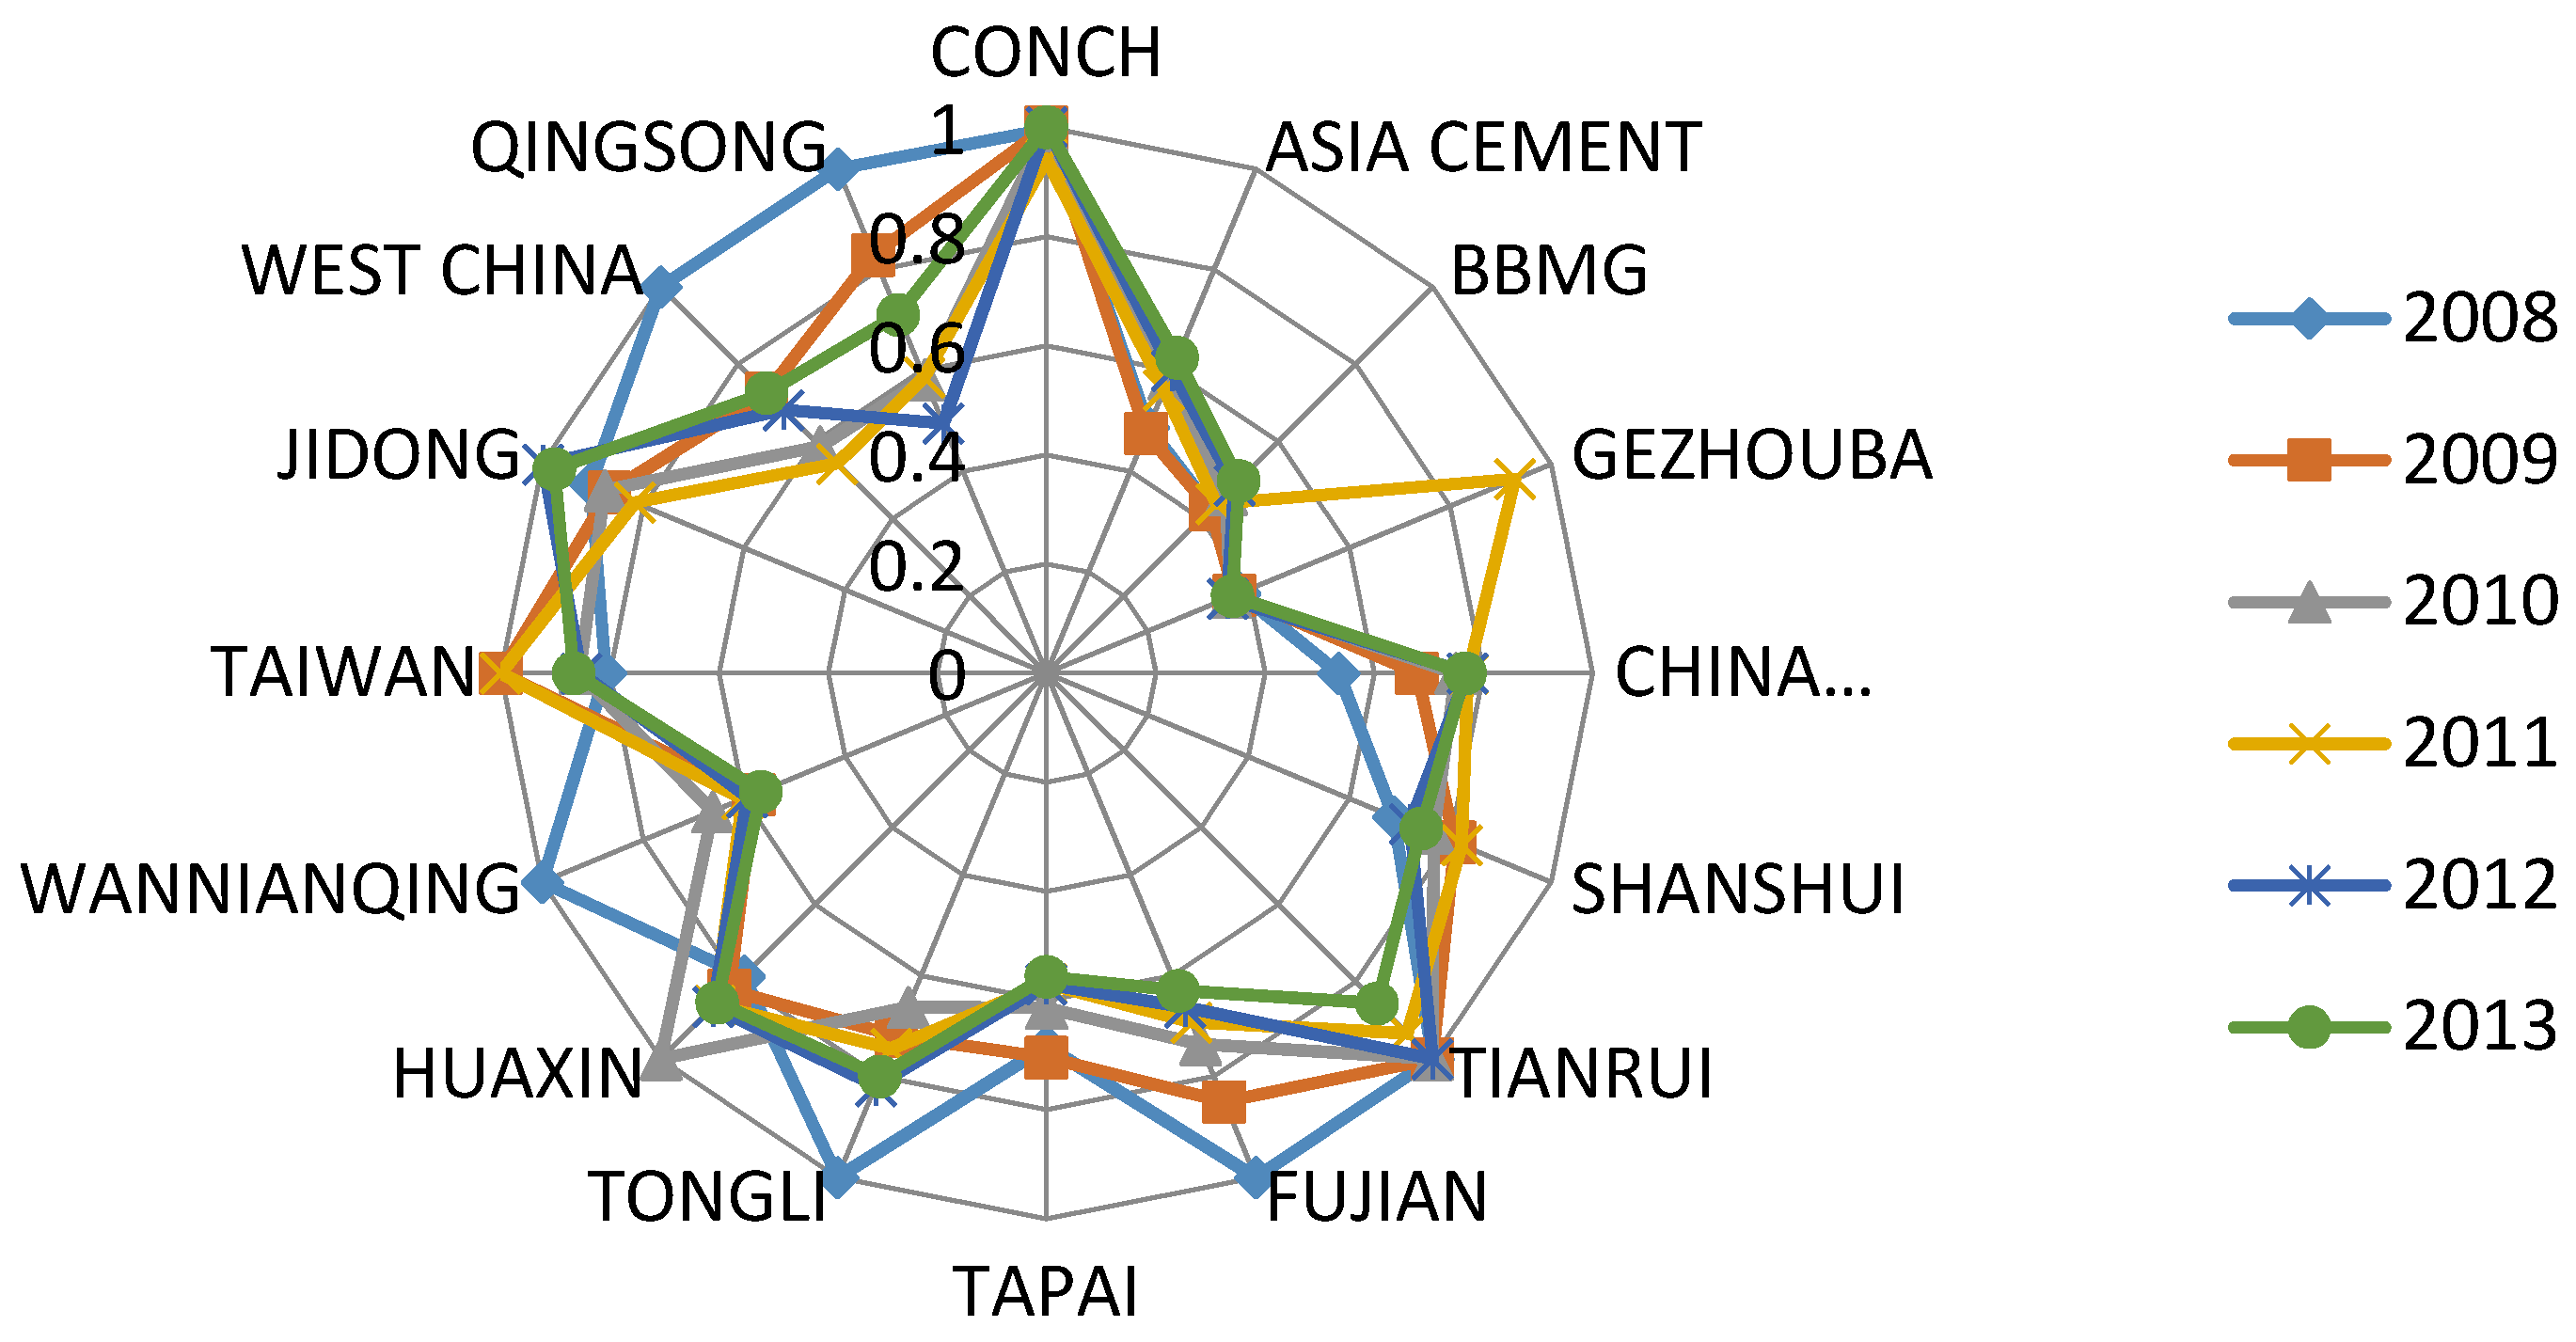
4.1. Environmental Efficiency of Sample Firms

In the first stage of the analysis, we estimate and compare the environmental efficiency of the 16 listed cement companies in China for strong and weak disposability, respectively. Strong disposability means the desirable outputs can be enlarged unlimitedly and the undesirable outputs could be unfettered decreases. Conversely weak disposability means that the production process is restricted by the technology level, production conditions and other limitations. The undesirable outputs cannot be reduced without limitation, and they are related to the desirable outputs.
The 16 listed cement enterprises include Anhui Conch Cement Ltd. (CONCH) (Wuhu, China), Asia Cement Corporation (ASIA CEMENT) (Taiwan), BBMG Corporation (BBMG) (Beijing, China), China Gezhouba Group Ltd. (GEZHOUBA) (Wuhan, China), China Resources Cement Holdings Limited (CHINA RESOURCES) (Hong Kong, China), China Shanshui Cement Group Ltd. (SHANSHUI) (Wuhu, China), China Tianrui Group Cement Ltd. (TIANRUI) (Hong Kong, China), Fujian Cement Ltd. (FUJIAN) (Fuzhou, China), Guangdong Tapai Group Ltd. (TAPAI) (Shanghai, China), Henan Tongli CementLtd. (TONGLI) (Shanghai, China), Huaxin Cement Ltd. (HUAXIN) (Huangshi, China), Jiangxi Wannianqing Cement Ltd. (WANNIANQING) (Nanchang, China), Taiwan Cement Corporation (TAIWAN) (Taiwan), Tangshang Jidong Cement Ltd. (JIDONG) (Tangshan, China), West China Cement Ltd. (WEST CHINA) (Hong Kong, China), and Xinjiang Qingsong Building Materials & Chemicals (GP) Ltd. (QINGSONG) (Akesu, China).
The results measured by Matlab R2013b (MathWorks, Natick, MA, USA) are shown in Table 2.
Table 2 suggests that for each DMU, the difference between the results of strong and weak disposability is very small. As per the hypothesis of weak disposability, the production process is restricted by techniques and other production related factors. The small gap might be caused by the government’s strict regulations in CO2 emission forcing companies to adopt advanced technology and improve production procedure to reduce energy consumption. In recent years, Chinese government has made great efforts on tightening regulations and policies in the cement sector in order to reduce industry pollution. For example, two initiatives were launched in 2006, one is “Cement Industry Development Policy” [57] and the other is “Special Planning for Cement Industry Development” [58]. The first policy aims to abandon backward production capacity and the second regulation has led to the closure and merger of many small cement plants, which produce serious environmental pollution and resource destruction. These policies might put significant pressures on cement companies to upgrade technology and invest in advanced production equipment. Results here might suggest that these regulations and policies have had positive impacts on environmental efficiency in the sector.
The average mean of environmental efficiency in the final row with the strong disposability is 0.74360 and with weak disposability is 0.73841 (lower than the former). This is because the undesirable outputs could reduce freely under the strong disposability hypothesis. However, under the current production technology conditions, weak disposability hypothesis may be more rational because carbon emission is restricted by production to a certain extent under the present production conditions. When carbon capture technology can be achieved to recycle pollution completely, the strong disposability would be more persuasive. As such, we mainly analyze environmental efficiency for weak disposability below.
From Table 2, it can be observed that in terms of weak disposability, the average mean of the environmental efficiency for the sample cement enterprises ranges between 0.71710 (in 2012) and 0.79344 (in 2008) with a decrease trend in 2009 and 2012. If looking at individual enterprises in 2012, the lowest efficiency rate is −0.35829 for GEZHOUBA and the highest is 1 for TIANRUI; similarly in 2008, the lowest is for GEZHOUBA with the value of 0.38325 and the highest for TIANRUI is still 1. The findings indicate that a significant imbalance in environmental efficiency exists in the cement sector. We thus use a Radar Chart (see Figure 1) for a further investigation of the environmental efficiency trend for all sample companies.
Figure 1 shows the trend development of the environmental efficiency of the 16 listed cement companies from 2008 to 2013. We can see that 10 companies stayed in a position during this period (i.e., CONCH, ASIA CEMENT, BBMG, CHINA RESOURCES, SHANSHUI, TIANRUI, TAPAI, HUAXIN, TAIWAN, and JIDONG) with little fluctuation in their environmental efficiency, however six firms were quite unstable in the environmental efficiency during the same period and some even experienced shocks (e.g., GEZHOUBA, QINGSONG, WEST CHINA, WANNIANQING and FUJIAN).
In order to understand the differences between these companies over this period, we have gathered relevant information from multiple sources including the Environment and Social Responsibility Reports for these companies, cement industry webpages and local government news relating to the specific firms [59,60,61]. After an analysis of the information, we concluded the main reasons to improve the environmental efficiency for these firms in certain year(s) include investing in pollution monitor (e.g., GEZHOUBA in 2011) and advanced production line (e.g., WESTCHINA in 2012 and 2013 and TONGLI in 2008), and collaborating with researchers in universities in improving pollution reduction system (e.g., TONGLI from 2010). The reasons for CONCH and TIANRUI keeping better environmental efficiency with 0.98860 and 0.96515, respectively, are they invested significant amounts of money in infrastructure for energy conservation and environmental protection (e.g., CONCH infrastructure costs almost 40% of total investment), and took part in cement sustainability initiative (CSI) to accelerate progress toward sustainable development (e.g., TIANRUI in 2009). In contrast, the causes of a sharp drop in environmental efficiency can be tracked to mergers or restructuring (e.g., FUJIAN in 2013) in some companies, which led to production expanding considerably but without the same improvements in environmental efficiency (e.g., QINGSONG in 2010 and WANNIANQING in 2009).

4.2. Influential Factor Analysis

The second stage of the analysis is to explore influential factors affecting the environmental efficiency of the 16 listed cement companies.
The explanatory variables of environmental efficiency for factory/firm level are mainly about the enterprise character related (e.g., ownership, scale, age, location, etc.), operation related (e.g., value, profit, etc.), research related (e.g., patent, R&D investment, research labor, etc.), environment related (e.g., government regulation, environmental subsidy, environmental investment, etc.) [3,61].
As our study is conducted at firm level, with the consideration of data availability, we finalized the influential factors (referring to the summary above) for the second stage of analysis, as shown in Table 3.
We define the function as follows:
E E i t = 0 + 1 E S i t + + 2 ln ( P R O F I T ) i t + 3 S T A T E i t + 4 P i t + 5 l n ( F Q Z L ) i t + ε i t
where t represents the year, i means the ith listed cement enterprise, EEit refers to the environmental efficiency of ith enterprise in the tth year, and 0, 1,…, 5 is unknown parameters. Symbols on the right side are the corresponding influencing factors of the ith enterprise in the tth year. εit is the stochastic error term obeying independent and distributed normal model.
The descriptive statistical analysis of these potential influential factors is shown in Table 4. From the table, we can observe:
(1)
Enterprises scale (ES) is uneven varied from 0.0855 to 5.3629, which indicates the production decentralization of cement industry in China, though the market share of sample is relatively low.
(2)
The profit range of these firms is reasonable.
(3)
The disparity of patents is large, which suggests big differences existed in terms of technology (R&D) innovation among these cement firms.
(4)
The comparatively small disparity (SD = 0.841823) of FQZL indicates the intensity of local industrial waste emission control is similar; in other word, the government regulations are covered well in China.
Furthermore, in the following regression analysis, taking the environmental efficiency estimated by SBM model in the first stage of the analysis (in Section 4.1) as the dependent variables, and the influential factors in Table 4 as the independent (explanatory) variables, we use the Tobit model and the bootstrap truncation regression to estimate and the result is presented in Table 5. It depicts the coefficient, standard error, Z-value, p-value, log likelihood statistics, and Wald chi-square value.
The results in Table 5 suggest that these identified influential factors have strong impact on the environmental efficiency of the 16 listed cement companies. An in-depth discussion for each factor would be helpful to understand the reasons behind the results linking to Chinese context and extant literature.

4.2.1. Impact of Enterprise Scale

Enterprise scale can play a significant role in the improvement of environmental efficiency and the reduction of pollutants. Larger firms have comparatively more resources to invest in advanced equipment, technologies and skilled technicians. Furthermore, the Chinese government has implemented a policy “Promoting large and shutting down small” for cement companies to tackle pollution in the sector. Emission trade system (ETS) pilots were built in 2013, initially included heavy pollutant large cement companies. These policy initiatives and measurements suggest that larger enterprises have to bear much more pressure from the government and public than small firms to take social responsibilities by complying with relevant regulations and policies on energy conservation and emissions reduction. In other words, larger pollutant firms have more motives to pursue the goals of environmental efficiency improvement than small and medium companies to maintain a good public image, otherwise they will be criticized from the media, public and possibly subject to government fines.
The result in Table 5 suggests that ES has positive influence on environmental efficiency with statistical significance at 1% level. On the condition of other factors remaining unchanged and the market share of the firm increasing by 1%, the environmental efficiency will increase by 0.18072 in random Tobit regression and by 0.15102 in bootstrap truncation regression. The result is consistent with Li [11].

4.2.2. Impact of Earning Ability

The relationship between cement company profit and environmental efficiency is normally reported to be negative in the literature. As Long [19] argued that the expansion in cement production is often at the expense of the increase of carbon dioxide emission and pollution. In particular, if cement firms are purely concerned about pursuing profit target and do not take a balanced approach to improving energy efficiency simultaneously, the gap is even bigger. Our estimation in Table 5 suggests that the enterprise earning ability coefficient is negative with statistical significance, indicating that higher profits would lead environmental efficiency to decline. On the condition that the increase of the proportion of lnPROFIT by 1% and controlling other factors, the environmental efficiency will decrease by 0.08429 unit in random Tobit regression and by 0.07511 unit in bootstrap truncation regression respectively. The result supports the study of Long et al. [21].

4.2.3. Impact of Ownership Structure

There is a debate about whether state-owned enterprises are more economically efficient than private companies. State-owned firms are commonly observed to be less efficient than private ones because of their hierarchal structure and bureaucracy in management. Additionally, in China, state-owned enterprises are generally associated with government intervention, centralized decision making, and uncertain property rights. Obviously these features can be barriers to fast adoption of advanced equipment and technology to improve environmental efficiency. Table 5 presents that the ownership structure has a negative effect on environmental efficiency. Specifically, if the state-owned share increases by 1%, the environmental efficiency of the sample cement companies will decrease by an average of 0.09804 in Tobit regression with statistical significance at 5% level and by 0.08984 in bootstrap truncated regression at 1% significance level. The result agrees with the finding in Li et al. [13].

4.2.4. Impact of Patent (R&D)

Technology innovation can improve production and reduce costs. Spending on research and development (R&D) should enhance operational and environmental efficiency from reducing energy consumption and pollutant emissions. In our study, patent is used to proxy technology innovation (R&D cost) and the estimation shows in Table 5 that if holding other variables, when patent increases by 1 unit, the environmental efficiency of the sample cement companies will increase by 0.00062 in Tobit model and by 0.00095 in bootstrap truncated regression. However, their values are not statistically significant. The possible reasons can be explained from three aspects. Firstly, patent can only be roughly used to proxy R&D but not an accurate measurement. Secondly, the types of these chosen patents may not completely relate to the techniques in energy conservation and carbon mitigation. Thirdly, there should be a lag effect, which suggests the outcomes from applying current patent technology can only be achieved perhaps after a number of years.

4.2.5. Impact of Government Regulations

In the last decade, the Chinese government has taken a serious attitude towards promulgating national laws and regulations to tackle environmental issues. For example, in 2007, “The Environmental Protection Verification of Listed Company Guidance” was issued, applying to all listed companies for thermal power, steel, cement, and electrolytic aluminum industries. In 2010, the Ministry of Industry and Information Technology of China further proposed the specific measures in emission reduction including low carbon technology research, improving mechanisms for energy conservation and emissions reduction, etc. Regional/provincial and local authorities also set their own policies to monitor environmental protection verification for listed companies that are heavy polluters. For instance, Fujian provincial government required a technical transformation scheme to be carried out in the cement industry to reduce energy emissions and improve energy efficiency; while in Shandong province, cement industry air pollutants emission standards are published.
In this study, the government’s environmental investment is used to represent governmental support through regulations and policies. The estimation result in Table 5 reveals that the relationship between this factor and the environmental efficiency of the listed cement enterprises is positive and also statistically significant. If the government’s control investment increases by 1% and other variables remain fixed, the environmental efficiency of the sample cement companies will increase by an average of 0.04559 in Tobit regression and by 0.87994 in bootstrap truncated regression at 5% significance level. The result means that the government’s investment in industrial gas treatment is vital to the improvement of environmental efficiency in the sector. This is accordance with the expectation.
Thus far, we have examined environmental efficiency for listed cement companies and have explored and discussed what factors influence the environmental efficiency of these firms. In the next section, the conclusions, limitations and implications will be set out.

5. Conclusion and Policy Implication

The cement industry is one of the targeted sectors to achieve ambitious goals in reducing energy consumption and environmental pollution by the Chinese government in “The Eleventh-Five Plan” (2006–2010) and “The Twelfth-Five Plan” (2011–2015). After a decade effort, it is meaningful to assess the impact of this national strategy. This paper estimated the environmental efficiency of 16 listed cement enterprises from 2008 to 2013 by applying a slack based model in data envelopment analysis. We found that despite the average of environmental efficiency ranging from 0.7 to 0.80 during the investigation period, a significant imbalance in environmental efficiency is observed in the sample firms, with the lowest value being around 0.35 and the highest value being around 1. Moreover, a number of companies experienced sharp increases or decreases in environmental efficiency.
This paper identifies that the enterprise scale and ownership are the main factors influencing environmental efficiency in Chinese cement companies and the findings are explained as follows:
Enterprise scale: Enterprise scale is significantly associated with environmental efficiency with larger firms being more efficient than smaller ones. It proves the government’s policy of promoting large firms and shutting down small factories in the cement industry to reduce pollution is the right strategy. The policy should continue. (2) Earning abilities: Enterprise earning ability is negatively linked to environmental efficiency, suggesting higher profit rate is normally a compromise of energy efficiency. This means that the listed cement enterprises have not achieved a good balance between profitability and their social responsibility of pollution reduction. (3) Ownership: State-owned cement companies are generally less efficient than private firms. This might suggest the state-owned status gave these enterprises a superior position and therefore they do not take environmental protection as serious as private firms. (4) Technology innovations: Patent count is insignificant. (5) Government’s regulations: The more the government invests in controlling the cement sector’s energy pollution, the higher the general environmental efficiency of the sector would be.
It is expected that the recent “Paris Agreement” reached 12 December 2015 will force the Chinese government to adopt much tougher measures and actions to tackle carbon emissions and improve the environmental efficiency of polluting sectors. A number of policy implications can be summarized based on our research findings: Firstly, scale effect is critical for Chinese cement sector and thus the government should not only intend to shut down small firms with low environmental efficiency but also encourage mergers with and restructured by high efficient large enterprises in the industry. Cement enterprises should also positively promote accelerating production concentration. Secondly, cement enterprises should make a balance between short term profitability and long term environmental protection, and invest more in pollution protection and monitoring to fulfill their social responsibility. Thirdly, as the result indicated, state-owned cement enterprises do not perform well in environmental efficiency and therefore the government should reduce its direct control, intervention on these cement enterprises. It may be a good strategy for cement sector to attract some foreign investment to bring advanced technology and management and as well as increase in competitions in the sector. Fourthly, as the result shown that the government relevant regulations have played positive roles on this matter, the government should strengthen legislations and transparent polices in the implementation of relevant regulations in this field (e.g., emission trade system and taxes have been proved being effective method to limit the carbon emission and improve the environmental efficiency). Furthermore, different companies may have different requests relating to environmental efficiency, thus government’s policies should also consider this diversity.
As with other studies, this research has identified a number of limitations. Firstly, the representativeness of the sample is limited to listed cement firms, and it is difficult to access data from smaller companies. Secondly, the time period of the study is comparatively short, again another example of a data availability issue. Thirdly, the accuracy of measurement is somewhat questionable, e.g., patent numbers to represent R&D and innovation and government environmental control investment to represent government regulations. The results might only tell part of the story. Despite these limitations, this paper makes an important contribution to the study of the environmental efficiency of listed cement enterprises in China.

Acknowledgments

The authors would like to thank the financial support provided by the National Natural Science Foundation of China (Grant Nos. 71420107025 and 71273022) and the Social Science Foundation of Beijing (Grant No. 15ZDA49).

Author Contributions

Fang Zhang designed the main stages in the research, conducted the empirical analysis and wrote the paper. Hong Fang supervised the whole process. Junjie Wu revised the paper. Damian Ward polished the paper. All authors read and approved the final manuscript.

Conflicts of Interest

The authors declare no conflict of interest.

References

  1. BP (British Petroleum). BP Statistical Review of World Energy, July 2015. Available online: http://www.bp.com/en/global/corporate/energy-economics/statistical-review-of-world-energy.html (accessed on 31 July 2015).
  2. USGS (U.S. Geological Survey). Mineral Commodity Summaries, January 2015. Available online: http://minerals.usgs.gov/minerals/pubs/commodity/cement/mcs-2015-cemen.pdf (accessed on 31 July 15).
  3. Effect Of Cement Production On The Environment And Its Environmental Protection Measures. Available online: http://wenku.baidu.com/link?url=-79VIOapUaT9Ut-lYS2ioX5aSCUd0L5gV7FPzixtXuF7qV9aDop4kN4TWeLg6fK9NyXV2SVSUsAPOLvTl7Q4DZuxX9SChym4AiL3I0B1LMC (accessed on 22 April 2016). (In Chinese)
  4. Western Cement Website. Available online: http://www.xbsn.com/news/shuinishijiao/2016-03-11/14814.html (accessed on 22 April 2016). (in Chinese).
  5. Zhou, P.; Poh, K.L.; Ang, B.W. A non-radial DEA approach to measuring environmental performance. Eur. J. Oper. Res. 2007, 178, 1–9. [Google Scholar] [CrossRef]
  6. Du, L.; Mao, J. Estimating the environmental efficiency and marginal CO2 abatement cost of coal-fired power plants in China. Energy Policy 2015, 85, 347–356. [Google Scholar] [CrossRef]
  7. Zhou, Y.; Xing, X.; Fang, K.; Liang, D.; Xu, C. Environmental efficiency analysis of power industry in China based on an entropy SBM model. Energy Policy 2013, 57, 68–75. [Google Scholar] [CrossRef]
  8. Watanabe, M.; Tanaka, K. Efficiency analysis of Chinese industry: A directional distance function approach. Energy Policy 2007, 35, 6323–6331. [Google Scholar] [CrossRef]
  9. Woo, C.; Chung, Y.; Chun, D.; Seo, H.; Hong, S. The static and dynamic environmental efficiency of renewable energy: A Malmquist index analysis of OECD countries. Renew. Sustain. Energy Rev. 2015, 47, 367–376. [Google Scholar] [CrossRef]
  10. Wang, K.; Wei, Y.M. China’s regional industrial energy efficiency and carbon emissions abatement costs. Appl. Energy 2014, 130, 617–631. [Google Scholar] [CrossRef]
  11. Li, H.; Shi, J.F. Energy efficiency analysis on Chinese industrial sectors: An improved Super-SBM model with undesirable outputs. J. Clean. Prod. 2014, 65, 97–107. [Google Scholar] [CrossRef]
  12. Bi, G.B.; Song, W.; Zhou, P.; Liang, L. Does environmental regulation affect energy efficiency in China’s thermal power generation? Empirical evidence from a slacks-based DEA model. Energy Policy 2014, 66, 537–546. [Google Scholar] [CrossRef]
  13. Li, H.; Fang, K.; Yang, W.; Wang, D.; Hong, X. Regional environmental efficiency evaluation in China: Analysis based on the Super-SBM model with undesirable outputs. Math. Comput. Model. 2013, 58, 1018–1031. [Google Scholar] [CrossRef]
  14. Lin, B.; Yang, L. Efficiency effect of changing investment structure on China’s power industry. Renew. Sustain. Energy Rev. 2014, 39, 403–411. [Google Scholar] [CrossRef]
  15. Costa-Campi, M.T.; García-Quevedo, J.; Segarra, A. Energy efficiency determinants: An empirical analysis of Spanish innovative firms. Energy Policy 2015, 83, 229–239. [Google Scholar] [CrossRef]
  16. Hasanbeigi, A.; Morrow, W.; Masanet, E.; Sathaye, J.; Xu, T. Energy efficiency improvement and CO2 emission reduction opportunities in the cement industry in China. Energy Policy 2013, 57, 287–297. [Google Scholar] [CrossRef]
  17. Ke, J.; Zheng, N.; Price, L.; Fridley, D.; Zhou, N. Potential energy savings and CO2 emissions reduction of China’s cement industry. Energy Policy 2012, 45, 739–751. [Google Scholar] [CrossRef]
  18. Xu, J.H.; Fleiter, T.; Eichhammer, W.; Fan, Y. Energy consumption and CO2 emissions in China’s cement industry: A perspective from LMDI decomposition analysis. Energy Policy 2012, 50, 821–832. [Google Scholar] [CrossRef]
  19. Lei, Y.; Zhang, Q.; Nielsen, C.; He, K. An inventory of primary air pollutants and CO 2 emissions from cement production in China, 1990–2020. Atmos. Environ. 2011, 45, 147–154. [Google Scholar] [CrossRef]
  20. Mandal, S.K.; Madheswaran, S. Environmental efficiency of the Indian cement industry: An interstate analysis. Energy Policy 2010, 38, 1108–1118. [Google Scholar] [CrossRef]
  21. Long, X.; Zhao, X.; Cheng, F. The comparison analysis of total factor productivity and eco-efficiency in China’s cement manufactures. Energy Policy 2015, 81, 61–66. [Google Scholar] [CrossRef]
  22. Mandal, S.K. Do undesirable output and environmental regulation matter in energy efficiency analysis? Evidence from Indian Cement Industry. Energy Policy 2010, 38, 6076–6083. [Google Scholar] [CrossRef]
  23. Oggioni, G.; Riccardi, R.; Toninelli, R. Eco-efficiency of the world cement industry: A data envelopment analysis. Energy Policy 2011, 39, 2842–2854. [Google Scholar] [CrossRef] [Green Version]
  24. Riccardi, R.; Oggioni, G.; Toninelli, R. Efficiency analysis of world cement industry in presence of undesirable output: Application of data envelopment analysis and directional distance function. Energy Policy 2012, 44, 140–152. [Google Scholar] [CrossRef]
  25. Telle, K.; Larsson, J. Do environmental regulations hamper productivity growth? How accounting for improvements of plants’ environmental performance can change the conclusion. Ecol. Econ. 2007, 61, 438–445. [Google Scholar] [CrossRef]
  26. Charnes, A.; Cooper, W.W.; Rhodes, E. Measuring the efficiency of decision making units. Eur. J. Oper. Res. 1978, 2, 429–444. [Google Scholar] [CrossRef]
  27. Hailu, A.; Veeman, T.S. Non-parametric Productivity Analysis with Undesirable Outputs: An Application to the Canadian Pulp and Paper Industry. Am. J. Agric. Econ. 2001, 83, 605–616. [Google Scholar] [CrossRef]
  28. Seiford, L.M.; Zhu, J. Modeling undesirable factors in efficiency evaluation. Eur. J. Oper. Res. 2002, 142, 16–20. [Google Scholar] [CrossRef]
  29. Golany, B.; Roll, Y. An application procedure for DEA. Omega 1989, 17, 237–250. [Google Scholar] [CrossRef]
  30. Cook, W.D.; Green, R.H. Evaluating power plant efficiency: A hierarchical model. Comput. Oper. Res. 2005, 32, 813–823. [Google Scholar] [CrossRef]
  31. Färe, R.; Grosskopfand, S.; Pasurka, C. The effect of environmental regulations on the efficiency of electric utilities: 1969 versus 1975. Appl. Econ. 1989, 21, 225–235. [Google Scholar] [CrossRef]
  32. Färe, R.; Pasurka, C. Multilateral Productivity Comparisons When Some Outputs Are Undesirable: A Nonparametric Approach. Rev. Econ. Stat. 1989, 71, 90–98. [Google Scholar] [CrossRef]
  33. Cuesta, R.A.; Lovell, C.A.; Zofío, J.L. Environmental efficiency measurement with translog distance functions: A parametric approach. Ecol. Econ. 2009, 68, 2232–2242. [Google Scholar] [CrossRef]
  34. Zaim, O.; Taskin, F. A Kuznets curve in environmental efficiency: An application on OECD countries. Environ. Resour. Econ. 2000, 17, 21–36. [Google Scholar] [CrossRef]
  35. Zhou, P.; Ang, B.W.; Poh, K.L. Measuring environmental performance under different environmental DEA technologies. Energy Economics 2008, 30, 1–14. [Google Scholar] [CrossRef]
  36. Managi, S.; Kaneko, S. Environmental performance and returns to pollution abatement in China. Ecol. Econ. 2009, 68, 1643–1651. [Google Scholar] [CrossRef]
  37. Murty, M.N.; Kumar, S.; Dhavala, K.K. Measuring environmental efficiency of industry: A case study of thermal power generation in India. Environ. Resour. Econ. 2007, 38, 31–50. [Google Scholar] [CrossRef] [Green Version]
  38. Yuan, P.; Cheng, S.; Sun, J.; Liang, W. Measuring the environmental efficiency of the Chinese industrial sector: A directional distance function approach. Math. Comput. Model. 2013, 58, 936–947. [Google Scholar] [CrossRef]
  39. Tone, K. A slacks-based measure of super-efficiency in data envelopment analysis. Eur. J. Oper. Res. 2002, 143, 32–41. [Google Scholar] [CrossRef]
  40. Apergis, N.; Aye, G.C.; Barros, C.P.; Gupta, R.; Wanke, P. Energy efficiency of selected OECD countries: A slacks based model with undesirable outputs. Energy Econ. 2015, 51, 45–53. [Google Scholar] [CrossRef]
  41. Song, M.; Song, Y.; An, Q.; Yu, H. Review of environmental efficiency and its influencing factors in China: 1998–2009. Renew. Sustain. Energy Rev. 2013, 20, 8–14. [Google Scholar] [CrossRef]
  42. Cooper, W.W.; Seiford, L.M.; Tone, K. Data Envelopment Analysis: A Comprehensive Text with Models, Applications, References and DEA-Solver Software; Springer Science & Business Media: Berlin, Germany, 2007. [Google Scholar]
  43. Zhang, N.; Choi, Y. Environmental energy efficiency of China’s regional economies: A non-oriented slacks-based measure analysis. Soc. Sci. J. 2013, 50, 225–234. [Google Scholar] [CrossRef]
  44. Chang, Y.T.; Park, H.S.; Jeong, J.B.; Lee, J.W. Evaluating economic and environmental efficiency of global airlines: A SBM-DEA approach. Transp. Res. Part D Transp. Environ. 2014, 27, 46–50. [Google Scholar] [CrossRef]
  45. Simar, L.; Wilson, P.W. Estimation and inference in two-stage, semi-parametric models ofproduction processes. J. Econom. 2007, 136, 31–64. [Google Scholar] [CrossRef]
  46. Çelen, A. Efficiency and productivity (TFP) of the Turkish electricity distribution companies: An application of two-stage (DEA&Tobit) analysis. Energy Policy 2013, 63, 300–310. [Google Scholar]
  47. BvD Database (Bureau van Dijk, Switzerland). Available online: http://www.bvdinfo. com/en-gb/home (accessed on 28 March 2015).
  48. China Cement Web. Available online: http://www.ccement.com (accessed on 28 March 2015).
  49. GB16780–2007. Cement Unit Product Energy Consumption Quota. Available online: http://www.zbgb.org/2/StandardDetail479020.htm (accessed on 28 March 2015).
  50. IPCC. The Intergovernmental Panel on Climate Change. Available online: http://www.ipcc-nggip.iges.or.jp/public/2006gl/pdf/3_Volume3/V3_2_Ch2_Mineral_Industry.pdf (accessed on 28 March 2015).
  51. Shen, L.; Gao, T.; Zhao, J.; Wang, L.; Wang, L.; Liu, L.; Chen, F.; Xue, J. Factory-level measurements on CO2 emission factors of cement production in China. Renew. Sustain. Energy Rev. 2014, 34, 337–349. [Google Scholar] [CrossRef]
  52. Van Oss, H.G.; Padovani, A.C. Cement manufacture and the environment-Part I: Chemistry and technology. J. Ind. Ecology 2002, 6, 89–106. [Google Scholar]
  53. Wang, W.; Jiang, D.; Chen, D.; Chen, Z.; Zhou, W.; Zhu, B. A Material Flow Analysis (MFA)-based potential analysis of eco-efficiency indicators of China’s cement and cement-based materials industry. J. Clean. Prod. 2015, 112, 787–796. [Google Scholar] [CrossRef]
  54. National Bureau of Statistics of China Bulletin of the First Pollution Source Census (2010). Available online: http://www.stats.gov.cn/tjsj/tjgb/qttjgb/qgqttjgb/201002/t20100211_30641.html (accessed on 20 April 2016).
  55. Emission Standards of Cement Industry. 2004. Available online: http://kjs.mep.gov.cn/hjbhbz/bzwb/dqhjbh/dqgdwrywrwpfbz/201312/t20131227_265765.htm (accessed on 20 April 2016).
  56. Gao, C.M. NOX emissions and denitration strength of cement industry in China. Cem. Eng. 2011, 4, 1–2. (In Chinese) [Google Scholar]
  57. National Development and Reform Commission (NDRC). 2006. Available online: http://www.ndrc.gov.cn/fzgggz/flfg/flgz/201507/t20150701_710518.html (accessed on 1 October 2015).
  58. National Development and Reform Commission (NDRC). 2006. Available online: http://gys.ndrc.gov.cn/gyfz/200610/t20061019_793887.html (accessed on 1 October 2015).
  59. China Cement Web. Available online: http://www.ccement.com/zhuanti/2013paihang/ (accessed on 28 March 2015).
  60. Western Cement Website. Available online: http://www.xbsn.com/ (accessed on 18 October 2015).
  61. Low Carbon Industry Website. Available online: http://www.tangongye.com/ (accessed on 18 October 2015).
  62. State Intellectual Property Office of the People’s Republic of China. Available online: http://www.sipo.gov.cn/zljsfl/ (accessed on 28 March 2015).
Figure 1. Environmental efficiency trend of listed cement companies in China during 2008–2013.
Sustainability 08 00453 g001
Table 1. Data description.
InputDesirable OutputUndesirable Output
Assets (1000 usd)Employee (No.)Energy Consumption (kgce)Production (10000 ton)Carbon Emission (10000 ton)SO2 Emission (10 ton) NOx Emission (10 ton)Dust Emission (10 ton)
2008Mean2,504,4708726.8131,960,000,0001534.981818.7996613.99251934.076230.2472
SD2,328,5408940.5752,240,000,0001753.086935.1427701.23462208.889262.963
2009Mean3,271,08910,134.812,590,000,0002021.7621078.462808.7052547.421303.2644
SD2,768,1139746.022,600,000,0002034.6821085.353813.87292563.699305.2023
2010Mean4,537,01811,965.193,290,000,0002569.9621370.8861027.9853238.153385.4944
SD3,920,98510,885.73,130,000,0002446.6661305.117978.666630822.8366.9999
2011Mean6,138,79414,070.383,920,000,0003059.5061632.0211223.8023854.978458.9259
SD5,334,29312,916.264,070,000,0003177.1831694.7941270.8734003.251476.5775
2012Mean6,790,23914,695.444,440,000,0003469.0691850.4931387.6274371.027520.3603
SD5,773,87413,106.154,620,000,0003610.0751925.711444.034548.695541.5113
2013Mean7,600,51714,975.634,720,000,0003684.6411965.4851473.8564642.647552.6961
SD6,605,49413,256.844,730,000,0003694.4541970.7191477.7814655.012554.168
Table 2. Strong disposability and weak disposability.
200820092010201120122013
WEAKSTRONGWEAKSTRONGWEAKSTRONGWEAKSTRONGWEAKSTRONGWEAKSTRONG
CONCH0.996030.99603110.99420.994150.9413811111
ASIA CEMENT0.48720.48720.475620.475620.584030.584030.561280.561310.599230.599290.625460.62546
BBMG0.425440.425440.425290.427720.464710.464710.438990.438990.486790.486790.497930.49571
GEZHOUBA0.383250.395240.372680.575990.363910.363910.928660.928660.358290.358290.369110.36911
CHINA RESOURCES0.534450.534450.678420.88680.749160.749160.771410.771410.77070.77070.766220.76622
SHANSHUI0.687570.687570.808950.808950.767130.775260.823110.7640.720130.720120.742770.74277
TIANRUI1111110.934370.93437110.856380.92768
FUJIAN110.849910.849910.736370.736370.69260.69260.662750.647980.62940.78766
TAPAI0.683910.683910.704390.704390.613850.613850.568670.568670.569470.569470.556180.55618
TONGLI110.719810.719810.662310.662370.744230.744230.818090.818090.799280.79928
HUAXIN0.784880.784880.821750.821750.999970.873060.860950.860950.864860.864860.853930.85393
WANNIANQING110.580950.580950.663060.663060.60280.60280.59360.59360.566850.56685
TAIWAN0.807660.80766110.856090.8560910.872990.852960.852960.866680.86668
JIDONG0.904580.904580.866850.86780.876180.876180.816990.858410.998990.998690.976120.97612
WEST CHINA110.725230.725230.587760.600620.543540.543540.682340.682340.726110.72611
QINGSONG110.829110.829110.582840.582840.586290.66620.495360.466620.710590.71059
Average0.793440.794190.741190.7671270.718850.712230.738450.738070.717100.714360.721440.73565
Table 3. Definition of explanatory variables (influential factors) used.
Explanatory VariablesAbbreviationMeasurementExpected
Enterprises scale (percentage)ESRatio of clinker output of the firm in cement industry+
Earning ability (1000 USD)PROFITProfit of the firm+/−
Equity structureSTATEDummy variable, 1 for SOE, 0 others+/−
R&D and innovationPPatent applications+
Environmental control investment (1000 USD)FQZLLocal industrial waste gas emission+
Note: (1) PROFIT and FQZL calculated at 2005 constant. (2) ES and PROFT collected from BvD database. (3) STATE collected from individual firm financial statements. (4) Patent application is used to proxy R&D and innovation which include invention patents, utility patents and appearance design, collected manually from the State Intellectual Property Office of the People’s Republic of China Website [62]. (5) Cement industry is monitored by its waste gas emission by respective government department. We therefore use local industrial waste gas emission as the proxy of government regulation intervention. (6) Expected column means the expected impact of different variables on environmental efficiency. “+” means positive influence, “−” means negative influence, and “+/−” means unsure.
Table 4. Descriptive statistics of explanatory variables (influential factors).
MeanSDMinMax
EE0.738410.191040.358291
ES1.0759711.0902990.08555.3629
ln(PROFIT)11.595851.4395516.73679714.63804
STATE0.43750.49868301
P5.48958314.337290101
ln(FQZL)13.389740.84182311.2449614.82983
Note: 1. ln(PROFIT): the natural logarithm of PROFIT. 2. ln(FQZL): the natural logarithm of FQZL.
Table 5. Result of regression.
Random TobitBootstrap truncation
ES0.18072 ***0.15102 ***
8.857.71
Ln(PROFIT)−0.08429 ***−0.07511 **
−6.42−5.45
STATE−0.09804 **−0.08984 ***
−3.20−2.81
P0.000620.00095
0.610.95
Ln(FQZL)0.04559 **0.04462 **
2.392.13
cons0.96094 **0.87994 **
3.102.37
Log likelihood31.4440462.47649
Wald chi2(5)114.19127
Note: 400 replications are used for bootstrap truncated model. * p < 0.1; ** p < 0.05; *** p < 0.01.

