Article

Achieving a Carbon Neutral Society without Industry Contraction in the Five Major Steel Producing Countries

1
Materials Science and Engineering, Yonsei University, Seoul 120-749, Korea
2
Graduate School of Frontier Sciences, The University of Tokyo, Chiba 277-8561, Japan
3
Yonsei Green Institute of Technology, Yonsei University, Seoul 120-749, Korea
*
Authors to whom correspondence should be addressed.
These authors contribute equally to this work.
Sustainability 2016, 8(5), 484; https://0-doi-org.brum.beds.ac.uk/10.3390/su8050484
Submission received: 12 April 2016 / Revised: 9 May 2016 / Accepted: 11 May 2016 / Published: 17 May 2016

Abstract

:
This study analyzed the direct and indirect CO2 emissions of the energy-intensive basic metals industry, in particular steels, using the distributions of various energy sources, including coal/peat, oil, and electricity, from an input–output table. An analysis of five major steel producing countries indicated that direct CO2 emissions increased 1.4-fold and that indirect CO2 emissions increased by more than two-fold between 1995 and 2010. The elasticity of the CO2 emissions and the total energy costs indicated that Korea, Japan, and Germany are sensitive to energy sources from the electric power industry, whereas China and the US are more sensitive to energy sources pertaining to the coal and oil industry. Using the available forest area and photosynthesis, the potential neutralization ability of CO2 was estimated using the eco-CO2 index. The US yielded the highest CO2 neutralization ability of 66.1%, whereas Korea yielded a CO2 neutralization ability of 15%. Future trends of the 2030 eco-CO2 index revealed China and Korea will rapidly lose their neutralization ability resulting in a net negative neutralization ability if left unabated. The significant decline in the eco-CO2 index for the basic metals industry may be inhibited by utilizing bamboo wood charcoal for pulverized coal injection (PCI) in the steelmaking process.

Graphical Abstract

1. Introduction

With the occurrence of unusual weather variations, natural disasters, and other sudden atmospheric catastrophes, which correlate with the increased emissions of greenhouse gases [1], there has been wide scrutiny by the international community to regulate the CO2 emissions [2,3]. CO2 emissions from 1990 to 2000 have increased more than ten times [4]. Because recent issues regarding the output of CO2 are expected to affect not only the natural environment but also the business environment, international effort is underway to reduce the total amount of greenhouse gas (GHG) emissions. Within the Kyoto Protocol, an agreement regarding the level of CO2 abatement for member countries, which is dependent on the degree of economic development, has attempted to enforce regulations for actual reductions in the total output of GHG. One hundred eithy-three signatories in 2008 agreed to lower the GHG produced from the use of coal, oil, and other hydrocarbon fuels [5]. Furthermore, some countries, including Korea and Norway, have implemented carbon emission trading schemes that exceed environmental regulations, which impact the economic cost structure of manufacturing industries. Thus, this study attempts to correlate the industry and CO2 emissions with a focus on the basic metals industry and, in particular, the steel industry, which is known to be one of the highest emitters of GHGs and consumers of energy.
The basic metals industry is the backbone of the construction, equipment, shipbuilding, and automotive industries. This industry uses multi-functional properties to provide structural support and satisfy the specific needs of consumers. In addition, steel technology development can also increase the competitiveness of affiliated industries that rely on steel materials. Thus, the steel and metals industry is considered to have a high upstream and downstream linkage effect. The facilities and production of the steel and metals industry has increased due to global economic expansion that has resulted in steel production capacities of over 1.6 billion tons in 2015 [6]. This significant increase in production capacity and steel utilization can have a positive influence on society because it creates capital value and leads to higher employment. However, the amounts of energy consumed and GHGs that are emitted during steel manufacturing also have negative implications to society, which will need to be balanced for continued sustainability. The CO2 emissions from the steel industry are generated from the blast furnace operation, where reactions between iron ore and carbon occur. Thus, recent technology developments including CO2 top gas recycling, carbon capture and storage, and hydrogen utilization to lower GHG within the blast furnace have been actively studied and implemented [7,8].
The steel and metals industry is dependent on raw materials, including ores, scrap, fossil fuels, such as coke, fluxing agents of limestone, and electrical energy. High temperatures (i.e., greater than 1823 K (1550 °C)) are needed to sustain the kinetics of the reaction. This energy dependence causes significant direct and indirect CO2 emissions. Two main commercial process routes exist for steel production: the blast furnace (BF) route and the electric arc furnace (EAF) route. The BF route is heavily dependent on fossil fuel-based energy sources, which primarily generate direct emissions, whereas the EAF route is based on scrap and electricity, which primarily generate indirect emissions. For example, the industry in China primarily uses the BF route, which constitutes 91.2% of domestic steel production; thus, direct CO2 emissions to the atmosphere are significant. Industry in Japan also tends to use the BF route but also produces steel through the EAF route, which constitutes 22.5% of domestic steel production; thus, direct and indirect CO2 emissions must be accounted for. By contrast, approximately 75% of the steel in Turkey is produced through the EAF route, which suggests that indirect CO2 emissions are significant [9].
Energy-related CO2 emissions correlated to international trade have been actively pursued by several researchers. Su and Ang discussed a multi-regional model for large countries such as China, where regional discrepancies existed depending on the development level and suggested climate policies of input and output trade to consider the regional differences [10]. Feedback effects were also considered in another work by Su and Ang [11]. Li et al. studied the CO2 emissions in China’s iron and steel industry based on the input–output life cycle analysis suggesting improvements in the coal blending technology to increase the efficiency of the energy usage [12]. Several other works have presented analysis on the GHG intensity using input–output datasets of the respective countries [13,14,15]. To the knowledge of the present authors, a comparative analysis of the five major steel producing countries have yet to be done and verification of available and reliable datasets with the official statistics bureau of the individual countries are limited.
In this study, the amount of direct and indirect CO2 emissions by the basic metals-producing countries, including Korea, China, USA, Japan, and Germany, have been analyzed using the input–output table. The above-mentioned countries are the Top 5 steel producers with a cumulative 68% of the global steel production in 2014. China, Japan, USA, Korea, and Germany produce 49%, 7%, 5%, 4%, and 3% of the global steel, respectively [9]. Although Russia in 2014 did produce slightly higher amounts of steel than Korea, past data for Russia were incomplete and unreliable, thus Russia was excluded within this study. The steel industry is considered to be one of the largest emitting industries of CO2 and has been chosen as the reference to compare other industries through the input–output table. In addition, this study aimed to indirectly identify the potential impact of the technological efforts the steel industry has made and will make with lowering CO2 emissions and in the mid to long term be utilized in providing valuable data for carbon emissions trading policies.
The steel and metals industry has one of the highest inter-industry relations index and is one of the largest emitters of GHGs, which makes it a logical choice for analysis. In addition, the arc elasticity analysis of the CO2 emissions, with regard to energy input, has been estimated to relate the sensitivity of the CO2 emissions to the total cost of the input energy sources. In addition, an eco-CO2 index that considers the neutralizing capabilities of the GHGs for steel-producing countries, using the available land mass of plant life with photosynthesis capabilities has been introduced. This study aims to provide a different perspective on the amount of CO2 emitted by countries using this eco-CO2 index and to better compare the accountabilities of countries with significant CO2 emissions.

2. Analysis Methods and Procedures

2.1. Input–Output Tables Data Acquisition

This study utilizes the modified input–output model from the input–output table, which was proposed by Leontief [16], and applies it to the amount of direct and indirect GHG emissions. The specific input–output table represents the interdependencies among industries and provides a quantitative index for comparison and the total industry relationships of all services and commodities. Each industry that constitutes a nation’s economy purchases intermediate goods, including raw materials and fuels, from other industry sectors and adds labor and capital to provide new commodities and services to other industries as another intermediate good or to the final consumer. In this respect, the circulation of the national economy can be identified in terms of the national income circulation, which describes the total income from its occurrence, distribution, and disposal, and the industrial circulation, which describes the overall flow of capital goods and services among the industry production sectors. The analysis is applied and compared among the five major basic metals-producing countries, namely, Korea, China, US, Japan, and Germany.
Using the relations between the various industries and the steel industry, the available input–output table of the individual countries from 1995 to 2010 at a five-year interval was employed and correlated with the CO2 emissions of the various fossil fuel sources, including coal and peat, oil, and natural gas. The input–output table was obtained from data that were retrieved from the Organization of Economic Cooperation and Development (OECD) [17]. To expand the analysis, data that were not available from the OECD from 1995 to 2010 were obtained from the individual statistics bureaus of the relevant countries [18,19,20,21,22] and conformed to the items within the OECD data [17]. Although the World input–output database (WIOD), which covers the annual dataset from 1995 to 2011 was available, verification of the dataset with the individual countries statistics bureau showed significant deviations and thus the OECD data was taken to be more reliable for this particular study [23]. The input–output table data, which were provided by the OECD, are typically divided into 37 industry sectors. However, due to the omission of data for some countries, data that were not available from the OECD were adapted from the local statistics bureaus of the respective countries, which were typically divided into 26 industry sectors. Thus, the input–output table that was utilized in this study was classified into 26 separate industry sectors, as shown in Table 1. Within the context of this work, the import assumption was based on the non-competitive import, as outlined by Su and Ang [24]. It should also be noted that industry sectors within the national input–output tables of the abovementioned countries have more than 100 classifications and according to the works of Su et al. [25] empirical studies suggest approximately 40 and above industry sectors are needed for a more accurate analysis on the CO2 emissions embodied in a particular countries exports using the input–output table. The present work is limited to the aggregated industry sector of 26 major classifications, which is lower than the 40 industry sectors specified by Su et al. [25], but the analysis and comparative data between countries should provide an informative trend and the impact of the basic metals industry with other industry sectors on the CO2 emissions.

2.2. Criteria for Evaluating the CO2 Emissions

The total amount of CO2 that was emitted by the five major industrial countries is shown in Figure 1; these emissions reflect the available data between 1995 and 2010 in five-year intervals. The total CO2 emissions from the use of various energy sources were obtained from available data from the International Energy Agency (IEA) [4]. According to the IEA, the total CO2 emissions according to the energy sources are divided into five main groups, namely, coal and peat, oil, natural gas, recycled gas, and electricity. A rapid increase in the amount of CO2 emissions in China is observed from 2000 onwards. This significant increase in CO2 emissions seems to correlate with the economic boom in China, which experienced an 8%–13% annual increase in economic growth beginning in 2000.
In this study, the CO2 emissions were first subdivided into the energy sources of coal/peat and oil, for which the direct CO2 emissions to the respective industry sectors were estimated from the distribution structure of these energy sources throughout these industry sectors. Because the CO2 emissions from recycled and natural gas were comparatively lower than the previously mentioned energy sources, they were not analyzed in this study. The “mining and quarrying (2)” industry corresponded to the production and manufacture of the energy source coal/peat, whereas the “coke, refined petroleum products and nuclear fuel (7)” sectors corresponded to the energy source oil. As shown in Figure 2, the direct emissions of each industrial sector are illustrated in (Step 1) and the indirect emissions are shown for each industrial sector in (Step 2), based on the direct emissions from the “electricity, gas and water supply (16)” sector.
T i = E D i + E I i
E D i = ( A M i t M ) × M + ( A C i t C ) × C
E I i = ( A E i t E ) × E
Symbol and detailed description used in the equations is provided in Table 2.
Next, the CO2 emission arc elasticity was calculated to identify the sensitivity of the changes in CO2 emissions to increases in the energy input. Elasticity is commonly used in economics, which provides the tendency or sensitivity of one variable to another variable. Thus, the CO2 emission arc elasticity used in this study describes the relative change in the CO2 emissions as the amount of input costs, which varies among the various energy sources. The change in CO2 emissions due to changes in the input energy cost of industry “I” according to the contributions from “mining and quarrying (2)”, “coke, refined petroleum products and nuclear fuel (7)”, and the “electricity, gas and water supply (16)” can be determined. The CO2 emission arc elasticity can be calculated using the following equation:
ε i = | ( q i , t q i , t + 1 p i , t p i , t + 1 ) × ( p i , t + p i , t + 1 q i , t + q i , t + 1 ) |
where εi is the CO2 emission arc elasticity of industry “I”, qi, t+1 is the sum of the direct and indirect CO2 emissions from industry “I” in time t + 1, qi, t is the sum of the direct and indirect CO2 emissions from industry “I” in time t, pi, t+1 is the input cost of the power industry for the “I” industry in time t + 1, and pi, t is the input cost of the power industry for the “I” industry in time t.

2.3. Evaluation Criteria of the CO2 Neutralization Ability Using the eco-CO2 Index

The neutralization capacity of CO2 from each country has been analyzed. The neutralization of CO2 is achieved by the absorption of CO2 from plant life and subsequent photosynthesis. According to the available literature, forests and plants absorb a significant amount of CO2 and re-emit oxygen via photosynthesis during the growth phases [26,27,28]. The growth and development of forest resources in each country provide a means for neutralizing the emitted CO2; a subsequent balance between plant life within each country and emissions may be able to provide sustainable industry growth. The CO2 neutralizing ability of forest resources has been estimated using statistics from the World Bank [29] for forest areas.
Next, the ratio of tree species within specific countries has been verified. According to studies of CO2 neutralization from forests [30], the tree species and age can have an effect on the degree of CO2 absorption, and on average the largest amounts of CO2 absorption are known to be for 20-year-old broad-leaf and needle-leaf trees at 16.1 tons/ha and 10 tons/ha, respectively. Various countries have different areas of forest resources, which cause differences in the ability of a particular country to neutralize CO2. Based on a report by the United Nations Food and Agriculture Organization (FAO) [31], the percentage of broad-leaf and needle-leaf trees in various continents and major countries is provided in Table 3.
In this study, the forest area was assumed to be covered with 20-year-old trees and the absorption amount of CO2 for the various countries with respect to the previously mentioned tree species was considered. Thus, the eco-CO2 index was calculated using Equation (5).
I E C O C O 2 ( i ) = [ 1 q i / f i s q i / f i ]
where I E C O C O 2 (i) is the eco-CO2 index or neutralization capacity of country “I”, fi is the total forestry area of country “I” (ha), qi is the annual total amount of CO2 emitted by country “I” (ton-CO2), and s is the amount of CO2 absorbed per 1 ha forest area (ton-CO2/ha). It should be noted that the particular tree species that are prevalent within a certain region can affect s. Thus, the I E C O C O 2 (i) for a particular country at a value of unity describes the potential for complete neutralization of its CO2 emissions. A value of zero indicates no net ability to neutralize the CO2 that is emitted within its boundary. A negative value can also be realized when the net CO2 emissions neutralization ability of the forest area is zero and the CO2 emissions substantially exceed the net neutralization ability of the forest resources.

3. Results and Discussion

3.1. Direct and Indirect CO2 Emissions
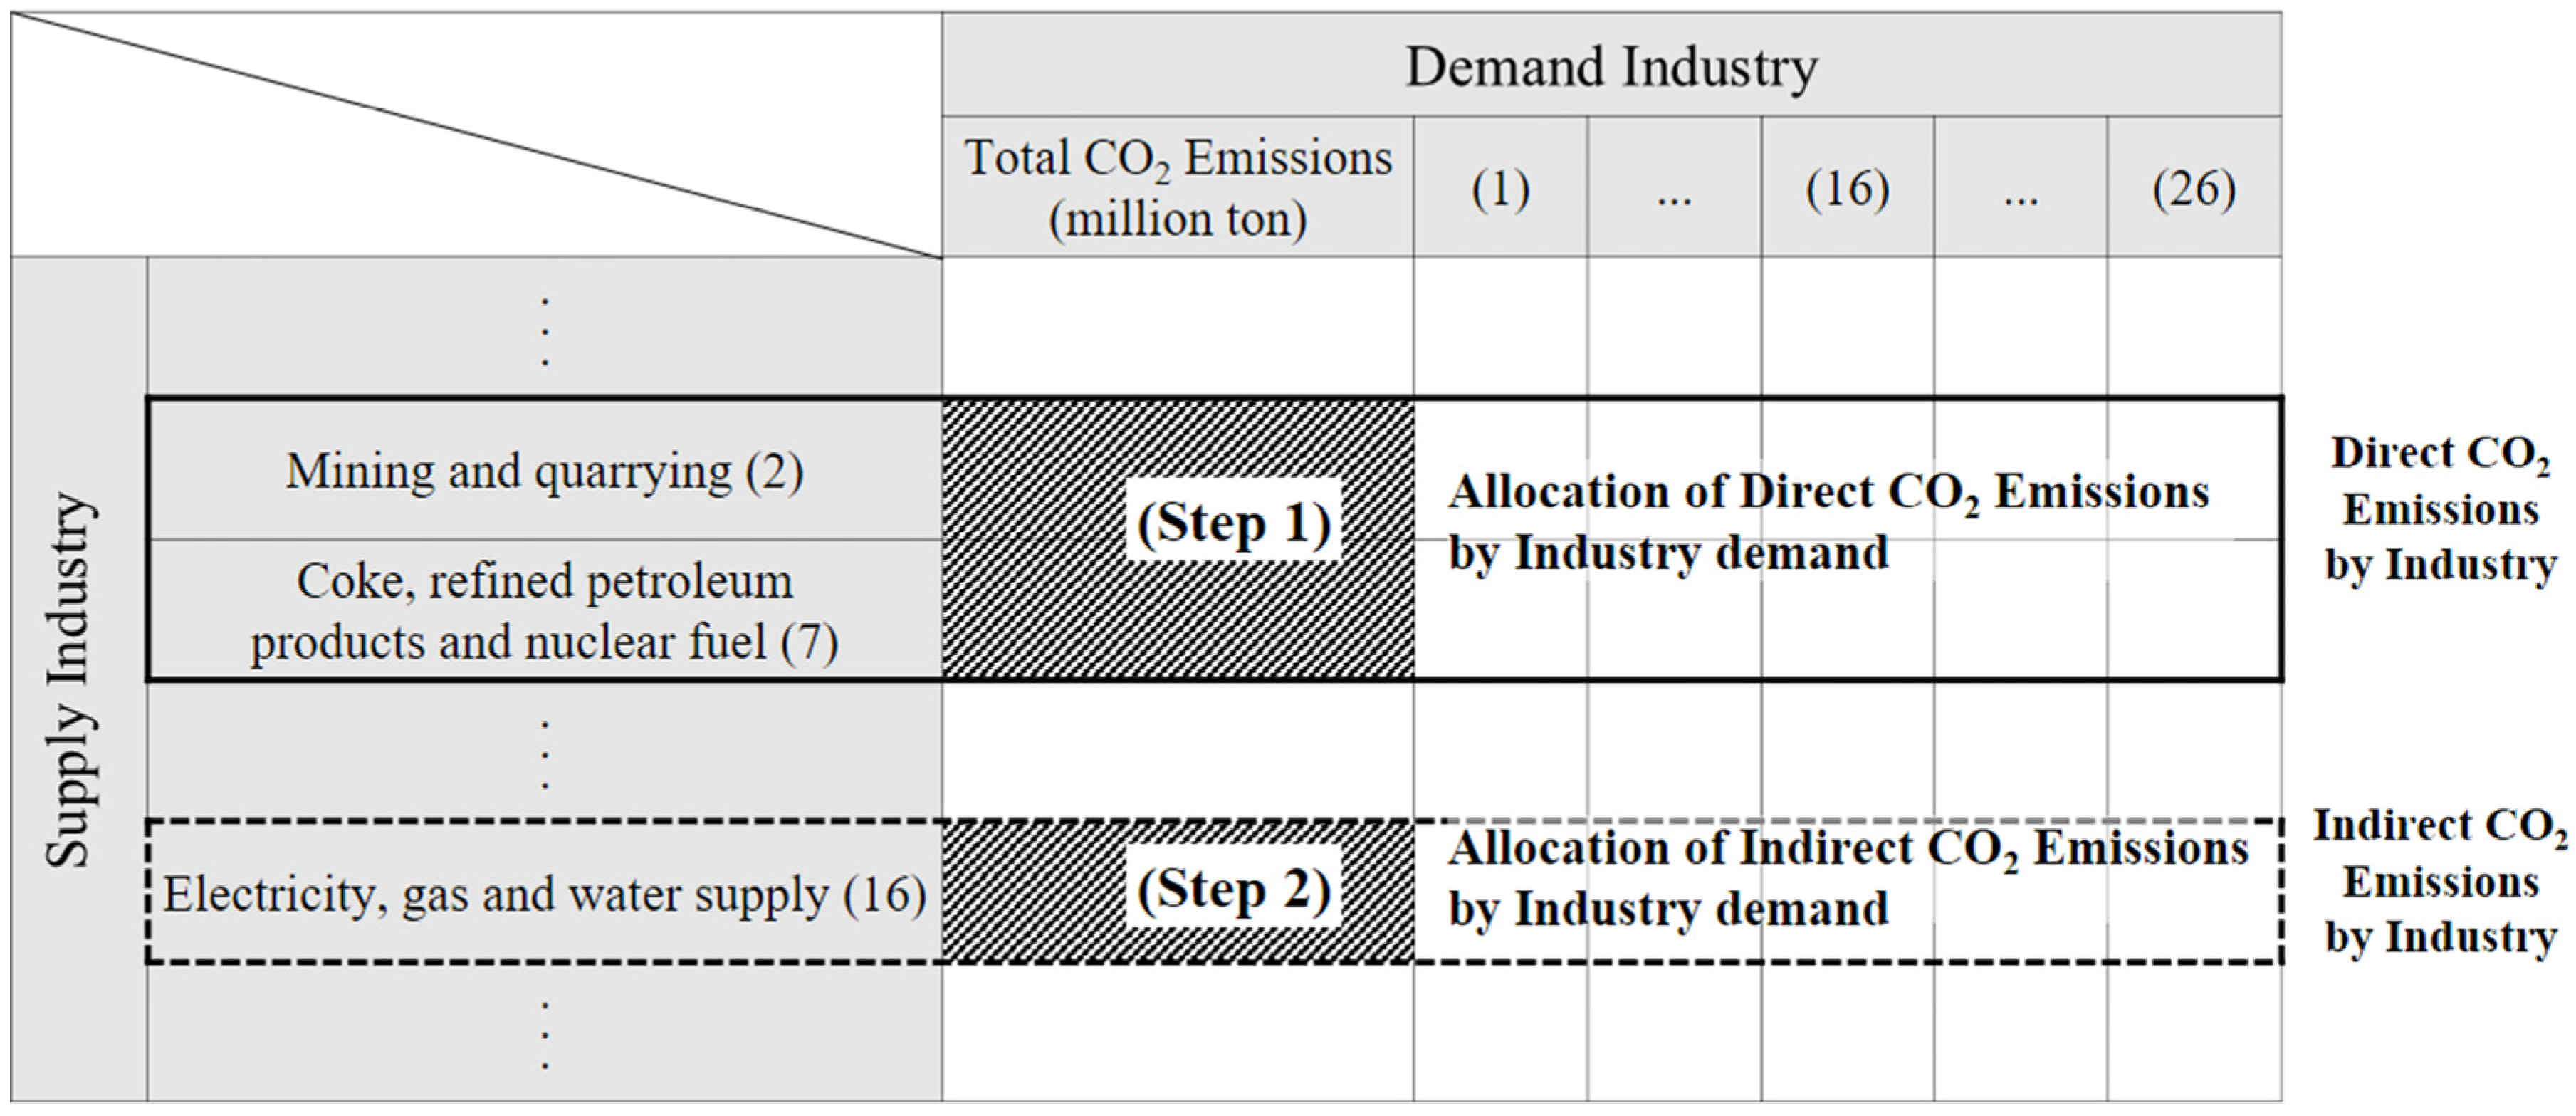
The direct CO2 emissions from each industry sector were estimated by the proportion of energy sources, such as coal/peat and oil, utilized per industry sector in the input–output table. The total amount of CO2 that is directly emitted by the “electricity, gas and water supply (16)” sector is utilized to estimate the indirect emissions of each industry sector according to the distribution of the supplied commodity of the “electricity, gas, and water supply (16)” sector across the remaining industry sectors within the input–output table, as previously described in Step 2. As a result, the top five total CO2-emitting industry sectors, including both direct and indirect emissions, have been identified in top-down order as “coke, refined petroleum products and nuclear fuel (7)”, “electricity, gas and water supply (16)”, “transport and storage (19)”, “chemicals and chemical products (8)”, and “basic metals, fabricated metal products, with the exception of machinery and equipment (11)”. If direct and indirect emissions are considered separately, the rank of direct CO2 emissions also follows the same order; however, the rank of indirect CO2 emissions was determined to be in the order of “basic metals, fabricated metal products, with the exception of machinery and equipment (11)”, “public administration and defense, compulsory social security, health and social work (25)”, “electricity, gas and water supply (16)”, “chemicals and chemical products (8)”, and “wholesale and retail trade, repairs (17)”. 
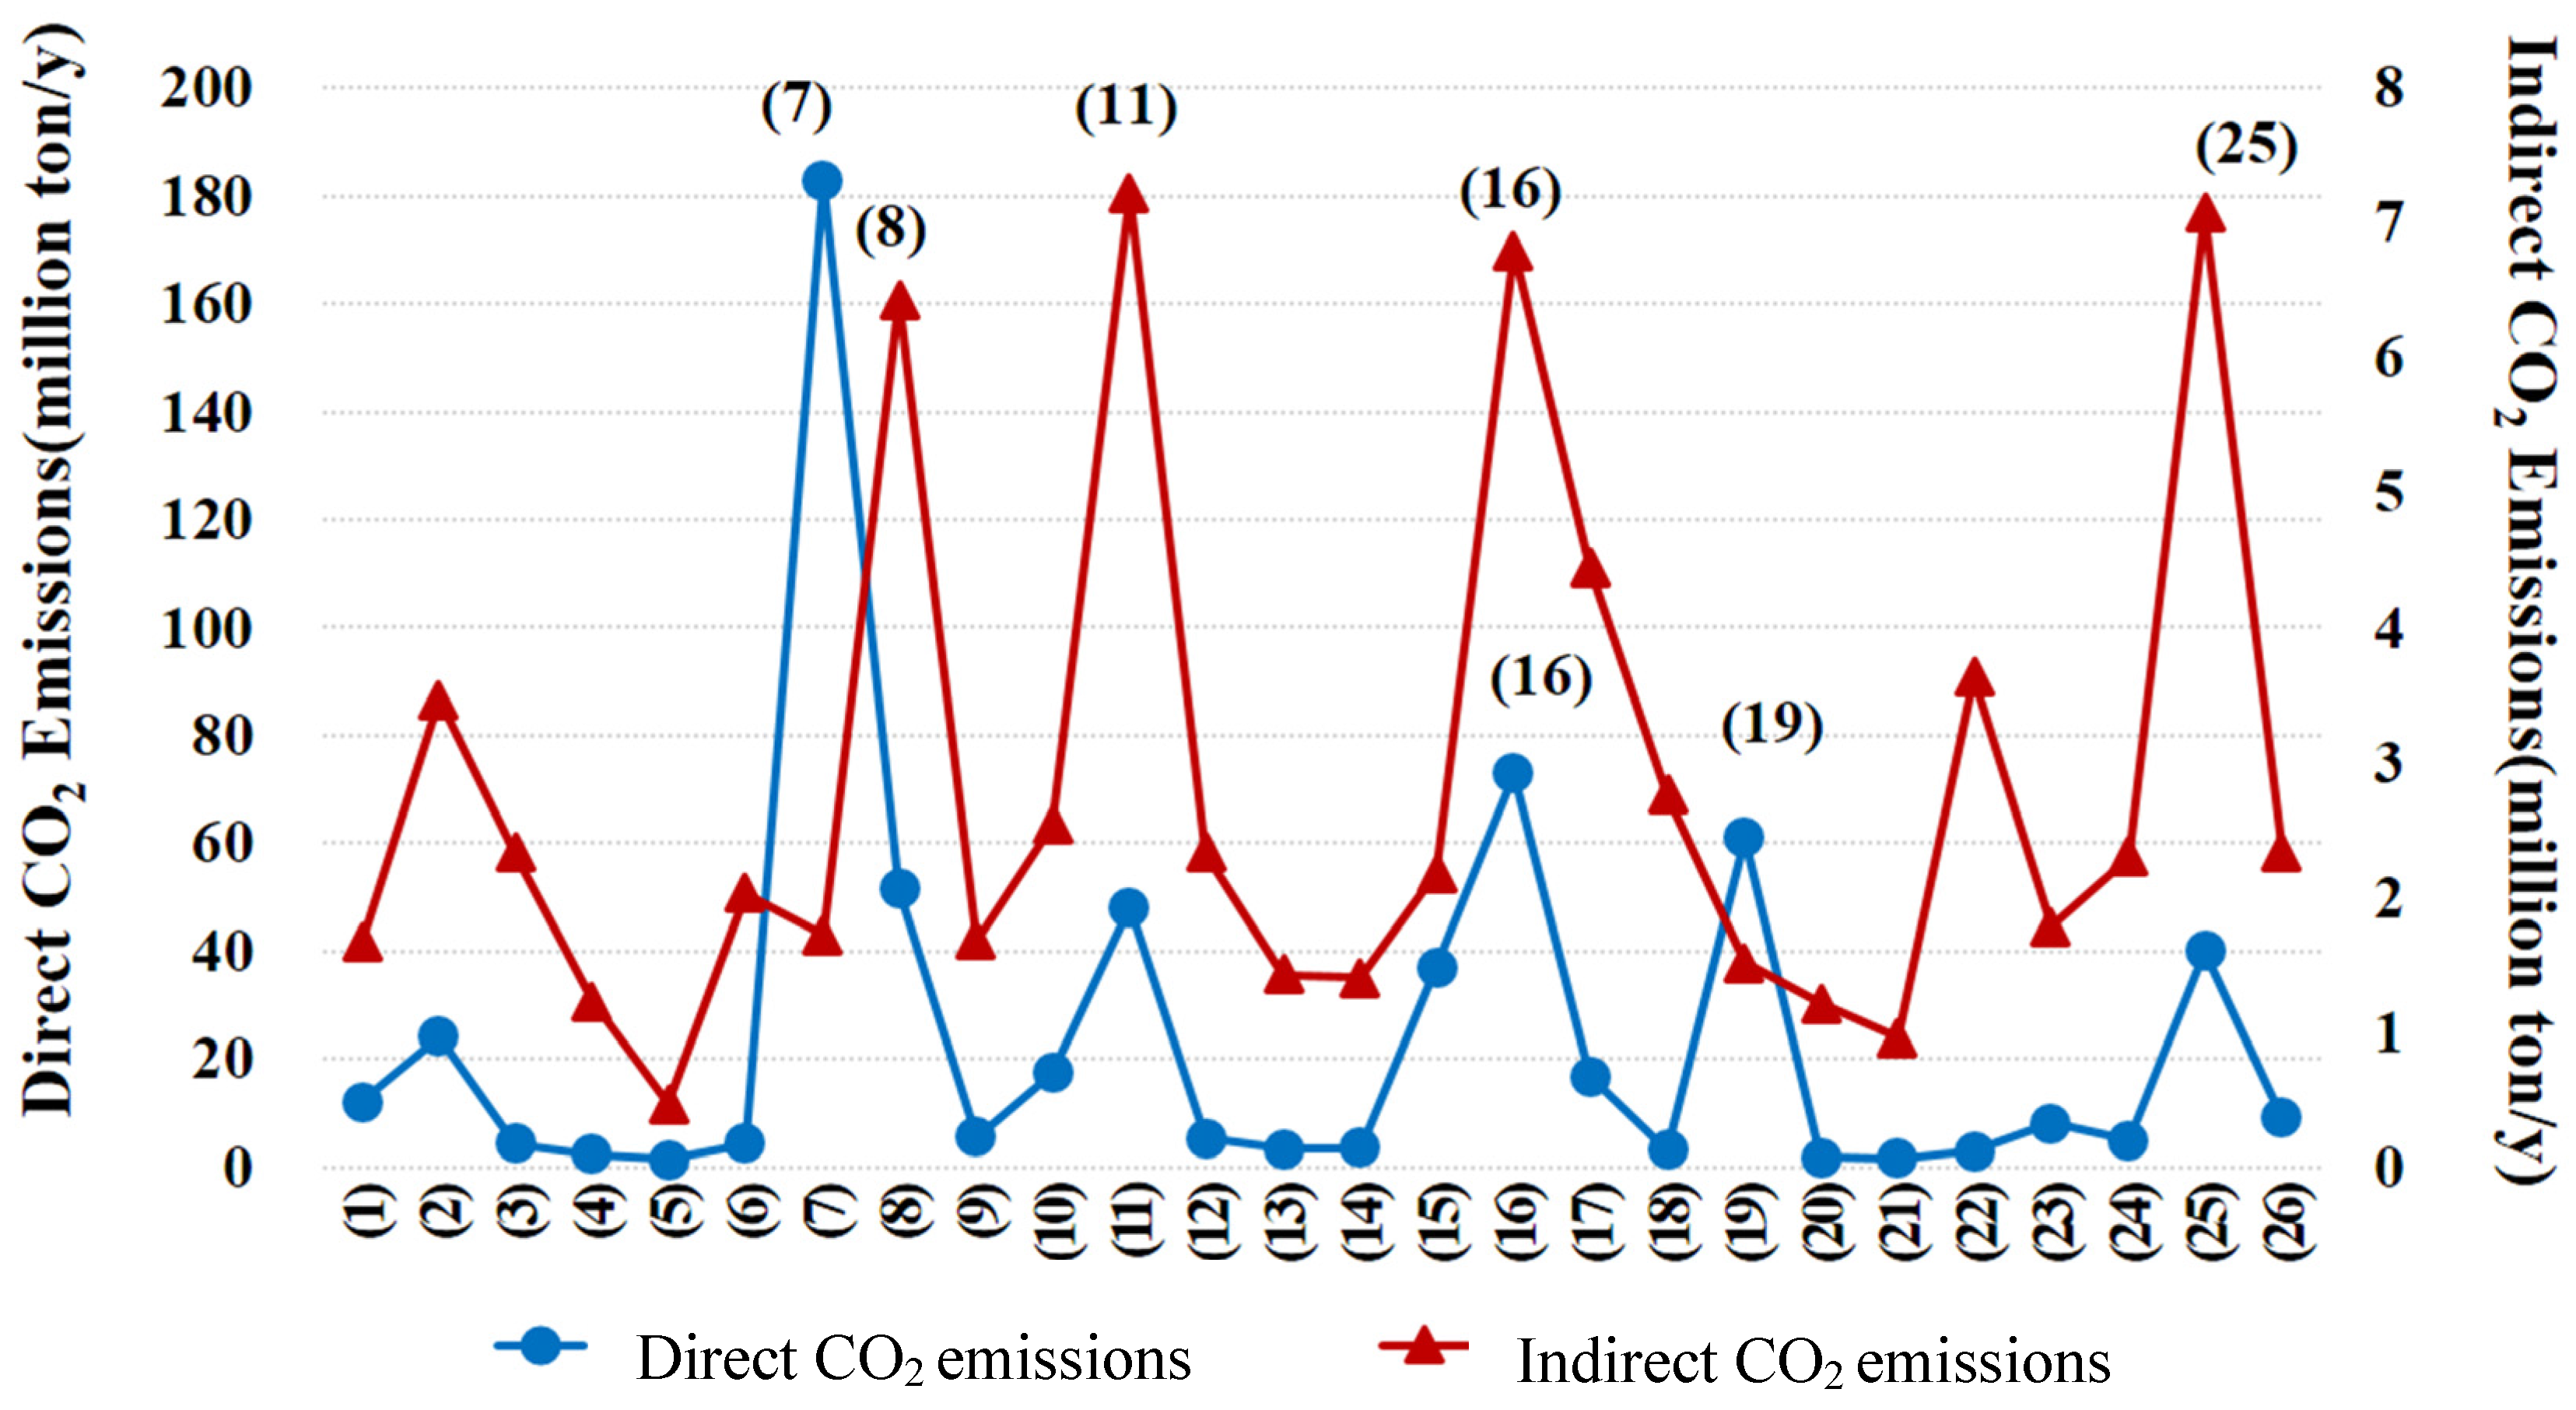
Figure 3 provides the amount of CO2 that is emitted across the industry sectors in units of million tons, which is the average value of four time series data sets, namely, 1995, 2000, 2005, and 2010.
“Public administration and defense, compulsory social security, health and social work (25)” was ranked sixth in direct CO2 emissions but was ranked second for indirect CO2 emissions. This discrepancy is attributed to the inclusion of the defense industry in this industry sector. Due to the significant defense expenditures and allocations of capital for the countries, the role of defense in the “public administration and defense, compulsory social security, health and social work (25)” industry sector is comparatively high. A large correlation value of 0.833 (p-value < 0.01) was obtained between the defense expenditure and the industry sector (25) of various countries [32]. The US demonstrated the highest level of national defense spending with USD 609.9 billion in 2014, which is 17 times the level of national defense spending in Korea (USD 36 billion) and 13 times the level of national defense spending in Japan (USD 45.8 billion) [33], and emits significant amounts of CO2 from the use of various energy sources, including jet fuel and diesel, which correspond to the “coke, refined petroleum products, and nuclear fuels (7)” industry sector.
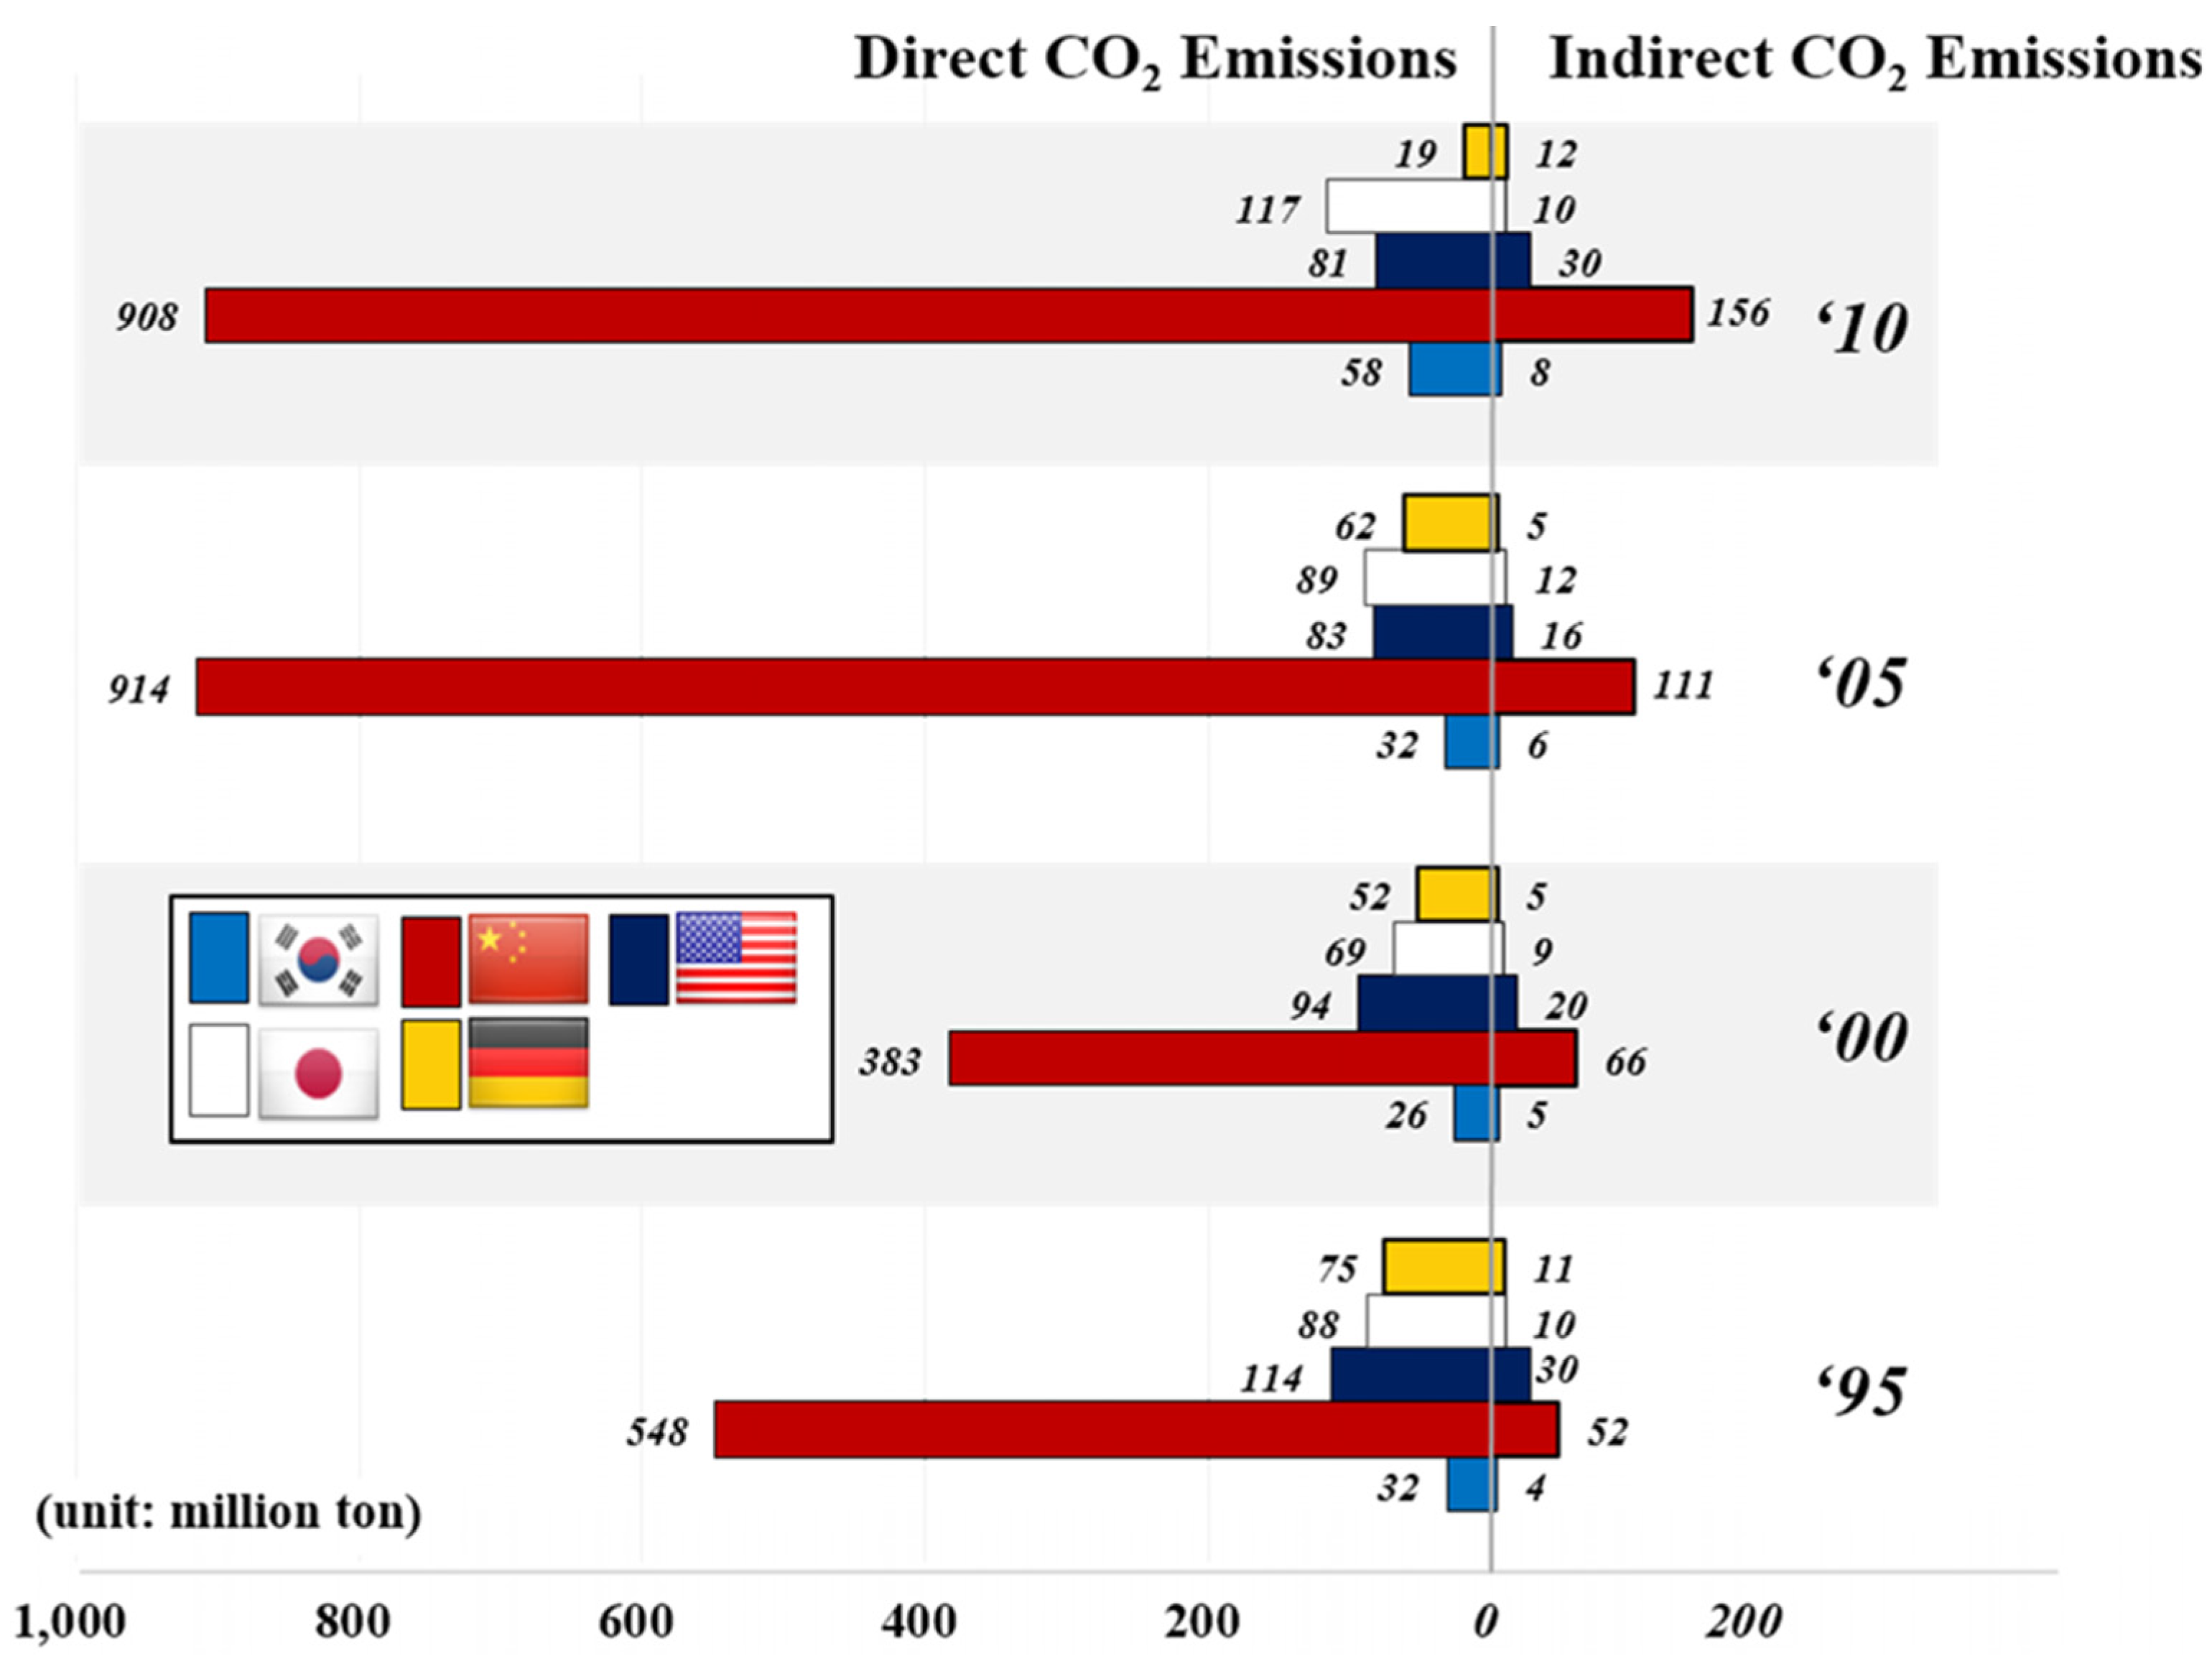
The CO2 emissions for the basic metals industry are shown in Figure 4. The direct emissions in 2010 constituted 1,183.7 million tons, which was 1.4 times the 1995 level of 856.8 million tons but which is actually lower than expected considering the increase in steel and non-ferrous metal production that the industry has observed during identical periods. The amount of indirect emissions in 2010 was 216.4 million tons, which was two times the 1995 level (107.5 million tons). The steel production in 2010 was 2.5 times the level in 1995. Production via the BF route increased 2.9 times, and production via the EAF route increased 1.6 times. The major non-ferrous metals that constitute the basic metals industry include Al, Cu, and Zn. Global Al production in 2010 totaled more than 46 million tons compared with 19 million tons in 1995, which is a 2.5-fold increase. Cu production in 2010 was more than 20 million tons, compared with 11 million in 1995, which is a 1.8-fold increase. Zn totaled more than 12 million tons in 2010 compared with seven million tons in 1995, which is a 1.8-fold increment.
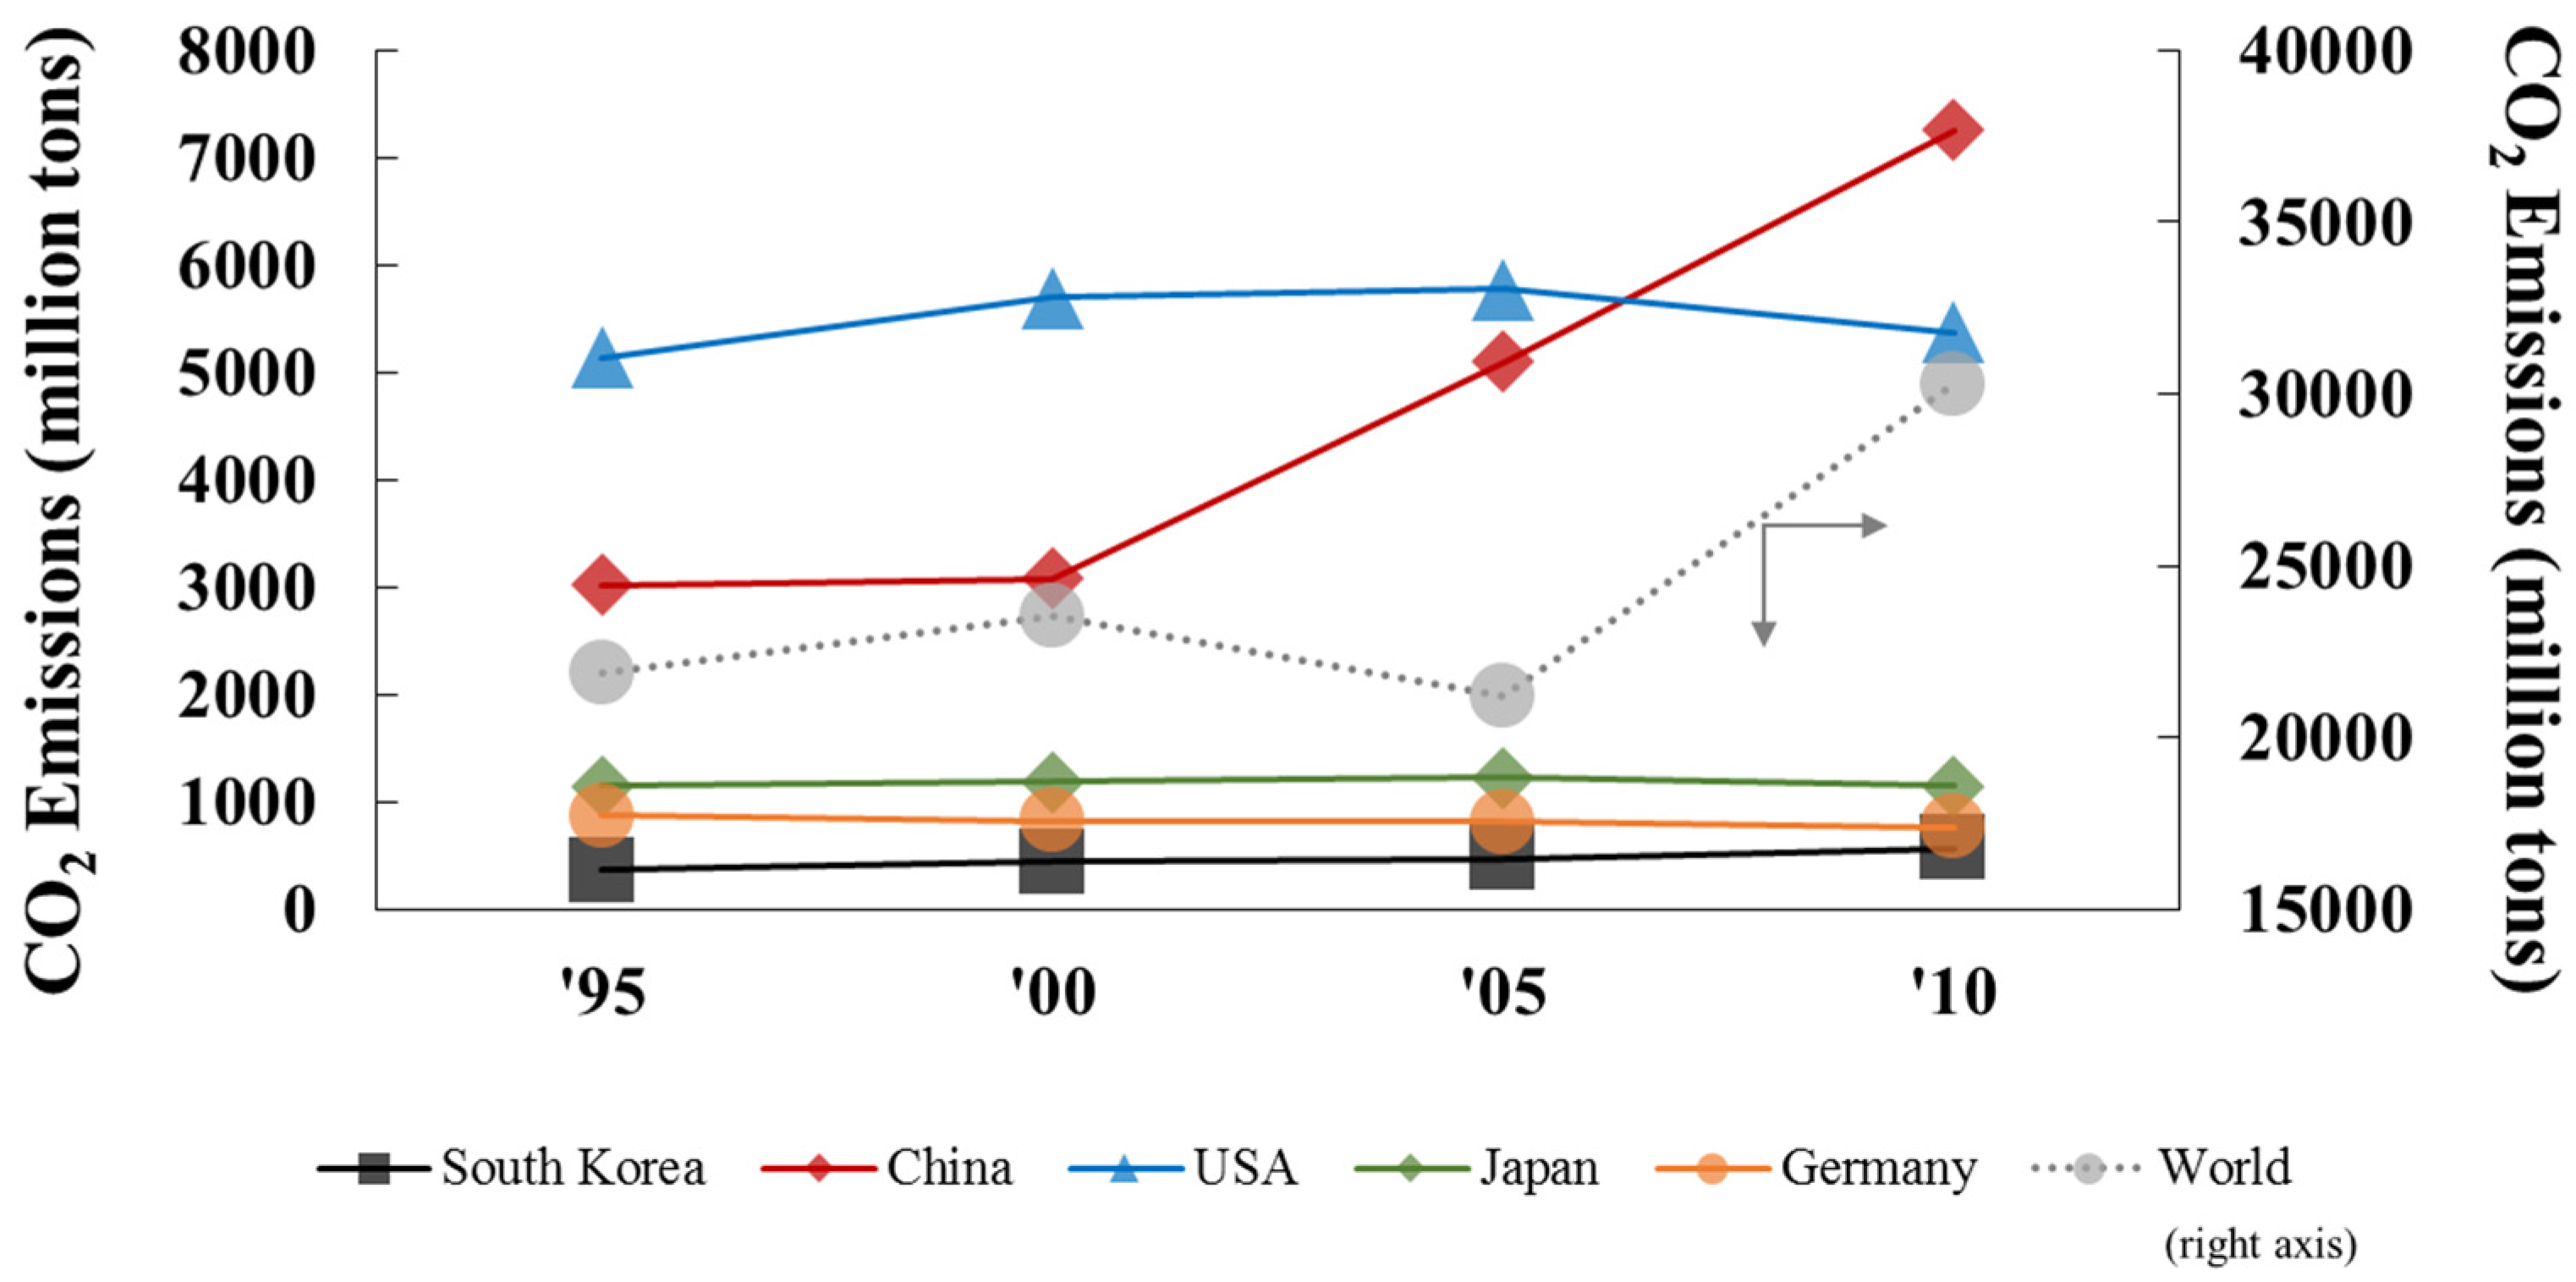
More specifically, CO2 emissions showed a significant increase in China from 2005; the amount of CO2 that was directly emitted and indirectly emitted in 2010 was 908.34 tons and 155.73 million tons, respectively, which was 1.7 times (547.91 million tons) the 1995 level and three times (51.71 million tons) the 1995 level, respectively. Although the increase in the amount of direct emissions in China may be correlated with the increase in steel production via the BF process, the increase in the reduction of indirect emissions is likely to be a combination of both an increase in the production of steel via the EAF route and the processing of non-ferrous metals, such as Al, Cu, and Zn. Al electrolytic smelting in China by the Hall–Heroult process, which consumes approximately 14,000 kWh/ton-Al compared with 400 kWh/ton-steel by the EAF route, produced approximately 16.2 million tons of CO2 emissions in 2010 compared with 1.78 million tons of CO2 emissions in 1995. Zinc also demonstrated a significant increase in production to 5.16 million tons of Zn in 2010 compared with 1.08 million tons of Zn in 1995. Copper exhibited a relatively steady increase compared with the substantial increases observed for Al and Zn. Korea yielded direct CO2 emissions and indirect CO2 emissions of 57.9 million tons and 7.71 million tons in 2010 compared with 31.53 million tons and 4.19 million tons in 1995, respectively. Similar to China, Korea is also concentrated towards the BF route, which is heavily dependent on coal/peat and coke for energy and the reduction of iron ore, which produces higher levels of direct CO2 emissions. A steady increase in steel production by the EAF route of 13.89 million tons to 24 million tons from 1995 to 2010 seems to correlate with the increase in indirect CO2 emissions for Korea. The US experienced a continuous decrease in direct CO2 emissions from the basic metals industry and a decrease in indirect CO2 emissions from 1995 to 2005 and a sudden increase in these emissions in 2010: 30.5 million tons in 1995, 19.64 million tons in 2000, 16.22 million tons in 2005, and 30.43 million tons in 2010. The overall steady decrease in direct CO2 emissions in the US was attributed to the merging of steel companies and the subsequent shutdown of inefficient plants, which was replaced by the EAF route. The US has an unusually large concentration of electric arc furnaces within the steelmaking plant due to its comparatively low electricity costs and abundance of high-grade low-cost scrap. However, even with the competitive electricity costs within the US, the non-ferrous industry, including Al, Zn, and Cu, experienced significant slowdowns and shutdowns owing to the excessively high consumption of electricity in the electrolysis of these non-ferrous basic metals. Thus, fluctuations in the indirect CO2 emissions occurred in the US because some of these non-ferrous electrolysis processes were shut down. Japan experienced an increase in direct CO2 emissions from 88.27 million tons in 1995 to 117.06 million tons in 2010. The indirect CO2 emissions seemed to remain relatively steady (10.33 million tons in 1995, 9.23 million tons in 2000, 11.78 million tons in 2005, and 10.23 million tons in 2010). Unlike the US, the price of electricity is comparatively high in Japan, which probably prevents significant capital investments in EAF production capacity and is dominated by the integrated steel mills. Although scrap costs and availability may not be prohibitive in Japan, the cost of electrical energy means that it is difficult to make the EAF process economical unless energy support is provided. In addition, large-scale non-ferrous basic metals production is limited in these high-electricity-cost regions. Germany experienced a significant decrease in direct CO2 emissions from 1995 (75.48 million tons) to 2010 (19.4 million tons). Indirect CO2 emissions were 12.34 million tons in 2010, which is similar to 1995 levels. The amount of non-ferrous basic metals production in Germany was not significant within the range of this study.
Thus, it would seem that the direct emissions levels of Korea, China, and Japan are increasing along with the indirect emissions, except for Japan. This trend is correlated with the amount of steel and the non-ferrous basic metals that are produced and the dominant production route for a particular country. China, Korea, and Japan experienced production increases within the integrated steel route that utilizes coal/peat and oil as its major energy source, which yielded direct CO2 emissions. The utilization of coal and oil energy sources is speculated to be pulverized coal injection (PCI) into the blast furnace or the supplemental heat via coal or oil heating within the various steelmaking processes. Steel production by the EAF route also expanded within the time scale that was identified in this study, which generates higher amounts of indirect CO2 emissions. In addition, China experiences significant increases not only in steel production, but also in its non-ferrous sector, which is more energy-intensive per ton of metal compared with steel. Countries, such as the US, that are heavily concentrated towards the EAF route and non-ferrous metals production, in which electricity is the main energy source, will experience continued increases in indirect CO2 emissions. Therefore, the scheme of direct and indirect CO2 emissions in the basic metals industry is closely related to the dominant process route that is taken by the respective countries and the production amounts of major non-ferrous metals, including Al, Cu, and Zn. Figure 5 shows the productivity of the basic metals process with direct and indirect CO2 emissions. The productivity represents the amount of produced basic metals in thousand tons with direct and indirect CO2 emissions divided by the energy costs in US million dollars. In 2010, Germany had the highest productivity of basic metals, with direct CO2 emissions of 5.23, whereas Korea had the lowest productivity of 1.50. This estimate is likely to be related to the increase in the cost of energy for Korea with respect to the other countries. For the productivity of basic metals with indirect CO2 emissions in 2010, the US had the highest productivity of 4.97, whereas Germany had the lowest productivity of 1.12. The lower value for Germany suggests a significant change in the amount of produced basic metals with respect to the other countries.

3.2. CO2 Emissions arc Elasticity

The CO2 emissions arc elasticity was calculated to observe the changes in the total CO2 emissions with changes in the total consumption cost of the input energy sources. The arc elasticity is given as an absolute value, which describes the sensitivity of the changes in CO2 to changes in the energy costs over a defined time period. The cost of a product within a certain range can affect the amount of product demand in the demand curve, and the sensitivity of the product consumption with respect to cost can be estimated by dividing the amount of demand change with the corresponding price change. A small elasticity index indicates a low sensitivity; thus, the amount of manufactured products or CO2 emissions within this period would not be significantly affected. A large elasticity index indicates a high sensitivity; thus, the amount of CO2 emissions would significantly decrease. In this study, the elasticity of the total CO2 emissions with respect to the total consumed cost of the energy source has been considered for the five major industrial countries.
The energy sources within the basic metals industry have been identified to be the “mining and quarrying (2)”, “coke, refined petroleum products and nuclear fuel (7)”, and “electricity, gas and water supply (16)”. Using available data from 1995 to 2010, the average elasticity is provided in Table 4. An elasticity value of zero indicates perfect inelasticity, which suggests no changes in CO2 emissions with variations in the input energy cost. Daily necessities would fall within this area. An elasticity value between unity and zero indicates an inelastic behavior, in which the change in the CO2 is smaller than the changes in the input energy cost. An elasticity value of unity indicates unit elasticity, in which the amount of change in the CO2 is equivalent to the changes in the input energy cost. An elasticity value greater than the unit value indicates elastic behavior, in which the change in CO2 emissions is greater than the changes in the input energy costs. Overall, the elasticity index was not stable over the entire period. Within the 1990s, most of the countries studied showed high elasticity with coke/peat, but with time the elasticity of Electricity became pronounced. In particular, Korea, Japan, and Germany showed a high elasticity to Electricity. This could be due to the overall higher consumption or the price increase of electricity within the steel industry.
The CO2 emissions of the basic metals industry can be estimated from Equation (6). The estimated CO2 emissions indicate that Korea has a CO2 emissions increment of 3.43 million tons per one million USD in consumed input energy source costs.
q i = m ε i x m + c ε i x c + e ε i x e
where qi is the CO2 emissions of country “I”, m ε i is the elasticity factor value of industry sector (2) for country “I”, c ε i is the elasticity factor value of industry sector (7) for country “I”, e ε i is the elasticity factor value of industry sector (16) for country “I”, xm is the input cost of industry sector (2), xc is the input cost of industry sector (7), and xe is the input cost of industry sector (16).
Specifically, Japan and Germany demonstrated a more pronounced sensitivity in CO2 emissions with higher prices in electricity as the energy source compared with China and the US, but were comparatively less sensitive to the total cost of coal/peat as the energy source. An elasticity index of 4.74 for Japan suggests a significant sensitivity to the electricity energy source; thus, slight changes in electricity costs can significantly affect the amount of basic metals produced and hence CO2 emissions. Japan is comparatively insensitive to the coke/peat and oil energy sources. Conversely, China and the US experienced more pronounced changes in CO2 emissions as the input total cost of the coal/peat increased. Thus, depending on the country, the changes in CO2 emissions can be affected by the dominant energy source and the concentration of the industry within a country with respect to this energy source. This situation enables the effect of a particular energy source on CO2 emissions to be closely verified and demonstrates its importance to the sustainability of the industry in terms of energy.

3.3. Potential Neutralization Capacity of CO2

The available forest resources and land masses within a country that emits CO2 can be effectively neutralized from the photosynthesis of plants, vegetation and forest resources. Recent studies describe the effect of global climate change due to a significant decrease in the Amazon forest vegetation and stress the importance of forest resources for carbon storage through photosynthesis [34]. This study incorporates some of the findings of previous studies of CO2 absorption rates per forest resource area and the total forest area in a country in which CO2 is emitted [35]. To simplify the calculations, agricultural areas and vegetation have been excluded from the forest area.
The CO2 neutralization ability for each country from 1995 to 2010 is shown in Table 5 in five-year intervals. The forest area, with its prominent amount of broad-leaf trees, in Korea in 2010 was 6222 thousand ha and the CO2 emission was 563 million tons. Assuming a CO2 neutralization potential of 13.54 tons per 1 ha, the neutralization ability would be 15% of the total emitted CO2. In the US, the CO2 absorption ability was estimated to be approximately 11.6 ton/ha with a neutralization ability above 66% due to its large area of needle-leaf forest resources. The concentration of manufacturing within a small land mass is attributed to this lower CO2 neutralization ability for Korea, which caused Korea to implement drastic emissions trading schemes in January 2015. These schemes will likely impede the sustainability of the steel and manufacturing industry if potential solutions to either lower CO2 or increase the neutralization abilities for the country are not improved.
A time series analysis was performed to estimate the average CO2 neutralization ability, in which the neutralization potential was used as the dependent variable and the forest area and CO2 emissions were used as the independent variables. Thus, future estimates from the time-series analysis consider the variation factors and analyze the dynamic relationship of the serial correlation among the time-series data. The variation for a specified time is affected by previous changes or previous errors (white noise). The Auto-Regressive Integrated Moving Average (ARIMA) model utilizes this relationship in the following equation
Yt (p, d, q) = φ0 + φ1 × Δd × Yt−1 + ...+ φp × Δd × Yt-p + θ1 × εt−1 −...− θq × εt-q + εt
where εt represent mutually independent average values, which sum to 0, and the fixed variance exhibits a normal distribution. Thus, εt is white noise, and φ0 … φp and θ1 … θq are undetermined parameters. The ARIMA analysis identifies the dynamic characteristics of the time-series data and enables relatively accurate estimates, which are broadly applied to stock markets, economics, and resource management. This study also attempted to estimate future trends of the CO2 neutralization potential of various countries using the ARIMA model. The ARIMA model consists of three parts and is expressed as ARIMA (p, d, q), where p is the order of the regression analysis, d is the order of the differentiation, and q is the order of the moving average. The effective model equations for estimating the dependent variable are provided in Table 6.
The coefficient of determination that describes the suitability of the model was determined to be greater than 0.90 [36]. The coefficients of determination near zero suggest a low usefulness of the model, whereas a higher value near 1 suggests a high usefulness of the model. Using available data to 2010 limits the accuracy of estimates and trends. Within this estimate, the emitted CO2 negatively affects the neutralization and the forest area positively affects the neutralization. For China, the neutralization ability seems to decrease even when the forest area increases. These results are attributed to the rate of industrial expansion and the rate of increase in CO2 emissions, which substantially exceeds the increments of forest areas that are set within the estimates. This finding corresponds to the rate at which the CO2 emissions are increasing within China and its effective ability to neutralize its CO2 emissions. For Korea, the CO
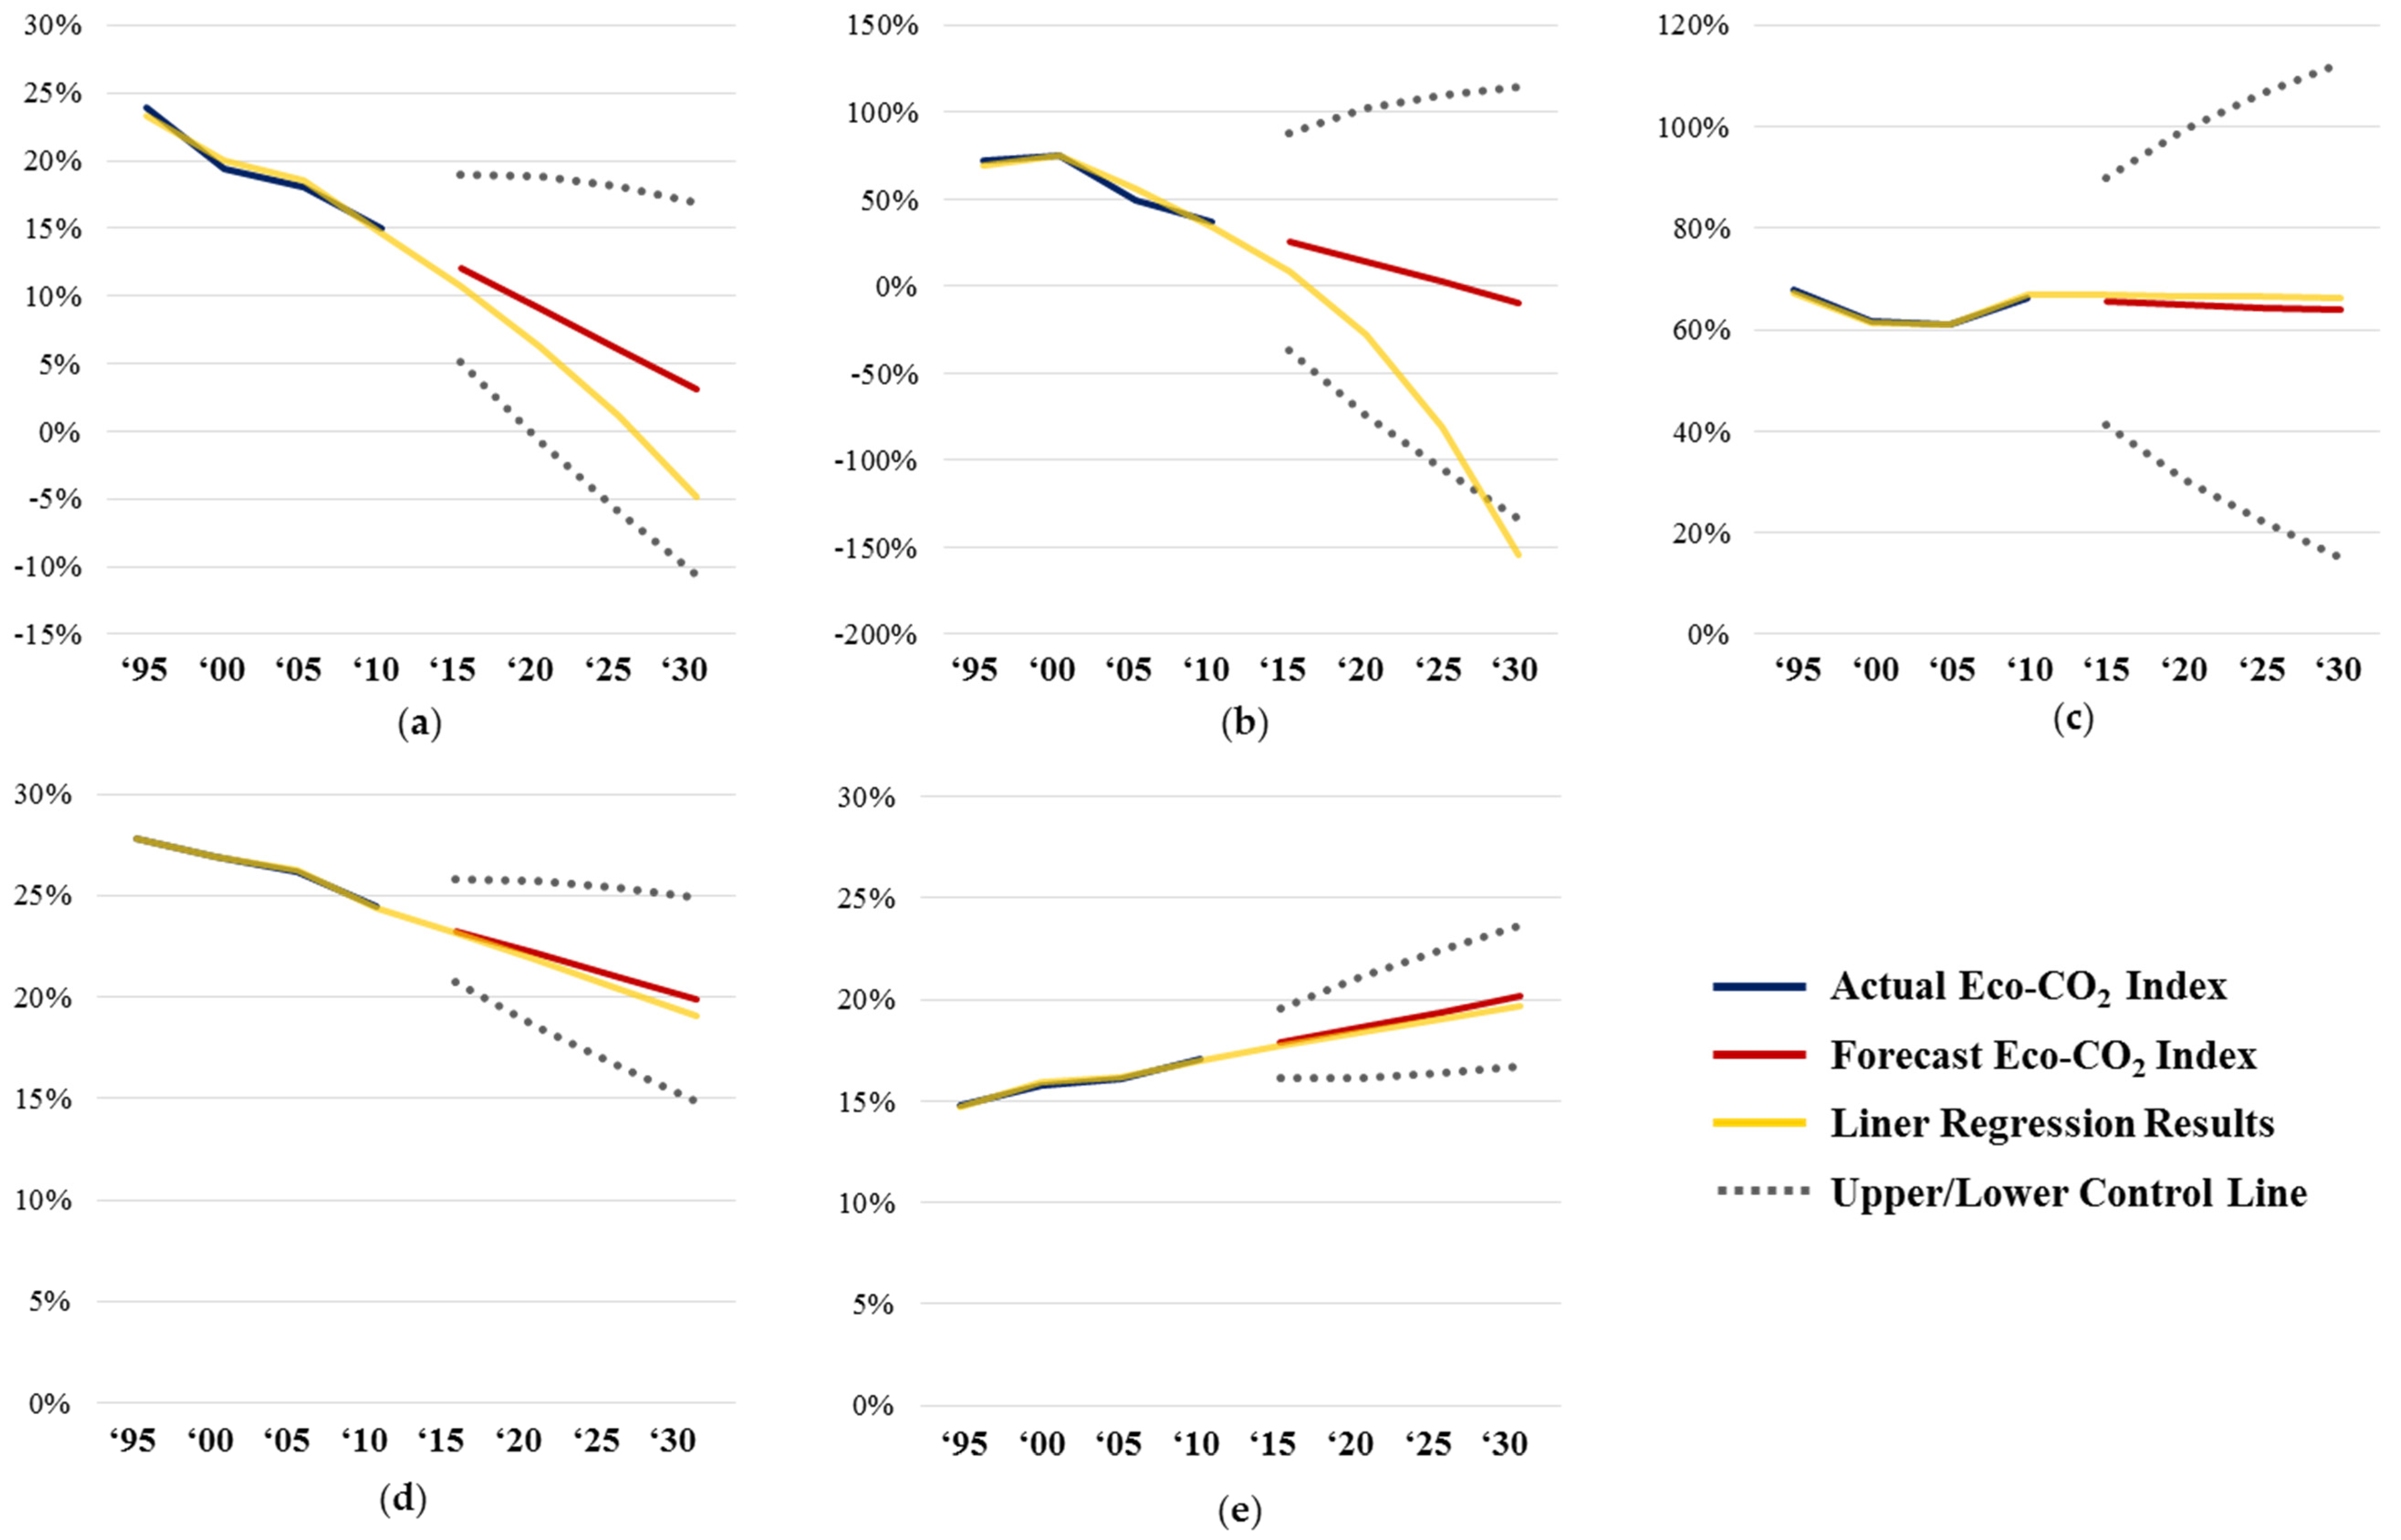
2 neutralization ability has seen a significant decrease since 1995, and the constant of the model yields a negative value. However, if the forest area were to increase in Korea then this country could achieve greater improvements in neutralization ability compared with other countries. Thus, the capacity for Korea’s neutralization ability to improve with forest farming and expansion of its forest area may be sufficient. The estimated neutralization ability from 2015 to 2030 in five-year intervals from the analysis of the ARIMA model is provided in Figure 6. This estimate accounts for the dynamic changes of the forest area and CO2 emissions in terms of time for a particular country. Korea, China, and Japan show a decrease in the estimated CO2 neutralization ability, whereas Germany and the US appear to have a neutralization ability that will remain stagnant or slightly increase. Korea and China both show a steep decline in the neutralization ability for the actual and estimated values. If the forest area remains constant or decreases, the neutralization ability of the country will become negative with a total loss of neutralization capacity. Conversely, the slight increases in the neutralization potentials for Germany and the US are attributed to its trend in lower CO2 emissions and increases in forest area.

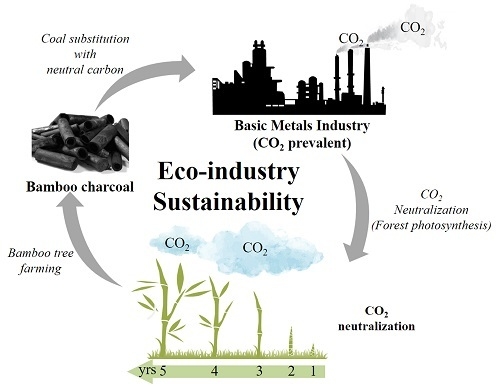
3.4. Possible Scenario to Increase CO2 Neutralization

A potential scenario has been provided, in which controlled industry expansion is possible without significant industry contraction if forest resources can be effectively utilized. Using Korea as an example country and bamboo forest farming as a tree species to be used, the annual CO2 neutralization of rapidly growing trees has been measured to be between 29 and 47 ton-CO2/ha [30,37,38,39,40]. Studies have shown that bamboo species can grow in excess of 30 cm per day [41]. After a five-year period, these bamboo trees can also be utilized as carbon sources as bamboo charcoal, which may replace some of the fixed carbon that is used for fuel, and would be considered to be carbon neutral.
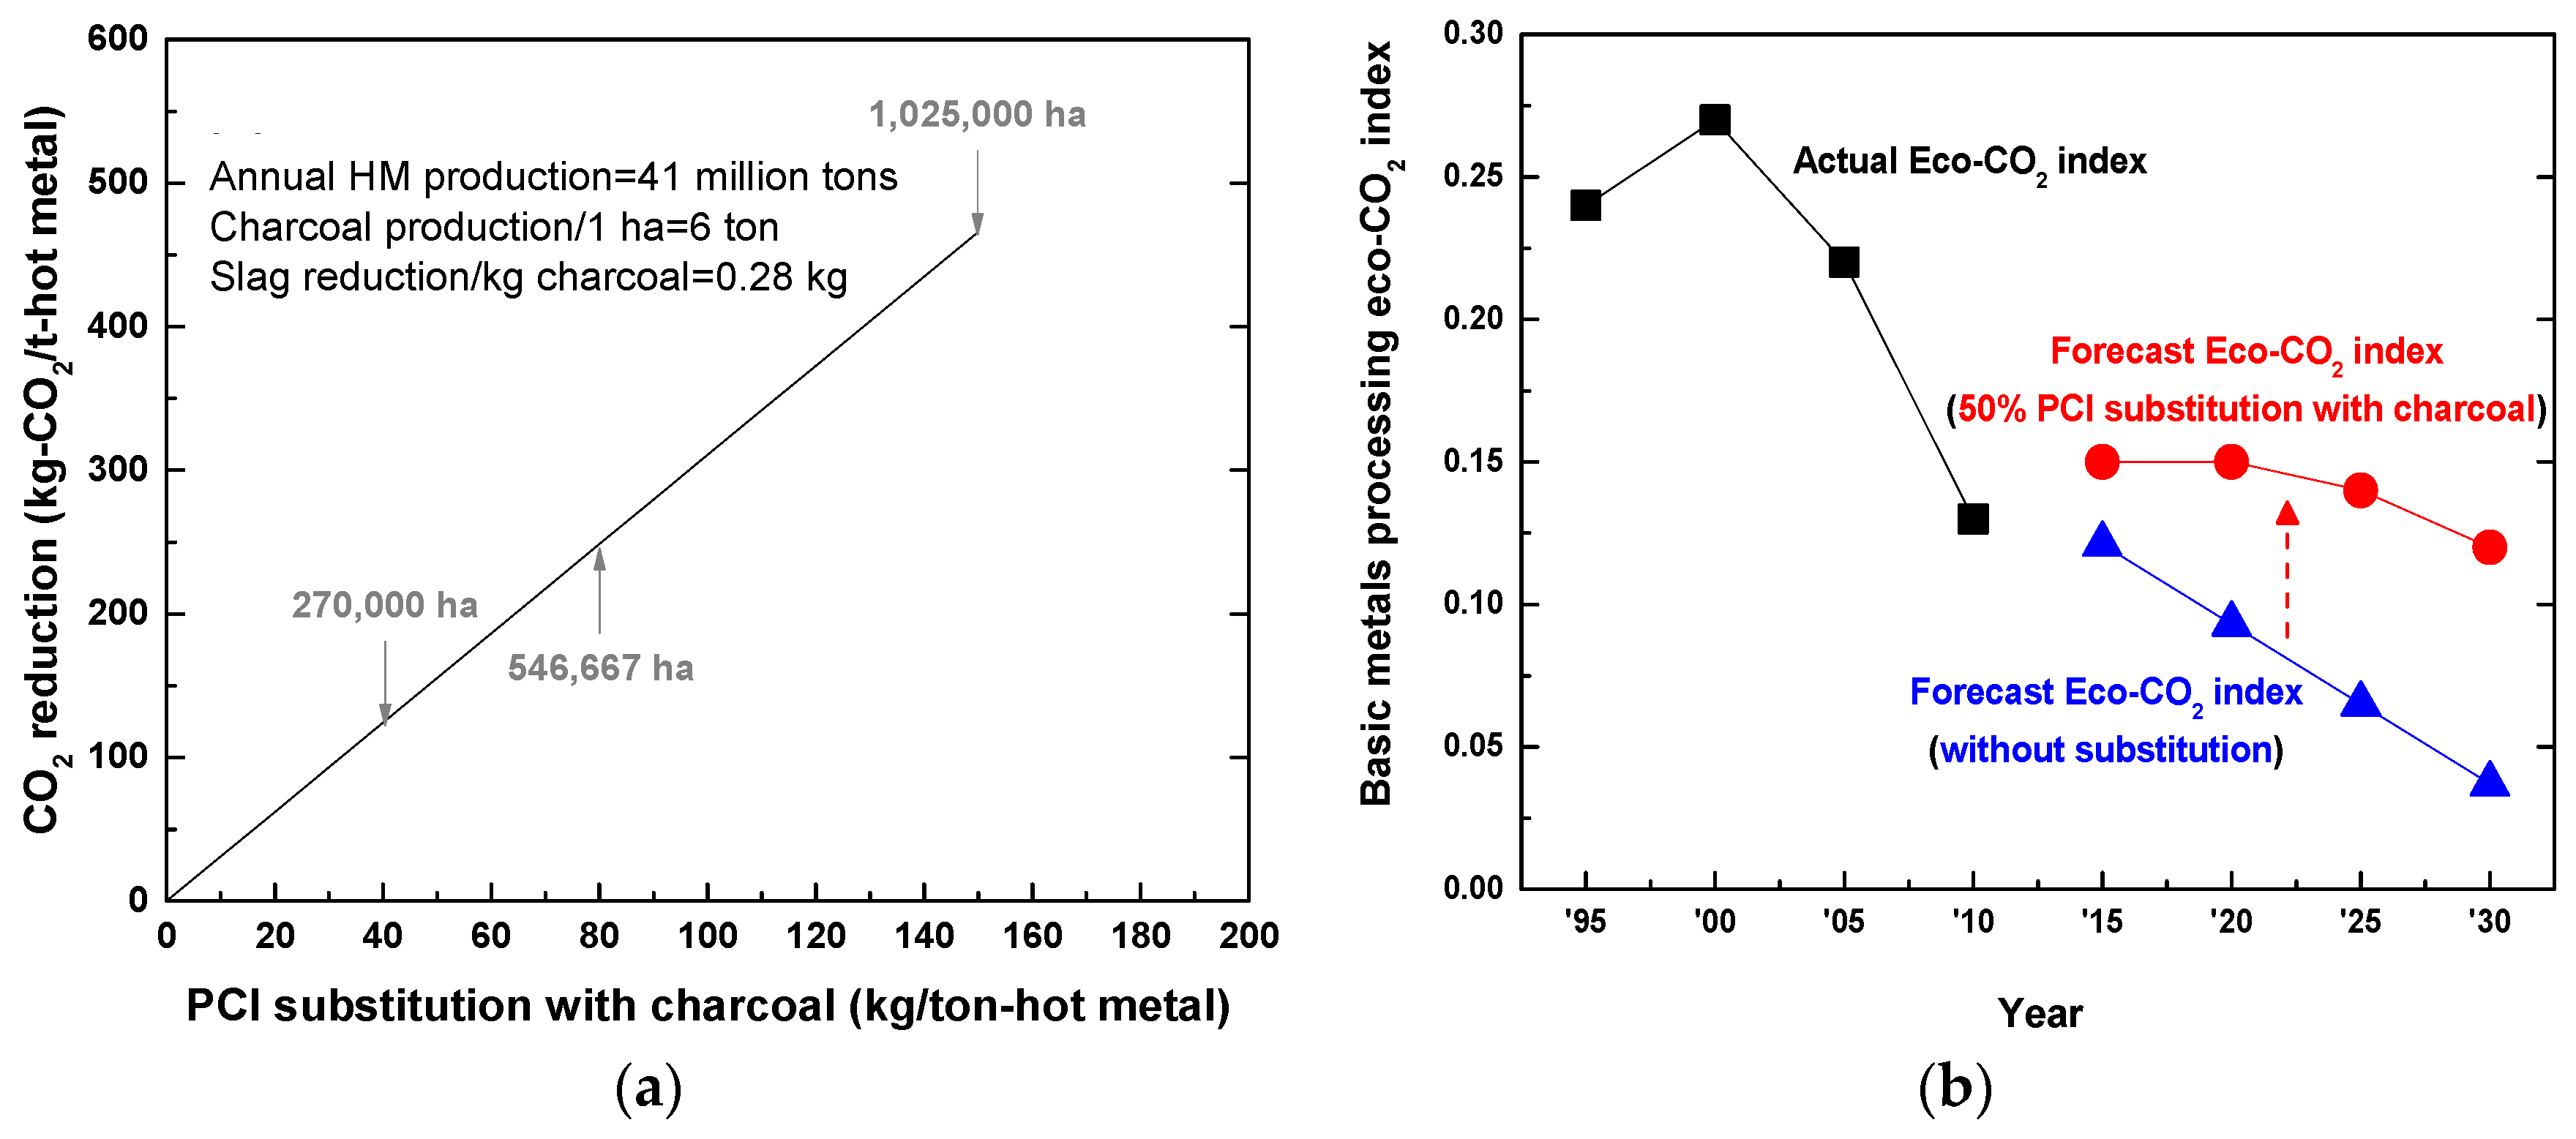
Approximately 20% of the bamboo charcoal with respect to its initial weight can be produced. Because approximately 30 tons of bamboo wood can be produced from 1 ha, six tons of charcoal can be produced from a unit ha of bamboo forest. The chemical analyses provided in various studies suggest that less than 4% of ash is present in bamboo after pyrolysis. The major ash composition includes K2O, SiO2, and P2O5, which are also present in coal that is employed in the steel industry in considerably higher quantities. Coal that is employed for PCI significantly varies; thus, an average value from previously published references has been applied, in which SiO2 and Al2O3 constitute approximately 60% of the total ash content and 20% of the average as-received coal weight. Thus, coal contains five times the amount of ash than bamboo charcoal.
If the PCI in the BF is substituted with the carbon neutral bamboo charcoal, which has similar calorific value of approximately 3000 kcal/kg, 150 kg-coal/ton-hot metal could be replaced. These changes would cause a potential decrease in CO2 of approximately 440 kg-CO2/ton-hot metal. In addition to the substitution by the carbon neutral charcoal, acidic oxides of SiO2 and Al2O3 of approximately 18 kg/ton-hot metal will also decrease. Because the fluidity of the slag in the BF must be maintained by the addition of CaO at a fixed CaO/SiO2 ratio of approximately 1.3, the substitution by charcoal will decrease the slag amount by 41.4 kg/ton-hot metal. This decrease in slag amount will subsequently decrease the carbon that is consumed in the BF by approximately 7 kg/ton-hot metal, which would correspond to 26 kg-CO2/ton-hot metal. Thus, the substitution of the PCI with bamboo charcoal would correspond to a decrease in the CO2 emissions in the blast furnace by 466 kg-CO2/ton-hot metal. According to WSA statistics [9], 41 million tons of total hot metal were produced in Korea in 2013, which represents an annual CO2 reduction of approximately 19 million tons. Figure 7a estimates the possible CO2 reduction from the substitution of PCI in the BF with various amounts of bamboo charcoal. Using the ARIMA model and assuming a 50% substitution of the PCI with bamboo wood charcoal and a neutralization capacity of 38 ton-CO2/ha, the effect of bamboo wood charcoal for the basic metals CO2 neutralization was forecasted to 2030 using the ARIMA model. The average increase in CO2 emissions of the basic metals industry during the forecasted time range to 2030 was 10% on average based on the emissions between 2010 and 2014; this estimate was employed for the forecasted values applied in the ARIMA model. The results in Figure 7b indicate that the large slope of the decrease in the eco-CO2 index has been significantly deflected and the neutralization ability can be maintained at approximately 13% in 2030, even with the expected industry expansion forecasted by the ARIMA model by substituting PCI with bamboo wood charcoal and the bamboo farming of 50,000 ha.

4. Conclusions

The environmental issues caused by GHG emissions resonate beyond a specific industry to countries and the world over. This study has investigated changes in CO2 emissions and the consumption of various energy sources, namely, coal/peat, oil, and electricity. This study focused on an industry with significant CO2 emissions because a comprehensive analysis of all industry sectors was not feasible.
First, using the distribution structure of the input–output table, the corresponding energy sources were correlated and the direct and indirect CO2 emissions were estimated. An increase in the direct CO2 emissions indicates an increase in the use of the energy sources from the steel and metals industry that cause direct emissions. An increase in the indirect CO2 emissions suggests an increase in the utilization of electricity in the steel and metals industry. From the analysis of five countries, namely, Korea, China, US, Japan, and Germany, the direct CO2 emissions increased more than 1.4 times in 2010 and the indirect CO2 emissions increased more than two times in 2010 compared to 1995 values. These trends were more apparent in China, with direct and indirect CO2 emissions of 908.34 million tons in 2010 and 155.73 million tons in 2010, respectively. Second, the elasticity was calculated to identify the effect of input energy costs on the CO2 emissions and the sensitivity to a particular energy source. The results suggest that Korea, Japan, and Germany are CO2-sensitive to the “electricity, gas and supply (16)” energy sources, whereas China and the US are more sensitive to the “mining and quarrying (2)” energy sources.
In addition, the forest areas of the individual countries were employed to calculate the potential neutralization ability of the emitted CO2. According to 2010 data, the US had the highest neutralization ability (66.1%), whereas Korea had the lowest neutralization ability (15%). Future estimates and trends of the neutralization ability indicated that China and Korea are rapidly losing their neutralization ability; if the current state of the forest area is maintained, a negative neutralization ability will result. Thus, efforts to curtail this significant loss of neutralization ability must be implemented in both China and Korea with the planting and farming of CO2-absorbing trees for industry sustainability. Using fast-growing bamboo trees as a source for carbon neutral wood charcoal, the substitution of 50% PCI in the BF process indicated a significant improvement of the eco-CO2 index without significant industry contraction.
Although the analysis in this study focused on 20-year-old trees, only approximately 3.33% of the trees in Korea are 30 years old or younger, 19.66% of these trees are within 31–40 years and 77.01% of the trees in Korea are at least 41 years old. Thus, the neutralization ability may be less than the 15% presented in this study, which highlights the need to rapidly implement regulations to plant and farm broad-leaf trees with increased CO2 absorption capacities.

Acknowledgments

This study was partially supported by the Brain Korea 21 PLUS (BK21 PLUS) Project at the Division of the Eco-Humantronics Information Materials and the National Research Foundation of Korea Grant (NRF-2016K2A9A2A08003672). This work was performed while Project Associate Professor at the Graduate School of Frontier Sciences at The University of Tokyo in Chiba, Japan.

Author Contributions

Kyunsuk Choi provided statistical data and verification of the OECD information and correlated with the CO2 intensity, Hiroyuki Matsuura verified the data of Japan and provided feedback on potential sustainable technologies in ironmaking, Hyunjoung Lee and Il Sohn have equal contributions as corresponding author and overall completed the manuscript through data interpretation, calculations, and estimations through the ARIMA analysis.

Conflicts of Interest

The authors declare no conflict of interest.

References

  1. Rosenzweig, C.; Iglesias, A.; Yang, X.B.; Epstein, P.R.; Chivian, E. Climate change and extreme weather events—Implications for food production, plant diseases, and pests. Glob. Chang. Hum. Health 2001, 2, 90–104. [Google Scholar] [CrossRef]
  2. UN Framework Convention on Climate Change: Kyoto Protocol to the United Nations Framework Convention on Climate Change. United Nations 1998. Available online: http://unfccc.int/resource/docs/convkp/kpeng.pdf (accessed on 15 June 2015).
  3. UN Framework Convention on Climate Change: Report of the Conference of the Parties on its Fifteenth Session, Held in Copenhagen from 7 to 19 December 2009. Available online: http://unfccc.int/resource/docs/2009/cop15/eng/11a01.pdf (accessed on 15 June 2015).
  4. IEA. Energy Statistics of OECD Countries 2014. Available online: http://0-www-oecd--ilibrary-org.brum.beds.ac.uk/energy/energy-balances-of-oecd-countries-2014_energy_bal_oecd-2014-en (accessed on 10 April 2015).
  5. Kundak, M.; Lazić, L.; Črnko, J. CO2 emissions in the steel industry. Metalurgija 2009, 48, 193–197. [Google Scholar]
  6. Lee, B.; Sohn, I. Review of innovative energy savings technology for the electric arc furnace. JOM 2014, 66, 1581–1594. [Google Scholar] [CrossRef]
  7. Hasanbeigi, A.; Arens, M.; Price, L. Alternative emerging ironmaking technologies for energy-efficiency and carbon dioxide emissions reduction: A technical review. Renew. Sust. Energ. Rev. 2014, 33, 645–658. [Google Scholar] [CrossRef]
  8. Ho, M.T.; Bustamente, A.; Wiley, D.E. Comparison of CO2 capture economics for iron and steel mills. Int. J. Greenh. Gas. Control. 2013, 19, 145–159. [Google Scholar] [CrossRef]
  9. World Steel Association. Steel Statistical Yearbook. Available online: http://www.worldsteel.org/statistics/statistics-archive/yearbook-archive.html (accessed on 15 June 2015).
  10. Su, B.; Ang, B.W. Input-output analysis of CO2 emissions embodied in trade: A multi-region model for China. Appl. Energ. 2014, 114, 377–384. [Google Scholar] [CrossRef]
  11. Su, B.; Ang, B.W. Multi-region input-output analysis of CO2 emissions embodied in trade: The feedback effects. Ecol. Econ. 2011, 71, 42–53. [Google Scholar] [CrossRef]
  12. Li, L.; Lei, Y.; Pan, D. Study of CO2 emissions in China’s iron and steel industry based on economic input-output life cycle assessment. Nat. Hazards 2016, 81, 957–970. [Google Scholar] [CrossRef]
  13. Hetherington, R. An input-output analysis of carbon dioxide emissions for the UK. Energy Convers. Mgmt. 1996, 37, 979–984. [Google Scholar] [CrossRef]
  14. Chen, G.Q.; Zhang, B. Greenhouse gas emissions in China 2007: Inventory and input–output analysis. Energy Policy 2010, 38, 6180–6193. [Google Scholar] [CrossRef]
  15. Chang, Y.F.; Lewis, C.; Linc, S.J. Comprehensive evaluation of industrial CO2 emission (1989–2004) in Taiwan by input–output structural decomposition. Energy Policy 2008, 36, 2471–2480. [Google Scholar] [CrossRef]
  16. Leontief, W. Input-Output Economics; Oxford University Press: New York, NY, USA, 1986. [Google Scholar]
  17. OECD. Input-Output Total Tables. Available online: http://stats.oecd.org/Index.aspx?DataSetCode=IOTS (accessed on 8 March 2015).
  18. The Bank of Korea. Economic Statistics System. Input-Output Tables. Available online: https://ecos.bok.or.kr/ (accessed on 8 March 2015).
  19. National Bureau of Statistics of China. China Statistical Yearbook 2013. 2010 Input-Output Table. Available online: http://www.stats.gov.cn/tjsj/ndsj/2013/indexeh.htm (accessed on 5 March 2015).
  20. Bureau of Economic Analysis of US. Input-Output Accounts Data. Available online: http://www.bea.gov/industry/io_annual.htm (accessed on 8 March 2015).
  21. Ministry of Economy, Trade and Industry of Japan. Updated Input-Output Table. Input-Output Table and Inverse Matrix. Available online: http://www.meti.go.jp/english/statistics/typ/entyoio/index.html (accessed on 8 March 2015).
  22. Statistisches Bundesamt of Germany. Input-Output Accounts. Available online: https://www-genesis.destatis.de/genesis/online/data;jsessionid=1416F59B01AA01A3C0093BBB5A7BBCAA.tomcat_GO_1_2?operation=abruftabelleBearbeiten&levelindex=2&levelid=1463226917336&auswahloperation=abruftabelleAuspraegungAuswaehlen&auswahlverzeichnis=ordnungsstruktur&auswahlziel=werteabruf&selectionname=81511-0002&auswahltext=&werteabruf=Value+retrieval (accessed on 8 March 2015).
  23. World Input-Output Database. Available online: http://www.wiod.org/new-site/database/wiots.htm (accessed on 8 March 2015).
  24. Su, B.; Ang, B.W. Input-output analysis of CO2 emissions embodied in trade: Competitive versus non-competitive imports. Energy Policy 2013, 56, 83–87. [Google Scholar] [CrossRef]
  25. Su, B.; Huang, H.C.; Ang, B.W.; Zhou, P. Input-output analysis of CO2 emissions embodied in trade: The effects of sector aggregation. Energy Econ. 2010, 32, 166–175. [Google Scholar] [CrossRef]
  26. Curtis, P.S.; Wang, X.A. Meta-analysis of elevated CO2 effects on woody plant mass, form, and physiology. Oecologia 1998, 113, 299–313. [Google Scholar] [CrossRef]
  27. Norby, R.J.; Wullschleger, S.D.; Gunderson, C.A.; Johnson, D.W.; Ceulemans, R. Tree responses to rising CO2 in field experiments: Implications for the future forest. Plant. Cell. Environ. 1999, 22, 683–714. [Google Scholar] [CrossRef]
  28. Smith, S.D.; Huxman, T.E.; Zitzer, S.F.; Charlet, T.N.; Housman, D.C.; Coleman, J.C.; Fenstermaker, L.K.; Seemann, J.R.; Nowak, R.S. Elevated CO2 increases productivity and invasive species success in an arid ecosystem. Nature 2000, 408, 79–82. [Google Scholar] [CrossRef] [PubMed]
  29. The World Bank. Forest Area (% of Land Area). Available online: http://data.worldbank.org/indicator/AG.LND.FRST.ZS (accessed on 15 June 2015).
  30. Korea Forest Service. The Amount of Carbon Absorbed by Trees 2013. Available online: http://www.forest.go.kr/newkfsweb/cop/bbs/selectBoardArticle.do?bbsId=BBSMSTR_1036&mn=KFS_03_02_01&nttId=2882053 (accessed on 15 June 2015). (In Korean)
  31. The United Nation Food and Agriculture Organization. Global Forest Resources Assessment 2010. Available online: http://www.fao.org/docrep/013/i1757e/i1757e.pdf (accessed on 15 June 2015).
  32. Dowdy, S.M.; Wearden, S. Statistics for Rsearch; Wiley: New York, NY, USA, 1983. [Google Scholar]
  33. Stockholm International Peace Research Institute: Military Expenditure Database. Available online: http://www.sipri.org (accessed on 15 June 2015).
  34. Cox, P.M.; Betts, R.A.; Jones, C.D.; Spall, S.A.; Totterdell, I.J. Acceleration of global warming due to carbon-cycle feedbacks in a coupled climate model. Nature 2000, 408, 184–187. [Google Scholar] [CrossRef] [PubMed]
  35. Hilker, T.; Lyapustin, A.I.; Tucker, C.J.; Hall, F.G.; Myneni, R.B.; Wang, Y.; Bi, J.; de Moura, Y.M.; Sellers, P.J. Vegetation dynamics and rainfall sensitivity of the Amazon. Proc. Natl. Acad. Sci. USA 2014, 111, 16041–16046. [Google Scholar] [CrossRef] [PubMed]
  36. Asteriou, D.; Hall, S.G. Applied Econometric; Palgrave Macmillan: Basingstoke, UK, 2011. [Google Scholar]
  37. Maoyi, F.; Xiaosheng, Y.; Shenxue, J. Technical Manual on Utilization of Sympodial Bamboos; China Forestry Publishing House: Beijing, China, 2007. [Google Scholar]
  38. Scurlock, J.M.O. Bamboo: An Overlooked Biomass Resource? Oak Ridge National Laboratory Environmental Sciences Division Report. Biomass Bioenergy 2000, 19, 229–244. [Google Scholar] [CrossRef]
  39. Bahtiar, E.T.; Nugroho, N.; Carolina, A.; Maulana, A.C. Measuring carbon dioxide sink of betung bamboo (Dendrocallamus asper (Schult f.) Backer ex Heyne) by sinusoidal curves fitting on its daily photosynthesis light response. J. Agric. Sci. Technol. B 2012, 2, 780–788. [Google Scholar]
  40. Thokchom, A.; Yadava, P.S. Bamboo and its role in climate change. Curr. Sci. 2015, 108, 762–763. [Google Scholar]
  41. Ogawa, K.; Hirogaki, K.; Aoyama, E.; Taniguchi, M.; Ogawa, S. Sustainable manufacturing system focusing on the natural growth of bamboo. J. Adv. Mech. Des. Syst. Manuf. 2010, 4, 531–542. [Google Scholar] [CrossRef]
Figure 1. Total anthropogenic CO2 emissions of the five major steel producing countries taken from the IEA, which corresponds to the data available from the inter-industry relations tables from 1995 to 2010 in year intervals.
Sustainability 08 00484 g001
Figure 2. CO2 emissions of industry sectors divided into the direct and indirect emissions from Step 1 and Step 2, respectively.
Sustainability 08 00484 g002
Figure 3. Average direct and indirect CO2 emissions of the industry sectors from 1995 to 2010 using data in five-year intervals.
Sustainability 08 00484 g003
Figure 4. Average direct and CO2 emissions of the top 5 basic metals producing countries from 1995 to 2010 using data in five-year intervals.
Sustainability 08 00484 g004
Figure 5. Productivity of the basic metals process with direct and indirect CO2 emissions for various countries from 1995 to 2010. Note the productivity is produced amount (in 1000 ton unit)/Energy input costs (in one million USD units).
Sustainability 08 00484 g005
Figure 6. Eco-CO2 Index with the estimated forecast using the ARIMA model up to 2030. (a) South Korea; (b) China; (c) USA; (d) Japan; (e) Germany.
Sustainability 08 00484 g006
Figure 7. Estimation of (a) the CO2 reduction potential after substitution of PCI within the BF using bamboo charcoal and (b) the basic metals processing eco-CO2 index with PCI substitution of 50% with farmed bamboo wood charcoal in the BF.
Sustainability 08 00484 g007
Table 1. 26 classified industry sectors identified. The list was simplified to correspond with the list of industry sectors defined by each individual country’s local statistics bureau data (n.e.c.: not elsewhere classified).
No.IndustriesNo.Industries
1Agriculture, hunting, forestry and fishing14Motor vehicles, trailers and semi-trailers, other transport equipment
2Mining and quarrying15Manufacturing n.e.c, recycling, construction
3Food products, beverages and tobacco16Electricity, gas and water supply
4Textiles, textile products, leather and footwear17Wholesale and retail trade; repairs
5Wood and products of wood and cork18Hotels and restaurants
6Pulp, paper, paper products, printing and publishing19Transport and storage
7Coke, refined petroleum products and nuclear fuel20Post and telecommunications
8Chemicals and chemical products21Finance and insurance
9Rubber and plastics products22Real estate activities
10Other non-metallic mineral products23Machinery and equipment renting, computer and related activities, other business activities
11Basic metals, fabricated metal products except machinery and equipment24Research and development, Education
12Machinery and equipment n.e.c25Public admin. and defense, compulsory social security, health and social work
13Electrical machinery and apparatus, medical, precision and optical instruments n.e.c26Other community, social and personal services, private households with employed persons
Table 2. Symbol and detailed description used in the equations.
SymbolDescriptionSymbolDescription
T i Total CO2 emissions from industry “I” A M i Allocated amount in USD of “Mining and quarrying (2)” for industry “I”
E D i Direct emissions of CO2 from industry “I” A C i Allocated amount in USD of “Coke, refined petroleum products and nuclear fuel (7)” for industry “I”
E I i Indirect emissions of CO2 from industry “I” A E i Allocated amount in USD of “Electricity, gas and supply (16)” for industry “I”
MCO2 emissions from coal/peattMTotal production price in USD of “Mining and quarrying (2)”
CCO2 emissions from oiltCTotal production price in USD of “Coke, refined petroleum products and nuclear fuel (7)”
EDirect emissions of “Electricity, gas and water supply (16)”tETotal production price in USD of “Electricity, gas and supply (16)”
Table 3. Percentage of tree species within the forest area for the five major industrialized countries.
CountryLeaf TreeForest Area (km2)Land Area (km2)
NeedleBroad
S. Korea42%58%62,22097,230
China48%52%2,068,6069,388,211
USA73%27%3,040,2209,147,420
Japan54%46%249,790364,550
Germany71%29%110,760348,570
Table 4. Elasticity index of the Top 5 basic metal-producing countries for the period of 1995 to 2010 in five-year intervals.
CountryElasticity Index
Coke/Peat (Mining and Quarrying (2))Oil (Coke, Refined Petroleum Products and Nuclear Fuel (7))Electricity (Electricity, Gas and Supply (16))
S. KoreaAverage0.931.141.36
2005–20100.790.491.46
2000–20050.510.031.93
1995–20001.502.890.69
ChinaAverage1.070.480.69
2005–20100.040.590.50
2000–20050.690.701.02
1995–20002.490.160.56
USAAverage1.200.790.99
2005–20100.792.081.64
2000–20050.630.071.01
1995–20002.170.230.34
JapanAverage0.440.394.74
2005–20100.500.219.96
2000–20050.320.333.93
1995–20000.520.630.35
GermanyAverage0.581.021.43
2005–20100.770.842.04
2000–20050.200.280.57
1995–20000.761.951.66
Table 5. Total annual CO2 emissions, forest area, and estimated neutralization ability of the Top 5 basic-metal-producing countries for the period of 1995 to 2010 in five-year intervals. Note: A: Forest areas (thousand ha), B: CO2 emission (million ton), C: Eco-CO2 Index (%).
Country1995200020052010
ABCABCABCABC
S. Korea6329358.623.96288437.719.46255469.118.16222563.015.0
China167,0713022.172.5177,0013077.275.5193,0445103.149.6206,8617258.637.4
USA298,2655138.767.8300,1955698.161.5302,1085771.761.1304,0225368.566.1
Japan24,9131147.927.824,8761184.026.924,9351220.726.224,9791310.424.4
Germany10,909867.814.811,076825.015.811,076809.016.111,076761.617.1
Table 6. Parameter estimation of eco-CO2 index.
Country (p, d, q)ModelEstimationt-valueSignificantModel Fit Statistics Adjusted R2
South Korea (0,1,0)Constant0.1140.5250.6920.928
CO2 emission−2.27 × 10⁻¹⁰−0.6780.621
Forest Areas3.84 × 10−70.6210.646
China (0,1,0)Constant1.0700.8950.5350.875
CO2 emission−0.86 × 10⁻¹⁰−1.2070.440
Forest Areas4.72 × 10−100.0580.963
USA (0,1,0)Constant0.74311.6930.0540.847
CO2 emission−1.17 × 10⁻¹⁰−63.5340.010
Forest Areas1.80 × 10−98.1960.077
Japan (0,1,0)Constant0.5140.7490.5910.991
CO2 emission−2.06 × 10⁻¹⁰−11.8420.054
Forest Areas0.40 × 10−110.0010.921
Germany (0,1,0)Constant0.2608.5240.0740.913
CO2 emission−2.06 × 10⁻¹⁰−43.6650.015
Forest Areas6.19 × 10−92.5000.242

