1. Introduction
China has experienced fast-paced economic growth and a period of rapid urbanization following the country’s reform and opening up in the late 1970s [
1]. Kuznets defines economic development as the movement of a population from rural to urban areas. This movement requires an increase in city sizes, the expansion of the industrial and the service sectors [
2], the creation of new infrastructure [
3], and the building of more residential housing. All of these changes mean an increasing need for land that is defined for construction use. China experienced a dramatic increase (of 55.2 thousand km
2) in the land that is defined for construction between 1990 and 2010 [
4].
Construction land in this study refers to land that can be built on, including cities and towns, rural residential areas, independent industrial and mining land, and traffic land. The increase in the construction land has caused a sharp decrease in the amount of cultivated land, and threatened land productivity from ecological impact and the impact of cultivated land change induced by landscape variation, raising great concerns about China’s ability of maintaining food self-sufficiency [
5,
6]. As to China’s more developed eastern region, the urbanization has led to the loss of cultivated land increased by 29.2% from 2000 to 2008 compared with that from 1995–2000 [
7]. Moreover, the rapid expansion of construction land and China’s economic growth has irreversibly deteriorated the ecological and environmental quality of the land, posed a serious threat to environmental sustainability [
8,
9,
10]. At present, China’s urbanization and industrialization trends show no signs of abating. One could extrapolate that China’s construction land demand will rise constantly in line with its past trends, even although the gross domestic product (GDP) is expected to decrease to 7% in the coming years. However, compared with Japan during its rapid economic development period, every 1% GDP increase in China equates to eight times the land size of a similar increase in Japan [
11]. China’s extensive construction land use (CLU) is a crucial element affecting its long-term outlook for sustainable economic development, and for its ecological and environmental quality.
Thus, there is a great necessity to explore way of improving current extensive urban expansion and economic growth to a sustainable development mode through coupling relationship of economic, construction land use, and ecology. The speed of urbanization and industrialization in some regions in China has been so unprecedented and unique that it cannot be repeated in human development history [
12]. Hence, it is critical to explore a scientific and effective decision way to achieve the goal of building resource-saving and environmentally friendly society.
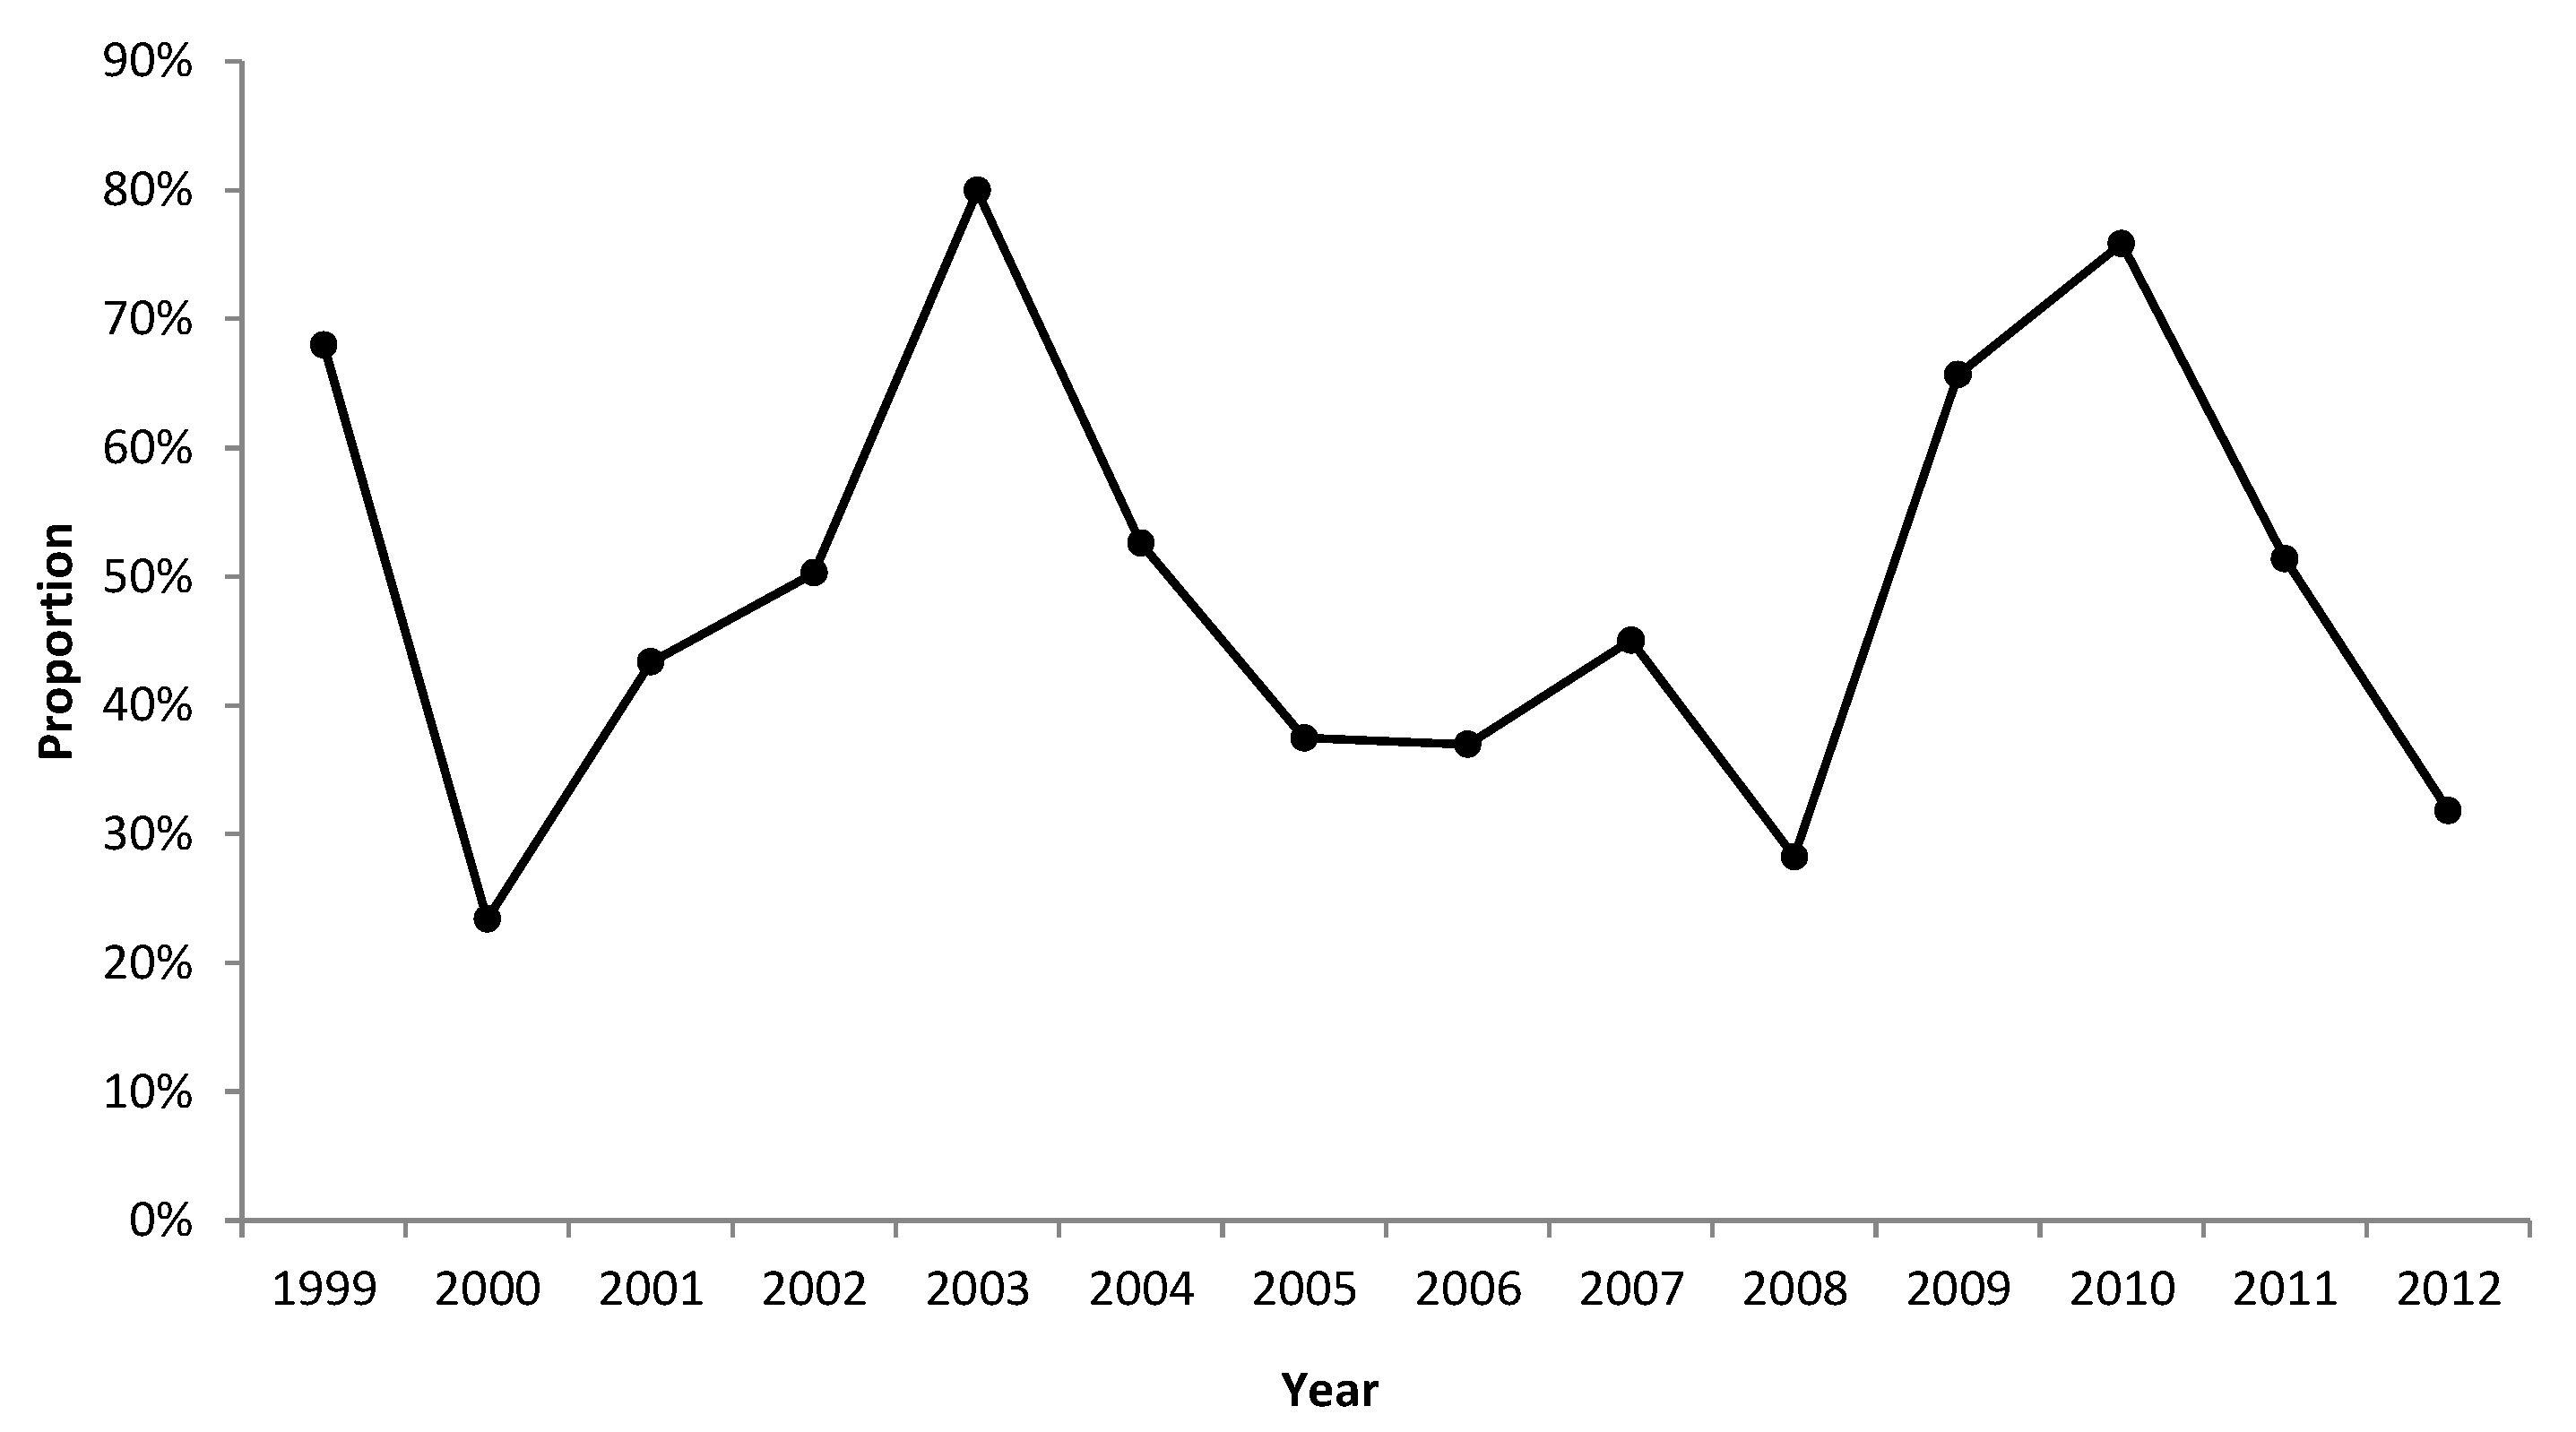
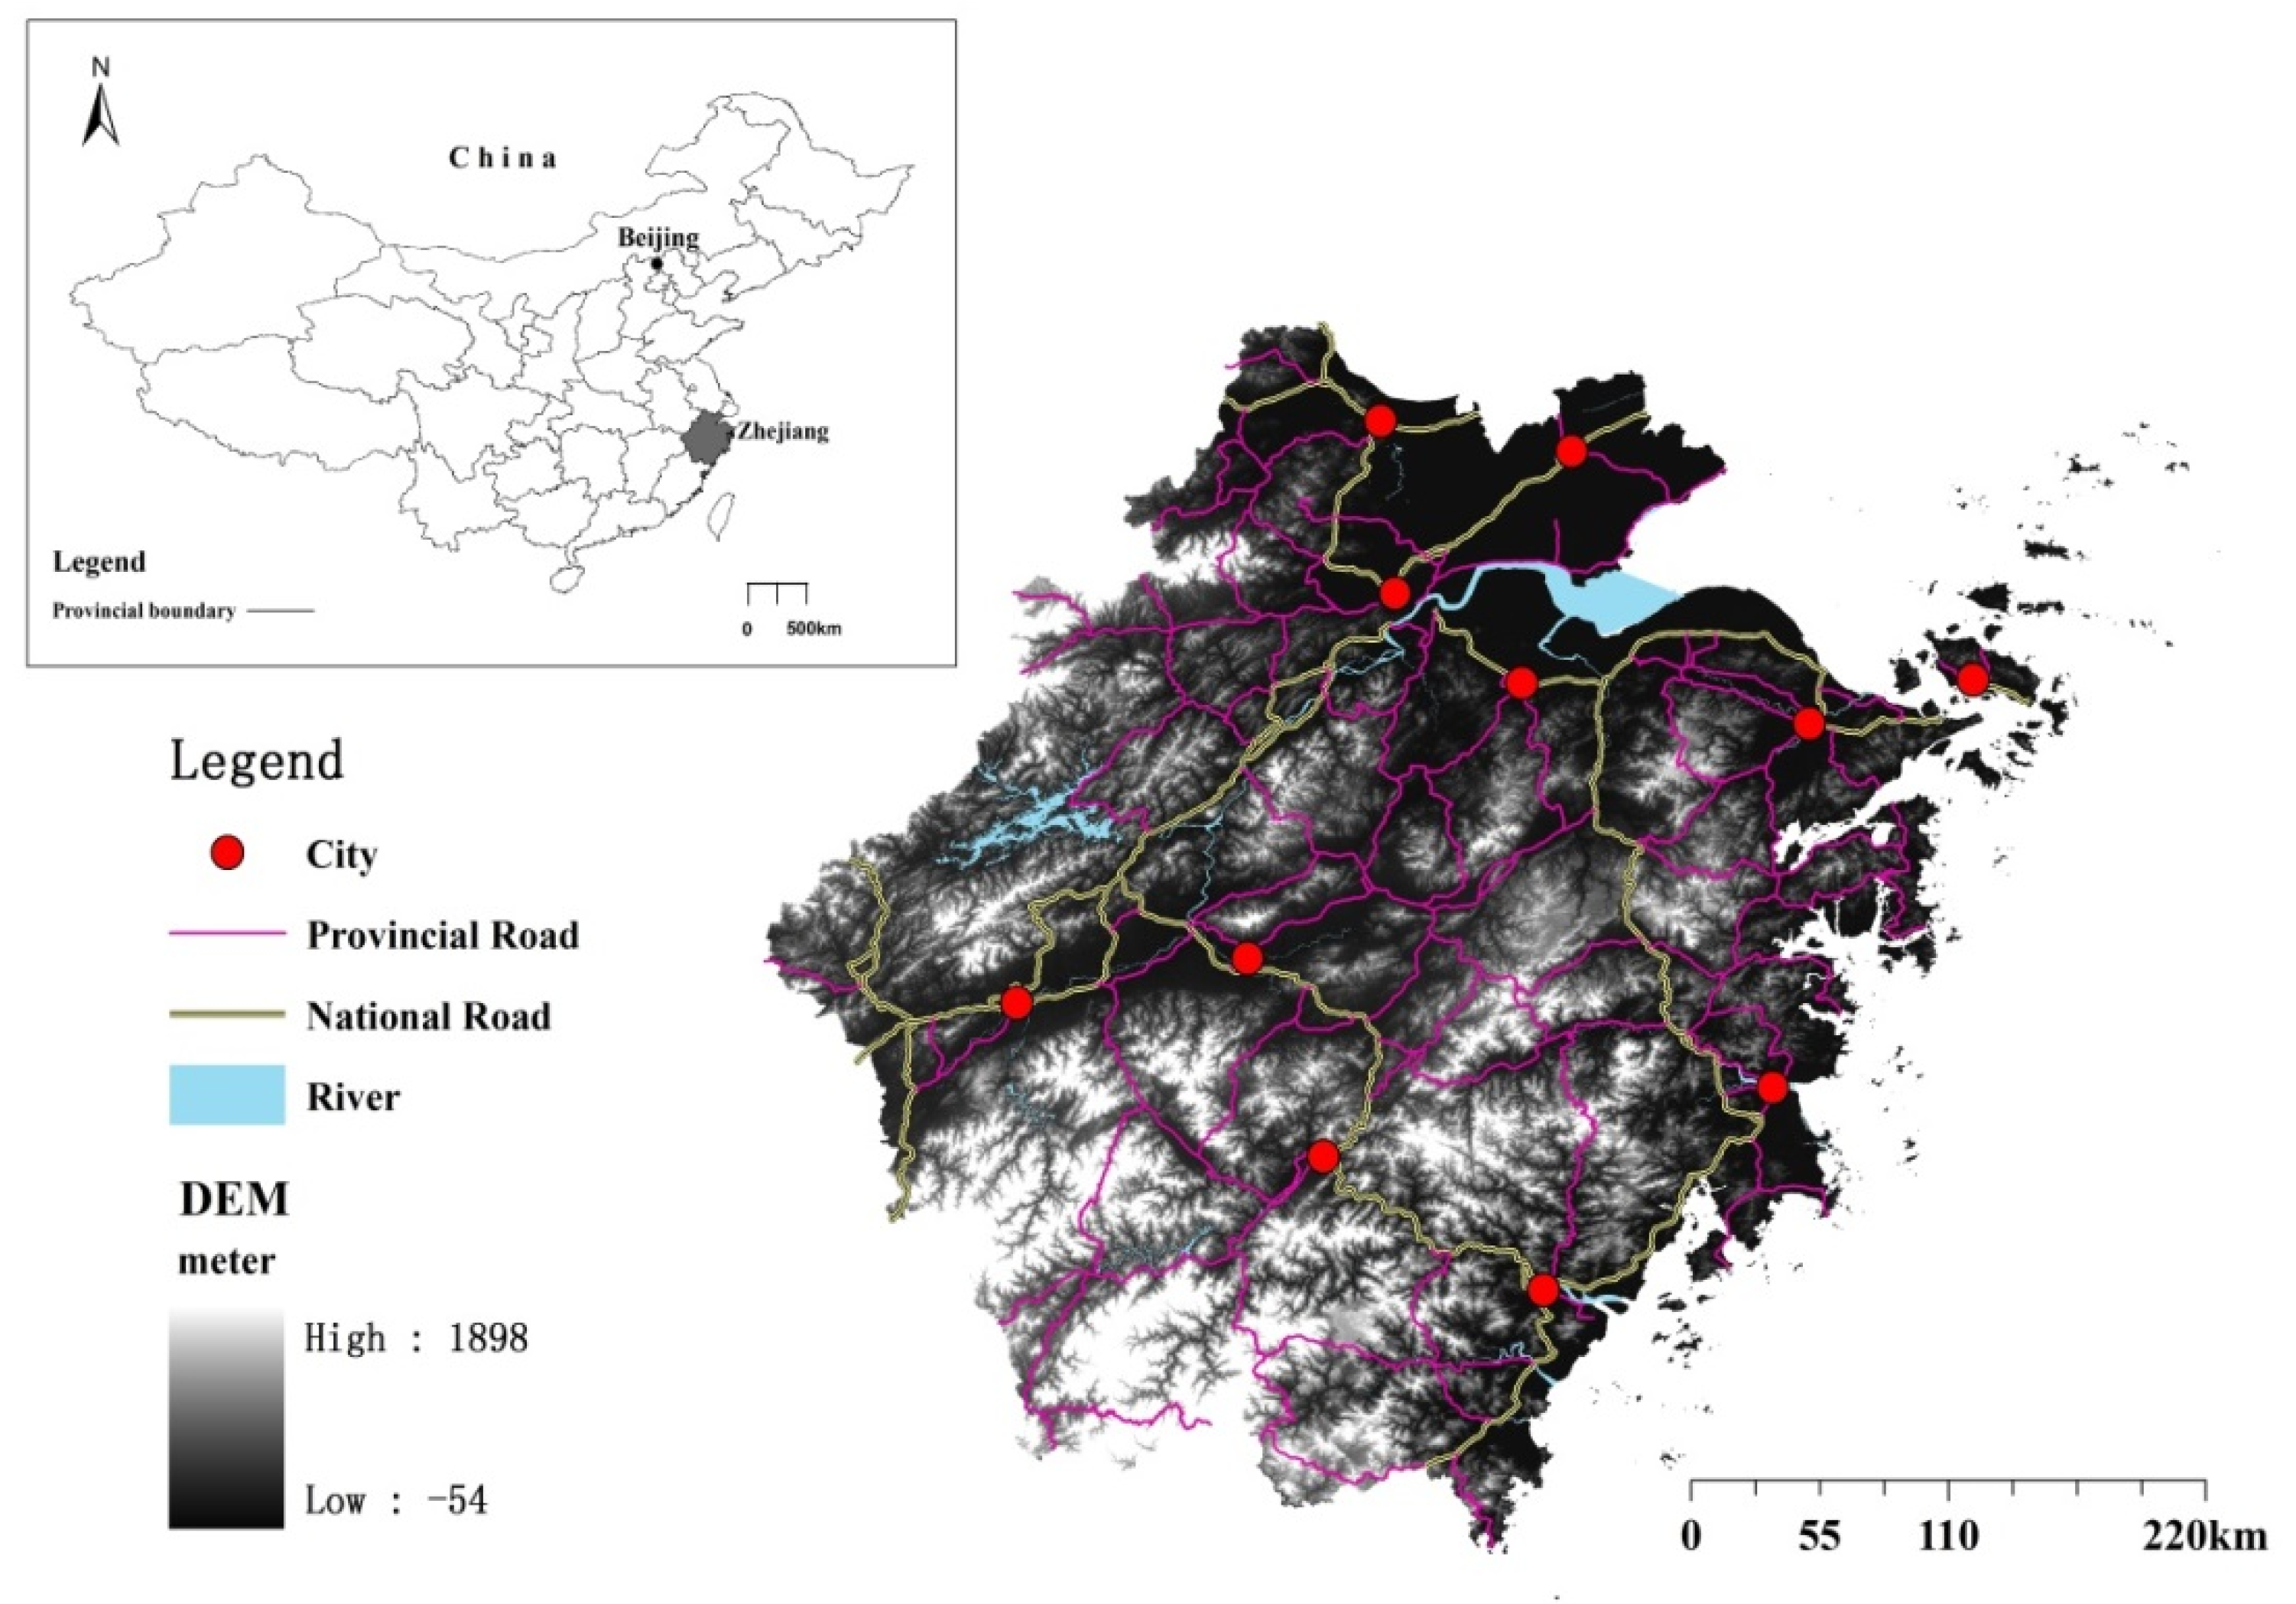
As a representative of the eastern-coast developed provinces of China, Zhejiang Province has still faced a rigid demand for construction land resource. Unlike Beijing, Tianjin, Shanghai, and Chongqing, cities that are directly administered by the central government, cities of Zhejiang Province have been under the control of the provincial government. Local governments have encouraged land transfer to boost local revenue and attract more investment. Thus, in Zhejiang Province from 1999–2012, the average proportion of the land-transferring fee to fiscal revenue was 48.98%, with the highest level being 79.96% in 2003 (
Figure 1). The substantial extra-budgetary revenue that is available through converting land use further stimulates the fiscal motives of local governments: they convert large amounts of rural use land into urban use land. This causes a phenomenon whereby the acquired lands are in disuse because of a market surplus; this, in turn, makes it possible for the developers to obtain further land use rights for low land-transferring fees. However, with rapid urbanization and industrialization, Zhejiang Province has been facing many ecological challenges such as extreme heat events, degraded visibility, air and water pollution. For example, the average visibility degraded dramatically by 1.8 km/10a during the last three decades [
13]. Therefore, Zhejiang Province should take measures to coordinate the relationship among economic, construction land use and ecology subsystem rather than passively wait for the arrival of the Kuznets curve inflection point between them.
1.1. Current Construction Land Use (CLU) in China
1.1.1. Economic Factors
Land that is newly converted to construction land is mainly transferred from agricultural land. The low cost of converting the land from an agricultural use to a construction use is the fundamental reason for the extensive use of such land. From a monetary perspective, in comparison with industrialization, the advantage of agricultural production is relatively low, and the income gap between agricultural land use and non-agricultural land use is continually increasing. Driven by the market mechanism, the high-value land-use pattern will squeeze the low-value land-use pattern. If there is no effective government intervention, then a lot of agricultural lands may be converted into construction land, which is not conducive to intensive land use.
The extensive use of rural construction land that contains rural residential land and other land of nonagricultural facilities in China reflects this point to a certain extent. To develop an urban region, the local government first acquires the agricultural land from the local farmers for a land acquisition fee. The local government then transfers the land-use rights to the developers, who pay a land-transferring fee to the local government. The existing compensation standards mean that the land acquisition fee is far lower than the land-transferring fee, which accounts for a large portion of China’s fiscal revenue. At a national level, China’s land-transferring fees in 2011 accounted for 60% of its total budgetary revenue, twice the level of 2001 [
14].
The land’ value increments are increasing in conjunction with China’s rapid economic development. With the aim of maximizing their profits arising from the land’ value increments, many developers (who obtained the land use rights at very low land-transferring fees) stockpile the lands, or temporarily stall their development. Developers delay developing lands until the land prices or the housing prices have increased greatly, resulting, in the interim, in much idle land. Currently, China’s estimated idle land volume is 667 km2 (Ministry of Land and Resources of China, 2014).
1.1.2. Institutional and Managerial Factors
The intensive construction land is influenced by numbers of factors of legal framework and land use regulation as well. First, some of the construction land (including some old towns, old villages, and old factory buildings) has fallen into disuse, is abandoned, or has a relatively inefficient use, because the functions and the characteristics of its buildings are not suitable for modern lifestyles and production processes. Second, the restrictions on the transfer of land use rights, and the ambiguous property rights, limit the opportunity to change the use of land and to improve the use intensity [
15]. Finally, the absence of rules and regulations related to extensive construction land indicates that local governments cannot help to address the problem.
1.1.3. Extensive Construction Land
Currently, China’s extensive construction land mainly falls into three categories: urban, rural and industrial construction land.
Urban construction land: Unlike the suburbanization process in the west, urban expansion usually happens in urban fringe in order to share the existing infrastructure, such as public transport. Therefore, homocentric outspread within short-distance (normally within 10 km of the city center) is the most obvious characteristics in China’s urban expansion. Without scientific and effective planning concept initially, many of urban expansions are directed by the projects, characterized by low-density spread [
16]. However, many projects are spatially scattered so that it is difficult to form industry chains and enjoy the benefits of agglomeration [
17]. Moreover, most projects are single purpose oriented, so that many suburban areas lack the infrastructure facilities, such as supermarkets and hospitals [
18].
Rural construction land: Under the dual-track policy of rural-urban development in China, millions of migrations from the rural to the urban areas are not entitled to the same social welfares as the city dwellers [
19]. This kind of insecurity drives them to constantly expand their rural residential land as pension assets. Moreover, despite millions of rural to urban migrant workers, rural homestead servitude cannot be transferred autonomously, resulting in large numbers of vacant rural houses. Additionally, undefined property rights of rural residential land, feudal systems and superstition, and nostalgia increase the difficulty of rural residential consolidation [
20,
21]. As a result, while rural population is decreasing, the area of construction land in rural areas has been increasing. In this way, more and more “village hollowing” has appeared. There has been a dramatic increase of the volume of rural housing land per capita by 18.28% from 1996 to 2007: it was 228 m
2 per head in 2007, significantly higher than the national standard of 150 m
2 per head.
Industrial land: To boost China’s industrialization progress, industrial parks have mushroomed since the 1990s. China’s accession to WTO in 2001 impelled China to be “world factory”, resulting in appearance of numerous of industrial parks. At the outset of the industrial park process, local governments transferred the industrial land use rights at very low price to attract foreign investment. This strategy led to a great quantity of industrial land and hence rapid urban sprawl, at a tragic cost of a large number cultivated land and ecological land occupied [
22,
23].
China’s 2003 national industrial park inventory accounted for 5658 industrial parks, with a planning districts of 36,000 km
2, which exceeded China’s total area of urban construction land in 2003 [
24]. Furthermore, 55% of the industrial parks are on what was formerly cultivated land. The current industrial–agricultural land imbalance and extensive industrial land use are unresolved problems [
25]. First, the actual use area within the industrial parks is limited, meaning that the land is not fully used, and the land-use efficiency is low. Even in some national-level industrial parks, the development mode is still extensive (rather than intensive), and depends on the massive consumption of land, water and energy. Second, because of the insufficient capacity to attract foreign investment, the amount of idle land is huge, especially within some provincial-level industrial parks. Third, the land use structure within many industrial parks is irrational, with a very low proportion of industrial land, and a large proportion of non-productive land such as green land, residential land, commercial land, and other infrastructure land (e.g., schools). Finally, the low industrial land prices have prevented the desirous and significant change of urban expansion model from extensive use to intensive use [
23].
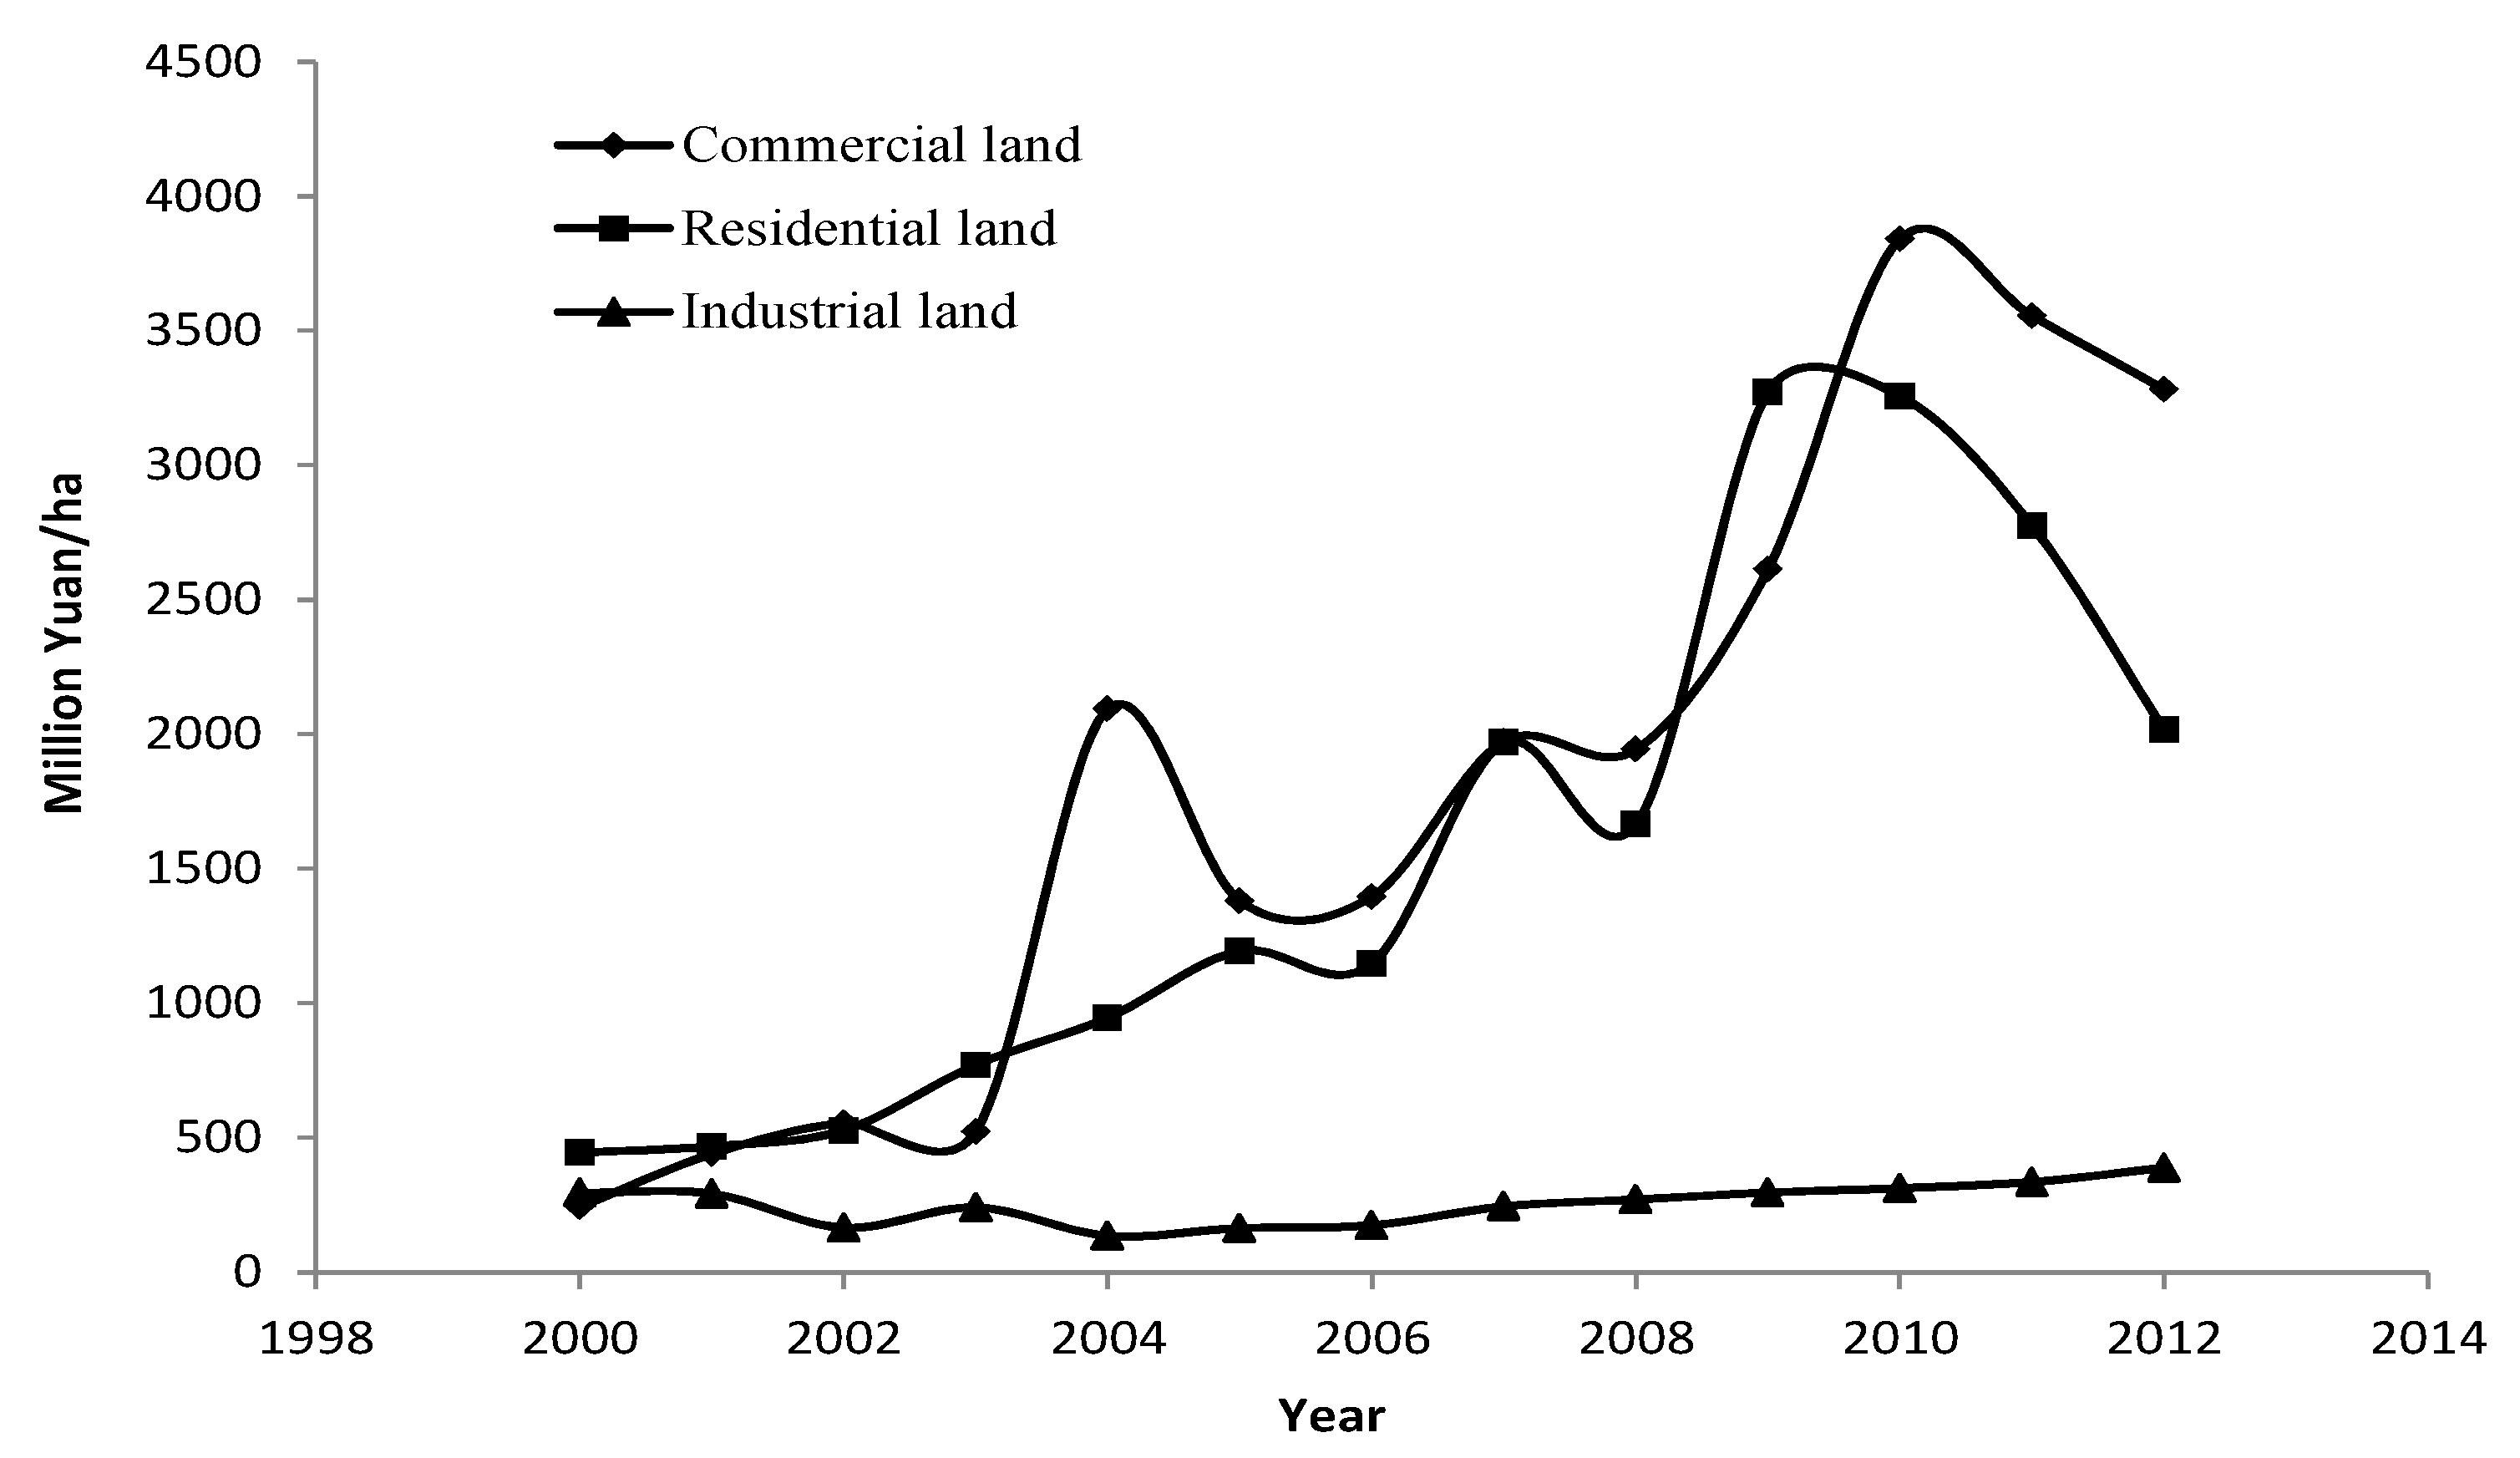
Taking Zhejiang Province as an example, during the period 1999–2012 the industrial land with a mean value of 255 yuan/m
2 (136 yuan/m
2 and 335 yuan/m
2 for the lowest and highest prices, respectively) was transferred by bid and agreement. This value was lower than the average sale prices of residential land (1573 yuan/m
2) and commercial land (1834 yuan/m
2) during the same period (
Figure 2).
1.2. Relationship among Economic Development, Construction Land Use (CLU) and Ecological Quality
Economic development is the process of social material wealth accumulation and social reproduction, during which many factors (including land, capital, labor, and technology) interact. To realize a rapid and sustainable development within limited land resources, the land should be used intensively to improve its supporting capacity for economic development. Generally, the aim of intensive CLU is to improve the use efficiency and output. Economic development has a significant effect on the intensity level of CLU. Economic development can: promote the evolution of the industrial structure; result in changing land use structures and patterns; and improve the allocation and the use efficiency of the land resources. Intensive CLU can increase the total supply of the land resources; exploit the scale effect and the clustering effect; enable economies of capital, technology and labor; promote science and technology innovation; and transform the mode of economic development and optimize the industrial land layout to further improve the quality of the economic development [
26].
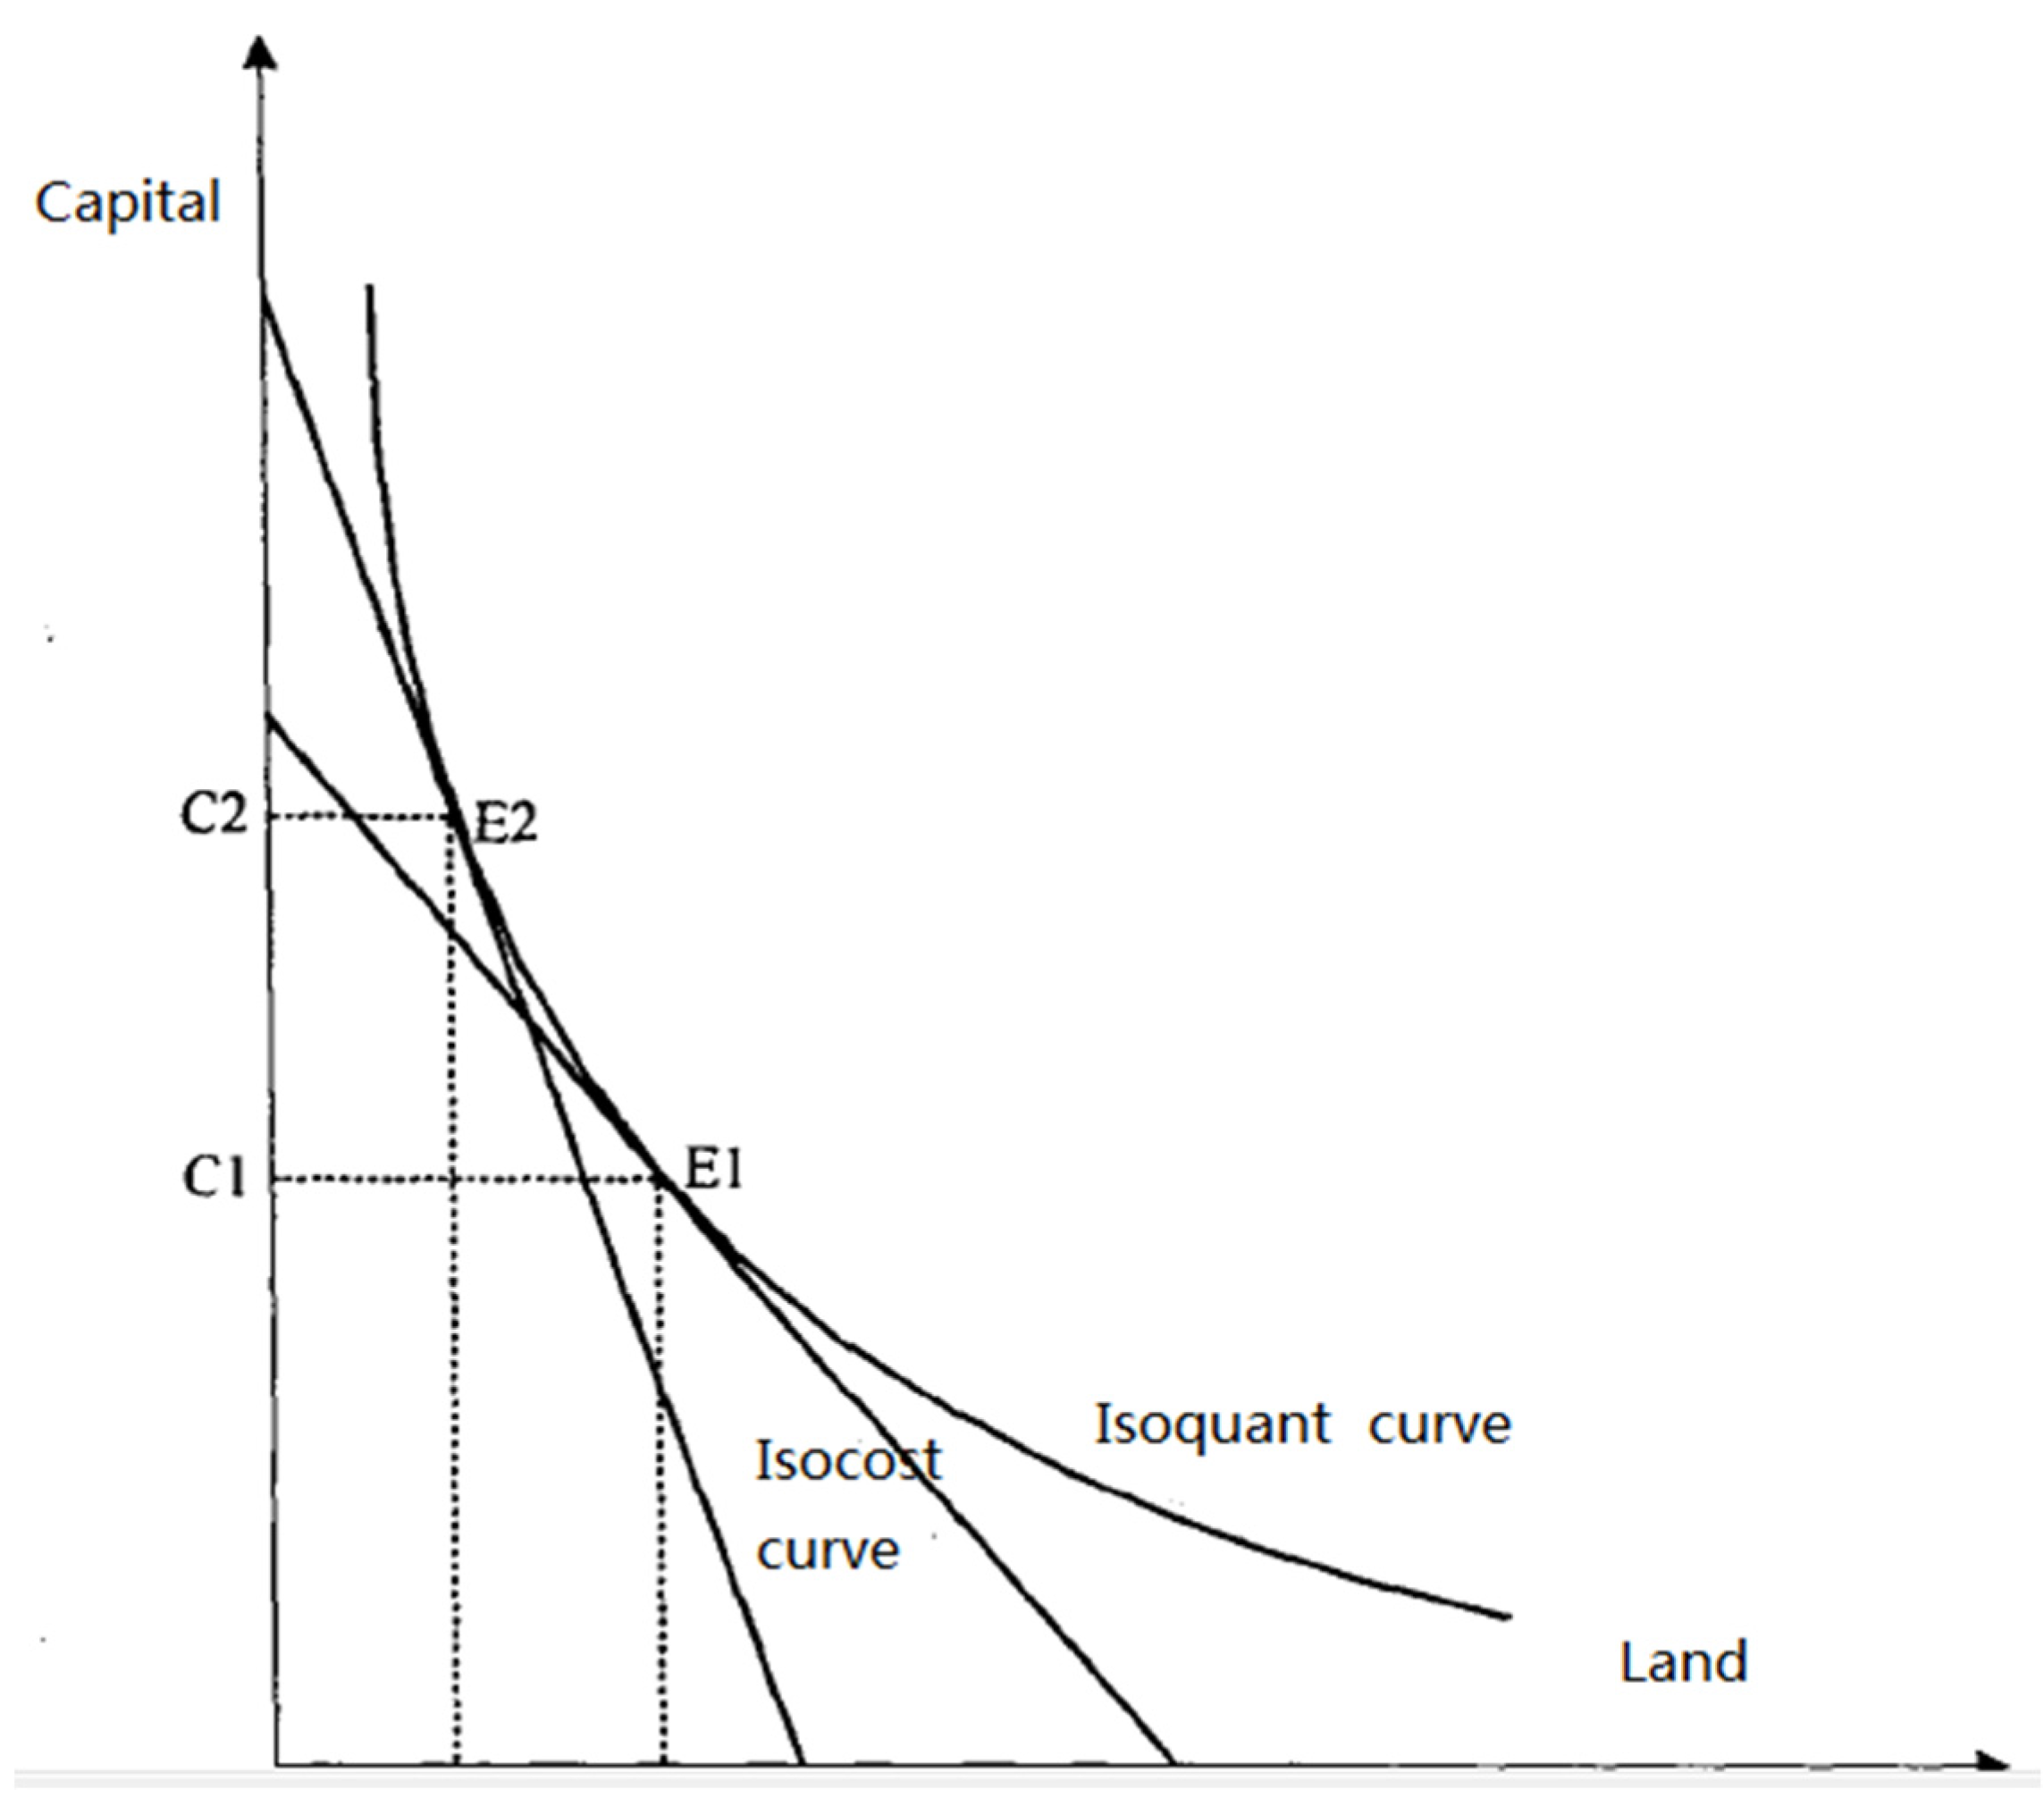
The intensity level of CLU reflects the substitution relationship between the land and capital: the higher the relative price of land, the greater the capital investment per unit land, and the higher the intensity degree of land use [
27]. According to the substitution principle, the essential productive factors can be substituted for each other to some extent. As shown in
Figure 3, the investors can control cost through combining the productive factors. Many empirical estimates indicate that the capital–land substitution elasticity is between 0.36 and 1.2 [
28].
The relationship between the integrated value of CLU and of economic development is a dynamic process. In its different stages, economic development has different patterns, and places different demands on the land resources, which result in different CLU intensity levels. Generally, the early stages of economic development are characterized by a shortage of capital: investors tend to use more land (rather than capital) in their investments, and the land is usually used extensively. As the economic development level improves, capital is continuously accumulated, and the scarcity of the land resource becomes increasingly prominent. With the relative price increase of land, the investors tend to use more capital in their investments, the land is used intensively to obtain a higher output [
27].
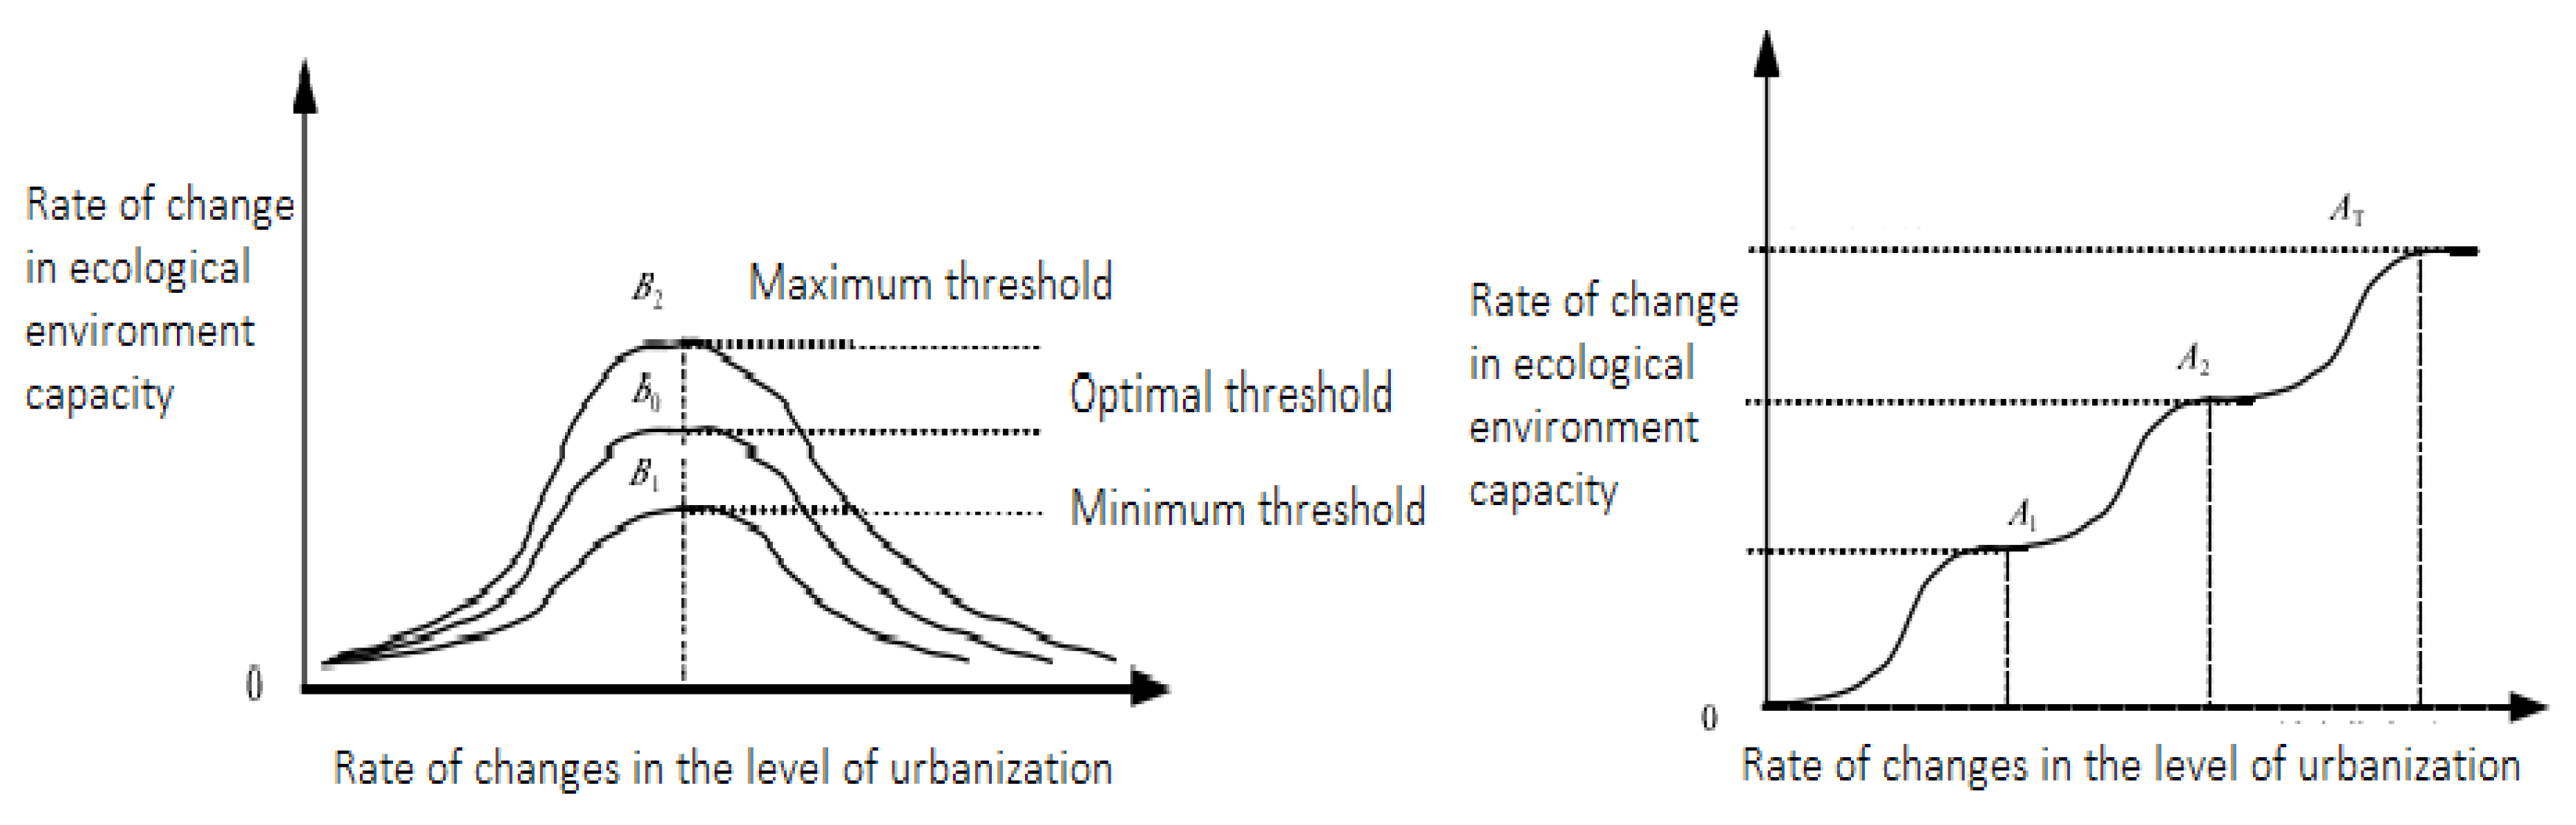
During urbanization, the dynamic change process between the socio-economic and the ecological capacity fundamentally accords with a logistic curve, called the Kuznets curve [
29,
30] (
Figure 4). This means that the socio-economic capacity stresses a coercing effect on the ecological capacity, and the effect of the latter on the former is hysteretic [
31], which is specified as a double-exponential curve [
32,
33,
34].
The coercing effect of socio-economic development on the ecological quality is analyzed from the perspectives of population agglomeration, economic growth, and construction land expansion. Moreover, the resource status, the ecological condition, and environmental pollution all limit socio-economic development [
35]. For example, although the human migration from the rural areas to the cities increases the discharge of urban domestic waster and the consumption of residential land, it also alleviates the pressure on the rural environment, especially in the ecological vulnerable region [
36].
The economic growth has caused the environmental pollution and ecological degradation, but it also has increased the resource use efficiency and the investment in ecological environment. This indicates the economic growth and technological advances have a mutual promotion effect, which in turn are beneficial to update and optimize the industrial structure. The resource allocation and the economic structure would be optimized by the interactive coercing effect between the integrated values of the socio-economic and the ecological change rates. Finally, the evolution of the integrated value of socio-economic and ecology would be promoted to a high-level harmonious coupling relationship.
1.3. Literature Review
The current studies on the relationship among the integrated values of economic development, CLU and ecological quality can be roughly classified into two categories. The first category argues that land is an indispensable production factor, and that economic development is one of the driving forces of construction land expansion. The case studies that follow this rationale examine how the expansion of construction land promotes economic development at the national, provincial, and county levels.
Chen (2010) concludes that GDP is the biggest driving force for the expansion of construction land by analyzing the different driving forces in China’s regions (east, middle, and west) and at the national level [
37]. Shu (2013) reveal that economic development, population growth, and industrial structure adjustment are the main driving forces of urban sprawl, and that urban construction land plays an important role in economic development and in the urbanization process [
38]. Ye
et al. (2012) find that a regional socio-economic development would not only drive the expansion of construction land itself, but would also lead to the construction land growth of the ambient areas [
39]. Lin
et al. (2015) discusses how urban population agglomeration, industrial growth and investment drives land urbanization in different scales of cities in China [
40]. There are evident regional differences for the expansion of construction land, and from 1989 to 2000 the expansion rate decreased slowly in China’s east region but increased rapidly in China’s west region. This difference arose because the construction land in the east was used intensively and the economic development did not cause an increase in per capita construction land in this region. Conversely, in the west, the construction land expanded very quickly at a two-dimensional (extensive) level, rather than at a three-dimensional (intensive) level, because of the relatively cheap land price, and because of the local policies to attract investment [
41,
42].
The second category of integrative studies explores the interactive coupling effect among the integrated values of economic development, CLU and ecological quality, by analyzing the nonlinear relationships. For example, Deng
et al. (2010) analyze the relationship between economic growth and the urban core area with ordinary least squares and spatial statistical analysis [
43]. Hui
et al. (2015) reveal a positive coupling relationship between the urban scale and the land use intensity in 120 major Chinese cities in 2009, followed by the application of a structural equation model [
44]. Cen
et al. (2015) develop a coupling coordination to evaluate urban sustainability, and to discuss the interaction between the intensive land use and the landscape ecological security [
45]. Nonomura
et al. (2009) analyze the how extensive urban expansion and industrialization affect the atmospheric environment, using a 30-year data set to explore the impact of a low populated urban sprawl on the thermal environment [
46]. Wang
et al. (2014) apply an interactive coercing model to explore dynamic coordinated development of urban expansion and the change of environment in China [
47]. Peng
et al. (2016) establish an ECC (Ecological Carrying Capacity) model in the low-slope hilly regions to quantify potential of continuing population agglomeration, urbanization, and industrialization, in order to consider balance between mountain development and ecological protection[
48].
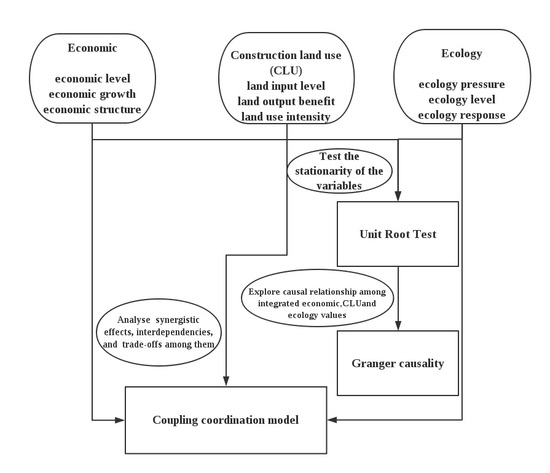
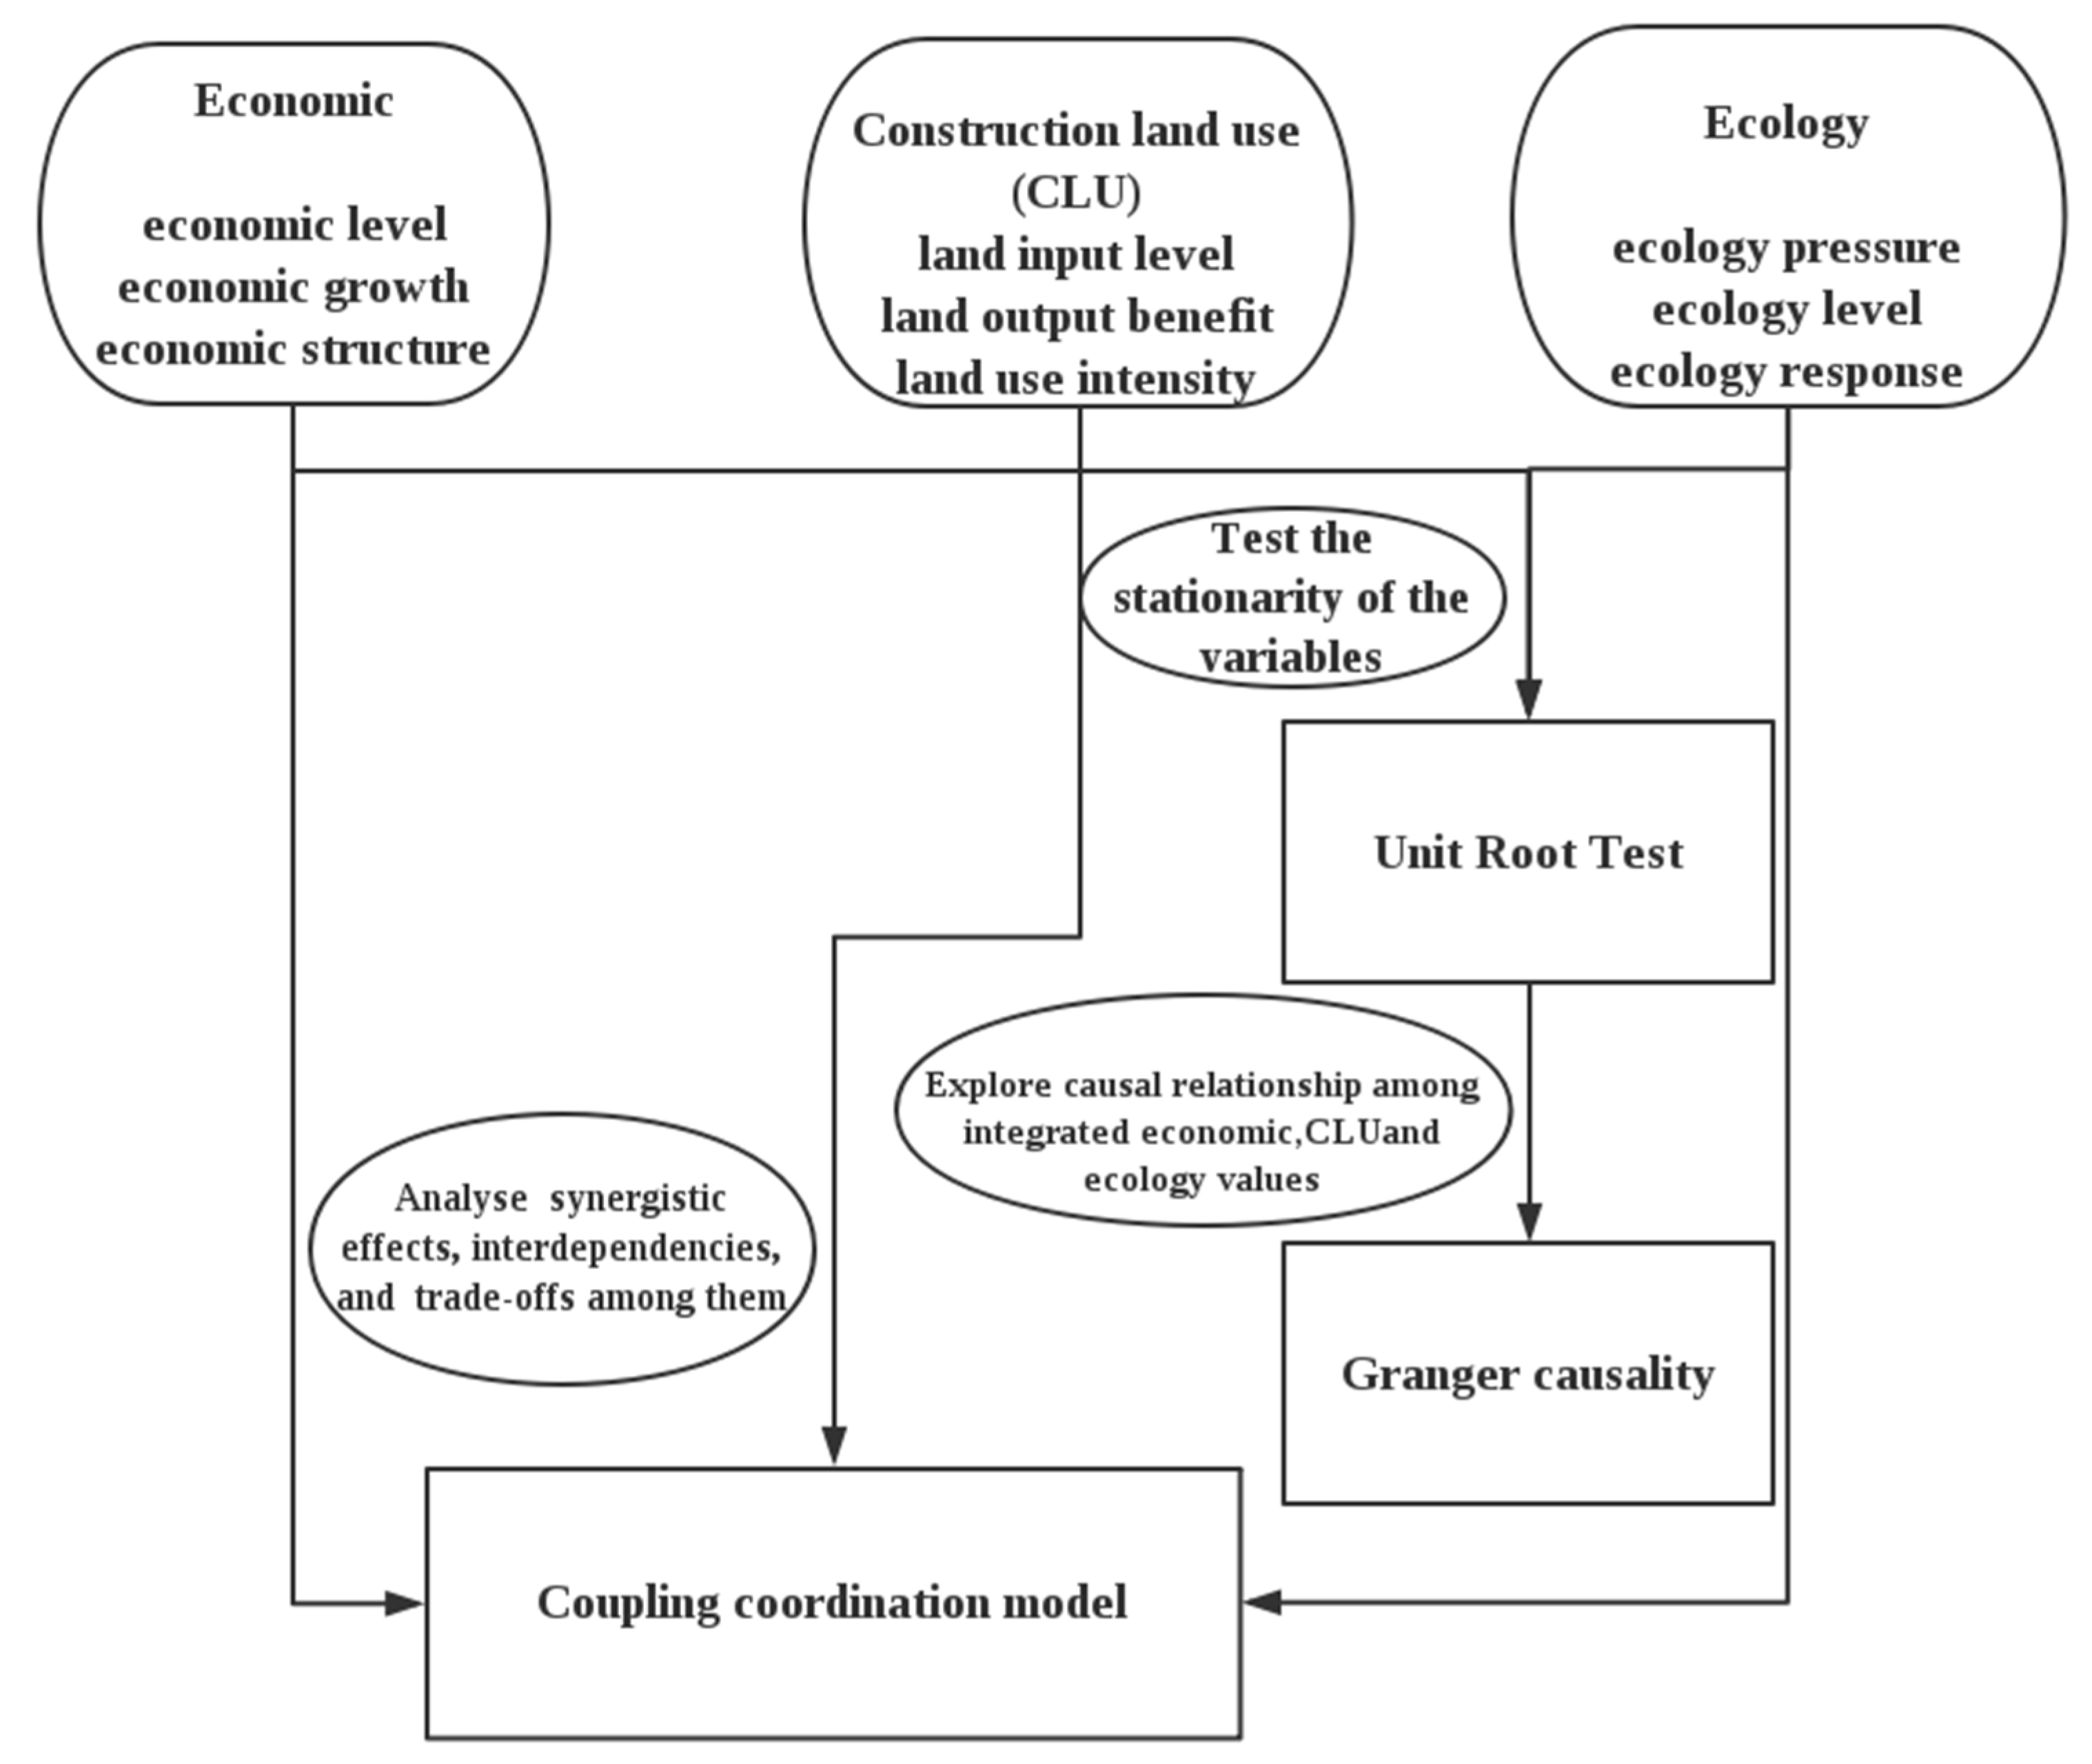
The overall goal of this paper is to deepen understanding of the relationship changes in an integrated approach to the economy, CLU, and ecology in different stages of economic development in Zhejiang Province, China. Firstly, we apply a Granger causality test to explore the causality among economic growth, CLU and ecological quality, and an evaluation index system is proposed. Secondly, the study analyzes changes of the coupling coordinated development pattern and the constraints in different development stages based on a coupling coordination model.
3. Results and Analysis
3.1. Integrated Values for the Economic, the CLU, and the Ecology Subsystems
We compiled the integrated values for the three subsystems from their constituent indicators, shown in
Table 1.
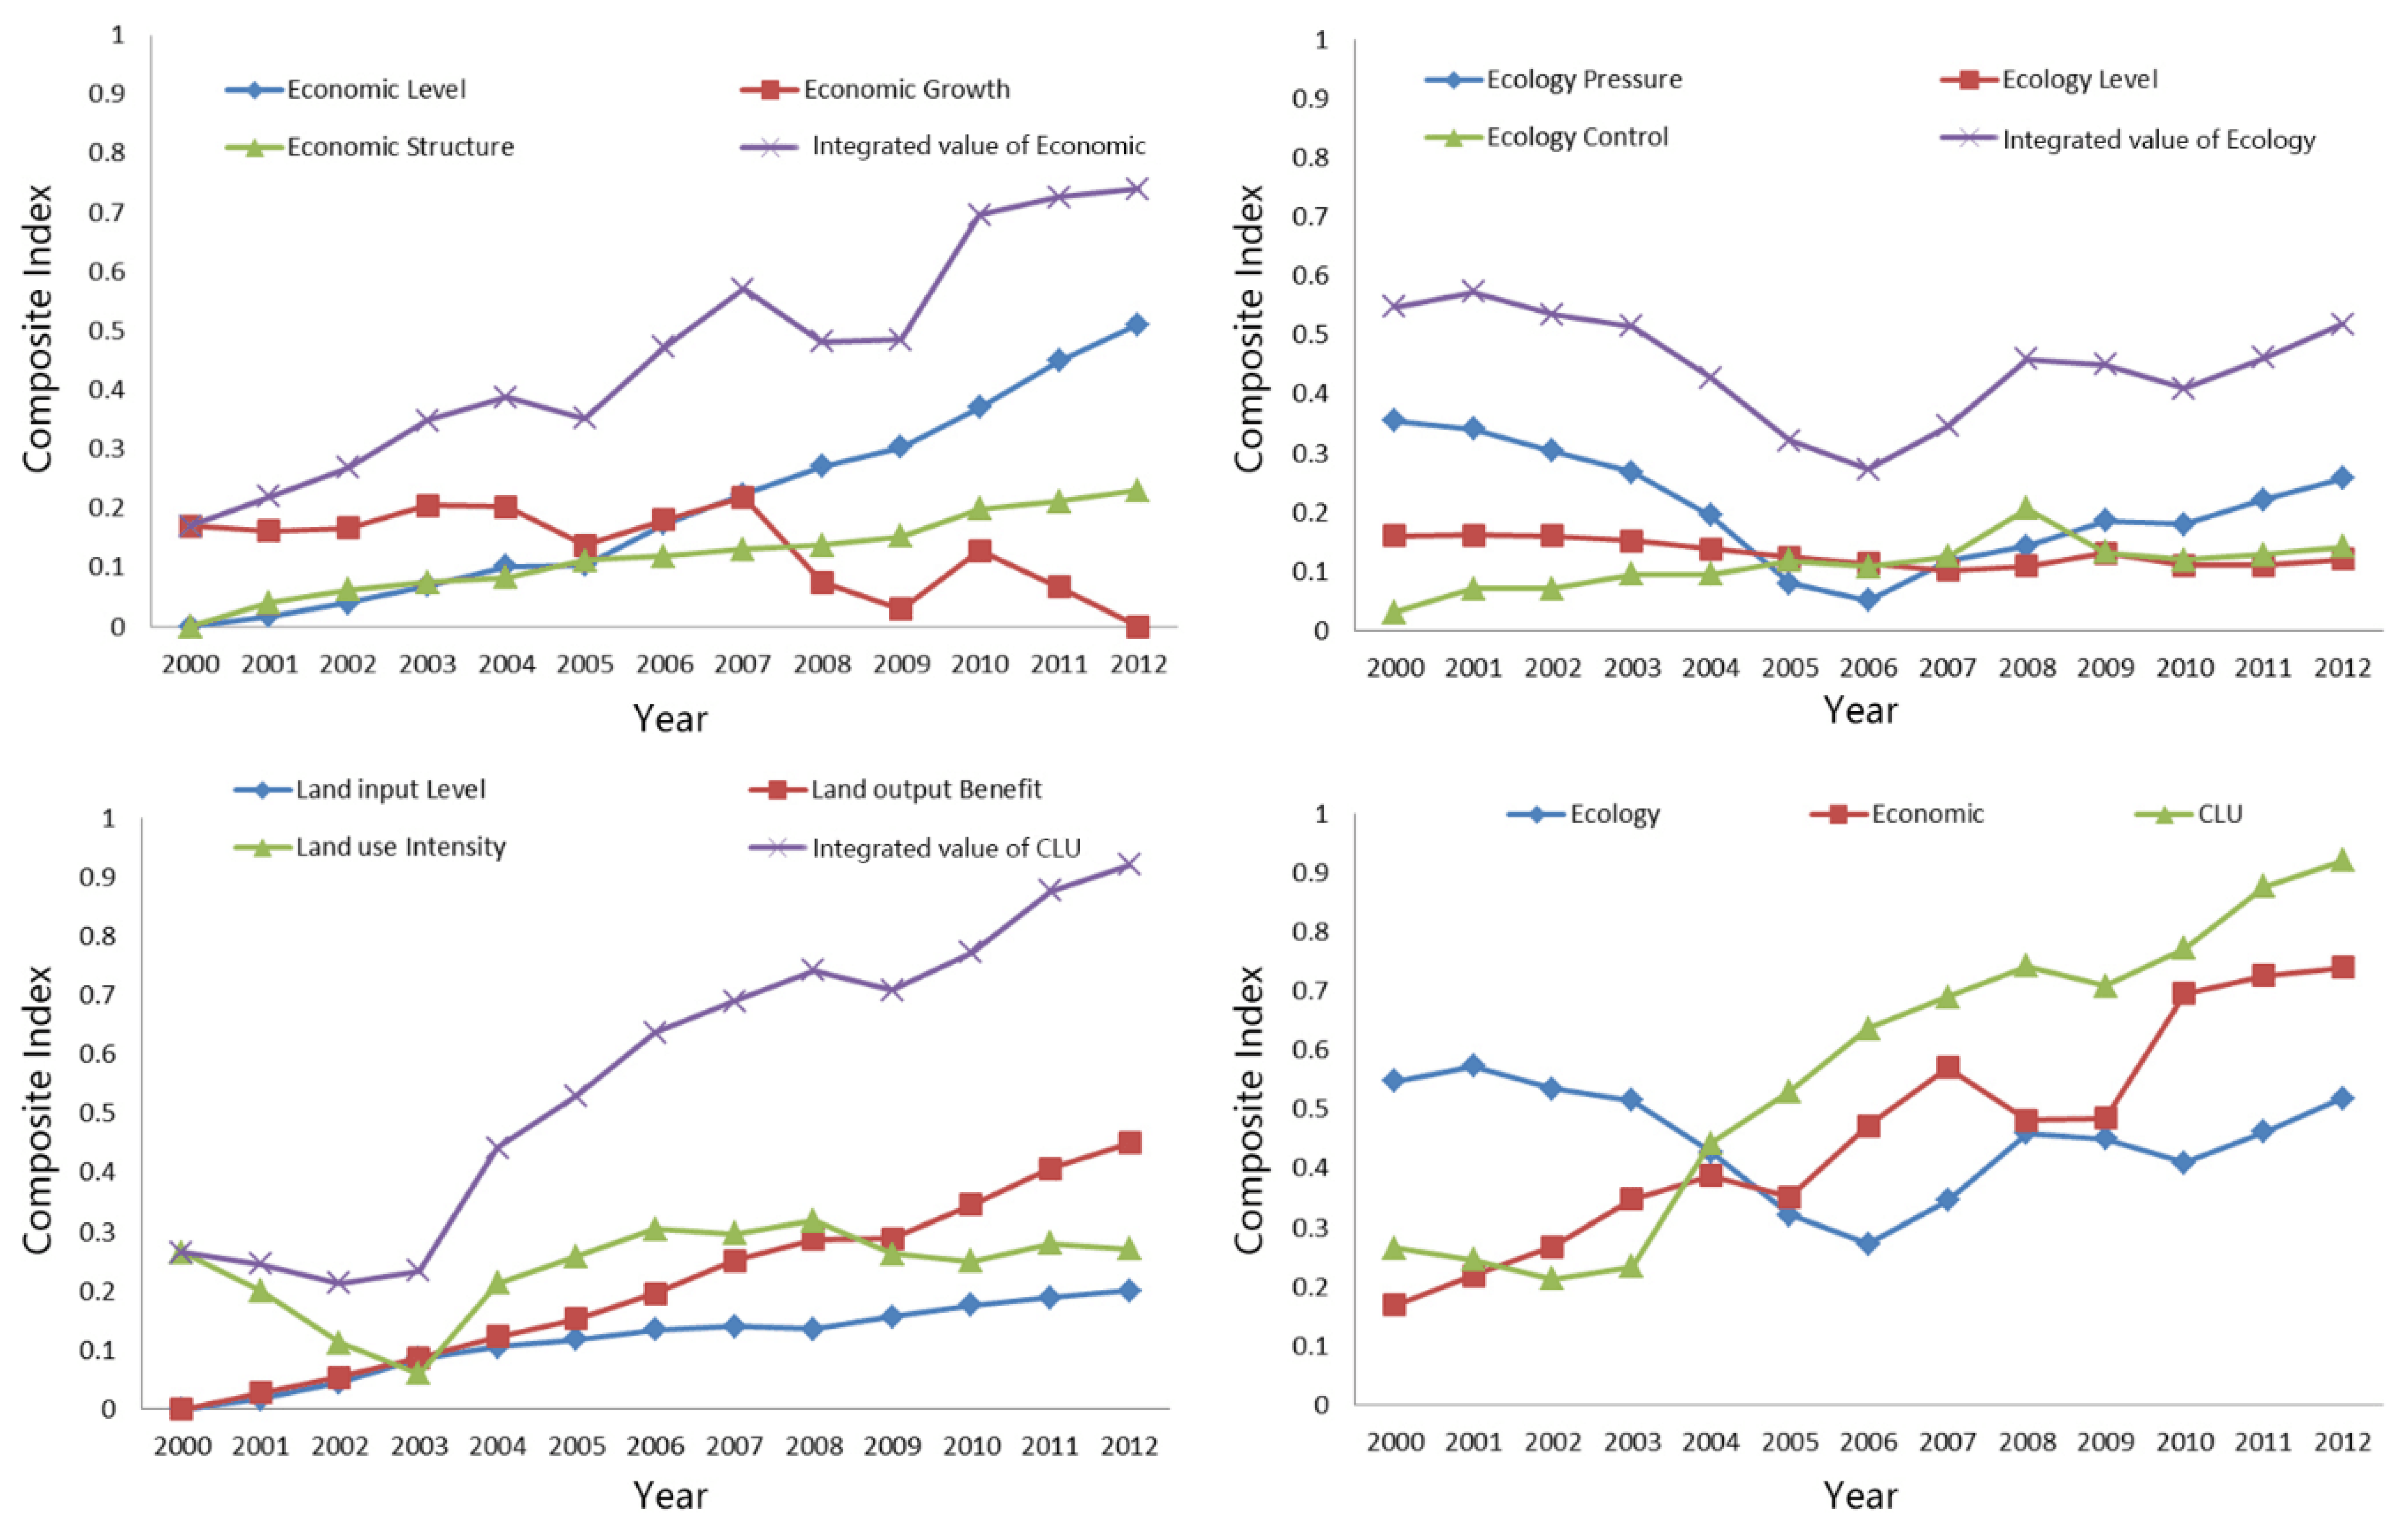
Figure 7 indicates that the integrated value for the ecology subsystem firstly declined, and then began to increase (with fluctuations) during 2000–2012, with appearances of points of inflexion in 2006, 2008 and 2010. The ecology pressure trend is similar to that of the integrated value for ecology, indicating that ecology pressure has a significant effect on the integrated value for ecology. The ecology subsystem trend for 2000–2006 was extremely similar with that of ecology pressure; from 2006–2010 it was consistent with ecology control; and during 2010–2012 it was consistent with ecology pressure and ecology control. There was a decrease of the values for ecology pressure and for ecology level in 2001, leading to a fall in the integrated value for ecology. This decrease was primarily caused by a sudden increase of built-up areas because of administrative regional adjustments. The integrated ecology value subsequently increased, as the ecology control values increased. However, the integrated ecology value was degraded under accumulated pressure.
The integrated value for the economic subsystem showed an increasing trend from 2000 to 2012, with two decreases in 2005 and 2008 (
Figure 7). The integrated economic trend shows a similar trend to economic growth from 2000 to 2008, and a subsequent increase. The economic development level shows a consistent rapid increase, with economic structure also consistently improving, but at a slower rate. We conclude from this, that the current industrial adjustment needs further promotion.
The integrated value for the CLU subsystem increased consistently from 2000 to 2012, with a drop in 2009 (
Figure 7). The integrated CLU trend showed a similar trend to that of land use intensity for 2000–2009, while after 2009 it was consistent with that of land input level and land output benefit. From 2003 to 2008, the values of all the constituent indicators increased, leading to an increase of the CLU integrated value. Since 2009, the CLU integrated value increased despite land use intensity decreasing, because the land input and the land output benefit values increased.
In 2000, the integrated ecology subsystem value was nearly twice that of the CLU subsystem, and roughly three times of that of the economic subsystem. Zhejiang Province was characterized by rapid urbanization and extensive economic development, along with deteriorating pollution and ecological pressure. The economy could be improved by a demographic increase; however, this would result in further ecological pollution, and in lagging urban infrastructure. Therefore, an increase in the non-agricultural population in the province aggravated the contradictions between humans and the land. China’s new urbanization strategy and its ecology civilization construction since 2007 emphasize high technology and accessional value, high economic benefits, less resource consumption and less eco-environment pollution. These strategies reduced unfavorable influences of disordered urban expansion and extensive economic development on the ecology.
3.2. Granger Sausality Test: Integrated Economic, CLU, and Ecology Subsystem Values
Before conducting the Granger causality test on the integrated economic–CLU–ecology values, whether all the variables were stationary or not was necessary to test. We applied an ADF-Fisher test [
59,
62] to unit root test. From
Table 2, we concluded that all of the variables were not stationary at levels but were stationary at the first difference.
Because all of the variables were stationary at an order of one, 12 cointegration statistics contained in the Johansen cointegration test were used to estimate the long-run relationship among these variables. The trace test results clearly (
Table 3) indicate three cointegration relationships at the 0.05 level.
The Granger causality test results for the integrated economic–CLU–ecology values (
Table 4) indicate there exists a one-way causal relationship between the integrated value in the economic and the ecology subsystems: the change of the integration value of Economic was the Granger cause of that of Ecology. There is a similar result in the Granger causality test for the economic and CLU subsystems, showing that the change of the integration value of Economic was the Granger cause of that of CLU.
The results reveal that an extensive economic development in the initial stage of development would cause deteriorating pollution, non-agricultural population growth, and ecological pressure. Contrastingly, an intensive economic development mode (featuring low energy consumption, and an energy consumption structure adjustment) could reduce carbon emission intensity that could mitigate ecology pressure. With economic restructuring and an industrial structure adjustment, the construction land use structure could be optimized; hence improving the use and the allocation efficiency of the land resources. However, the improvement of the CLU integrated value did not significantly enhance economic development, which overwhelmingly depended on the increase of factor inputs.
Moreover, there is a two-way Granger causality relationship between the change of integrated values for ecology and CLU. This is because the physical and the economic intensities of CLU promoted the elements, and the condition of the ecosystem (particularly the carbon emission intensity), which led to ecology process changes.
Over 66% of the world’s energy is consumed in urban areas, along with the production of over 70% of the global carbon dioxide (CO
2) emissions [
64]. The optimization of industrial structures following energy restriction and energy conservation practices, urban planning and spatial optimization strategies are all shown to play an important role in the mitigation of CO
2 emissions [
65,
66,
67]. Accordingly, an urban land use with a compact development pattern would help to reduce CO2 emissions through improving urban eco-efficiency and resource efficiency, such as commuting eco-efficiency [
68,
69]. Additionally, the implementation of ecological conservation could regulate the land allocation and the configuration in the CLU, such as a basic farmland protection policy and new construction land control.
3.3. Integrated Value for the Economic, the CLU, and the Ecology Subsystems: Coupling Results
3.3.1. Ecology–Economic Analysis
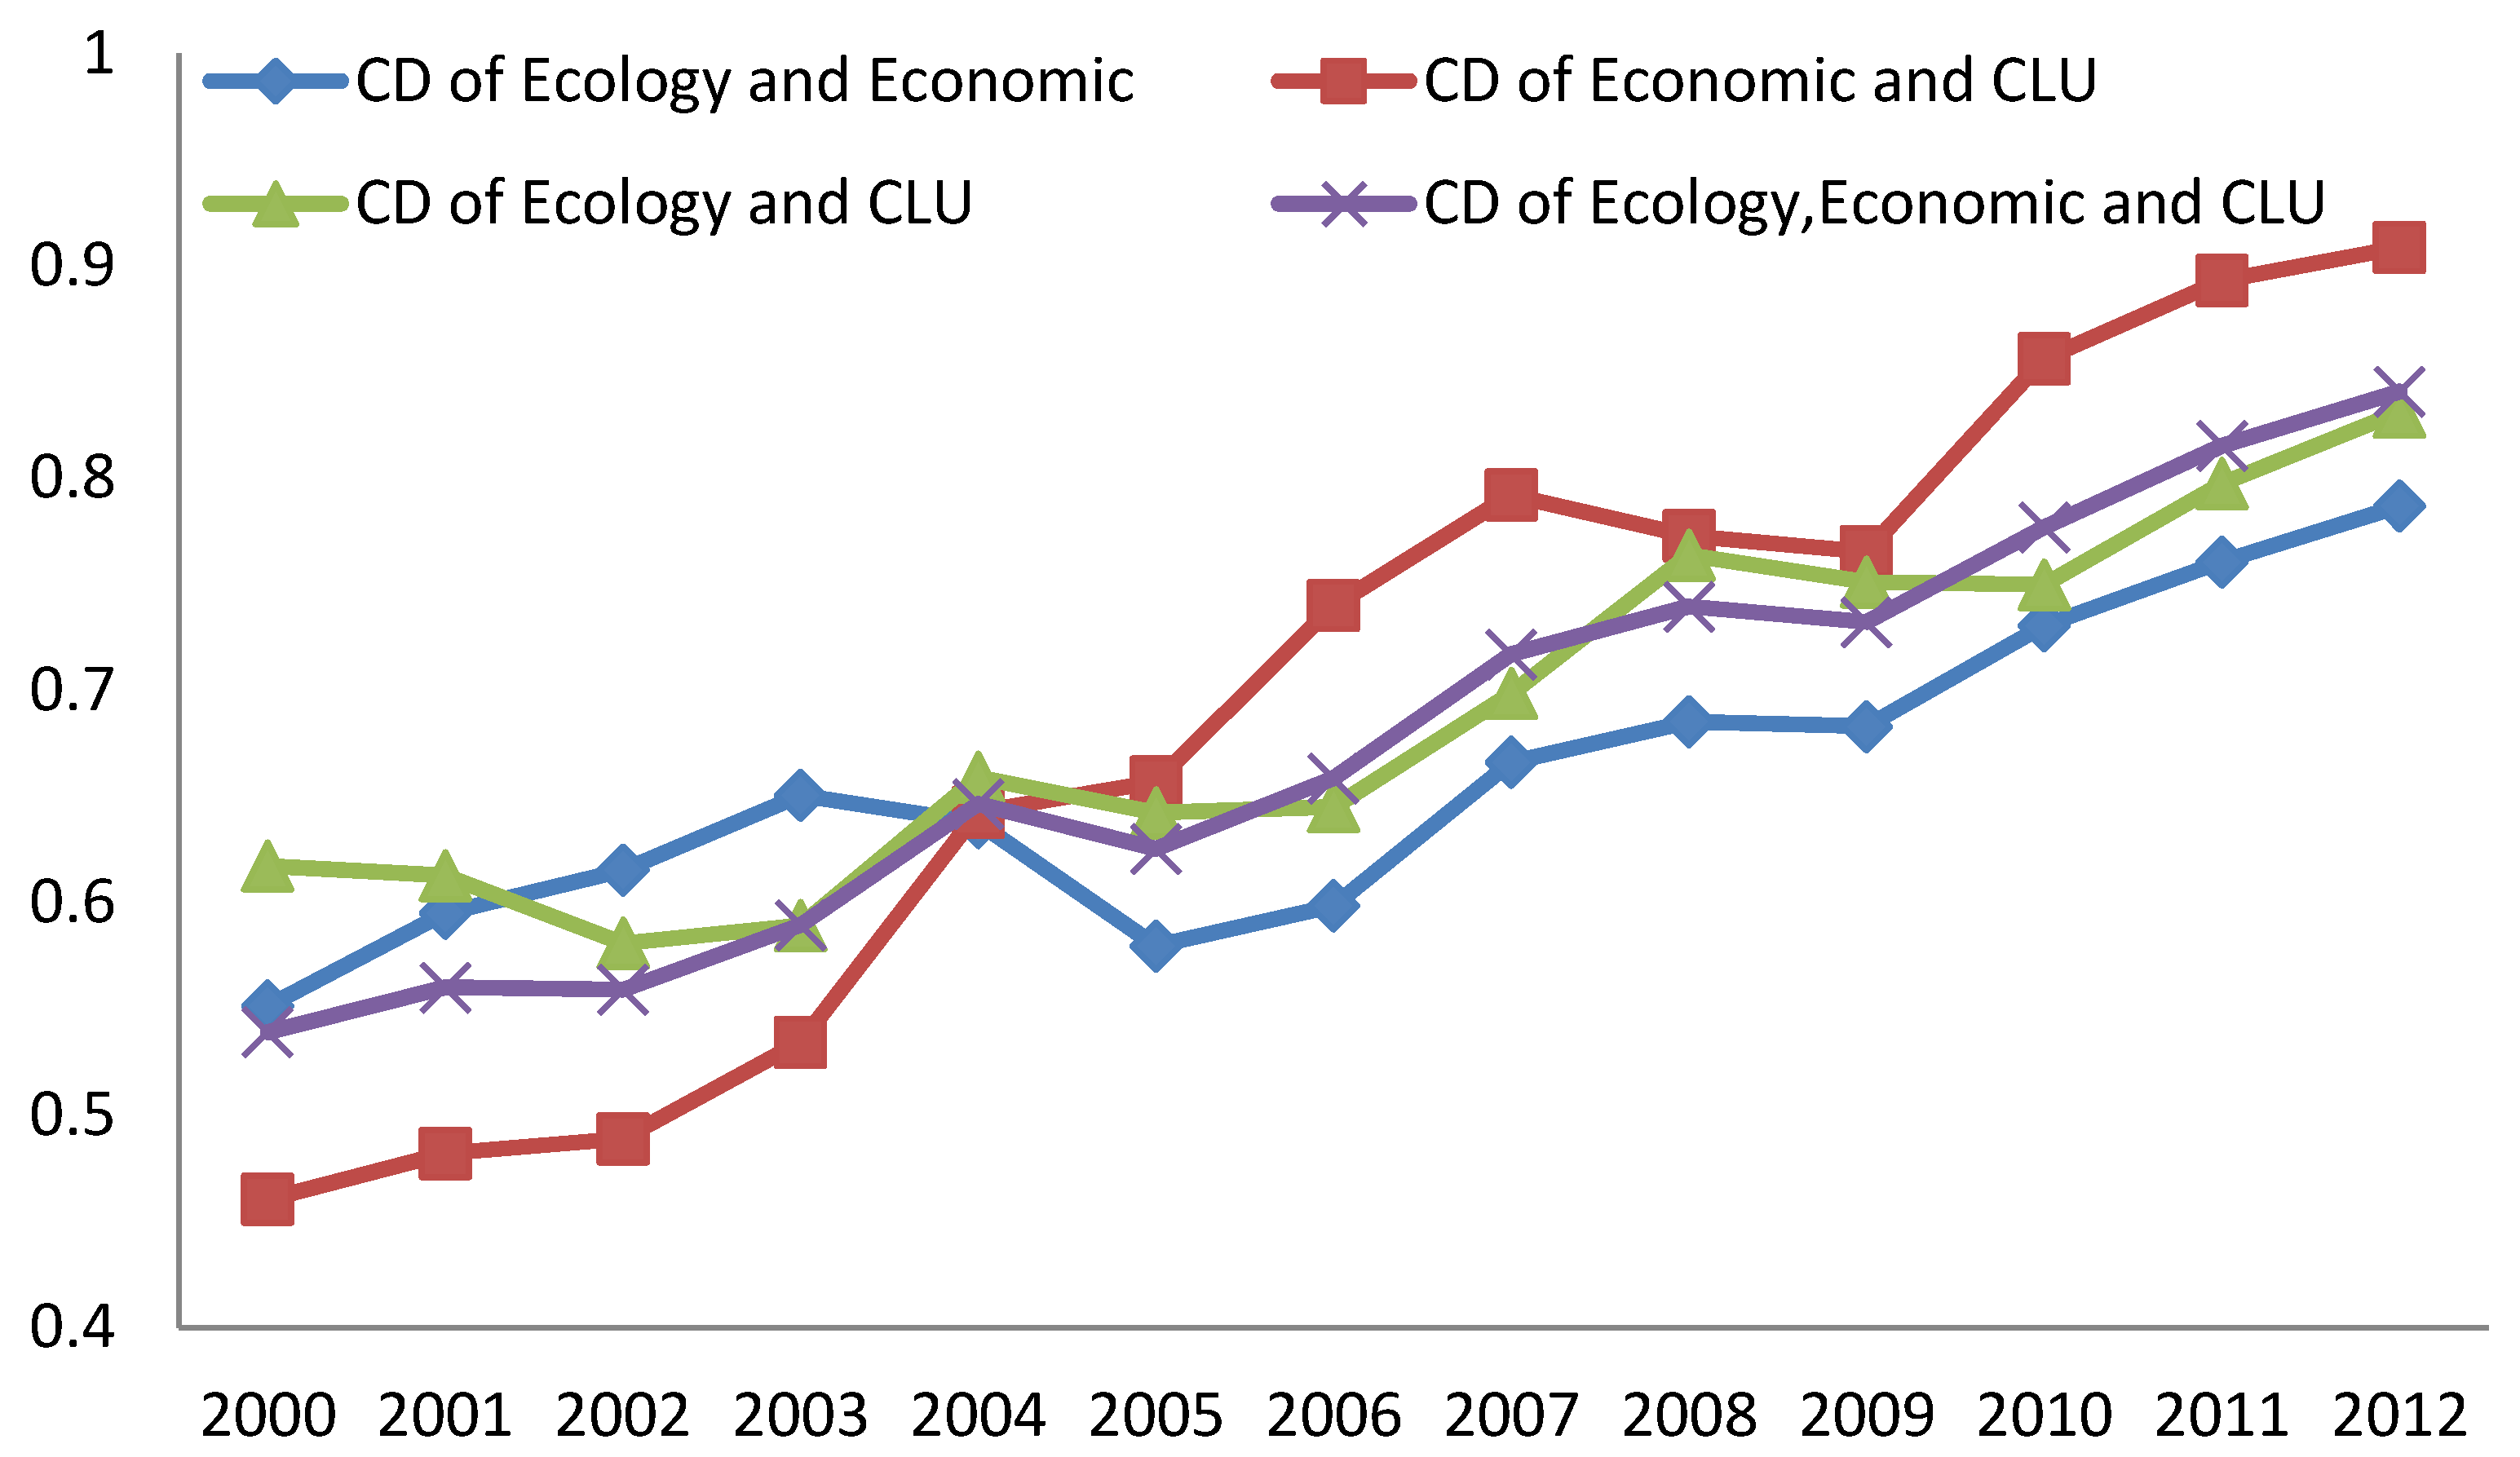
The ecology and economic Coupling Coordination Degree (CD) initially increased, then decreased, and finally rose consistently, producing an S shaped curve for 2000–2012 (
Figure 8). The ecology and economic CD increased by 44.4% over the 13 years, showing a growth in the balance between ecological and economic development. There was a clear decrease from 2003 to 2005, which could be concluded as the rapid economic development being beyond the capacity of the ecology. China joined the World Trade Organization in late 2001, and the extensive development model relating to this had a strong impact on resources, energy, and eco-environment. This imbalance likely occurred because China’s local governments focused more on economic development than on the environmental carrying capacity. China launched a resource-saving and an environmentally friendly society construction strategy in 2006, at the start of its 11th five-year plan. This policy resulted in the 34.5% increase in the Ecology and Economic CD from 2006 to 2012.
3.3.2. Economic–CLU Analysis
The Economic and CLU CD increased gradually from 0.46 to 0.81 from 2000 to 2012, with a slight fall (3.8%) from 2007 to 2009 (
Figure 8). This decrease implied that the global financial crisis had a serious impact on the land market, resulting in idle construction land. The local governments had a lack of funds, and lowered land prices to attract investment, which aggravated the inefficient industrial land use from 2000 to 2002. The urban expansion that started in 1998 had been misunderstood as constructing cities; this resulted in inefficient infrastructure use, and the huge waste of arable land resources. Therefore, there was a barely balanced economic and CLU development during 2000–2002. With urban development, the scarcity of the construction land resources improved the land input; this caused a turnaround to a better coordinated relationship between the economic and CLU subsystems. After 2010, another economic growth recession resulted in a slower increase in the economic and CLU CD.
3.3.3. Ecology–CLU Analysis
The ecology and CLU CD increased from 0.61 to 0.84 over the 13-year study period (
Figure 8), which indicated that the coordination of the Ecology and the CLU subsystems was in a promotional process.
The trend of the ecology and CLU CD presents in three U-shaped curves from 2000–2012. The first U-shaped curve appeared from 2000 to 2004, with an inflection point in 2002. It should be pointed out that at a later stage of this period, the integrated CLU has begun to improve but that of ecology has kept declining. This indicates the integrated ecology subsystem is fragile and difficult to resume shortly. The second U-shaped curve occurred from 2004 to 2008, with an inflection point in 2006. In this period, the integrated CLU value gradually increased, while the integrated ecology value decreased, except for a rapid rise in 2008. This indicates once the ecological destruction was accumulated, it was difficult to recover to original state. Finally, the third U-shaped curve occurred from 2008 to 2012, with an inflection point in 2010.
In the initial period of urbanization, the CLU integration was less developed, and the Ecology integration was at a relatively high level. With urban expansion, human enjoyed benefits and facilitation by CLU, but the efficiency of CLU was restricted by technological level of social progress and people’s consciousness. Similarly, the development of the ecology subsystem integration provided human value and wealth; however, the resilience, adaptability, and transformability of the socioeconomic–ecological systems restricted it.
3.3.4. Economic–CLU–Ecology Analysis
The economic–CLU–ecology CD increased roughly by 55.5% from 2000 to 2012 (
Figure 8), which indicated an increase in the balance among them. During the 2000–2004, the curve presents a similar trend to the economic–CLU CD curve, and thereafter is consistent with the ecology–economic CD curve. This indicates that coordination relationship of the economic aspect had the most overwhelming effect on the economic–CLU–ecology coordination because natural resources and human wealth were strongly affected by the rapid economic development.
4. Discussion
4.1. Trade-offs among Economic Growth, CLU Development, and Ecology Protection
Under the background of ecological civilization construction and new urbanization, with serious conflicts among land usages, ecological protection and economic growth, it is important to clear pivotal constraints of each period and identify priority sequences of economic, CLU, and ecology subsystems development.
Based on the Granger test, we find economic subsystem is the key for the sustainable development of modernization development and ecological protection because the change of integrated economic subsystem was the Granger cause of that of ecology and CLU values. However, in China pure economic growth itself may place much reliance on occupation of resources, such as energy consumption and arable land, but economic transition which plays an important role in promoting industrial structure, technical structure and productive ability can be a solution to the sustainable development.
The coupling model portrays the balance among economic, CLU, and ecology subsystems development. The change of constraint of the coupling relationship of integrated economic–CLU–ecology value indicates the main conflict of each modernization stage: The dependence on land finance of local government is the main reason of the low value of coupling relationship between integrated economic and CLU systems from 2000 to 2004. After 2004, the accumulative effect of the ecological overuse begins to arise so that in the future low carbon economic development which pays more attention to technological innovation and optimization of industrial structure with less high-emission energy consumption and less waste water and waste gas. Additionally, stakeholders can attempt to improve balance of modernization development and ecological protection through a price mechanism of construction land supply and eco-compensation method.
4.2. Methodological Discussion
The coordination among the sub-systems is the most important aspect of promoting to an ordered mechanism, which is more important than the balance of the current system and the distance of the system from balance state. This means that sustainable development is different from the expansion of the system. Therefore, an environmentally friendly method should be applied, to enhance human well-being and to guarantee the sustainable development of the economic–CLU–ecology system.
Evaluation models can be used to monitor and diagnose data for states or regions, and for the dynamics of socioeconomic and ecological systems. Such models provide a holistic view for combining a low-carbon economic development with ecological environments under rapid urbanization. There is only a coupling mode in our research area that provides trajectory of the evolution process, but we understand the change through economic theory and actual situation. The holistic view involves the conservation and the development of natural resources, the adjustment of the economic structure, and the optimization of the spatial patterns of land uses.
4.3. Limitations and Future Research Directions
Aiming to promote harmony between humans and natures, the evaluation framework focus on the trade-off among resource utilization, human progress, and ecosystem protection, rather than pursues a certain subsystem’s extreme of carrying capacity. However, due to complex relationships among various sub dimensions among the development of the economic–CLU–ecology system, there are still shortcomings in our study: (1) we ignore the interaction between indicators layers, so it is hard to clarify the causal relationships between these latent and observed variables in our study; (2) with subjectivity of evaluation itself, evaluation results have some uncertainty by weight setting of indices; and (3) the feature of temporal and spatial correlation is not analyzed in our study. In the future, we can explore more spatialized data to discuss their interconnection, and apply a structural equation model (SEM) approach which can provide coefficients for direct, indirect, and total effects of variables to identify and quantify the influence of factors.
5. Conclusions
Taking Zhejiang Province as an example, we proposed an updated comprehensive index system to assessing the socioeconomic and the eco-environment systems. The paper applied a Granger test, and developed a coupling coordination model to explore the synergistic effects, the interdependencies, and the trade-offs among the integrated economic–CLU–ecology values from 2000 to 2012.
We showed that the change of integrated economic subsystem was the Granger cause of changes to the integrated ecology and CLU values. We further showed that the integrated values for ecology and CLU were each other’s Granger cause. This implied that the ecology and the CLU subsystems were sensitive to the change of industrialization and the economic structural, and several ecological issues and development conflicts had been raised from urbanization.
In the study period, looking at the sustainable development for the integrated economic–CLU–ecology values, the analysis of the coupling coordination model with the CD showed clear phases that can be divided into two short-term periods: from 2000 to 2004, and from 2004 to 2012. The coupling relationship between the integrated economic and CLU values had a constrained balanced development on the integrated economic–CLU–ecology value in the first period. The coupling relationship between the integrated ecology and economic values was the impediment for the sustainable development of economic–CLU–ecology in the second period.
The cultivated area per capita and the carbon emission intensity were found to have the greatest effects on the integrated value of the ecology subsystem. Further, the urbanization rate and the per capita disposable income of urban residents had the largest weights on the integrated value of the economic subsystem; and the GDP per unit construction land area and the government revenue per unit construction land area made the greatest contribution to the integrated value of the CLU subsystem. The results show the importance of building a low carbon and circular economic development mode, under the rapid population migration to urban and urban spatial sprawl conditions.
We argue that an intensive development pattern (rather than an extensive development pattern) would reduce the amount of resource consumption and improve productivity. This would solve the eco-environment problems under the back of economic development, which would achieve a sustainable development between the socioeconomic and the eco-environment systems.


