
Using Envision to Assess the Sustainability of Groundwater Infrastructure: A Case Study of the Twin Oaks Aquifer Storage and Recovery Project

Abstract
:1. Introduction
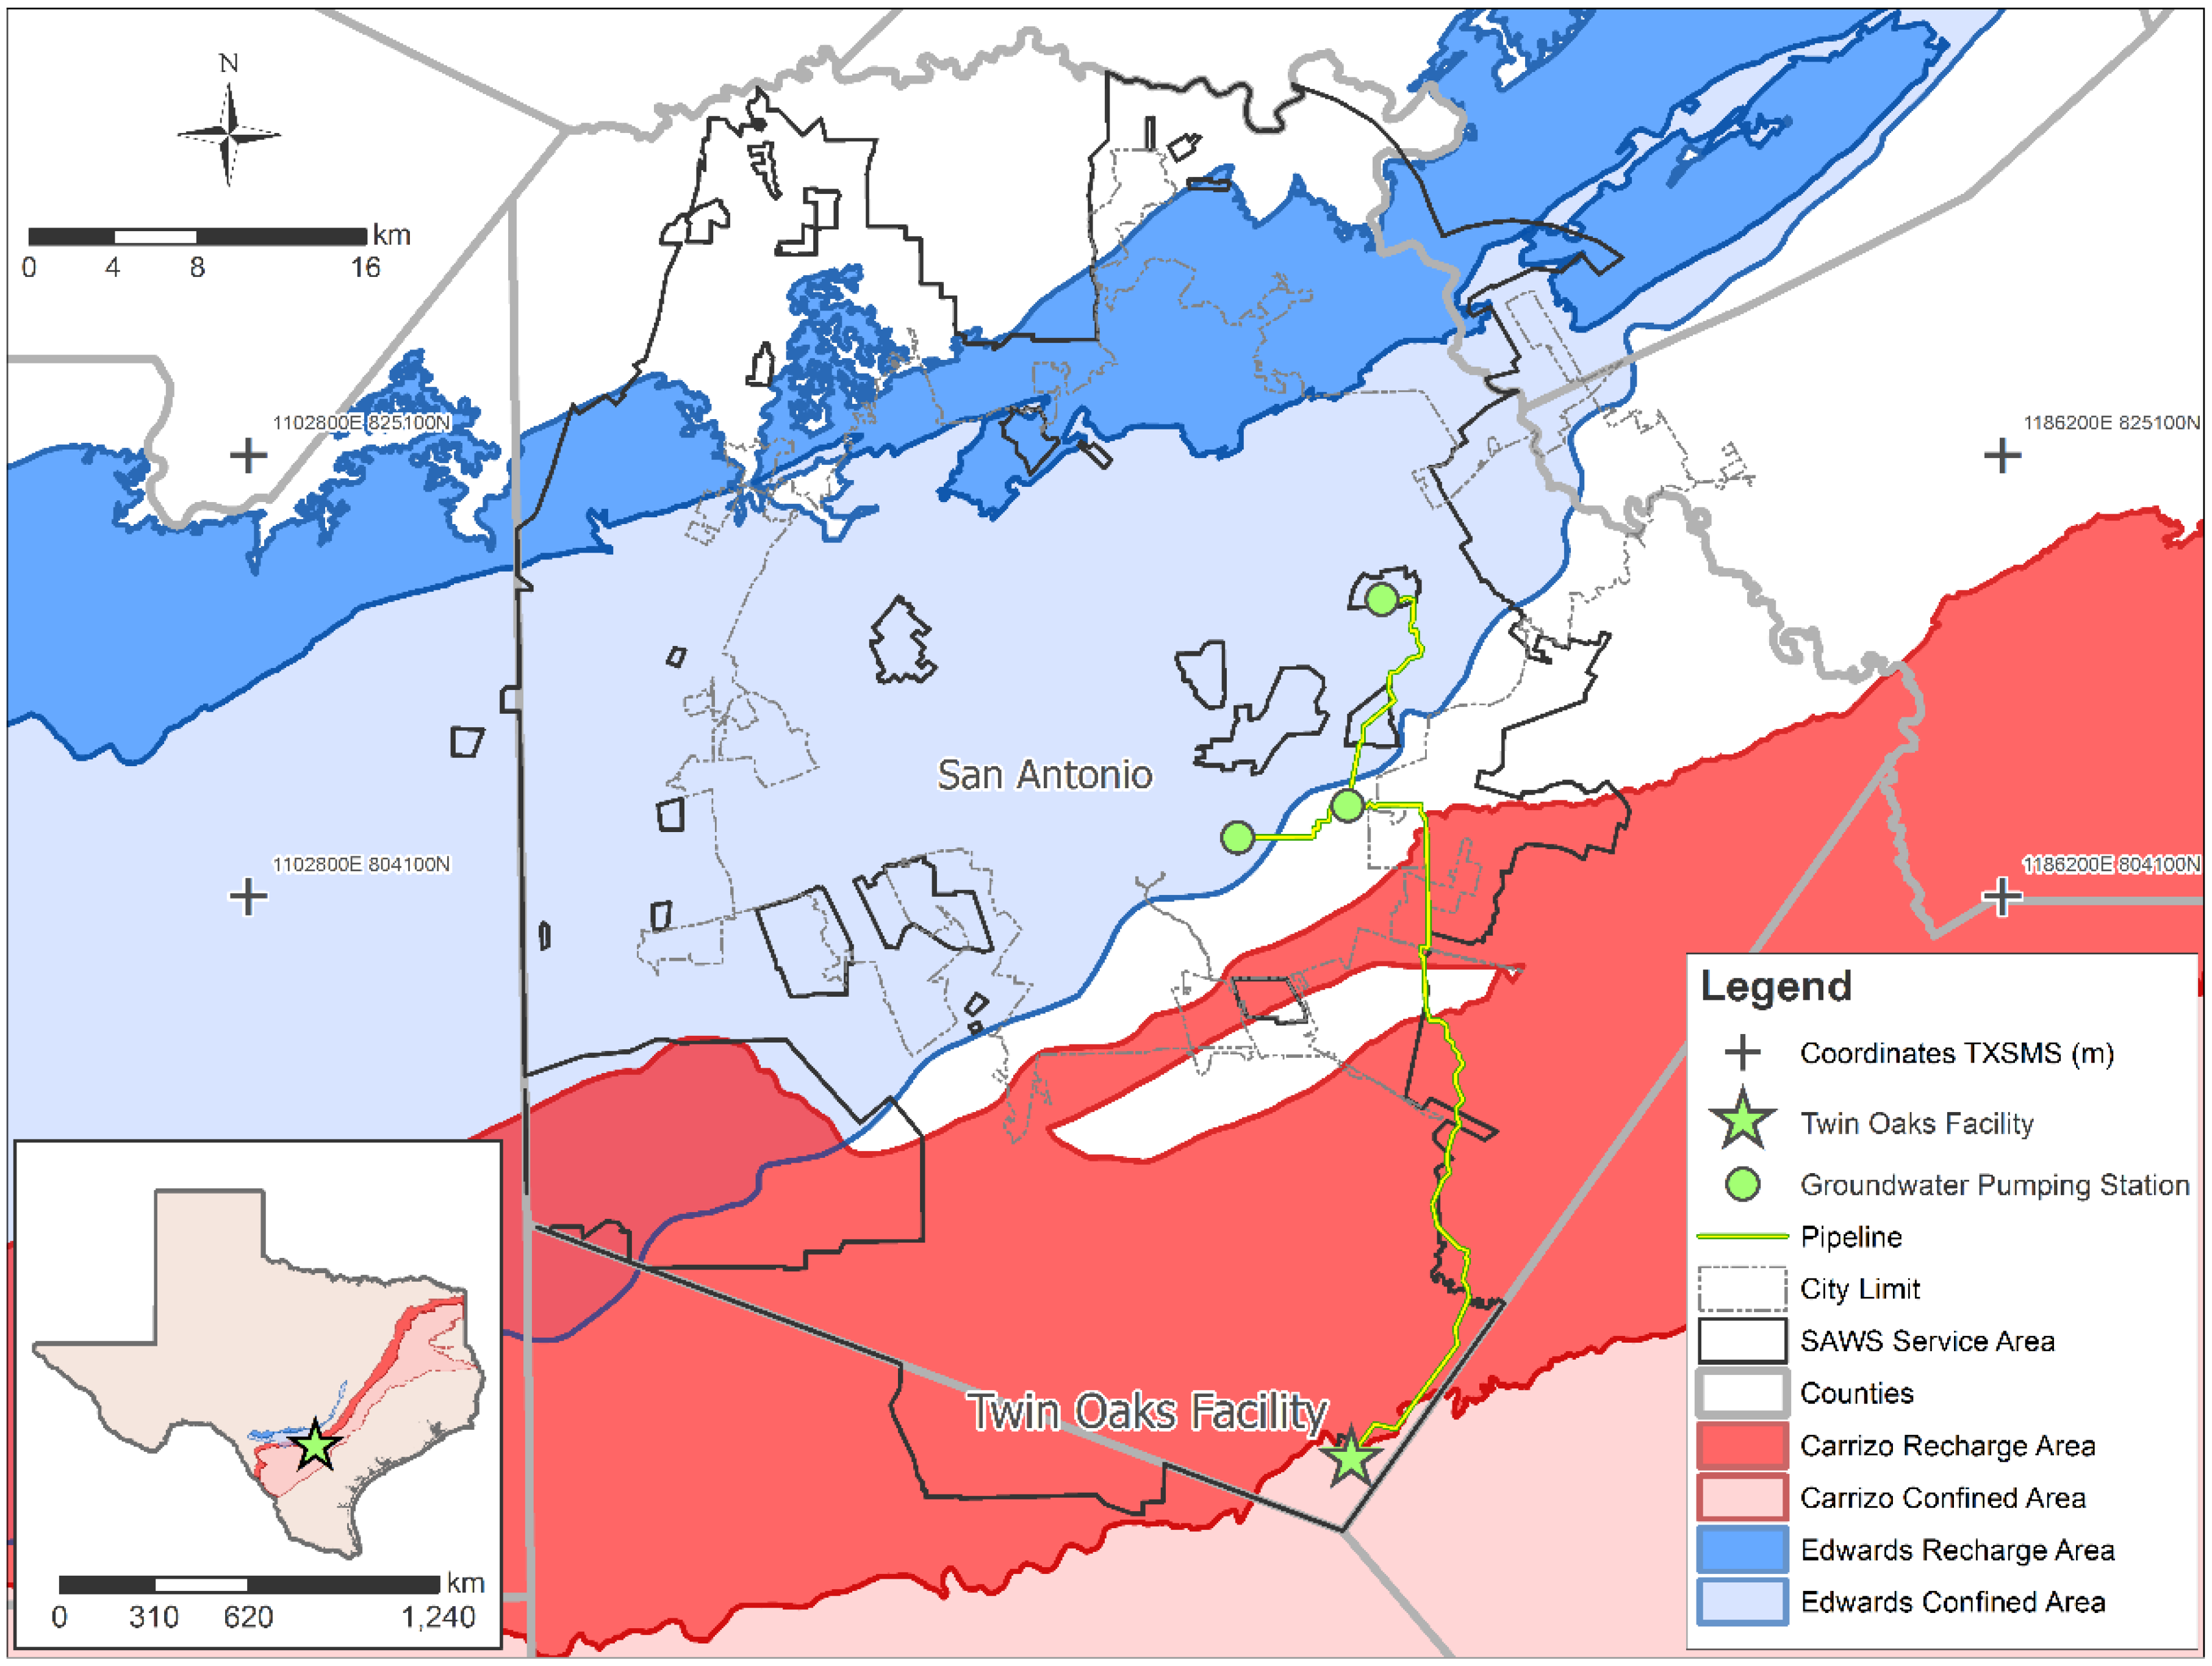
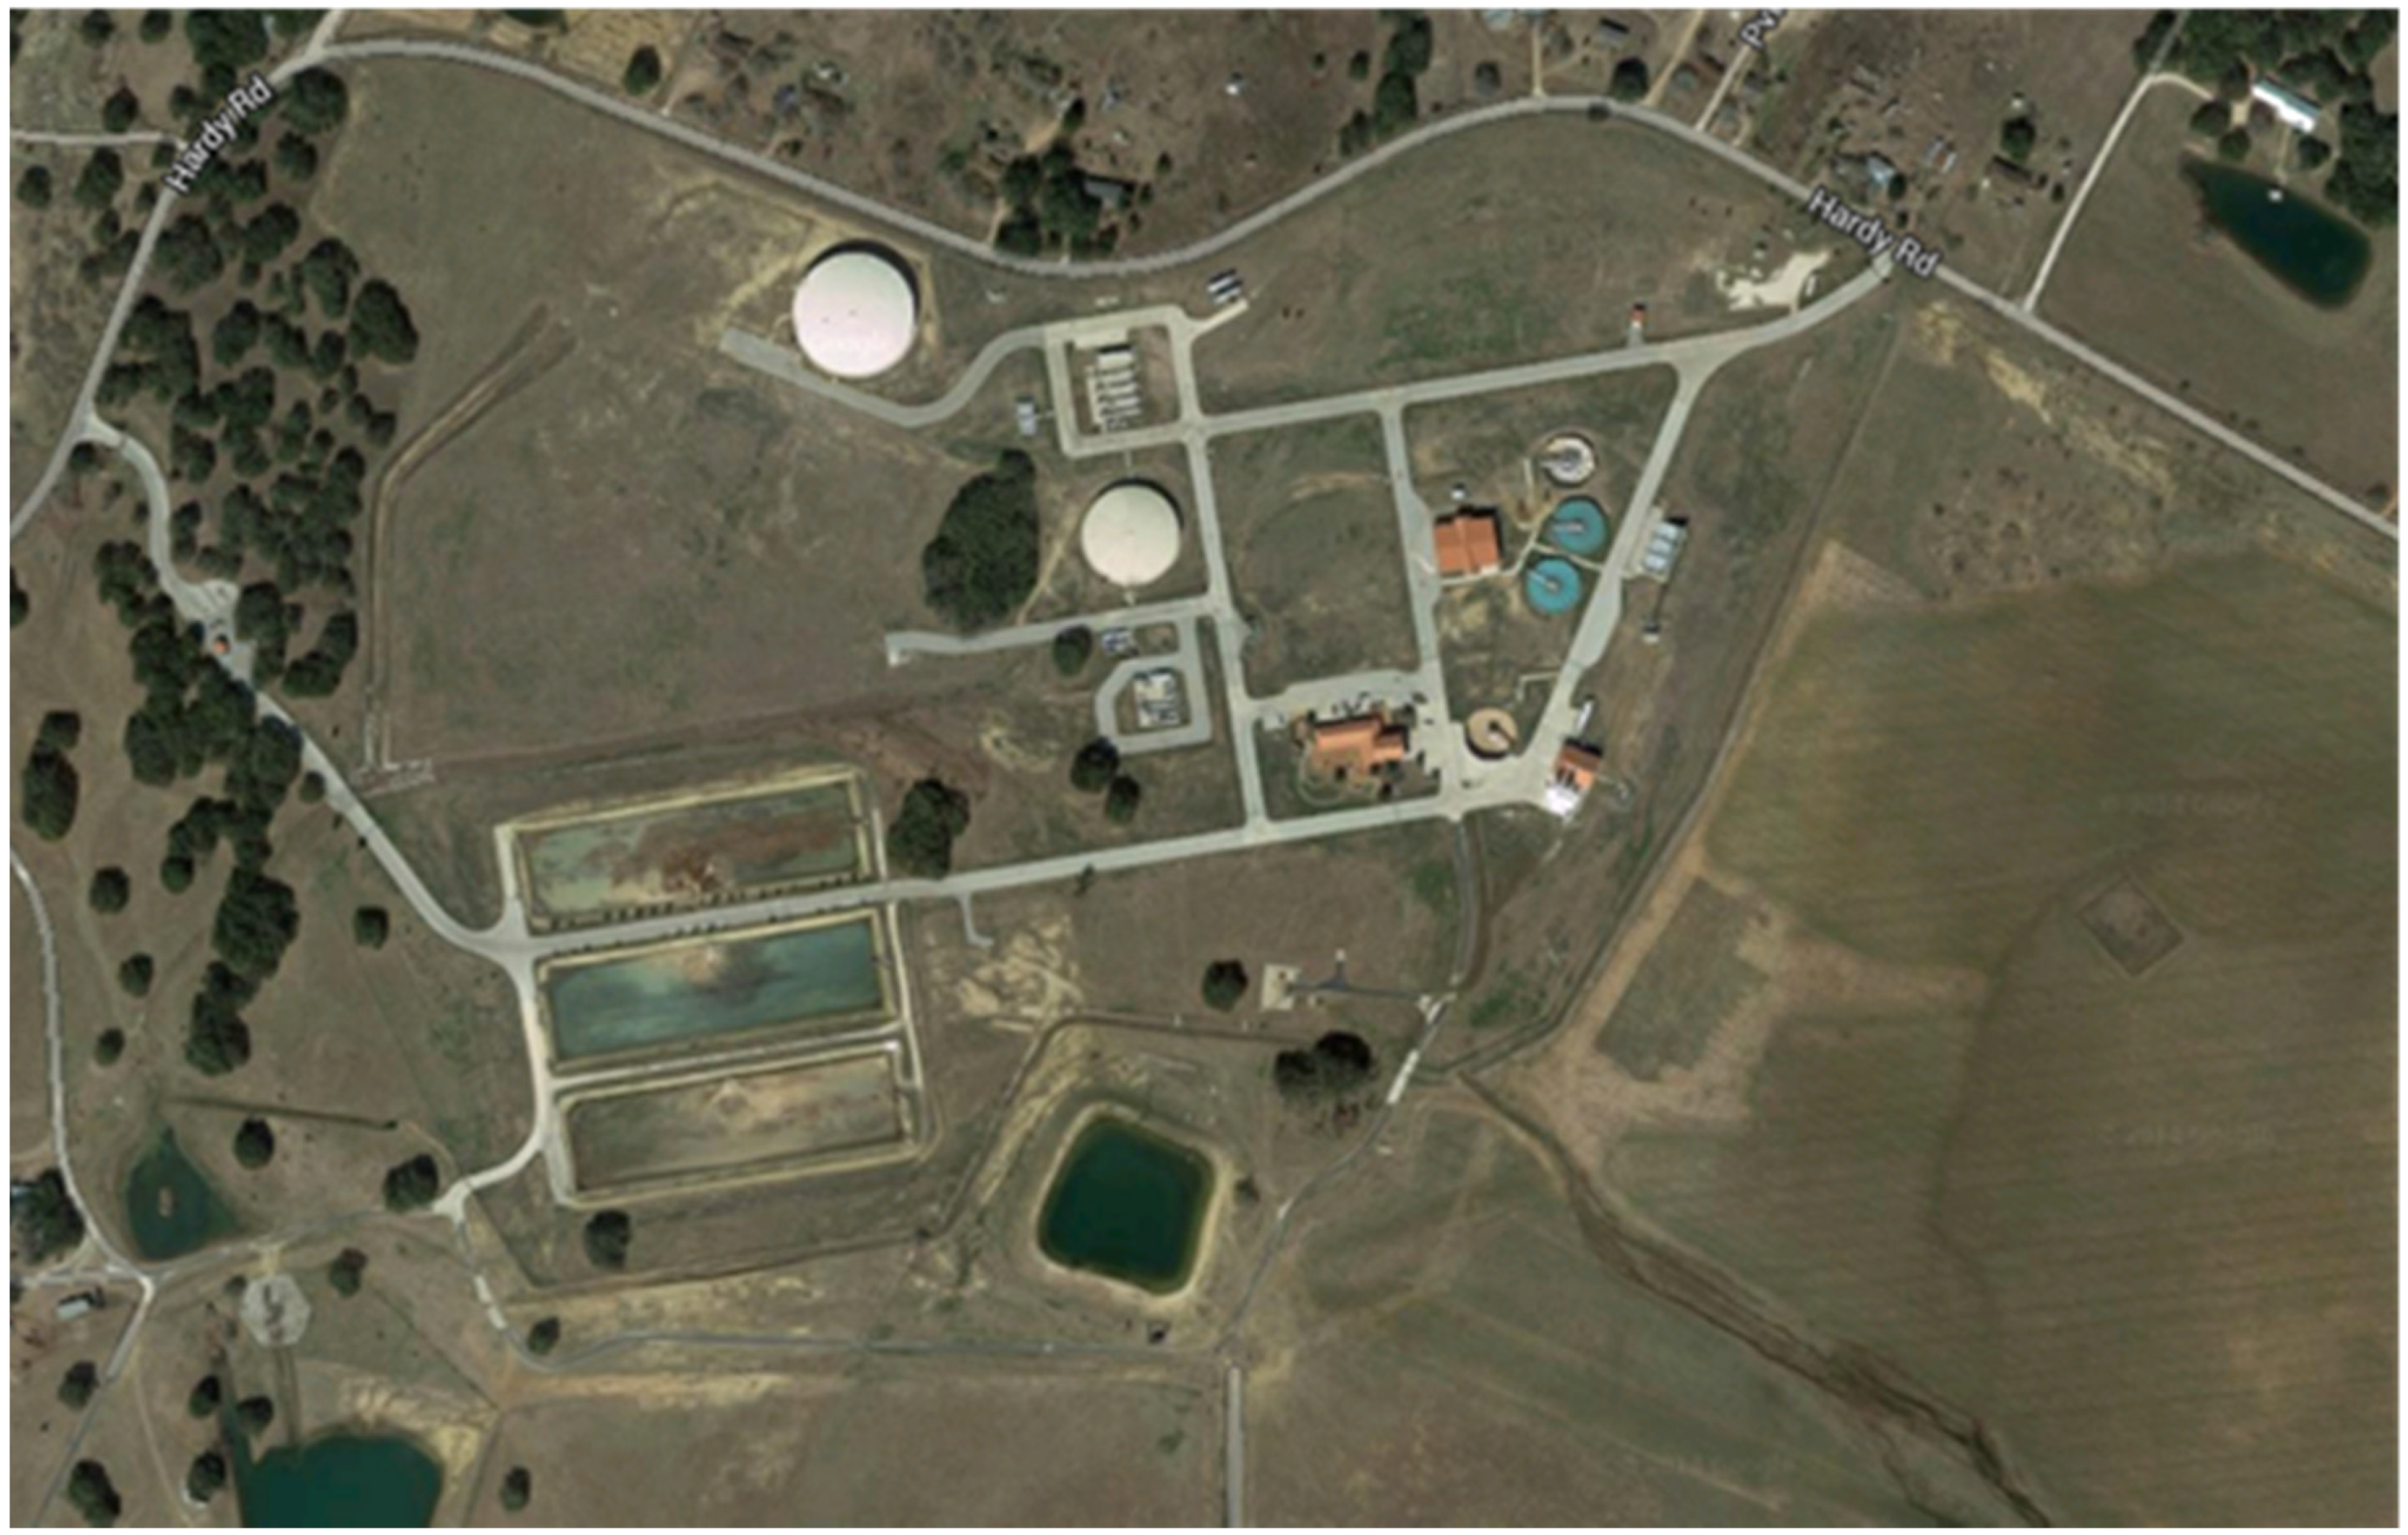
Study Site: SAWS Twin Oaks ASR
2. Materials and Methods
3. Results
“Design the project to solely access water that can be replenished in quantity and quality. Control water usage over average maximum conditions, with plans to offset peak withdrawals during lower water need periods. Determine impacts of fresh water withdraw on receiving waters current and historic aquatic species.”[18] (p. 94)
“Design delivery and operations maintained such that there is no net impact on water supply volumes, including managing runoff to recharge local groundwater and surface water supplies in a manner that offsets withdrawals. Freshwater supplies are replenished at source. Discharges to receiving waters meet quality and quantity requirements of historic high value aquatic species. Methods may include closed loop recycling of water within the project.”[18] (p. 94)
4. Discussion
- (1)
- Conflation of project purpose and project design
- (2)
- No weighting of points based upon local needs
- (3)
- Project-oriented focus omits systems scale
- (4)
- Uneven weighting of three sustainability pillars
- (5)
- Positive scoring overlooks negative aspects of projects
5. Conclusions
Acknowledgments
Author Contributions
Conflicts of Interest
Abbreviations
| ASCE | American Society of Civil Engineers |
| ASR | Aquifer Storage and Recovery |
| EAA | Edwards Aquifer Authority |
| GreenLITES | Green Leadership in Transportation Environmental Sustainability |
| INVEST | Infrastructure Voluntary Evaluation Sustainability Tool |
| ISI | Institute for Sustainable Infrastructure |
| LEED | Leadership in Energy and Environmental Design |
| SAWS | San Antonio Water System |
References
- Zhou, Y. A critical review of groundwater budget myth, safe yield and sustainability. J. Hydrol. 2009, 370, 207–213. [Google Scholar] [CrossRef]
- Mays, L.W. Water Resources Sustainability; McGraw-Hill: New York, NY, USA, 2007. [Google Scholar]
- Essink, G.O. Improving fresh groundwater supply—Problems and solutions. Ocean Coast. Manag. 2001, 44, 429–449. [Google Scholar] [CrossRef]
- Gleeson, T.; Wada, Y.; Bierkens, M.F.P.; van Beek, L.P.H. Water balance of global aquifers revealed by groundwater footprint. Nature 2012, 488, 197–200. [Google Scholar] [CrossRef] [PubMed]
- Konikow, L.F. Contribution of global groundwater depletion since 1900 to sea-level rise. Geophys. Res. Lett. 2011. [Google Scholar] [CrossRef]
- Mays, L.W. Groundwater resources sustainability: Past, present, and future. Water Resour. Manag. 2013, 27, 4409–4424. [Google Scholar] [CrossRef]
- Bredehoeft, J. Safe yield and the water budget myth. Ground Water 1997, 35, 929. [Google Scholar] [CrossRef]
- Meadows, D.H. Indicators and Information Systems for Sustainable Development: A Report to the Balaton; The Sustainability Institute and the Balaton Group: Hartland Four Corners, VT, USA, 1998. [Google Scholar]
- Sandoval-Solis, S.; McKinney, D.; Loucks, D. Sustainability index for water resources planning and management. J. Water Resour. Plan. Manag. 2011, 137, 381–390. [Google Scholar] [CrossRef]
- Aydin, N.Y.; Zeckzer, D.; Hagen, H.; Schmitt, T. A decision support system for the technical sustainability assessment of water distribution systems. Environ. Model. Softw. 2015, 67, 31–42. [Google Scholar] [CrossRef]
- Chen, J.; Zhang, Y.; Chen, Z.; Nie, Z. Improving assessment of groundwater sustainability with analytic hierarchy process and information entropy method: A case study of the Hohhot Plain, China. Environ. Earth Sci. 2014, 73, 1–11. [Google Scholar] [CrossRef]
- Fleming, S.W.; Wong, C.; Graham, G. The unbearable fuzziness of being sustainable: An integrated, fuzzy logic-based aquifer health index. Hydrol. Sci. J. 2014, 59, 1154–1166. [Google Scholar] [CrossRef]
- Pandey, V.P.; Shrestha, S.; Chapagain, S.K.; Kazama, F. A framework for measuring groundwater sustainability. Environ. Sci. Policy 2011, 14, 396–407. [Google Scholar] [CrossRef]
- Zhao, J.; Lam, K.P. Influential factors analysis on leed building markets in U.S. East coast cities by using support vector regression. Sustain. Cities Soc. 2012, 5, 37–43. [Google Scholar] [CrossRef]
- Valdes-Vasquez, R.; Klotz, L.E. Social sustainability considerations during planning and design: Framework of processes for construction projects. J. Constr. Eng. Manag. 2013, 139, 80–89. [Google Scholar] [CrossRef]
- Humbert, S.; Abeck, H.; Bali, N.; Horvath, A. Leadership in energy and environmental design (leed)—A critical evaluation by lca and recommendations for improvement. Int. J. Life Cycle Assess. 2007, 12, 46–57. [Google Scholar]
- Cidell, J. A political ecology of the built environment: Leed certification for green buildings. Local Environ. 2009, 14, 621–633. [Google Scholar] [CrossRef]
- Institute for Sustainable Infrastructure. Envision: Rating System for Sustainable Infrastructure; Institute for Sustainable Infrastructure: Washington, DC, USA, 2015. [Google Scholar]
- Institute for Sustainable Infrastructure. Envision Facts; Institute for Sustainable Infrastructure: Washington, DC, USA, 2015. [Google Scholar]
- U.S. Green Building Council. Leed 2009 for New Construction and Major Renovations; U.S. Green Building Council: Washington, DC, USA, 2009. [Google Scholar]
- Gardels, D.; Aurit, S.; Grate, M.; McMeekin, M.; Heinemann, T. The evolution of sustainability through the development and implementation of the omaha cso control program. In Proceedings of the Water Environment Federation® Technical Exhibition and Conference, New Orleans, LA, USA, 29 September–3 October 2012.
- Hutson, A.C.; Ickert, R.A. Sustainability in water supply. In Proceedings of the World Environmental and Water Resources Congress 2012, Crossing Boundaries, Albuquerque, Mexico, 20–24 May 2012; pp. 2856–2872.
- Shivakumar, S.; Pedersen, T.; Wilkins, S.; Schuster, S. Envision—A measure of infrastructure sustainability. In Pipelines 2014: From Underground to the Forefront of Innovation and Sustainability, 2014; American Society of Civil Engineers (ASCE): Reston, VA, USA, 2014; pp. 2249–2256. [Google Scholar]
- ASCE Task Committee on Sustainable Design of Pipelines. Assessing sustainability of pipeline projects using envision rating system. In Pipelines 2012: Innovations in Design, Construction, Operations, and Maintenance—Doing More with Less, Miami Beach, FL, USA, 2012; ASCE: Miami Beach, FL, USA, 2012. [Google Scholar]
- San Antonio Water System. 2012 Water Management Plan; San Antonio Water System: San Antonio, TX, USA, 2012. [Google Scholar]
- Maclay, R.W.; Small, T.A. Progress Report on Geology of the Edwards Aquifer, San Antonio Area, Texas, and Preliminary Interpretation of Borehole Geophysical and Laboratory Data on Carbonate Rocks; U.S. Geological Survey: Reston, VA, USA, 1976; pp. 76–627.
- McCarl, B.A.; Dillon, C.R.; Keplinger, K.O.; Williams, R.L. Limiting pumping from the Edwards Aquifer: An economic investigation of proposals, water markets, and spring flow guarantees. Water Resour. Res. 1999, 35, 1257–1268. [Google Scholar] [CrossRef]
- Edwards Aquifer Authority. Groundwater Management Plan: 2010–2015; Edwards Aquifer Authority: San Antonio, TX, USA, 2010. [Google Scholar]
- San Antonio Water System. San Antonio Water System 2013 Stats Book; San Antonio Water System: San Antonio, TX, USA, 2013. [Google Scholar]
- Malcolm Pirnie Inc.; ASR Systems LLC; Jackson Sjoberg McCarthy & Wilson LLP. An Assessment of Aquifer Storage and Recovery in Texas; Texas Water Development Board (TWDB): Austin, TX, USA, 2011. [Google Scholar]
- George, P.G.; Mace, R.E.; Petrossian, R. Aquifers of Texas; Texas Water Development Board: Austin, TX, USA, 2011. [Google Scholar]
- Morris, T.; Macias, R.; Pyne, R.D.G. Design, installation, and operation challenges of large-scale aquifer storage and recovery wells in San Antonio, South Texas. In Effects of Urbanization on Groundwater: An Engineering Case-Based Approach for Sustainable Development; ASCE: Reston, VA, USA, 2010; pp. 6–25. [Google Scholar]
- Scanlon, B.R.; Mace, R.E.; Barrett, M.E.; Smith, B. Can we simulate regional groundwater flow in a karst system using equivalent porous media models? Case study, Barton Springs Edwards Aquifer, USA. J. Hydrol. 2003, 276, 137–158. [Google Scholar] [CrossRef]
- Chen, C.-C.; Gillig, D.; McCarl, B. Effects of climatic change on a water dependent regional economy: A study of the texas Edwards Aquifer. Clim. Chang. 2001, 49, 397–409. [Google Scholar] [CrossRef]
- Bray, J.; McCurry, N. Unintended consequences: How the use of leed can inadvertently fail to benefit the environment. J. Green Build. 2006, 1, 152–165. [Google Scholar] [CrossRef]
- Gillig, D.; McCarl, B.A.; Jones, L.L.; Boadu, F. Economic efficiency and cost implications of habitat conservation: An example in the context of the Edwards Aquifer region. Water Resour. Res. 2004. [Google Scholar] [CrossRef]
- Texas Water Development Board. Water Data Interactive. Available online: http://www2.twdb.texas.gov/apps/waterdatainteractive/groundwaterdataviewer (accessed on 4 November 2015).
- Buszka, P.M.; Zaugg, S.D.; Werner, M.G. Determination of trace concentrations of volatile organic compounds in ground water using closed-loop stripping, Edwards Aquifer, Texas. Bull. Environ. Contam. Toxicol. 1990, 45, 507–515. [Google Scholar] [CrossRef] [PubMed]
- Rose, P.R. Edwards group, surface and subsurface, central Texas. In Report of Investigations; University of Texas at Austin: Austin, TX, USA, 1972; p. 200. [Google Scholar]
- Stein, W.G.; Ozuna, G.B. Geologic Framework and Hydrogeologic Characteristics of the Edwards Aquifer Recharge Zone, Bexar County, Texas; Water-Resources Investigations Report 95-4030; U.S. Geological Survey: Austin, TX, USA; U.S.G.S. Earth Science Information Center, Open-File Reports Section: Denver, CO, USA, 1995; pp. 95–4030.
- Ging, P.B. Quality of Stormwater Runoff from an Urbanizing Watershed and a Rangeland Watershed in the Edwards Aquifer Recharge Zone, Bexar and Uvalde Counties, Texas, 1996–1998; U.S. Geological Survey: Austin, TX, USA, 1999; pp. 99–245.
- Kipp, G.K.; Farrington, P.T.; Albach, M.J. Urban Development on the Edwards Aquifer Recharge Zone; Edwards Underground Water District: San Antonio, TX, USA, 1993; p. 80. [Google Scholar]
- Google Maps. Twin Oaks Facility, Elmendorf, Bexar County, TX. Available online: https://www.google.com/maps/place/Bexar+County,+TX/@29.1367561,-98.3935376,4680m/data=!3m1!1e3!4m2!3m1!1s0x865cf53cc49fc5c9:0x32c9454d48ac0681 (accessed on 23 May 2015).
- Patriarche, D.; Castro, M.C.; Goblet, P. Large-scale hydraulic conductivities inferred from three-dimensional groundwater flow and 4He transport modeling in the Carrizo Aquifer, Texas. J. Geophys. Res. Solid Earth 2004. [Google Scholar] [CrossRef]
- Khan, S.; Mushtaq, S.; Hanjra, M.A.; Schaeffer, J. Estimating potential costs and gains from an aquifer storage and recovery program in Australia. Agric. Water Manag. 2008, 95, 477–488. [Google Scholar] [CrossRef]
- Khan, S.; Rana, T.; Hanjra, M.A. A cross disciplinary framework for linking farms with regional groundwater and salinity management targets. Agric. Water Manag. 2008, 95, 35–47. [Google Scholar] [CrossRef]
- Barnett, S.R.; Howles, S.R.; Martin, R.R.; Gerges, N.Z. Aquifer storage and recharge: Innovation in water resources management. Aust. J. Earth Sci. 2000, 47, 13–19. [Google Scholar] [CrossRef]
- Donovan, D.; Katzer, T.; Brothers, K.; Cole, E.; Johnson, M. Cost-benefit analysis of artificial recharge in Las Vegas Valley, Nevada. J. Water Resour. Plan. Manag. 2002, 128, 356–365. [Google Scholar] [CrossRef]
- Padowski, J.C.; Jawitz, J.W. Water availability and vulnerability of 225 large cities in the United States. Water Resour. Res. 2012. [Google Scholar] [CrossRef]
- Wurbs, R.A.; Ayala, R.A. Reservoir evaporation in Texas, USA. J. Hydrol. 2014, 510, 1–9. [Google Scholar] [CrossRef]
- RECON Environmental, Inc.; Hicks & Company; Zara Environmental LLC; BIO-WEST. Edwards Aquifer Recovery Implementation Program: Habitat Conservation Plan; Guadalupe-Blanco River Authority: San Antonio, TX, USA, 2012. [Google Scholar]
- Todd, J.A.; Geissler, S. Regional and cultural issues in environmental performance assessment for buildings. Build. Res. Inf. 1999, 27, 247–256. [Google Scholar] [CrossRef]
- Boesch, D.F.; Brinsfield, R.B.; Magnien, R.E. Chesapeake bay eutrophication. J. Environ. Q. 2001, 30, 303–320. [Google Scholar] [CrossRef]
- Kemp, W.M.; Boynton, W.R.; Adolf, J.E.; Boesch, D.F.; Boicourt, W.C.; Brush, G.; Cornwell, J.C.; Fisher, T.R.; Glibert, P.M.; Hagy, J.D.; et al. Eutrophication of chesapeake bay: Historical trends and ecological interactions. Mar. Ecol. Prog. Ser. 2005, 303, 1–29. [Google Scholar] [CrossRef]
- Hellström, D.; Jeppsson, U.; Kärrman, E. A framework for systems analysis of sustainable urban water management. Environ. Impact Assess. Rev. 2000, 20, 311–321. [Google Scholar] [CrossRef]
- Loucks, D.P. Sustainable water resources management. Water Int. 2000, 25, 3–10. [Google Scholar] [CrossRef]
- Sophocleous, M. Interactions between groundwater and surface water: The state of the science. Hydrogeol. J. 2002, 10, 52–67. [Google Scholar] [CrossRef]
- Reid, L.; Bevan, T.; Davis, A.; Neuman, T.; Penney, K.; Seskin, S.; VanZerr, M.; Anderson, J.; Muench, S.; Weiland, C.; et al. Invest: Sustainable Highways Self-Evaluation Tool; Federal Highway Administration: Washington, DC, USA, 2015. [Google Scholar]
- Johnson, B.T. Barriers to Certification for Leed Registered Projects; Colorado State University: Fort Collins, CO, USA, 2005. [Google Scholar]
- Retzlaff, R.C. The use of leed in planning and development regulation: An exploratory analysis. J. Plan. Educ. Res. 2009. [Google Scholar] [CrossRef]
- Denzer, A.S.; Hedges, K.E. The limitations of leed: A case study. J. Green Build. 2011, 6, 25–33. [Google Scholar] [CrossRef]
- Boström, M. A missing pillar? Challenges in theorizing and practicing social sustainability: Introduction to the special issue. Sustain. Sci. Pract. Policy 2012, 8, 3–14. [Google Scholar]


| Envision Award | % Required | LEED Award | % Required |
|---|---|---|---|
| Bronze | 20 | Certified | 40 |
| Silver | 30 | Silver | 50 |
| Gold | 40 | Gold | 60 |
| Platinum | 50 | Platinum | 80 |
| Criteria | Rating | Points Earned | Points Possible | |
|---|---|---|---|---|
| Quality of Life | Improve community quality of life | Superior | 10 | 25 |
| Stimulate sustainable growth and development | Conserving | 13 | 16 | |
| Develop local skills and capabilities | Improved | 1 | 15 | |
| Enhance public health and safety | Conserving | 16 | 16 | |
| Minimize noise and vibration | Improved | 1 | 11 | |
| Minimize light pollution | No added value | 0 | 11 | |
| Improve community mobility and access | N/A | - | (14) | |
| Encourage alternative modes of transportation | N/A | - | (15) | |
| Improve site accessibility, safety and wayfinding | No added value | 0 | 15 | |
| Preserve historic and cultural resources | N/A | - | (16) | |
| Preserve views and local character | No added value | 0 | 14 | |
| Enhance public space | N/A | - | (13) | |
| Innovate or exceed requirements | N/A | - | - | |
| Total | 41 | 123 (181) | ||
| Criteria | Rating | Points Earned | Points Possible | |
|---|---|---|---|---|
| Leadership | Provide effective leadership and commitment | Improved | 2 | 17 |
| Establish a sustainability management system | Superior | 7 | 14 | |
| Foster collaboration and teamwork | Enhanced | 4 | 15 | |
| Provide for stakeholder involvement | Conserving | 14 | 14 | |
| Pursue by-product synergy opportunities | N/A | - | (15) | |
| Improve infrastructure integration | Enhanced | 3 | 16 | |
| Plan for long-term monitoring and maintenance | Conserving | 10 | 10 | |
| Address conflicting regulations and policies | Conserving | 8 | 8 | |
| Extend useful life | Enhanced | 3 | 12 | |
| Innovate or exceed requirements | N/A | - | - | |
| Total | 51 | 106 (121) | ||
| Criteria | Rating | Points Earned | Points Possible | |
|---|---|---|---|---|
| Resource Allocation | Reduce net embodied energy | Improved | 2 | 18 |
| Support sustainable procurement practices | No added value | 0 | 9 | |
| Use recycled materials | No added value | 0 | 14 | |
| Use regional materials | Improved | 3 | 10 | |
| Divert waste from landfills | No added value | 0 | 11 | |
| Reduce excavated materials taken off-site | Conserving | 6 | 6 | |
| Provide for deconstruction and recycling | No added value | 0 | 12 | |
| Reduce energy consumption | Improved | 3 | 18 | |
| Use renewable energy | No added value | 0 | 20 | |
| Commission and monitor energy systems | Conserving | 11 | 11 | |
| Protect fresh water availability | Conserving | 17 | 21 | |
| Reduce potable water consumption | Improved | 4 | 21 | |
| Monitor water systems | Conserving | 11 | 11 | |
| Innovate or exceed requirements | N/A | - | - | |
| Total | 57 | 182 (182) | ||
| Criteria | Rating | Points Earned | Points Possible | |
|---|---|---|---|---|
| Natural World | Preserve prime habitat | Conserving | 14 | 18 |
| Protect wetlands and surface water | N/A | - | (18) | |
| Preserve prime farmland | Superior | 6 | 15 | |
| Avoid adverse geology | N/A | - | (5) | |
| Preserve floodplain functions | Improved | 2 | 14 | |
| Avoid unsuitable development on steep slopes | N/A | - | (6) | |
| Preserve greenfields | No added value | 0 | 23 | |
| Manage stormwater | No added value | 0 | 21 | |
| Reduce pesticide and fertilizer impacts | Conserving | 9 | 9 | |
| Prevent surface and groundwater contamination | Superior | 9 | 18 | |
| Preserve species biodiversity | Conserving | 13 | 16 | |
| Control invasive species | No added value | 0 | 11 | |
| Restore disturbed soils | No added value | 0 | 10 | |
| Maintain wetland and surface water functions | N/A | - | (19) | |
| Innovate or exceed requirements | N/A | - | - | |
| Total | 53 | 155 (203) | ||
| Criteria | Rating | Points Earned | Points Possible | |
|---|---|---|---|---|
| Climate & Risk | Reduce greenhouse gas emissions | No added value | 0 | 25 |
| Reduce air pollutant emissions | No added value | 0 | 15 | |
| Assess climate threat | No added value | 0 | 15 | |
| Avoid traps and vulnerabilities | Improved | 2 | 20 | |
| Prepare for long-term adaptability | Conserving | 16 | 20 | |
| Prepare for short-term hazards | Improved | 3 | 21 | |
| Manage heat islands effects | No added value | 0 | 6 | |
| Innovate or exceed requirements | N/A | - | - | |
| Total | 21 | 122 (122) | ||
| Credit Category | Points Given | Total Applicable Points | Percentage of Total Applicable Points | Overall Points per Category | Percentage of Overall Points Applicable |
|---|---|---|---|---|---|
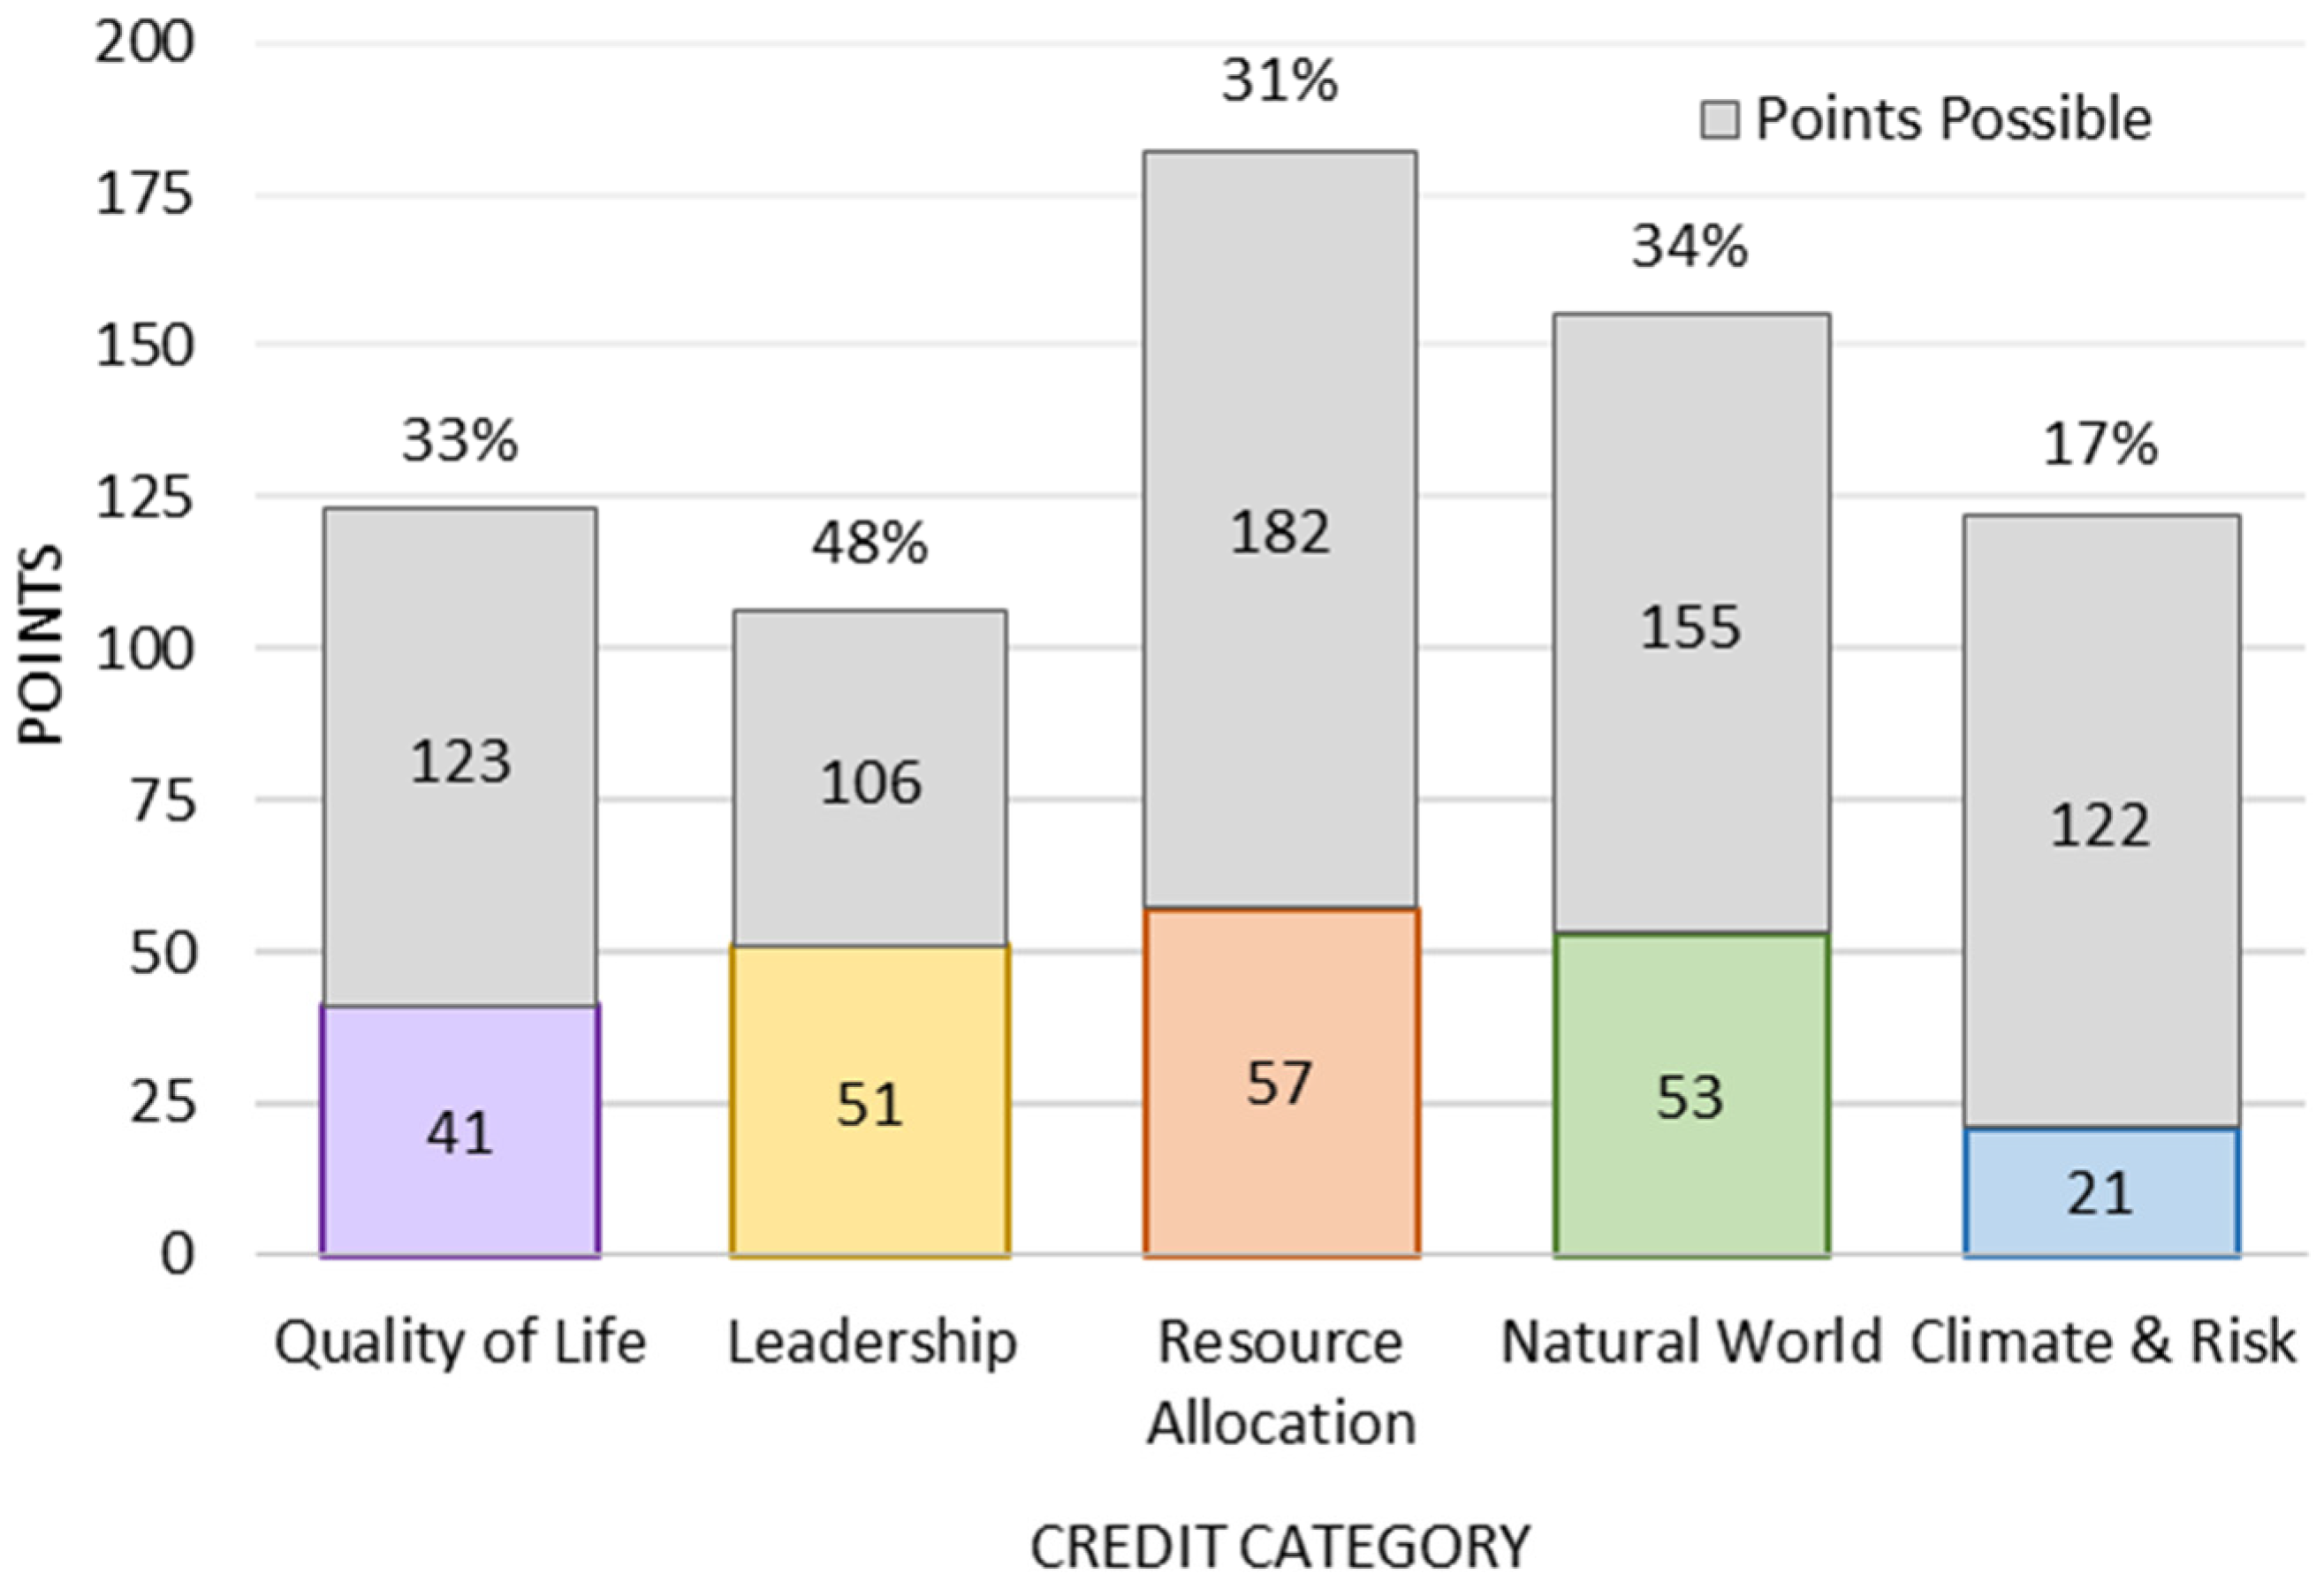
| Quality of Life | 41 | 123 | 33% | (181) | 68% |
| Leadership | 51 | 106 | 48% | (121) | 88% |
| Resource Allocation | 57 | 182 | 31% | (182) | 100% |
| Natural World | 53 | 155 | 34% | (203) | 76% |
| Climate & Risk | 21 | 122 | 17% | (122) | 100% |
| Total | 223 | 688 | 32% | (809) | 85% |
© 2016 by the authors; licensee MDPI, Basel, Switzerland. This article is an open access article distributed under the terms and conditions of the Creative Commons Attribution (CC-BY) license (http://creativecommons.org/licenses/by/4.0/).
Share and Cite
Saville, C.R.; Miller, G.R.; Brumbelow, K. Using Envision to Assess the Sustainability of Groundwater Infrastructure: A Case Study of the Twin Oaks Aquifer Storage and Recovery Project. Sustainability 2016, 8, 501. https://0-doi-org.brum.beds.ac.uk/10.3390/su8050501
Saville CR, Miller GR, Brumbelow K. Using Envision to Assess the Sustainability of Groundwater Infrastructure: A Case Study of the Twin Oaks Aquifer Storage and Recovery Project. Sustainability. 2016; 8(5):501. https://0-doi-org.brum.beds.ac.uk/10.3390/su8050501
Chicago/Turabian StyleSaville, Cody R., Gretchen R. Miller, and Kelly Brumbelow. 2016. "Using Envision to Assess the Sustainability of Groundwater Infrastructure: A Case Study of the Twin Oaks Aquifer Storage and Recovery Project" Sustainability 8, no. 5: 501. https://0-doi-org.brum.beds.ac.uk/10.3390/su8050501