1. Introduction
In response to abnormal climate events, such as El Niño and La Niña, and energy-related difficulties, such as the nuclear accidents in Fukushima and oil price fluctuations, a large number of countries have agreed and implemented strategies and policies to create a sustainable energy generation system based on renewable energy sources to prevent global warming and encourage sustainable growth [
1,
2]. In accordance with this movement, countries worldwide are attempting to adopt renewable energy systems in public facilities, such as airports. The airport is the most representative location with respect to the adoption of renewable energy for the following reasons: first, airports consume the most energy in a country because they process large numbers of airplanes, passengers, and cargo 24 hours a day, 365 days a year; and second, an international airport has sufficient space to install renewable facilities, such as PV panels and a storage system.
Many airports have introduced renewable energy. Cochin International Airport, India, is the world’s first such facility to be completely powered by photovoltaic panels [
3]. Prime Minister Oomen Chandy announced the opening of a solar power plant at Cochin International Airport, which is located in Kerala, on the airport’s official website. This solar power plant covers approximately 0.2 square kilometers and has 46,000 photovoltaic panels. However, the quantity of electric power produced is insufficient to satisfy the load, and the airport is required to depend on fossil fuels. Cochin International Airport can satisfy the load using 100% solar energy due to opening a solar power plant. During the night, the airport is operated using electric power stored during the day in an energy storage system. Galapagos Airport exclusively uses renewable energy to operate all of its facilities [
4]. The airport terminal has a high ceiling and uses volcanic stones to compensate for the lack of an air-conditioning system. Approximately 35% of the energy that the airport requires is supplied by PV panels, which are set up throughout the airport’s corridors. A large number of major airports are trying to not only introduce renewable energy power generation but also promote sustainable development. Newcastle, Auckland, Dublin, and London City airports are representative examples of airports that have adopted renewable energy systems.
Northeast Asian countries, whose manufacturing industries highly depend on fossil fuel and nuclear power, are also trying to introduce renewable power generation systems in public facilities to decrease their dependence on traditional fuels [
5,
6,
7]. South Korea is the leader in adopting and spreading renewable energy, a position it has achieved without causing severe pollution or experiencing accidents. The South Korean government has established strict energy policies and plans to install renewable energy equipment in its public facilities [
8]. In particular, facilities owned by public corporations, such as international airports, have been more strictly managed to use more renewable energy. Since 2006, the Incheon International Airport Corporation has introduced small/medium-sized renewable power plants throughout the airport—from the ancillary buildings to the main terminal. In addition, it has decreased total energy use by 10% by extending the LED lighting system. Finally, since 2009, the Incheon International Airport Corporation has been installing solar power and geothermal power plants to create a low-carbon, environmentally friendly airport. By 2017, the Incheon International Airport Corporation will supply 10% of the total energy use of the all of the airport’s buildings with renewable energy [
9]. Thus, in this study, we aim to conduct a feasibility test with respect to the adoption of a renewable energy generation system at Incheon International Airport in consideration of its potential increase in electricity consumption.
2. Materials and Methods
2.1. Overview of the Hybrid Renewable Power System and Incheon International Airport, South Korea
2.1.1. Profile of Incheon International Airport, South Korea
Incheon International Airport is 50 km from South Korea’s capital city, Seoul. The airport covers 56,198,600 m2 and annually processes 170,000 flights, 2.7 million passengers, and 1.7 million tons of cargo. The airport is now in the midst of its third expansion. When completed, the facility will have five runways covering 114 million m2 and is forecast to annually process 740,000 flights, 62 million passengers, and 580 million tons of cargo.
Since opening in 2001, Incheon International Airport has developed remarkably and has been recognized as offering world-class services. Since 2005, the facility has been evaluated as the world’s best airport for 10 consecutive years by Airport Council International. Additionally, in 2009, Incheon International Airport became the first airport to obtain ISO50001 certification for its energy management system.
The electric power consumption of all of South Korea’s airports is 410 GWh, which approximately equals the electricity used by 16,000 households in one year. In addition, Incheon International Airport’s electric power consumption represents 80% of the total quantity consumed by South Korean airports. Thus, a savings of 10%–20% of Incheon International Airport’s energy consumption equals a savings of 100% of the energy consumed by the countries remaining 14 airports. Airport profiles are provided in
Table 1.
As previously mentioned, Incheon International Airport has undergone three phases of expansion (the third phase is currently underway). In the first phase, the corporation aimed to construct fundamental airport facilities, such as runways, the terminal complex and expressways. In the second phase, due to a rapid increase in airline demands, Incheon International Airport constructed a new 4000 m runway and new cargo and boarding terminals. Finally, by the end of the third phase, which is expected to be completed in 2017, Incheon International Airport aims to annually process 62 million passengers and 580 million tons of cargo [
9]. This expansion requires not only substantial manpower and funding but also a large quantity of electricity. Thus, a prediction of the increase in energy consumption and a determination of the optimal hybrid system for the airport’s sustainable operation are required.
2.1.2. Hybrid Renewable Power System
A large number of studies have focused on hybrid systems, which primarily consist of one or more forms of renewable energy and an energy storage system [
10,
11]. Expansive studies have included varied research objects, such as the public or private sector and locality or island [
12,
13,
14]. There are many publications on hybrid systems in Southeast Asia, particularly South Korea [
15,
16,
17,
18,
19,
20]. Many studies have been performed (for example, on Jeju Island, Ulleung-do, Geoje-do, Jin-do, and Wan-do), and many more will be conducted until researchers find economically feasible solutions that can be applied in practice [
21,
22,
23,
24]. Recently, the research focus has moved from cities and islands to projects that consume large quantities of electricity and their need to increase energy independence, such as building complexes, hospitals, universities, theme parks, and airports [
25]. The representative research on hybrid renewable power systems is listed in
Table 2.
2.1.3. South Korean Airport Energy Policy
The South Korean government’s airport energy policy could be classified into two types: eco-friendly airport operations and preparations for a green future. Since 2009, Incheon International Airport Corporation has implemented photovoltaic arrays, geothermal devices, and solar heating collectors to exploit renewable energy [
30]. A high-efficiency heating and cooling system, LED lighting, electric vehicles (EVs), the separation of window-side lights from other lights, energy-saving sensors, timers for bidets and drinking fountains, and circuit breakers for standby power have saved 10,262 MWh of energy and 4791 tons of CO
2 [
9].
Incheon International Airport Corporation has also established a long-term strategy with respect to greenhouse gas emissions trading, which will soon be implemented in South Korea. The plan includes an advanced greenhouse gas management system and a roadmap for greenhouse gas reduction. In accordance with this goal, Incheon International Airport Corporation has installed a maximum capacity (2 MWh) energy storage system (ESS). After the installation of many devices, Incheon International Airport Corporation, which has established a goal of 3% energy independence by 2020, has been actively implementing renewable energy technology, such as solar and geothermal systems. Incheon International Airport Corporation has installed 957 kW photovoltaic panels on the recycled water treatment building and long-term parking garage to reduce and manage the electric power load during peak hours. In accordance with the South Korea government’s plan, Incheon International Airport Corporation plans to continue decreasing greenhouse gas emissions by constructing a 4 MW photovoltaic array and a 5.5 MW geothermal facility several years from now [
9].
2.2. Method
2.2.1. System Configuration and Load Profile
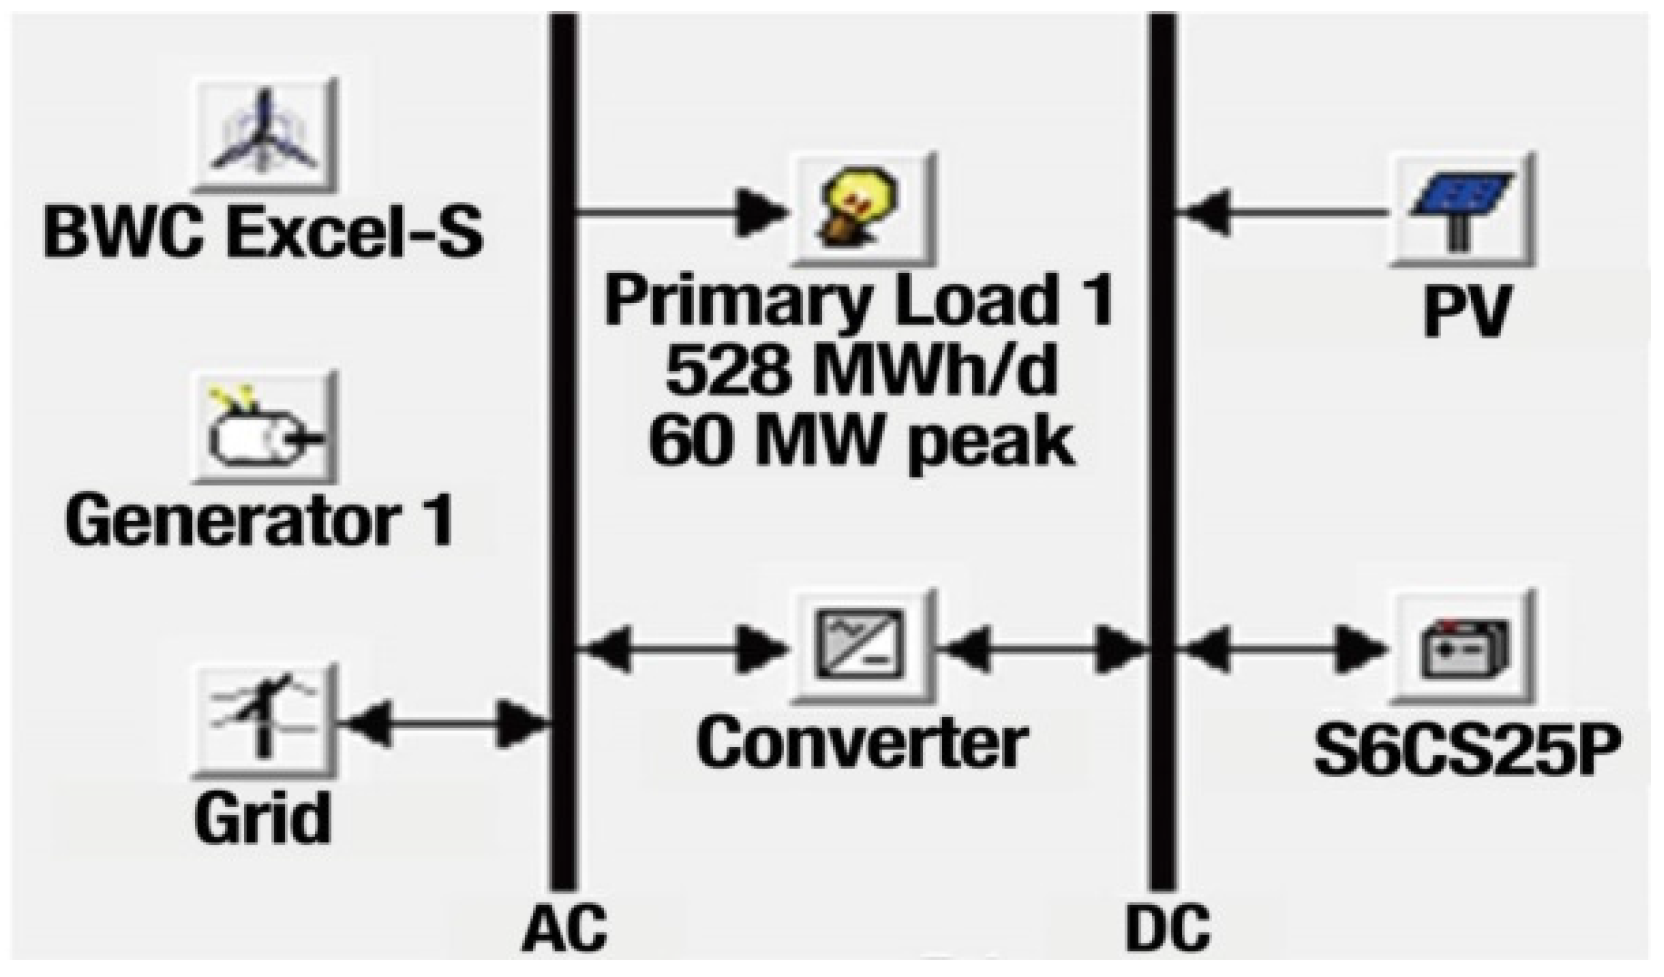
We created a system that consists of a wind turbine, PV array, converter, battery, and grid. In this study, for analysis efficiency and significance, we created a number of scenarios based on assumptions. First, we converted MW to kW for simulation efficiency and to determine the amount of grid purchases, which is a controlled variable fixed at 40,000 kW in every case for scenario analysis. In addition, we assumed that although excess electrical energy is generated in several months, it cannot be sold to the main grid.
In an electricity feasibility test, the profile of the primary load is the most significant datum. It shows how much electricity the system requires during a given period. Since, in electricity management, matching electricity generation with demand is the critical issue with respect to stable operation, the load data should be as accurate as possible. In our research, to enhance data accuracy, we used 24-hourly load values for 365 days based on the “Real Daily Demand List 2015,” which was recently issued by the Korea Electric Power Corporation. The system configuration and daily and seasonal power load characteristics of Incheon International Airport are shown in
Figure 1,
Figure 2 and
Figure 3 respectively.
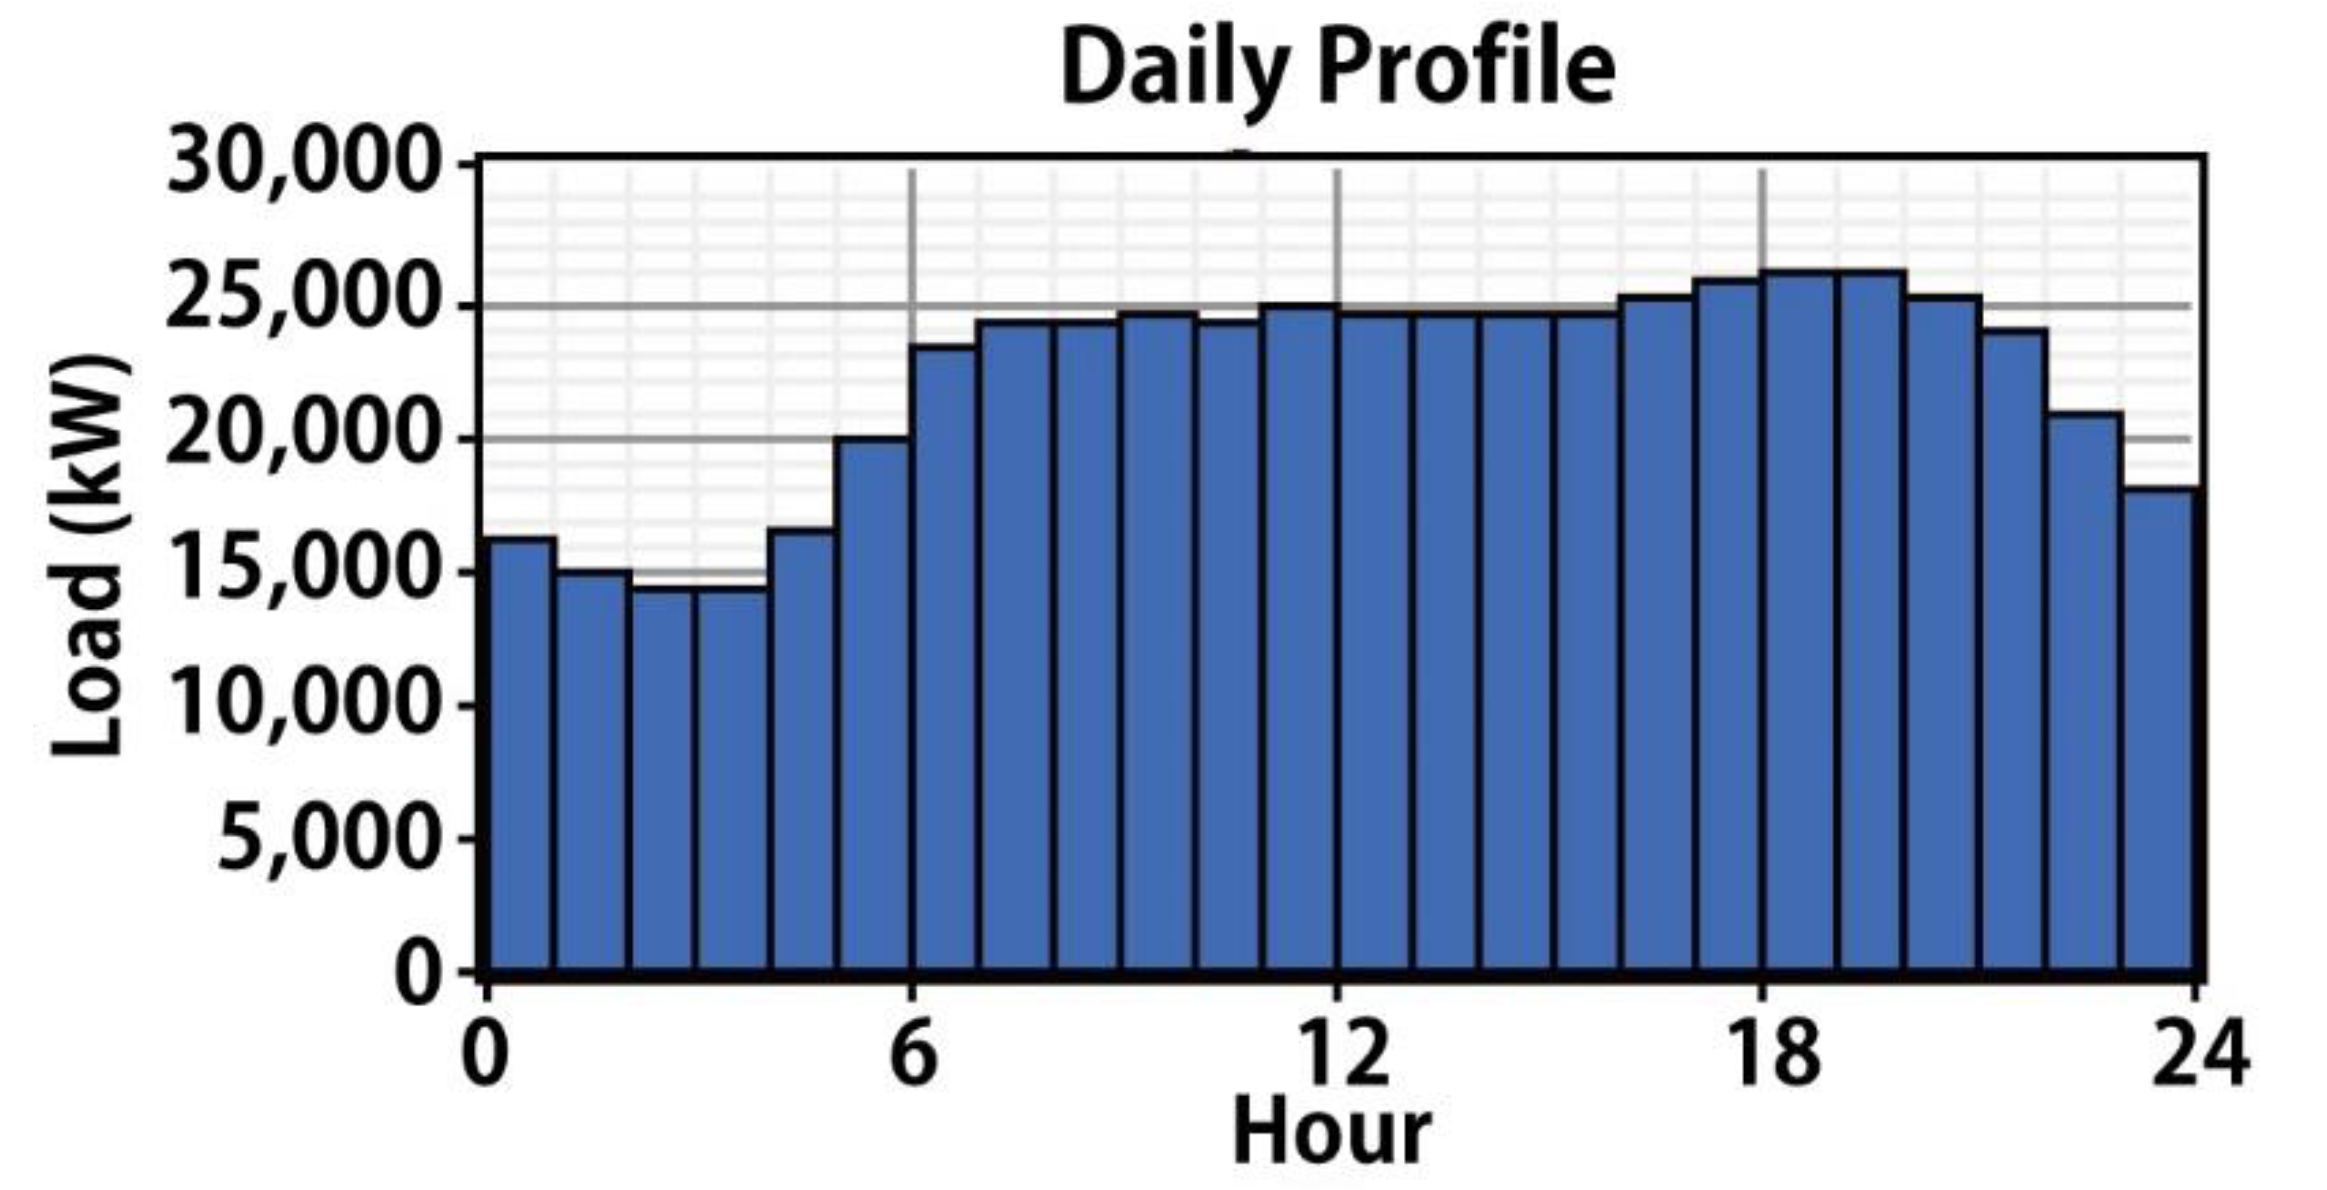
As shown in
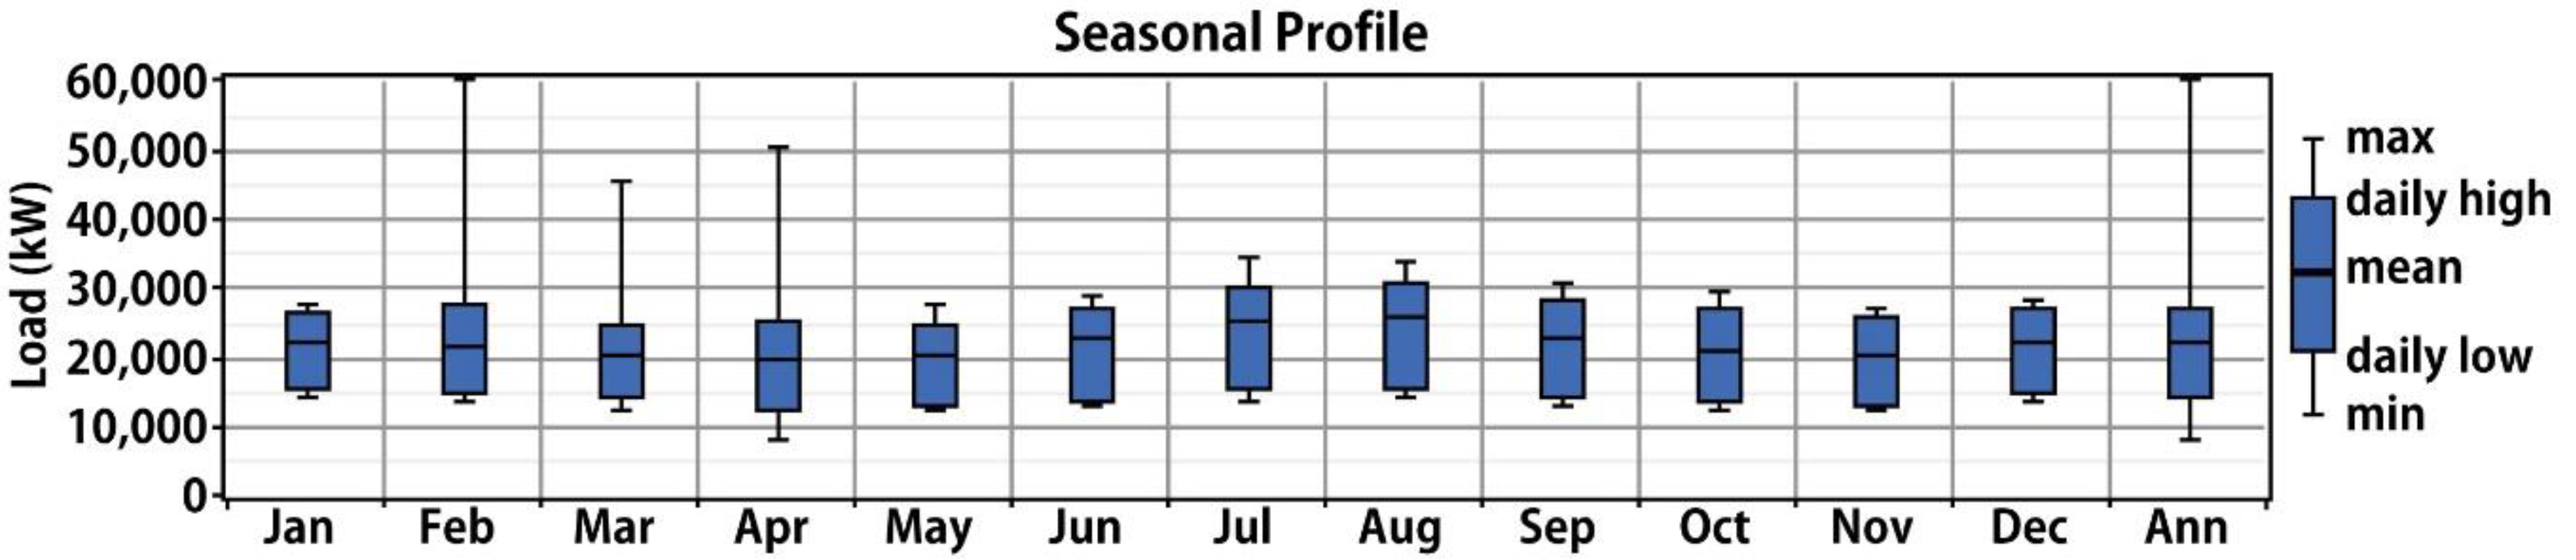
Figure 2, Incheon International Airport’s energy consumption is relatively high from 6 a.m. to 8 p.m., and relatively lower from 9 p.m. to 5 a.m., which is in accordance with airline schedules. Based on the seasonal profile shown in
Figure 3, the energy consumption is relatively higher from June to September and relatively lower in October, November, March, April, and May. We analyzed the total load in kWh instead of MWh to ensure the precision and straightforwardness of the simulation.
2.2.2. Climate Data
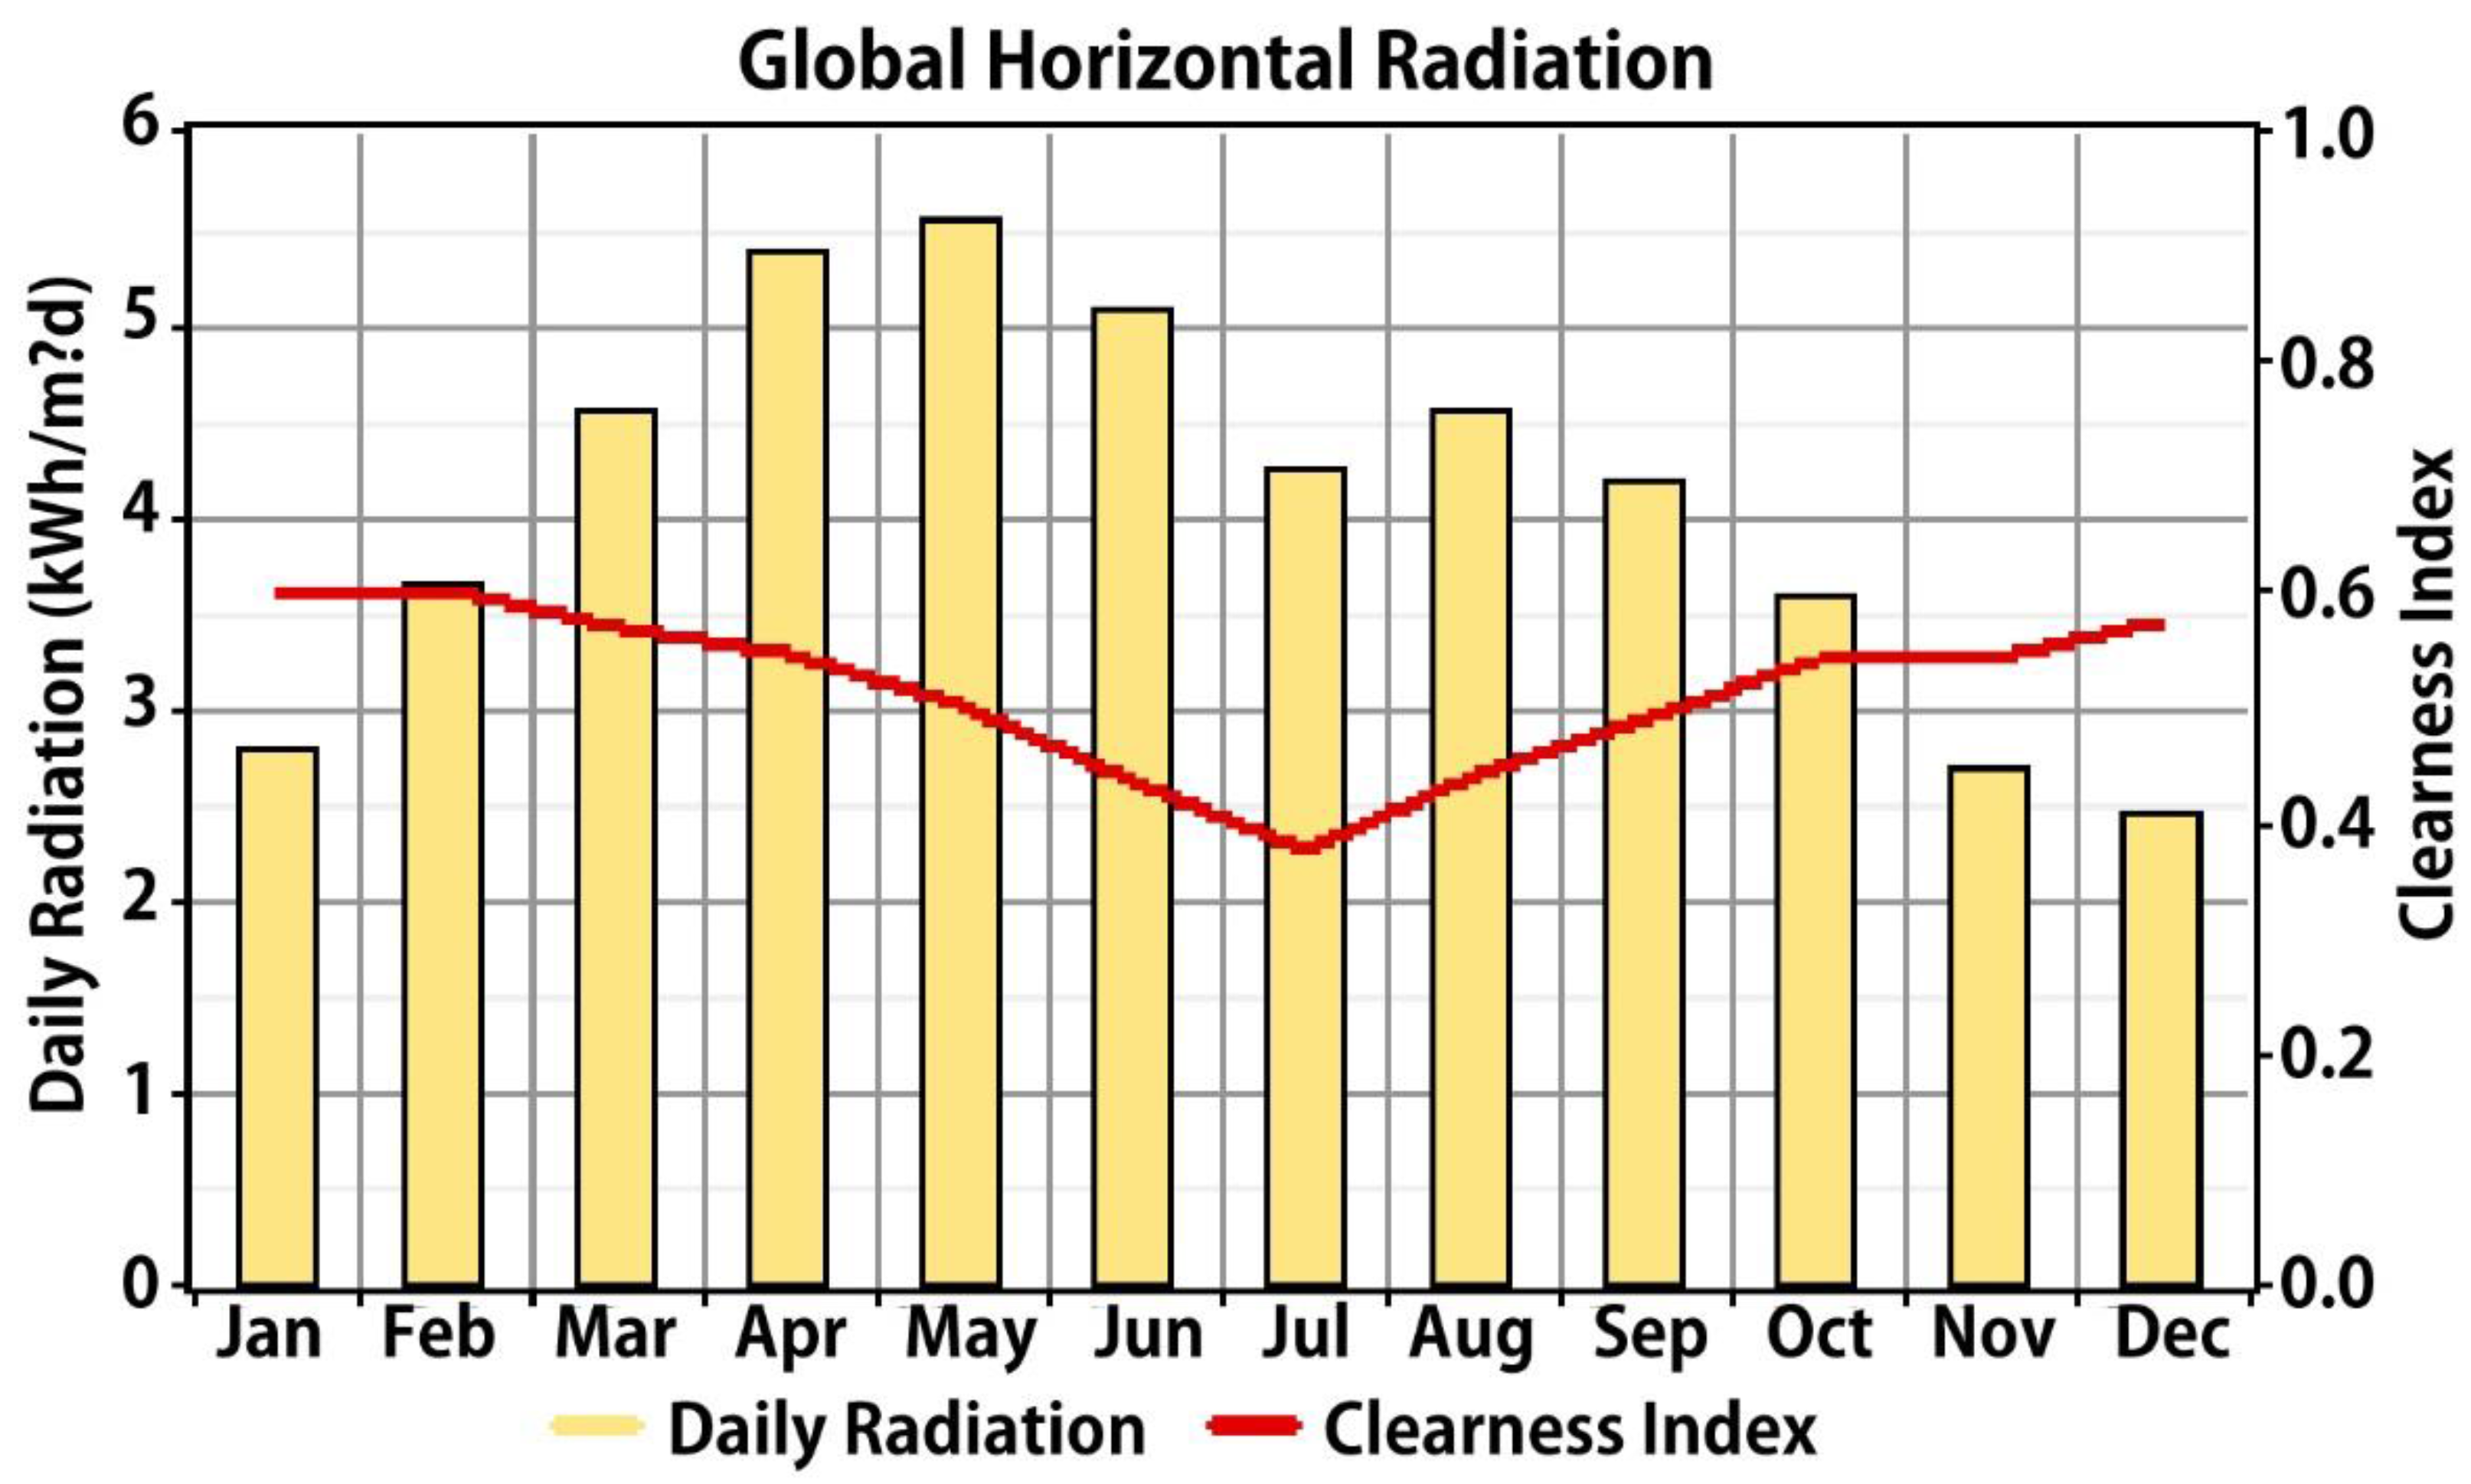
Solar energy is the most ideal renewable energy source because it does not generate greenhouse gases when used to produce electricity. How to use these unlimited clean energy sources to generate electricity is the primary question [
27]. We used solar irradiance data obtained from “NASA Surface Meteorology and Solar Energy” [
31]. The data are based on the latitude and longitude of each airport in the GMT+9:00 time zone, which includes Japan, North Korea, and South Korea.
Figure 4 shows the monthly solar resources of Incheon International Airport.
The electricity power produced by the PV array was calculated using the following equation:
where f
PV is the derating factor, Y
PV is the total installed capacity of the PV panel, I
T is the solar radiation and I
s = 1 kW/m
2. PV arrays become less economically feasible as air temperature increases. The energy produced by the array is approximately non-linear in the air temperature range [
12].
Together with solar energy, wind energy is considered to be the most sustainable renewable energy source [
27]. Similar to solar energy, it has limited applicability in certain locations, e.g., areas with low wind speed. The wind speed value used in this paper was obtained from the Korea Aviation Meteorological Agency (KAMA).
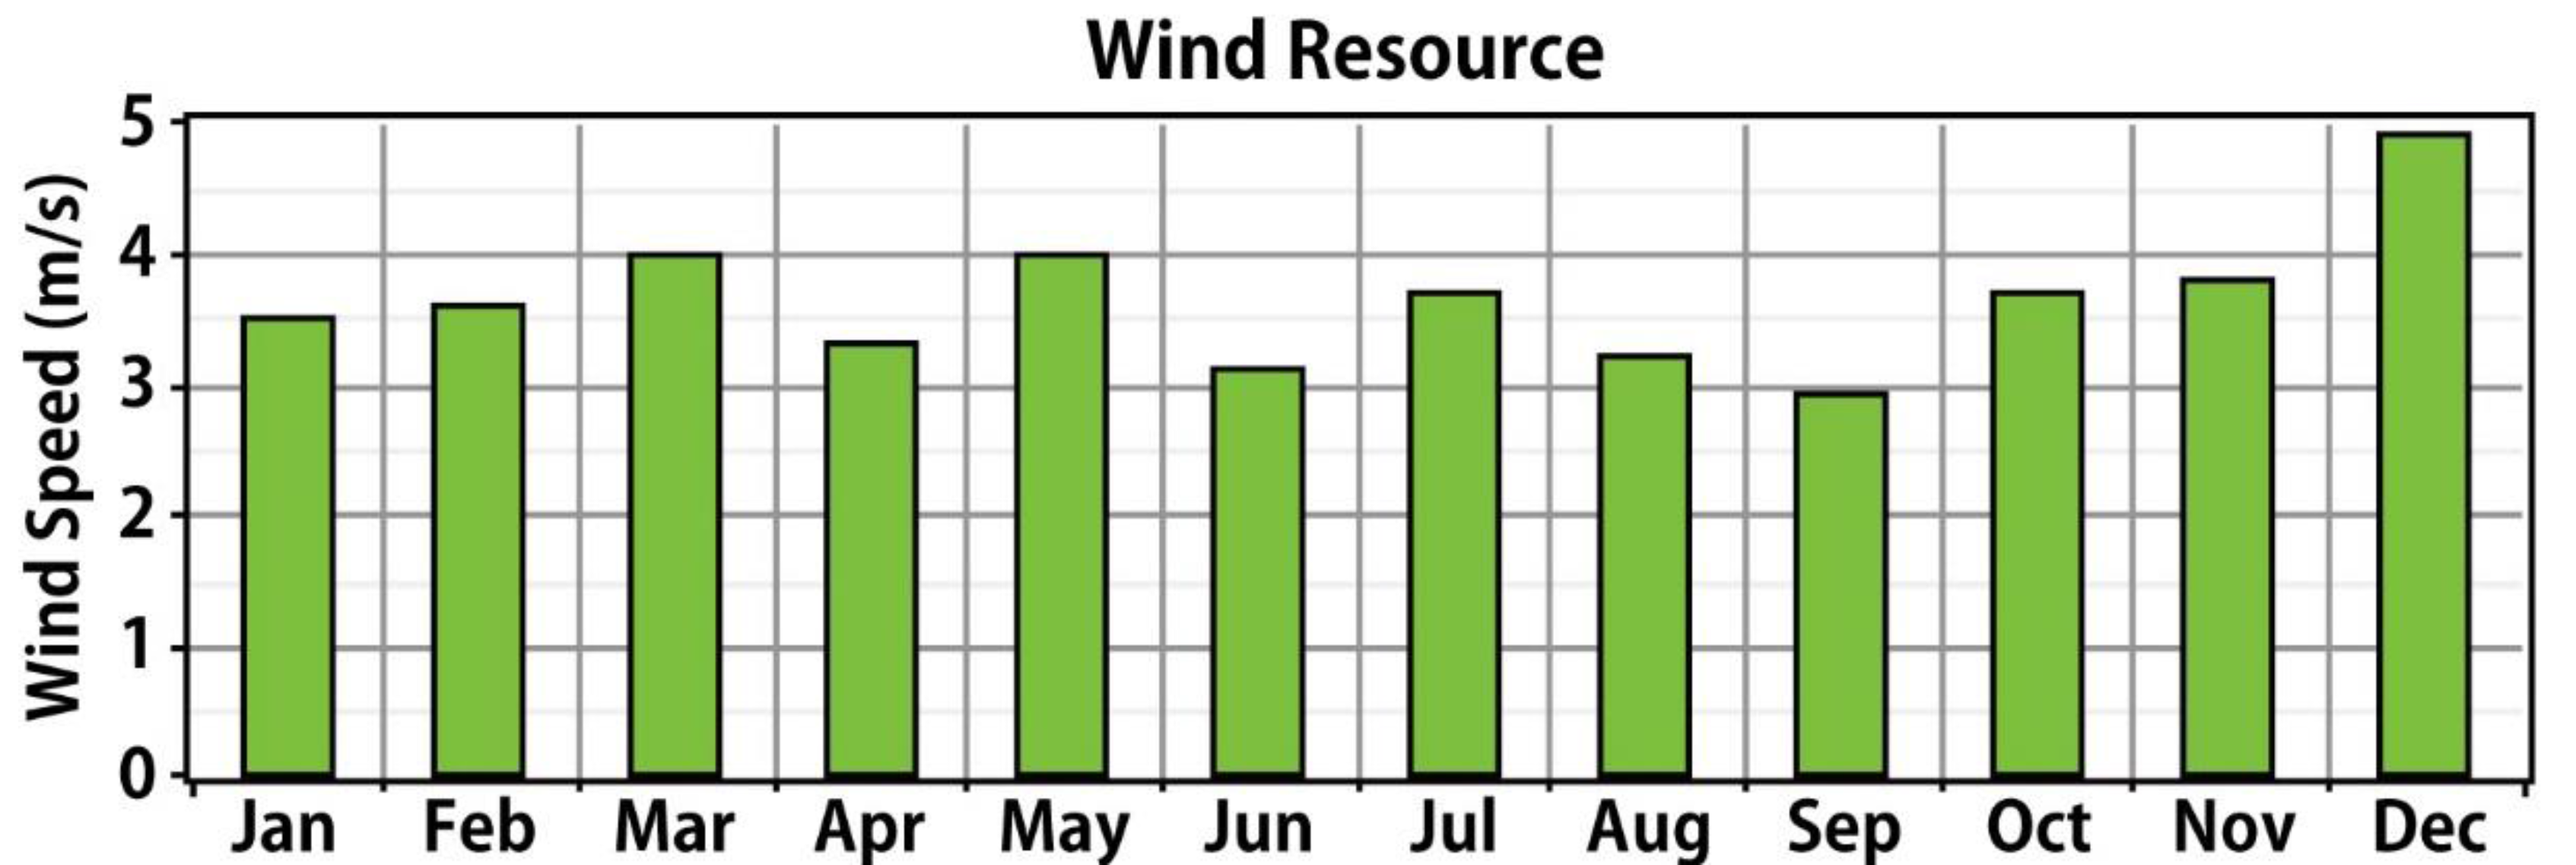
As shown in
Figure 5, the airport’s highest wind speed occurs in December and it is lowest in September. The power produced by the wind turbine was calculated using the following equation:
where A is the area crossed by the wind flow, ρ is the air density, and V is the wind speed [
32].
2.2.3. Economic Data
Often, renewable energy projects are long term [
24,
27]. Thus, the interest rate is an essential variable if cash flow and salvage value during the project period are to be accurately calculated. In this study, we used the annual real interest rate (1.15%) issued by the Bank of Korea.
The COE represents how much money is required to generate 1 kWh of electricity. Thus, the COE level is a significant parameter to evaluate the economic feasibility of a system. To calculate the COE, total annual cost and the total annual production of electricity are required. The total annual cost is the total cost of the system components and other maintenance costs. The total annual production of electricity is the sum of the AC, DC, and grid electricity that is produced [
12,
24,
26]. The equation used in the HOMER simulation was as follows:
In this equation, Cann,tot is the total annual cost and, Eprim,AC, Eprim,DC, and Egrid,sales are the AC, DC primary loads (kWh/year) that are served, and total grid sales (kWh/year), respectively.
The NPC is a significant economic output that indicates how much money is required to install a complete hybrid system from the viewpoint of the present. Thus, for many renewable energy projects, which involve substantial installation, O and M (Operation and Management) costs, NPC could be an important parameter. To calculate the NPC, the total annual cost, interest rate, project period, and capital recovery factor are required [
12,
24,
26]. For more accurate simulation result, we adopted values of the initial cost, replacement cost and annual O and M cost of PV, wind turbine, battery, and converters by referring to numerous research papers [
22,
23,
24,
25,
26,
27]. The equation used in the HOMER simulation was as follows:
where
In this equation, C
ann,tot is the total annual cost, which consists of capital costs, replacement costs, annual O and M, and fuel costs. CRF adjusts a present value into a stream of equal annual payments over a specified time, at a specified discount rate (interest), where
i is the real interest rate and R
proj is the project lifetime. Most renewable energy projects are long term because governments generally try to exploit renewable energy for a long period. Thus, we assumed 25-year projects [
24].
2.2.4. Equipment Cost Data
Equipment cost data, such as installation fees and O and M fees, are important to economic feasibility. In this study, we assumed the initial installation cost, the replacement cost, and the O and M cost of photovoltaic panels per 1 kW capacity to be $1800, $1800, and $25, respectively [
24]. According to previous research, a lifetime of 25 years, a derating factor of 0.8 (80%), a reflection of 20%, and fixed a PV panel angle of 30° with no tracking system were used [
24,
27]. We consider the effect of temperature with a temperature coefficient of power of −0.5%/℃, a nominal operating cell temperature of 47 ℃, and an efficiency level at standard test conditions of 13% to optimize the hybrid energy systems which are default values of HOMER.
A wind turbine converts kinetic energy from wind into electricity. There are many types and models of wind turbines in the market. We used the BWC Excel-s 10 kW AC model (Bergey Windpower, Oklahoma, United States) because it is the most formal and stable wind turbine and has been used in numerous previous studies [
27]. The initial installation cost, replacement cost, and annual O and M cost of the wind turbine were assumed to be $15,000, $15,000, and $92, respectively. The lifetime of the wind turbine and the hub height were assumed to be 15 years and 25 m, respectively [
27].
The battery is the one of the most important components of a renewable energy system because it reduces fluctuations in electricity generation, which improves operation efficiency and stabilizes the energy supply [
20]. However, the battery decreases economic feasibility because it is expensive, and its lifetime is always much shorter than the project period. Thus, in this study, Surrette 6CS25P batteries (S6CS25P; Rolls/Surrette) with nominal voltage of 6 V, nominal capacity of 6.94 kWh, round-trip efficiency of 80%, minimum state of charge of 40%, and lifetime throughput of 9645 kWh were used to analyze and simulate the optimal hybrid system [
6,
17,
20,
23,
27]. The initial costs of installing the battery, the replacement cost, and the annual O and M cost were assumed to be $249, $249, and $1 per battery, respectively.
A converter is indispensable equipment in a renewable energy system that converts the DC produced by the PV cells into AC, which can be used in a given system. In this study, we assumed that the initial installation cost, replacement cost, and annual maintenance cost were $80,000, $80,000, and $1000 per 100 kW, respectively [
11,
23,
27]. A lifetime of 15 years, an inverter efficiency of 90%, and a rectifier efficiency of 85% were assumed.
2.2.5. HOMER Simulation, Sensitivity Test and Scenario Analysis
The National Renewable Energy Laboratory (NREL)’s Hybrid Optimization Model for Electric Renewable (HOMER; Boulder, Colorado, United States) was used as the optimization software tool. HOMER contains a number of energy component models and evaluates suitable options based on resource cost and availability. HOMER analysis requires climate data (radiation and wind speed), economic constraints (interest rate and project period), and component data (component, number, costs, efficiency, and O and M cost). After designing the hybrid energy systems to optimize, HOMER is used for the sensitivity analysis [
33]. In the sensitivity analysis, HOMER performs a significant number of optimization processes using variables with a range of values which researchers assumed to assess the effects of changes [
34]. We selected HOMER because it has advantages with respect to a techno-economic feasibility test of optimization and efficiency in a hybrid system and is more suitable for the international airport’s analysis, according to previous research [
35]. In the optimization step, HOMER simulates numerous different system configurations to find out the optimal solution that satisfies the technical restrictions at the lowest NPC.
For more accurate analysis, we conducted a sensitivity test and scenario analysis. Following [
24], we set reasonable ranges for each device, such as the PV array, battery, and converter, and for climate data, such as wind speed and radiation. As the project period, we used 20, 25, and 30 years. No sensitivity test was conducted on the interest rate, load profile, or other values.
In the analysis, we used three different scenarios. The first scenario represents the present condition. The second scenario assumed a 20% larger primary load than the first scenario, based on the second Incheon International Airport expansion project. Finally, the third scenario assumed a 40% larger primary load than first scenario, based on the third Incheon International Airport expansion project.
3. Results
This section may be divided by subheadings. It should provide a concise and precise description of the experimental results, their interpretation as well as the experimental conclusions that can be drawn.
3.1. First Scenario: Current Condition of Incheon International Airport
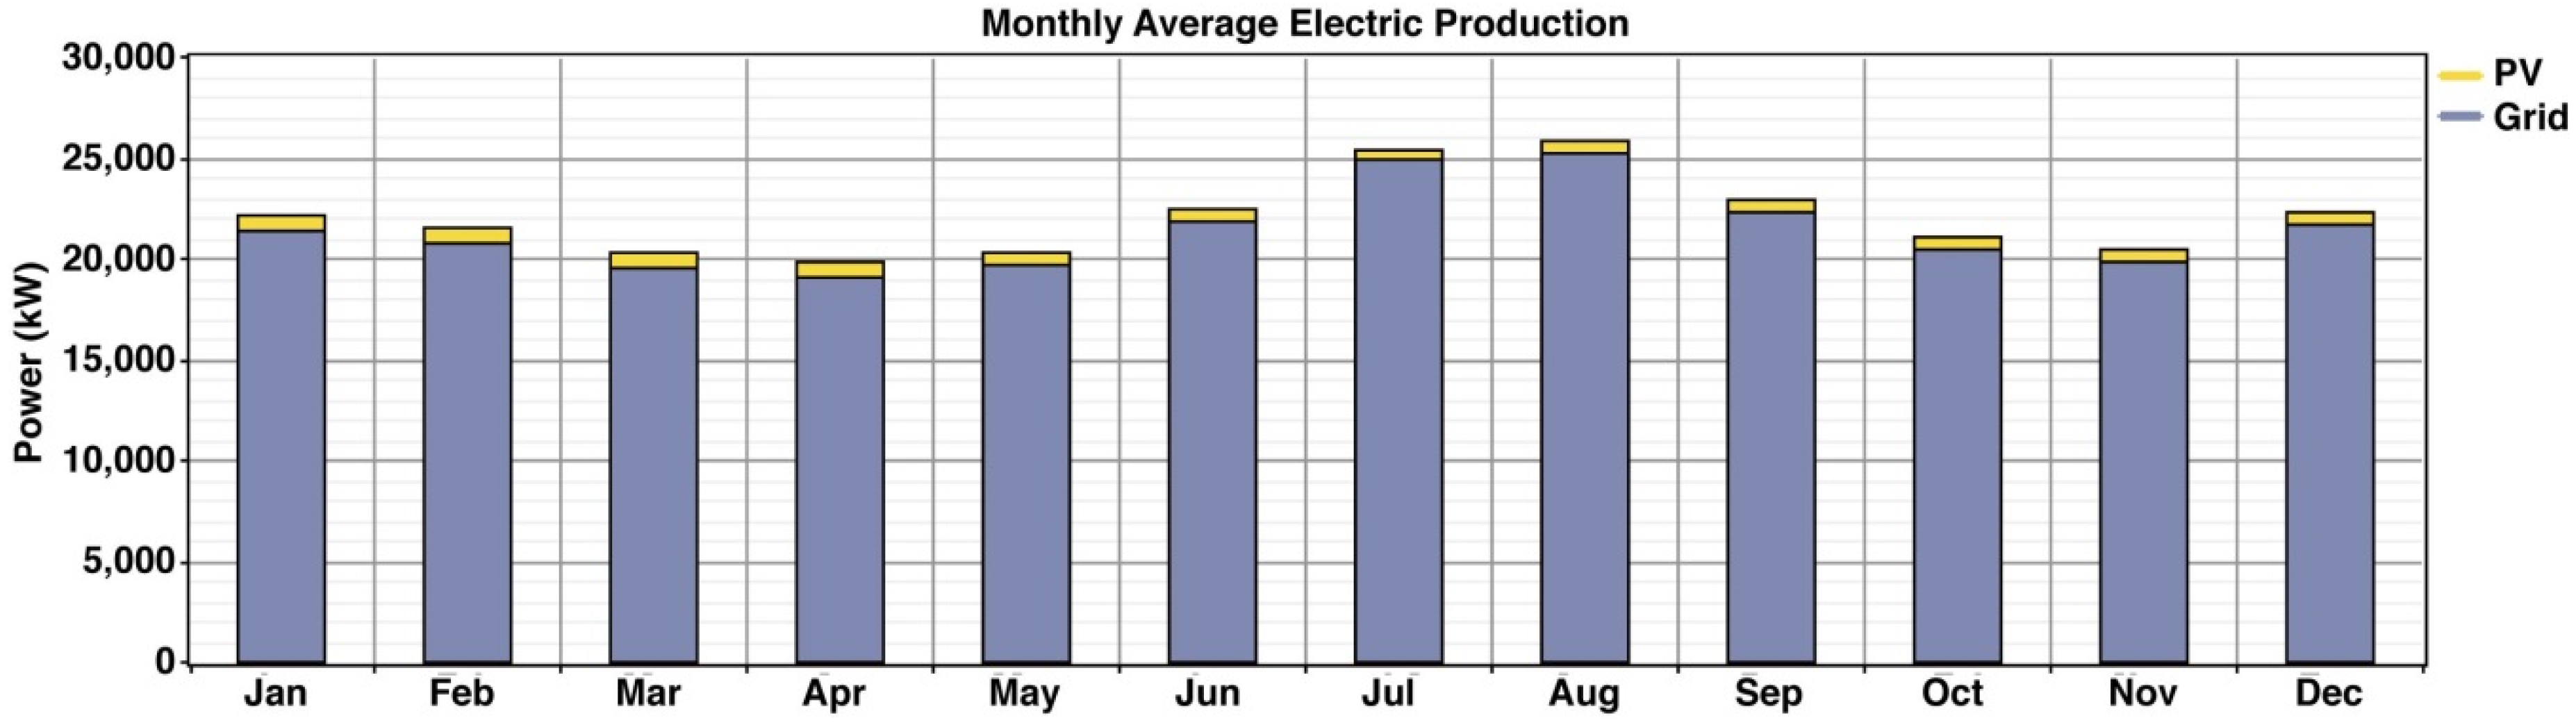
Incheon International Airport has photovoltaic panels with a capacity of 4190 kW. Using two conditions (the number of photovoltaic panels and the airport’s load profile), we investigated the optimized hybrid energy solution for Incheon International Airport. According to the simulation result, the optimized system employs PV panels with a capacity of 4190 kW, 2750 converters, and 2800 batteries (S6CS25P model; nominal voltage: 6 V; nominal capacity: 1156Ah [6.94 kWh]; lifetime throughput: 9645 kWh) to satisfy the current load using the proposed electric power generation system. In this scenario, Incheon International Airport’s entire load is supplied by a centralized grid that furnishes 187,418,386 kWh/year (approximately 97% of the total load). The remaining load is supplied by PV panels: 5,874,682 kWh/year. The average monthly electricity production is provided in
Figure 6. The NPC of the system is $1,018,692,736. The COE is $0.304/kWh. Capital and operating costs are included in the scenario: $21,556,610 and $57,263,404/year, respectively. The optimized result is shown in the
Table 3.
3.2. Second Scenario: Expected Expansion to 120% of Load
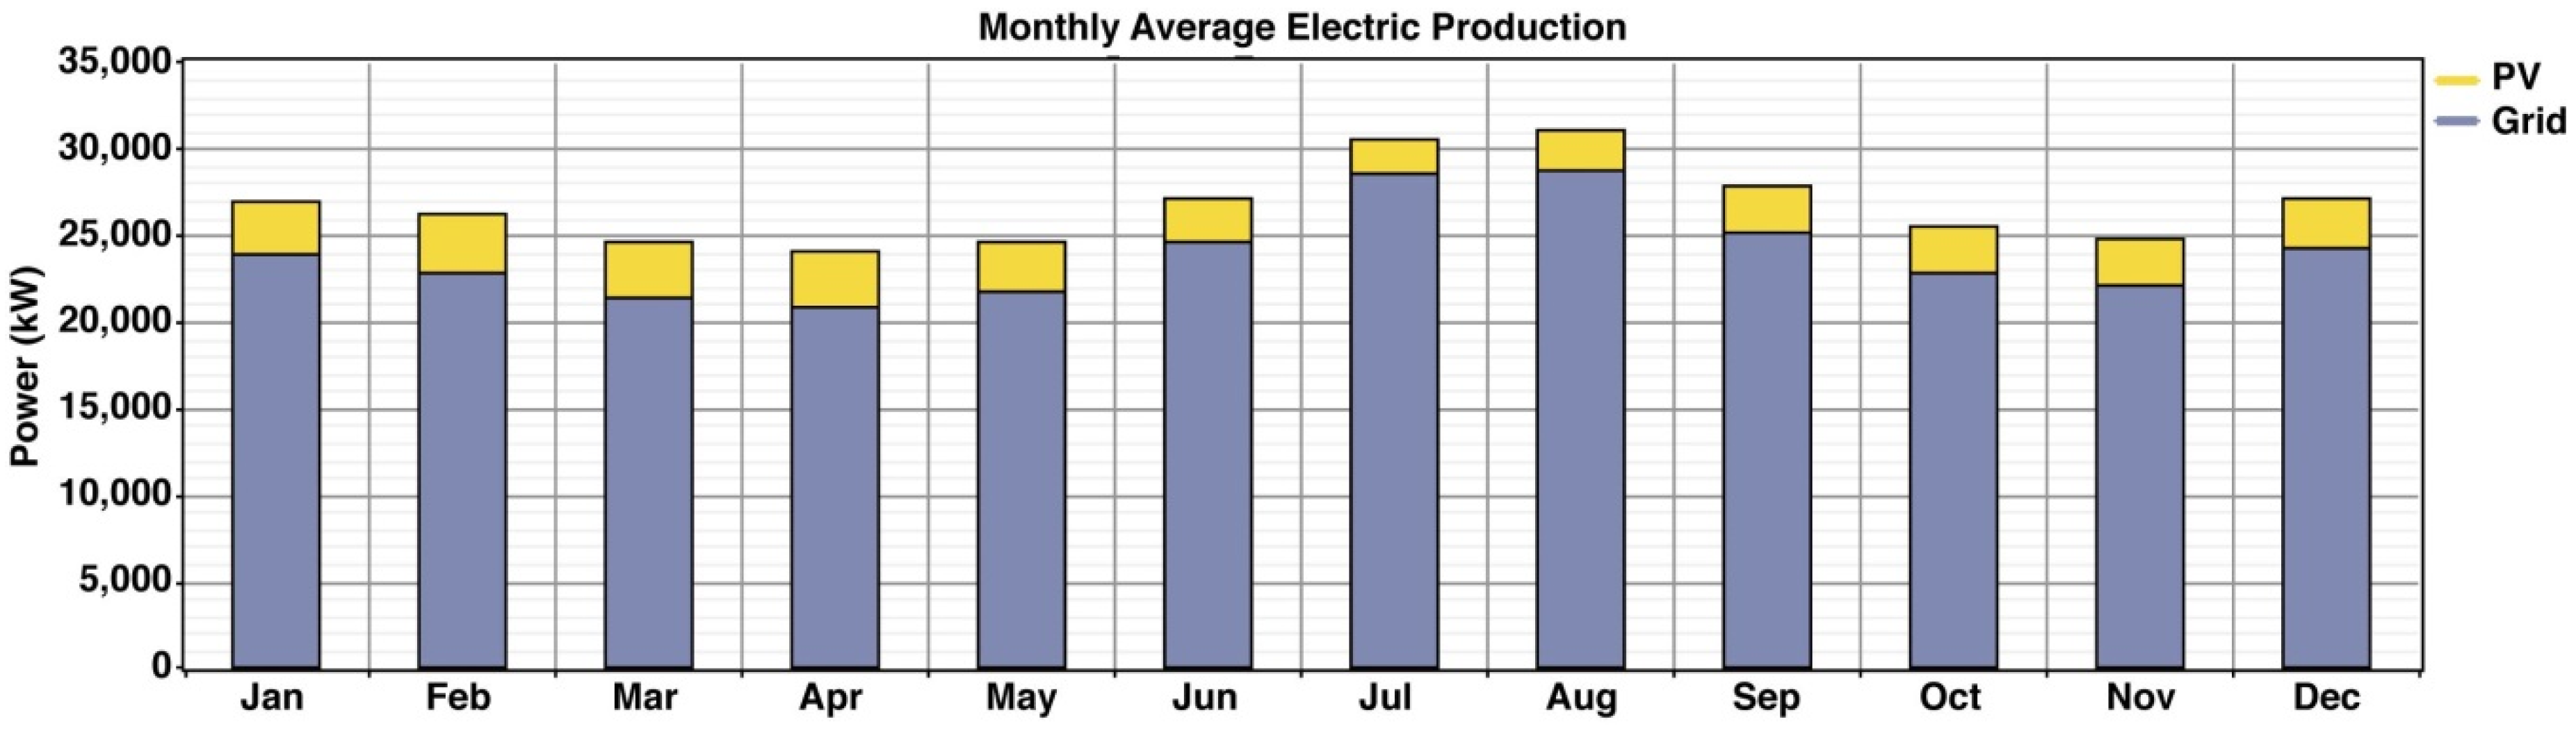
In this scenario, in which the electric load is increased to 120%, additional components, including photovoltaic panels, batteries, and converters, are installed. According to the HOMER simulation result, the optimal hybrid energy system consists of photovoltaic (PV) panels of 17,250 kW capacity, 12,000 converters, and 12,500 batteries to satisfy a 120% load increase. The PV panels produce 24,185,784 kWh/year, which equals 10% of the airport’s total load. Based on our assumption, the grid purchases total 209,591,648 kW. The average monthly electricity production is provided in
Figure 7. Based on the simulation results, the renewable fraction is calculated as 10%. The NPC of the second system is $1,226,763,904. The COE is $0.305/kWh, which is a little higher than the original COE. The optimized result is shown in the
Table 3.
3.3. Third Scenario: Expected Expansion to 140% of Load
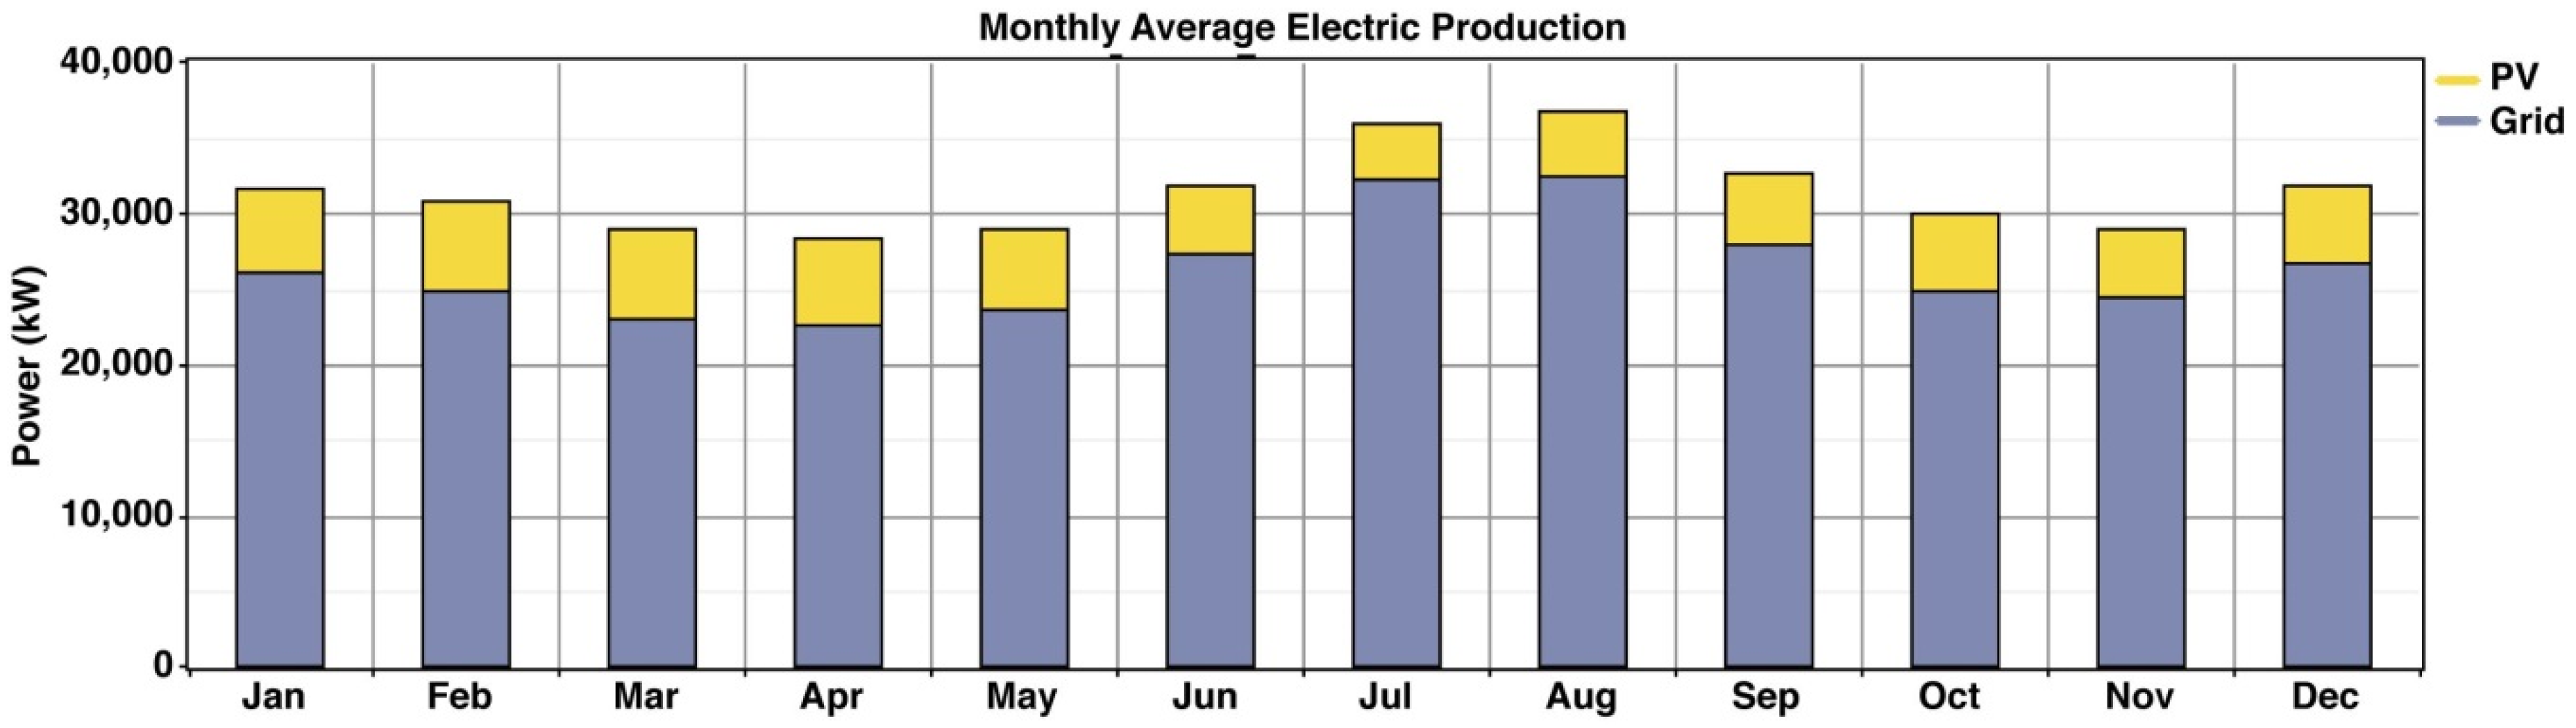
We assumed that the total energy consumption of Incheon International Airport would increase to 140% of the current load after the completion of new buildings. In accordance with the simulation result, the optimized system is configured as purchasing 40,000 kW from the main grid and using 31,500 kW capacity PV arrays, 22,000 converters, and 20,500 batteries to supply stable electric power to the airport. The average monthly electricity production is provided in
Figure 8. The NPC and COE of the optimal system are $1,409,816,320 and $0.300/kWh, respectively. The PV array produces 44,165,220 kWh/year. The grid purchases total 230,582,704 kWh. In this scenario, the renewable fraction is 16%. The optimized result is shown in the
Table 3.
4. Discussion
This study proposed the configuration of an optimized renewable power generation system for Incheon International Airport, South Korea, using HOMER simulation software. The main findings of the simulation are shown in
Table 3.
According to the results, the optimal renewable energy hybrid systems for the second and third expansions will provide 10% and 16%, respectively, of the airport’s power needs. According to simulation results, Incheon International Airport should enlarge the renewable energy ratio simultaneously with expansion construction. Since we controlled the primary load according to the current renewable energy ratio, it is economically feasible to cover most of the predicted increased electricity demand using PV power without an increased grid connection. Thus, the construction of the PV farm or the mass installation of rooftop PV panels should progress at the same time as the third expansion to increase the airport’s energy independence.
Second, according to the simulation results, we determined that a wind turbine is not an economically suitable option for Incheon International Airport. As previously mentioned, a wind turbine is not suitable for the airport’s renewable energy generation not only because of height limitations but also because the location’s wind speed is insufficient to produce electricity at an economically feasible price. Therefore, in the simulation analysis, a wind turbine was not recommended as an optimal result under any scenario. Today, Incheon International Airport has 5 wind turbines with a capacity of 10 kW and plans to install additional turbines. However, according to the scenario analysis, the optimal hybrid system requires the installation of PV arrays to meet the 120% and 140% load increases. Wind turbines are not required. Thus, the energy policy of Incheon International Airport should focus on PV power, not on wind turbines. Government policy also must change. The Ministry of Energy encourages the use of a variety of energy sources, particularly a hybrid combination of wind and solar resources. A hybrid system has advantages with respect to decreasing overreliance on certain energy sources and diversifying potential risk. However, to use such a system in the wrong location decreases economic feasibility. In the case of Incheon International Airport, PV power is the optimal way to simultaneously increase energy independence and economic feasibility.
Third, based on this lesson, we must reconsider the suitability of other renewable energy resources. For example, Incheon International Airport is currently attempting to adopt geothermal power generation as a third renewable energy source. However, based on our results, the wind turbine is not a feasible option either economically or institutionally. Thus, before Incheon International Airport tries to adopt another renewable energy source for diversification, this source should be compared with PV power before installation. In addition, according to our research results, the government’s policy on the introduction of renewable energy at public facilities should be reformulated to reflect geographical and institutional characteristics.
Finally, based on our results, the South Korean government should re-examine its entire renewable energy expansion policy. Government complexes, airports, and universities should not be the sole focus of this policy. In addition, other areas, such as islands and metropolitan cities, should be considered for inclusion if they exhibit suitable characteristics. A selective approach to the most suitable energy sources may be a more effective and feasible path for renewable energy expansion.
5. Conclusions
First, the generalization of the research results may be difficult because this study was conducted in a particular location. Climate data (such as solar radiation and wind speed), equipment variables (such as the type and price of PV technology, wind turbines, batteries, and converters), and economic variables (such as interest rates) may vary for different nations, manufacturers, and periods. However, the research method may be applicable to subjects.
Second, the reliability of a system cannot always be perfectly assured. An optimized hybrid renewable energy power system may become unreliable if the system is affected by a global energy issues, or a policy shift. Therefore, it is important to make a system reliable and to match supply and demand through batteries or energy storage systems.
Third, according to our HOMER simulation result, the optimal system that we recommend is mathematically optimal with respect to our actual data. However, there may be other solutions that cost less and that were not suggested by the HOMER simulation. The simulation process always suffers from certain limitations in producing its solutions, which cannot be adequately compensated for.
Fourth, errors will result from the assumptions we made for simulation efficiency and research significance. For example, the unit assumption and fixed load assumption may require adjustment to reflect actual circumstances. In future research, this limitation may be overcome through a different approach.
Finally, because a substantial number of panels, batteries, and converters are required, a large hybrid system can be more economical due to economies of scale. However, we were unable to consider economies of scale during the simulation, which are not certain. Therefore, a scaled-down process did not pose problems in this study.


