Article

The Livelihood Vulnerability of Rural Households in Earthquake-Stricken Areas—A Case Study of Ning’er, Yunnan Province

Institute of Geology, China Earthquake Administration, Beijing 100029, China
*
Author to whom correspondence should be addressed.
Sustainability 2016, 8(6), 566; https://0-doi-org.brum.beds.ac.uk/10.3390/su8060566
Submission received: 31 March 2016 / Revised: 1 June 2016 / Accepted: 13 June 2016 / Published: 17 June 2016

Abstract

:
Earthquakes happen suddenly and are immensely destructive. They not only destroy entire societal production and infrastructure systems but also seriously interfere with daily life and reduce opportunities to earn income in earthquake-affected areas. In this paper, using the Ning’er Ms 6.4 earthquake in 2007 as an example, we analyzed the livelihood vulnerability of rural households in Ning’er County, Yunnan, based on data from questionnaires and on-site interviews. The results showed that on the whole, local rural household livelihoods are relatively vulnerable in the earthquake-affected area of Ning’er. The main reason for the high level of vulnerability of rural households is the lack of single or multiple incomes. Due to the shortage of household income, the capacity of rural households to manage the aftermath of an earthquake is low. Improving the income allocation and transformation level and expanding methods of earning income is an effective way for rural households to decrease livelihood vulnerability in earthquake-prone areas. Some suggestions are given for local rural households to enhance their livelihood income levels in the event of earthquakes.

1. Introduction

Earthquakes have caused the most devastating natural disasters in the 20th and 21st centuries [1,2], which is an important factor that influences a household’s livelihood. Unlike many other types of natural disasters, no warning system is available for earthquakes. A serious earthquake can not only destroy an entire society’s production and infrastructure systems but also seriously interfere with daily life and reduce opportunities to earn income in earthquake-affected areas. Because a household’s livelihood system is likely to be seriously affected by the earthquake, many households face a greater probability of poverty in the future; it is difficult for these households to even restore their income levels to pre-disaster levels.
China is frequently affected by earthquakes, which affect most regions. Since 1900, an average of four earthquakes of over Ms 6.0 (surface wave magnitude) have occurred every year in mainland China, and six major earthquakes of Ms 8.0 and over have occurred in the same period [3]. For example, an Ms 8.0 earthquake occurred in 2008 in Wenchuan County, Sichuan—the largest earthquake in China for over 50 years. The earthquake caused more than 80,000 deaths (including missing people) and significantly damaged houses, public buildings, and infrastructure. The losses were estimated at a minimum of 121.53 billion USD (exchange rate in May 2008). Household incomes were seriously affected by the disaster. Due to the relatively weak disaster mitigation measures and limited conditions of social and economic development, the livelihood vulnerability of rural households is relatively higher than urban households. The ability for a rural household to manage the aftermath of a disaster is much weaker, and the frequent occurrence of natural disasters has the potential to cause serious harm to the local agricultural economy, which is also a key cause of rural poverty. In contrast with urban households, rural households are more likely to experience daily hardship as the result of an earthquake. For example, a study of rural household vulnerability in an earthquake-stricken area of Wenchuan showed that although the average income of a relatively small number of households was below the poverty line after receiving a government post-disaster subsidy, a much larger number of households had a higher probability of living in poverty in the future [4]. Therefore, it is very important for rural households to enhance their ability to protect against the earthquakes themselves and minimize the losses from earthquakes by reducing livelihood vulnerability in earthquake-stricken areas.
The ability to measure vulnerability is increasingly being seen as a key step towards effective risk reduction and the promotion of a disaster-resilient culture. In the light of the increasing frequency of disasters and continuing environmental degradation, measuring vulnerability is a crucial task if science is to help support the transition to a more sustainable world [5]. The declaration of the World Conference on Disaster Risk Reduction, the Sendai Framework for Disaster Risk Reduction 2015–2030, indicates that the starting point for reducing disaster risks and promoting a culture of disaster resilience lies in the knowledge of the hazards; the physical, social, economic, and environmental vulnerabilities to disasters that most societies face; and the ways in which hazards and vulnerabilities are changing in the short and long term, followed by action taken on the basis of that knowledge [6].
The “sustainable livelihood framework” has been seen as a framework or vade-mecum for vulnerability assessment. A livelihood involves all aspects of human production and life, which is the combination of resources used by people and livelihood activities, and comprises the capabilities, assets (including both material and social resources) and activities required for a means of living [7,8,
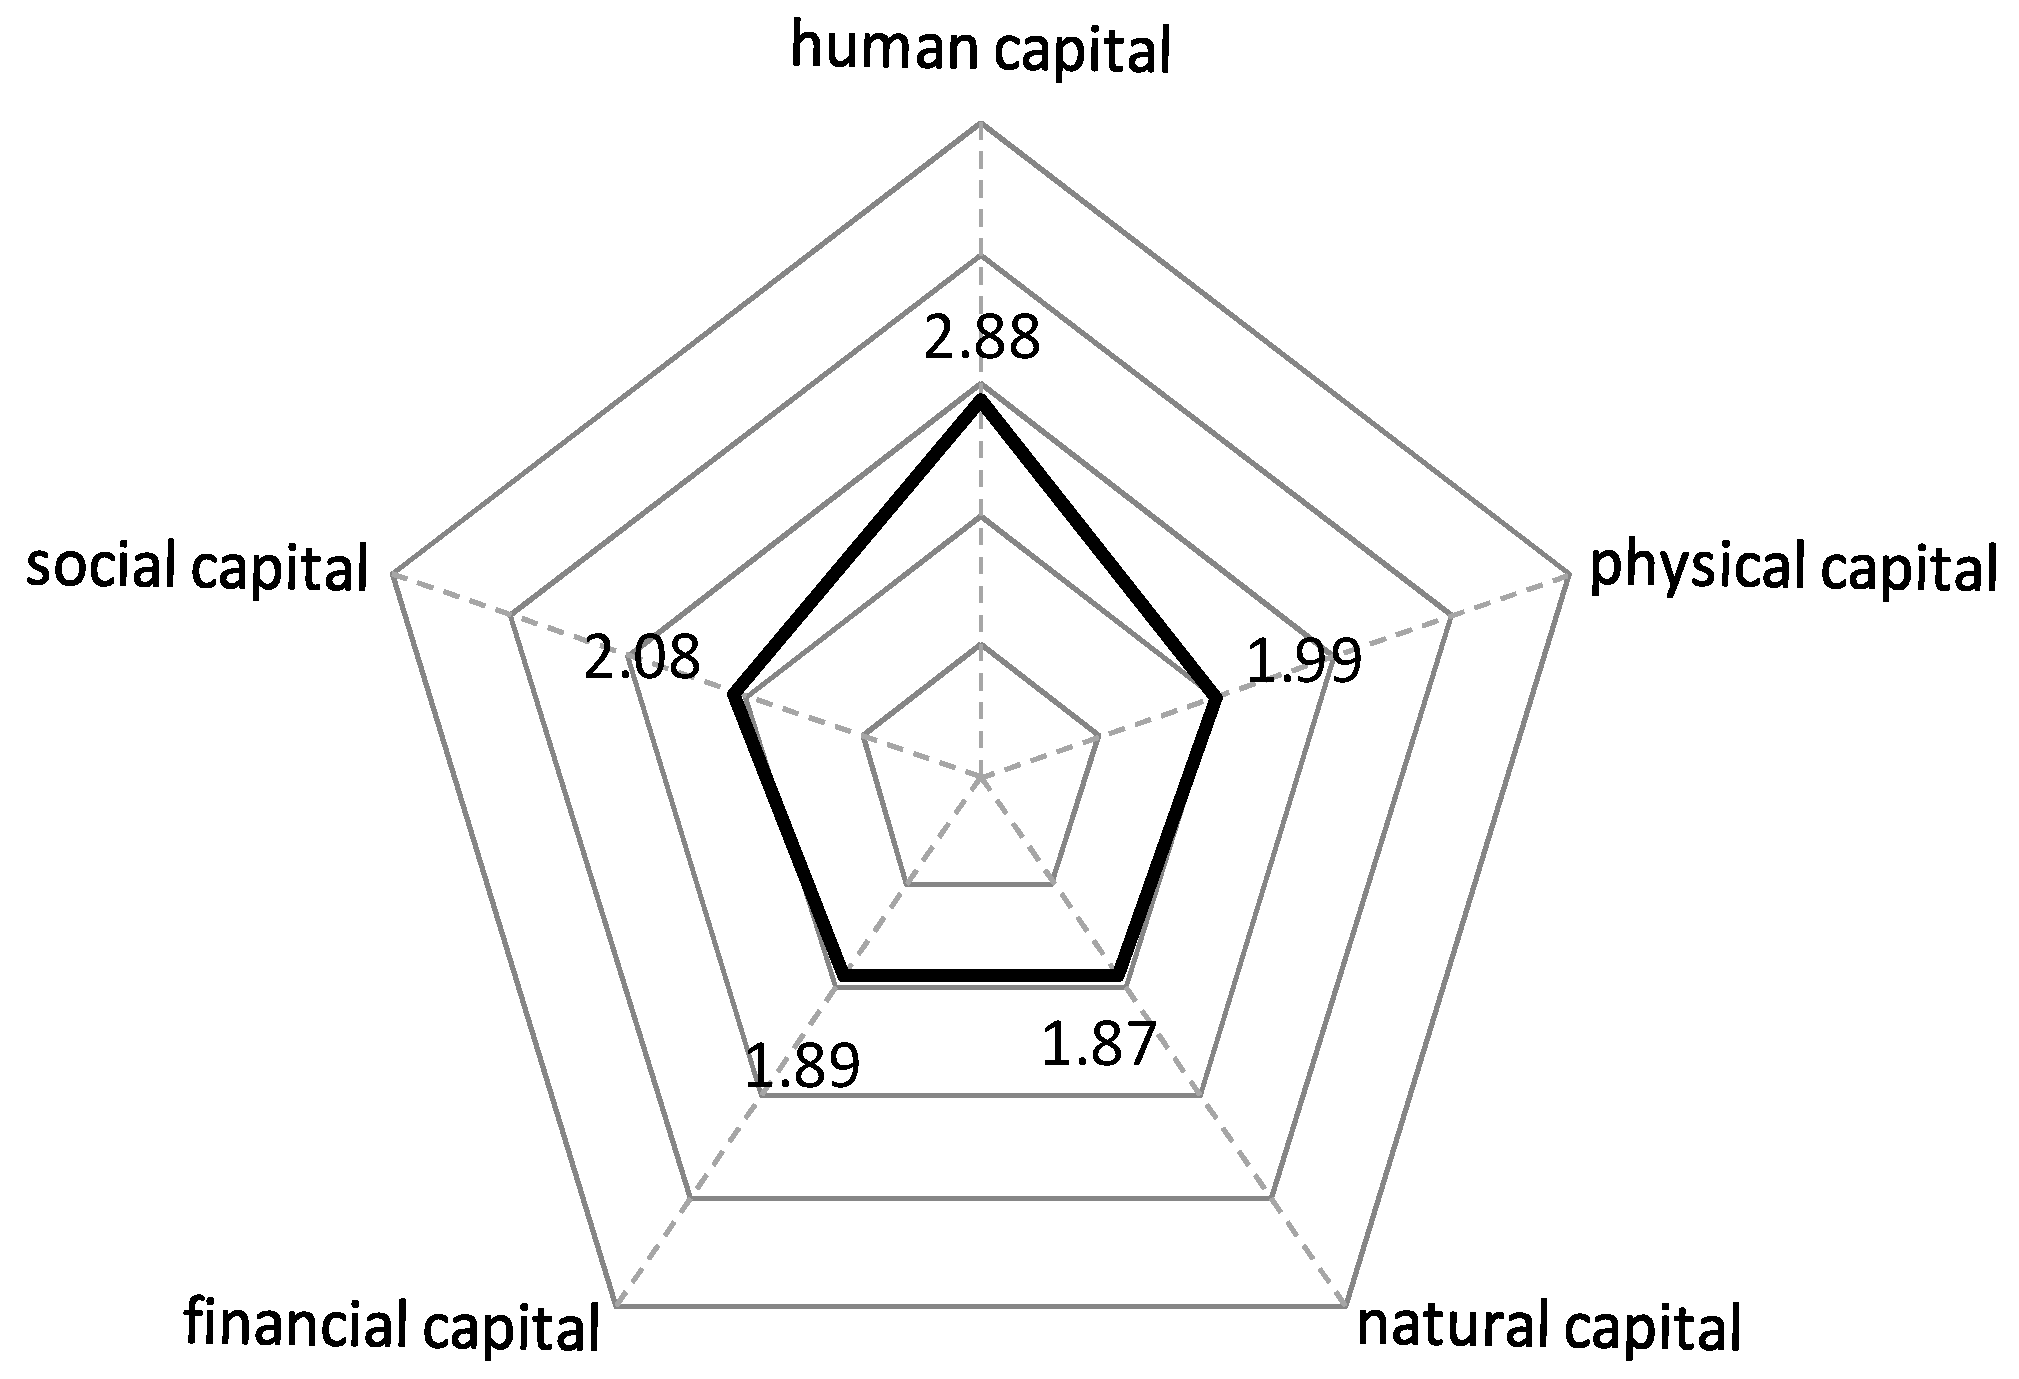
9]. The assets lie at the core of the livelihood framework “within” the vulnerability context. The livelihood framework identifies five core asset categories or types of capital upon which livelihoods are built: human capital, physical capital, natural capital, financial capital, and social capital [10]. Human capital represents the skills, knowledge, the ability to work, and good health, which together enable people to pursue different livelihood strategies and achieve their livelihood objectives. At a household level, human capital is considered the amount and quality of labor available; this varies according to household size, skill level, leadership potential, health status, etc. Physical capital comprises the basic infrastructure and producer goods needed to support livelihoods. Natural capital is the term used for the natural resource stocks from which resources flow and services (e.g., nutrient cycling, erosion protection) necessary to ensure livelihoods are derived. Financial capital denotes the financial resources that people use to achieve their livelihood objectives. Financial capital is probably the most versatile of the five categories of assets; it can be converted into other types of capital and can be used for the direct achievement of livelihood outcomes. Social capital refers to the social resources from which people draw in pursuit of their livelihood objectives, such as networks and connectedness, membership of more formalized groups, relationships of trust, reciprocity, and exchanges, etc. It is important to note that a single physical asset can generate multiple benefits. If one has secure access to land (natural capital), they may also be well-endowed with financial capital as they are able to use the land not only for direct production activities but also as collateral for loans. Similarly, livestock may generate social capital (prestige and connectedness to the community) for owners while also being used as productive physical capital. Therefore, the key elements of this approach are the five livelihood assets or capital; the “vulnerability context”, which is viewed as shocks, trends, and seasonality; and the influence of transforming structures for improved livelihood strategies and their outcomes. The approach underlines the necessity of empowering local marginalized groups to reduce vulnerability effectively (for more details, see [7,11]). A central objective of the approach was to provide a method that views people and communities on the basis of their daily needs instead of implementing ready-made, general interventions and solutions without acknowledging the various capabilities that poor people offer [12]. The approach views vulnerability as a broad concept, encompassing livelihood assets and their access and vulnerable context elements such as shocks, seasonality, and trends as well as institutional structures and processes.
The sustainable livelihood approach has proven useful for assessing the ability of households to withstand shocks such as natural disasters, epidemics, or civil conflict. Vulnerability assessments based on the sustainable livelihood framework are widely accepted in case studies for its attention to vulnerable groups. On the basis of the sustainable livelihood framework, vulnerability assessments of rural households had been performed in South Asia, Africa, and Central America. For example, based on the sustainable livelihood framework, Twigg [13] explored the impact of disasters on livelihoods in South Asia and assessed the livelihood needs and opportunities that result from a disaster. Whitehead [14] analyzed livelihood changes from theoretical, methodological, and empirical perspectives from the northern to eastern regions of Ghana. Sharp [15,16] qualitatively assessed the destitution in rural Ethiopia by constructing a destitution index based on the livelihood framework. Elasha et al. [17] assessed community resilience to climate change using the sustainable livelihood approach in Sudan. Siegel [18] used an asset-based approach to identify drivers of sustainable rural growth and poverty reduction in Central America and noted that the asset-based approach is an appropriate conceptual framework for understanding poor rural households in Central America and identifying drivers of poverty-reducing growth. For economic growth to be poverty reducing in a sustainable manner, it is critical to have a better understanding of poor households’ asset situations and the way in which assets interact with the context to influence the selection of livelihood strategies that, in turn, determine well-being. Hahn et al. [19] analyzed the livelihood vulnerability of communities to climate variability and change in the Moma and Mabote Districts of Mozambique.
Some work on rural household vulnerability had also been conducted in China. For example, Han [20] analyzed the relationship between vulnerability and rural poverty, and he believed that vulnerability is not only an important aspect of poverty but is also one of the main reasons for falling back into poverty. Chen [21] gave an integrated conceptual framework for risk and vulnerability assessment, and analyzed 108 rural households’ risk and vulnerability. Based on questionnaires completed by 352 rural households, Luo et al. [22] discussed rural households’ disaster vulnerability and influencing factors through an analysis of livelihood assets in the Jianghan Plain. Gu [23] analyzed the impact of labor migration on the vulnerability of rural households’ livelihoods in Hechuan, Chongqing. Li et al. [24] established the indicator system for assessing livelihood assets and analyzed rural households’ vulnerability by qualitatively assessing the income in four rural areas in China. Yan et al. [25] developed a livelihood vulnerability assessment index system on the basis of the sustainable livelihood framework and appraise the livelihood vulnerability values of 11 townships based on data from 879 sample households in the eastern Tibetan Plateau. Additionally, Wang et al. [26] analyzed the characteristics of seismic disaster in rural areas and relative disaster reduction countermeasures in China and pointed out that the implementation of property insurance and housing loan is the main policy of reducing the seismic risk in rural area. Ge et al. [
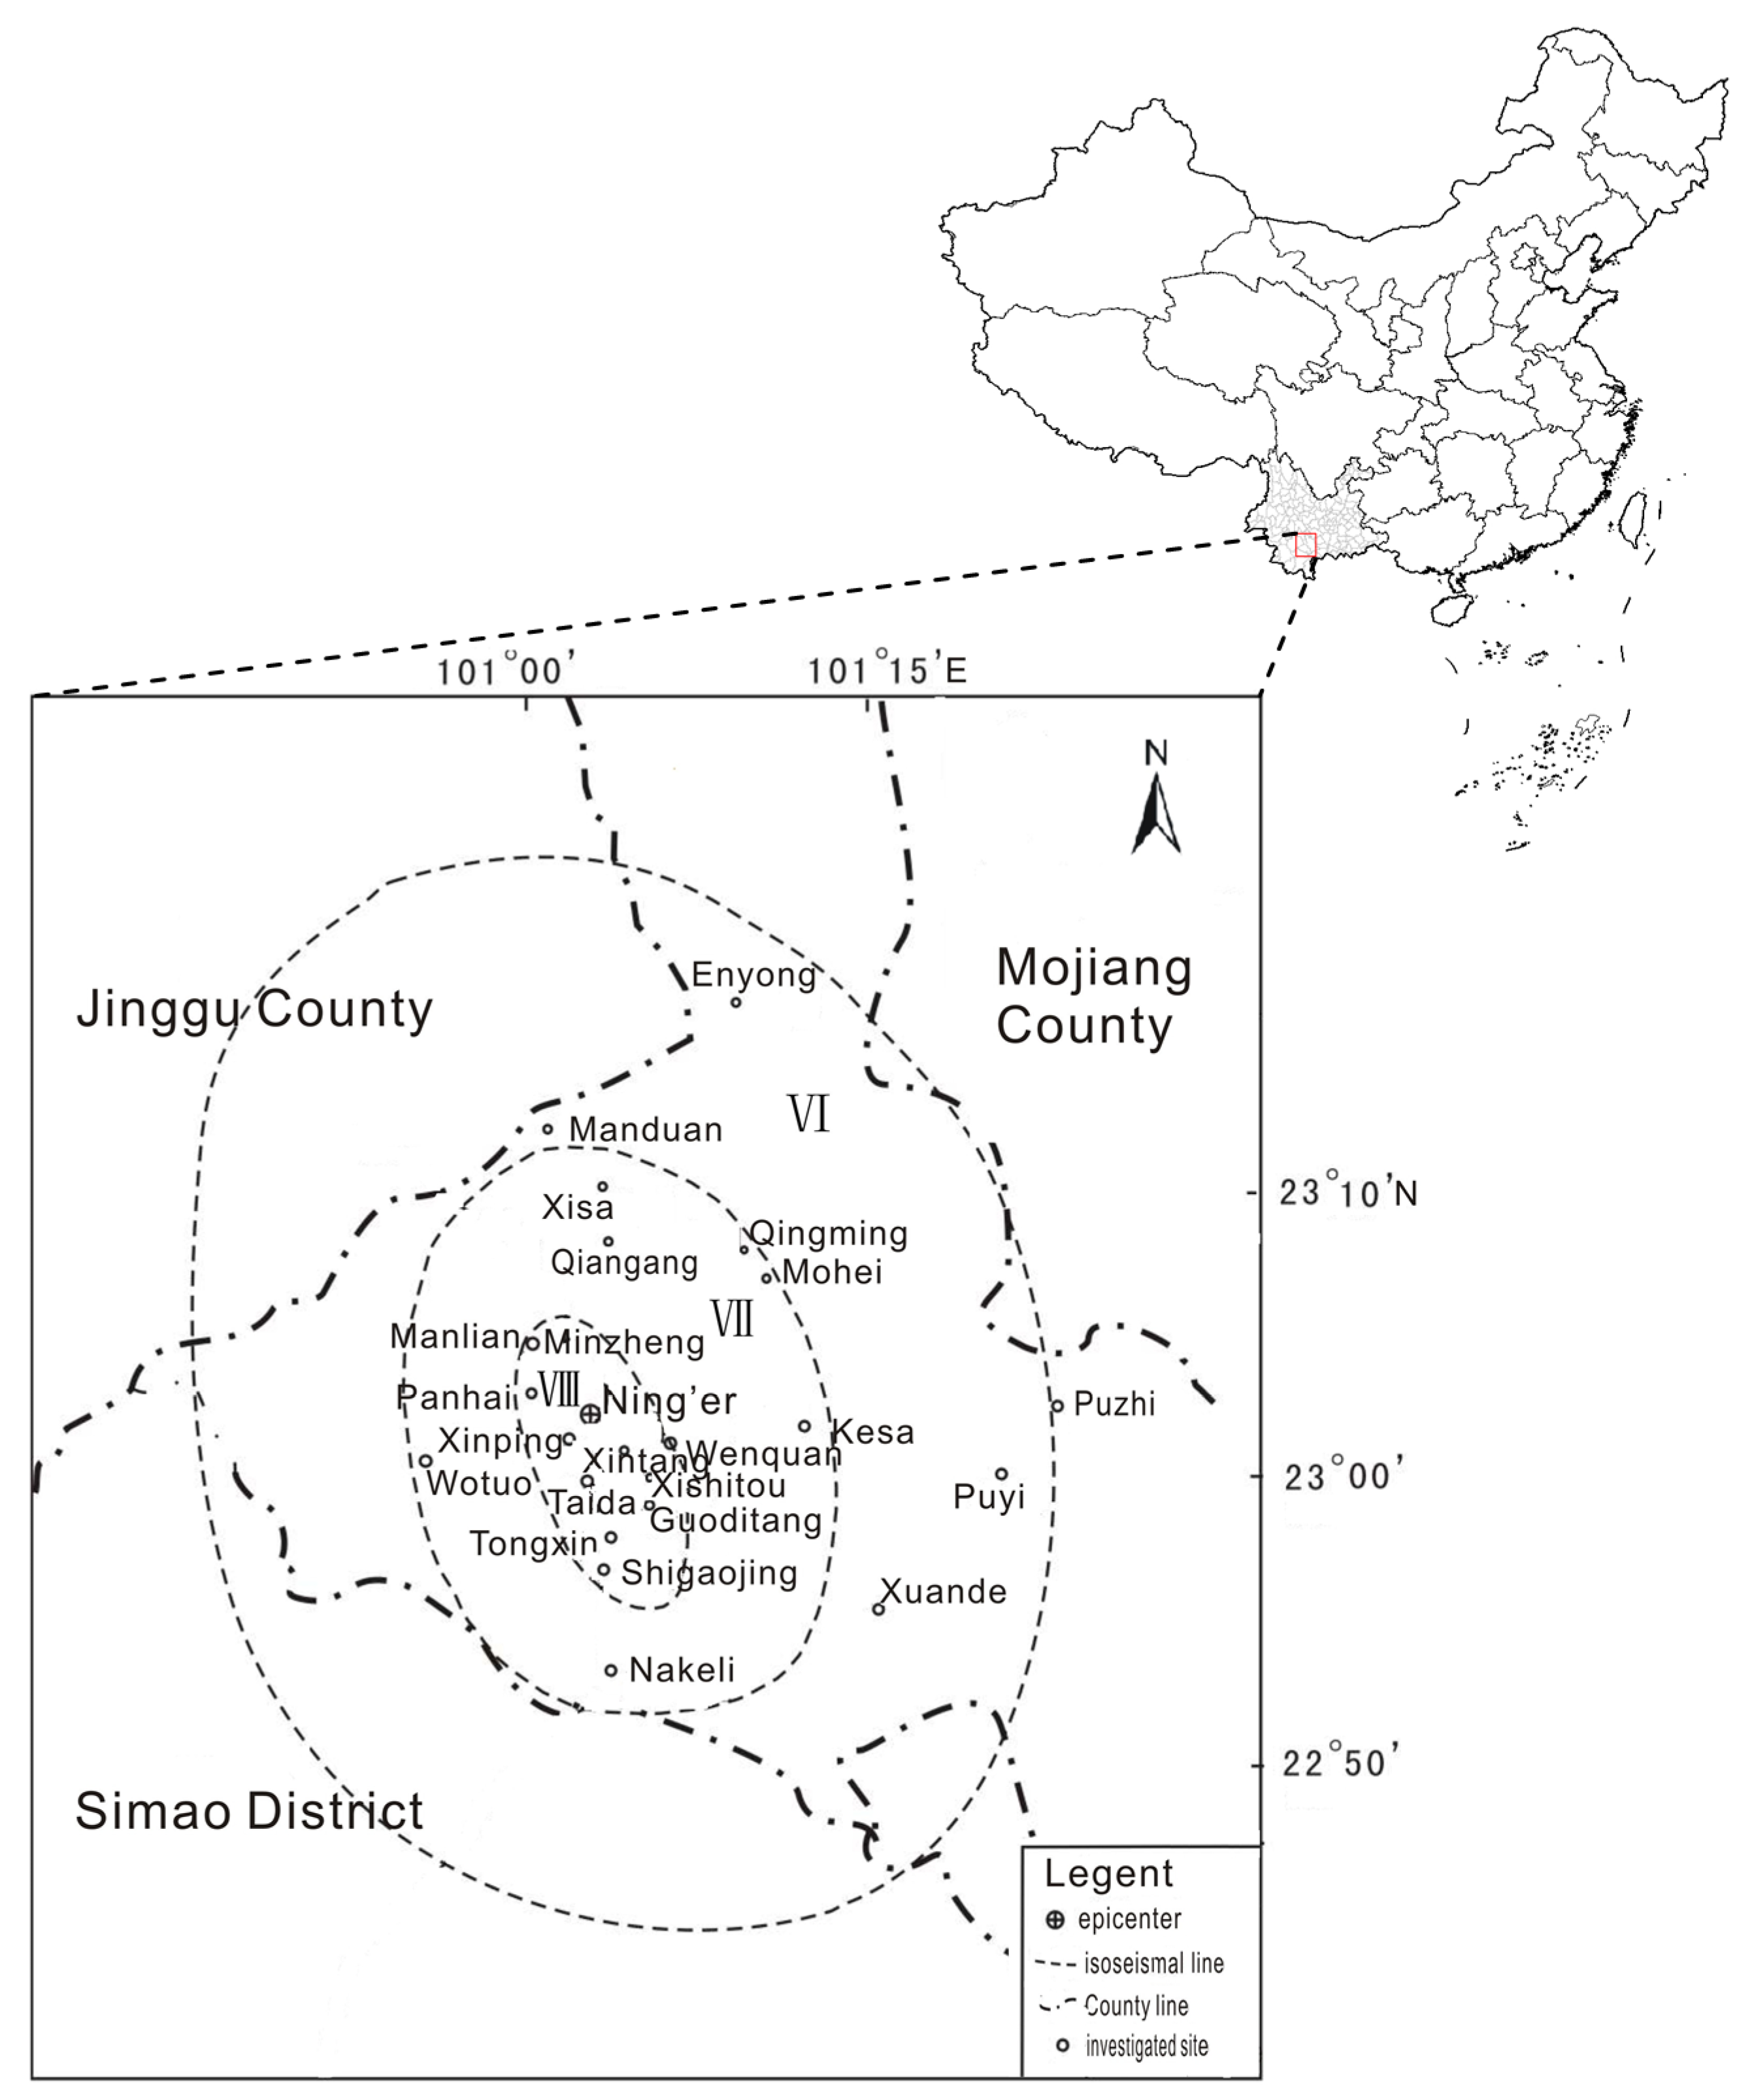
27] assessed the social vulnerability of households in different districts of the Changsha region by constructing a household vulnerability assessment model. Although there are some studies on rural household vulnerability, little research has thus far been performed on livelihood vulnerability in earthquake-stricken areas. Earthquake disaster has the characteristics of suddenness and huge destruction, which was different from many other types of natural disasters. Therefore, it is necessary to continually increase empirical and theoretical research to strengthen the understanding of livelihood vulnerability in earthquake-stricken areas of China. In view of the above, this study aims to provide an empirical study on livelihood vulnerability of rural households in Ning’er, Yunnan Province, which had been struck by an Ms 6.4 earthquake in 2007, by developing an assessment index of livelihood vulnerability based on the sustainable livelihood framework. In this paper, we focused on three points: (1) developing an assessment index of livelihood vulnerability for rural households in earthquake-stricken areas of China; (2) analyzing the variables associated with the livelihood vulnerability of rural households; (3) discussing the principal factors influencing local rural households’ livelihood vulnerability and offering suggestions for enhancing rural households’ incomes after earthquakes.
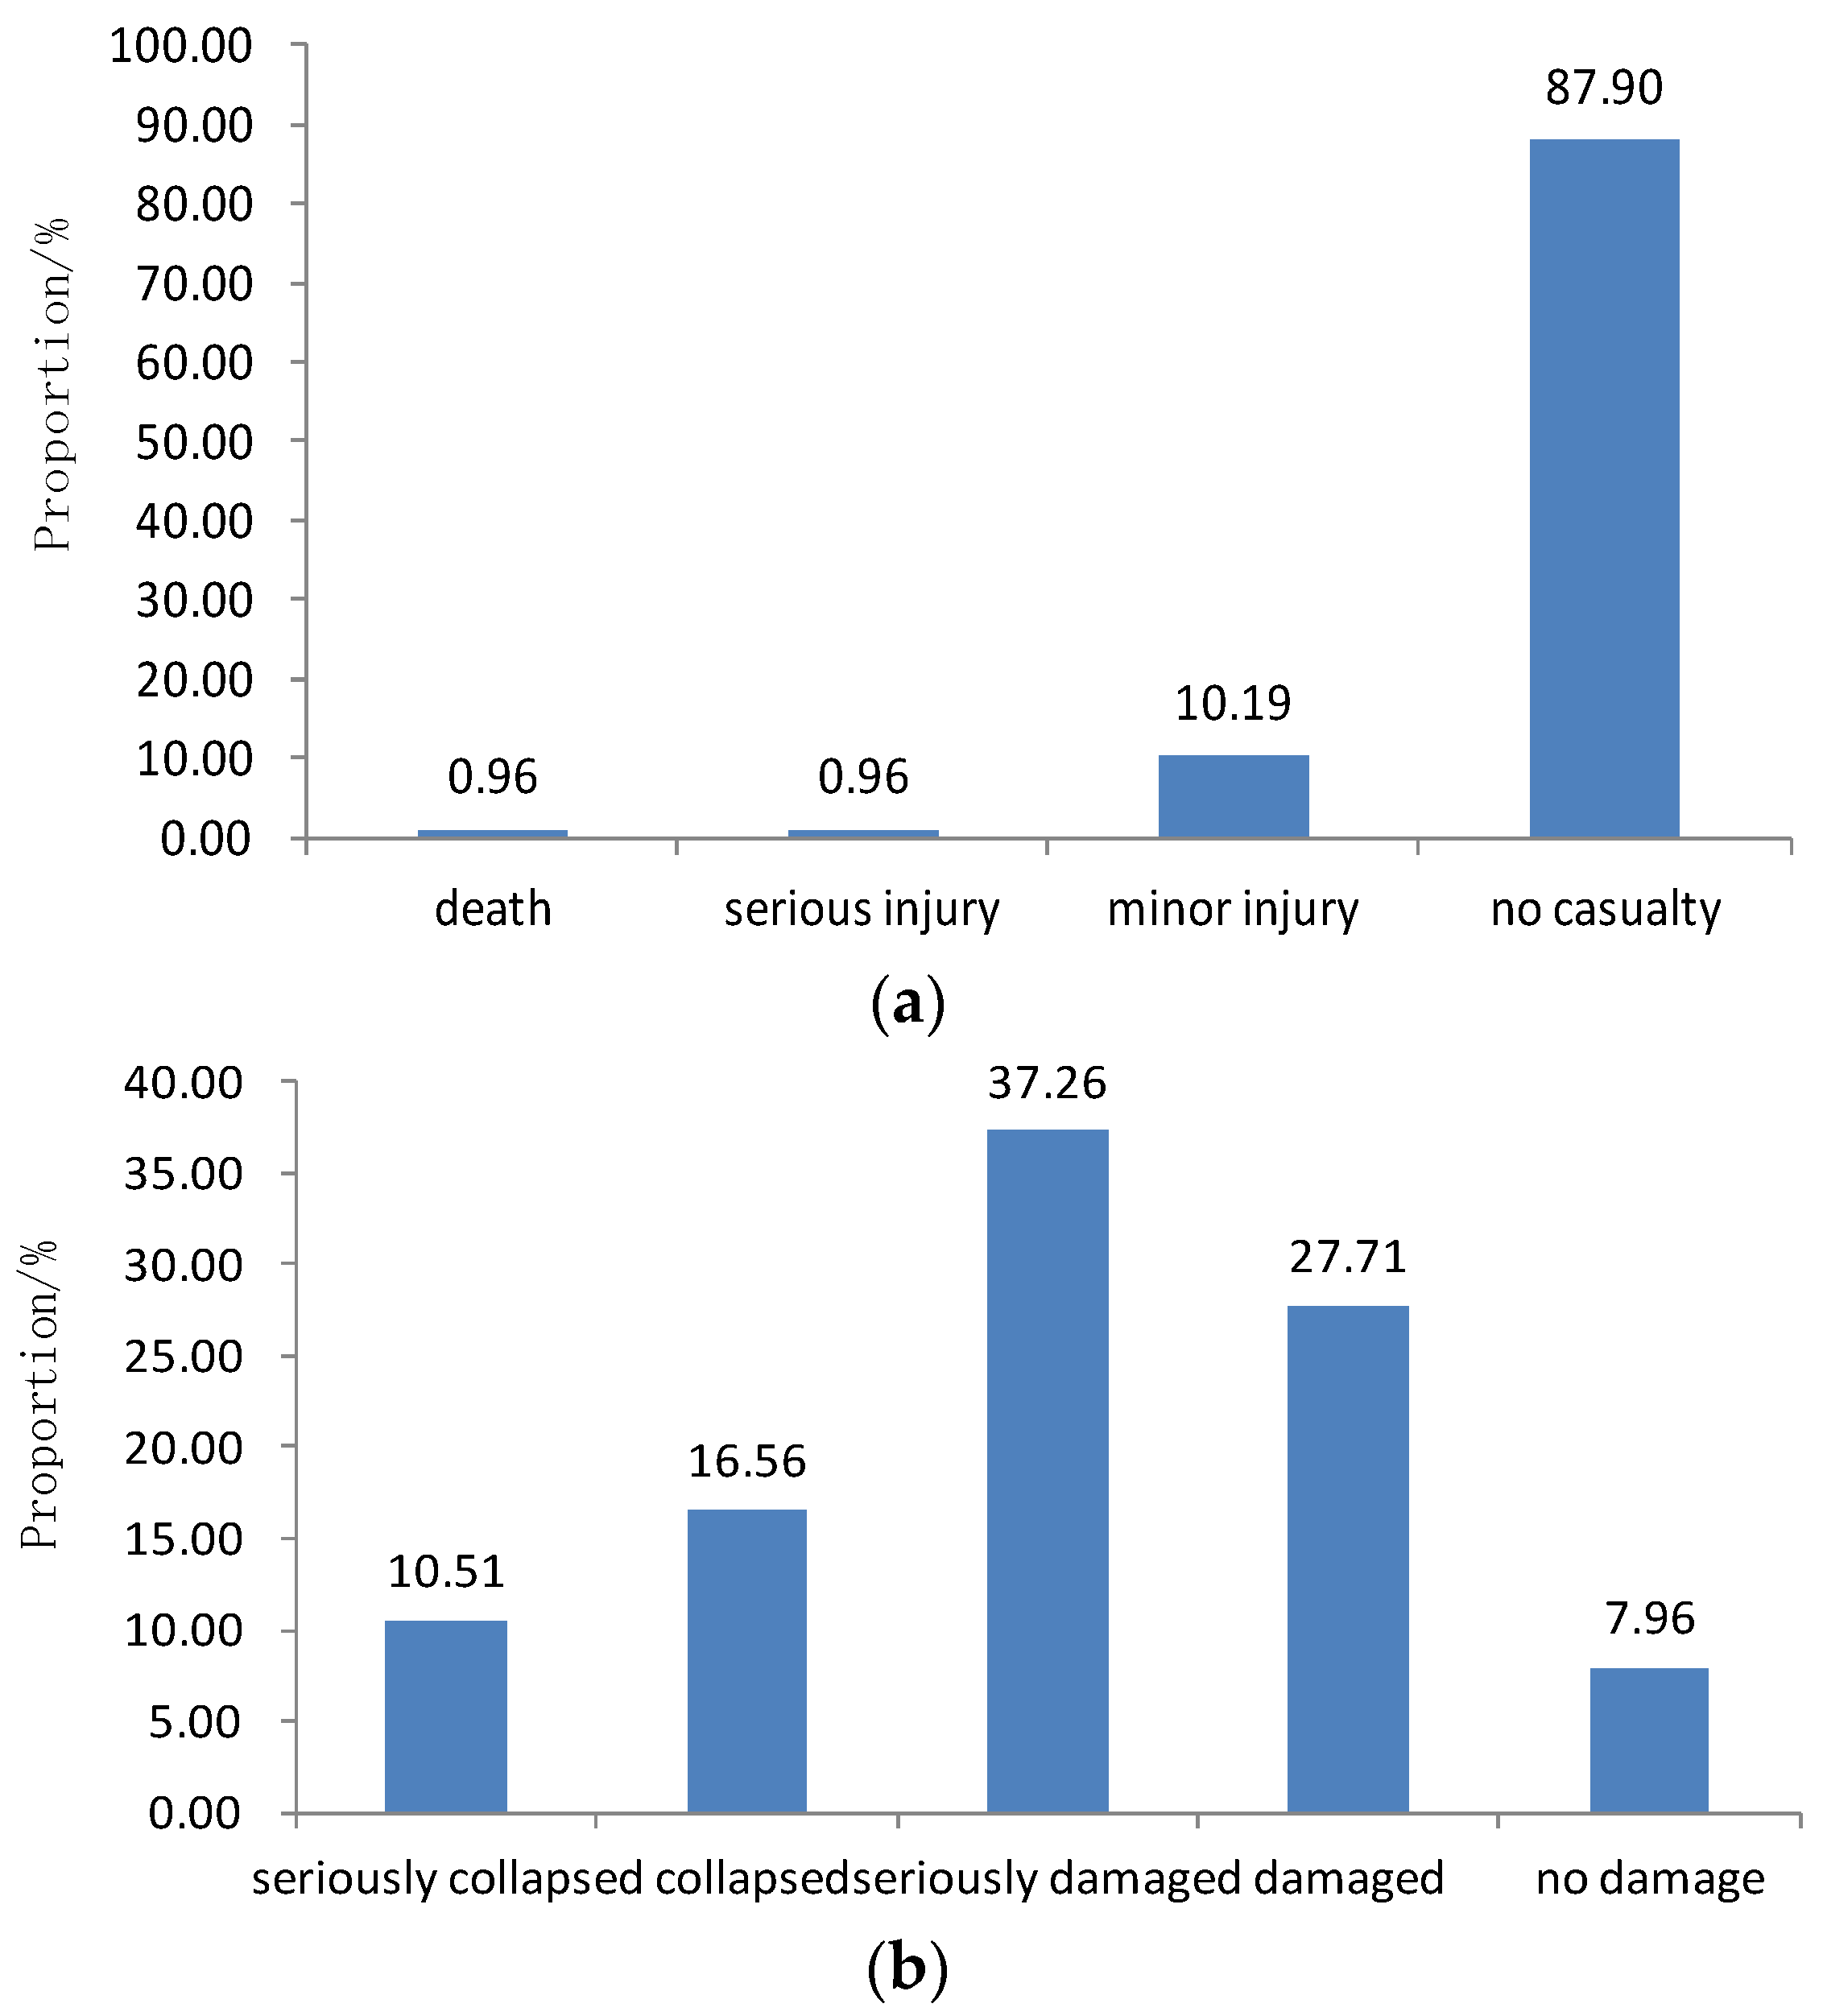
2. Data and Method

2.1. Research Area

On 3 June 2007, an Ms 6.4 earthquake occurred in Ning’er County, Yunnan Province, China. The macroseismic epicenter of this earthquake was located approximately 3 km to the south of Ning’er county (23.03°N, 101.05°E), and the focal depth is 5 km. The magistoseismic area (seismic intensity VIII) included Ning’er town and its surrounding mountainous areas. The area affected by the earthquake was up to 3890 km2 (Figure 1). This earthquake damaged a large number of buildings; 3 people were killed, more than 300 people injured, and 536,000 people were affected [28]. Since 1884, Ning’er has been a seismically active area, with nine earthquakes with magnitudes larger than 5 near the epicenter of the Ms 6.4 earthquake, six of which had magnitudes larger than 6 and the largest of which was magnitude 6.8, occurring on 1 March 1979. This area is thus considered an area with frequent occurrences of strong earthquakes [29].
This study was conducted in Ning’er County, the area that was most severely struck by the Ms 6.4 earthquake in 2007 (Figure 1). The research area is located in the southwest of Yunnan Province. Its highest altitude is over 2400 m, and the lowest is approximately 600 m. The administrative districts of Ning’er County include two towns and seven townships, which is considered a typical agricultural county. The agricultural population accounts for 81% of the county’s total population, but agricultural GDP only accounts for 34.5% of the total GDP. The climate of the area is suitable for a variety of cash crops, but because of the low industrial structure, the rural economic income level is very low [30].

2.2. Livelihood Vulnerability Evaluation Indicators

This study defines livelihood vulnerability as the degree to which a rural household is susceptible to earthquakes, which includes two components: the risk of rural household being influenced by earthquakes and the capacity to successfully manage adverse effects. Earthquake risk is indicated by the disaster loss of rural households, including loss of life and property. The capacity to successfully manage adverse effects is expressed by the level of income, which includes five sub-components (Table 1).
To quantitatively assess the livelihood vulnerability of rural household in the area studied, this study establishes the indicators of livelihood vulnerability and develops an assessment index of livelihood vulnerability (LVI) based on the sustainable livelihood framework. Table 1 shows the evaluation indicators for a rural household’s livelihood vulnerability in the area studied. The evaluation indicators for earthquake risk include casualties and buildings damaged. The indicators of human capital include the proportion of healthy adults (18 to 60 old years) and highly educated people to the total number of people in the household. The level of building vulnerability is one of the most important aspects of physical capital that affects family survival and development after major earthquakes. Therefore, the indicator of the building structure of households is used to assess physical capital. Crop area per capita can be considered indicators of natural capital. Financial capital mainly refers to the funds and financial resources that play an intermediary role in the livelihood capital conversion. In this study, the indicators of financial capital include annual family income and household savings. Social capital describes the social resources that the households can use to earn a living. For the purposes of this study, the indicator of family members and property insured (or lack thereof) is used to assess social capital.
The livelihood vulnerability index (LVI) uses a balanced weighted average (W) approach [31], where each sub-component contributes equally to the overall index. To avoid the effects of a different number of indicators for sub-components, this study then uses the simple approach of applying equal weight to obtain an average assessment value of the sub-components. Therefore, the LVIi of rural household i can be expressed as follows:
LVIi = ERi − LCi
where LVIi is the index reflecting the overall livelihood vulnerability level of rural household i. ERi is the earthquake risk. The greater the value of ERi is, the higher the earthquake risk is. LCi is the capacity to successfully manage earthquake effects. The greater the value of LCi is, the greater the capacity to successfully manage earthquake effects is.
Earthquake risk (ERi) can be obtained using the following expression:
E R i = W c a C a i + W b d B d i W c a + W b d
where Cai represents casualties and Bdi represents the degree of damage to buildings.
The capacity to successfully manage earthquake effects (LCi) can be expressed as:
L C i = W h u H u i + W p y P y i + W n r N r i + W f n F n i + W s o S o i W h u + W p y + W n r + W f n + W s o
where Hui, Pyi, Nri, Fni, Soi, represent the human capital, physical capital, natural capital, financial capital, and social capital of rural household i, respectively.
Because each of the sub-components is measured on a different scale, it was first necessary to standardize each as an index. We standardized each indicator of the sub-components according to the following criteria: casualties and buildings damaged were assigned values from 1 to 5 according to the number of lives lost and degree of damage to buildings, respectively. The greater the value is, the greater the loss of life and buildings damaged are. The proportion of healthy adults and highly educated people were assigned values from 1 to 5, respectively, according to the corresponding proportion values—the greater the value, the richer the human capital of the household. The building structure of households was assigned a value from 1 to 5, according to the resilience of building structures to earthquakes—the greater the value, the greater the resilience of the building structure to earthquakes. Crop area per capita was assigned a value from 1 to 5 based on the actual area of crops per capita; the greater the value, the larger the actual area of crops per capita is. Annual family income and household incomes were assigned values from 1 to 5, respectively, according to the corresponding proportion values. The indicator of insurance was assigned values from 1 to 5 according to the insurance purchased for family members and property; the greater the value, the more insurance that is bought for family members and property.
Based on the above criteria and formulas, we were able to obtain the livelihood vulnerability index values (LVI), including the values for earthquake risk (ER) and the capacity to successfully manage earthquake effects (LC). The LVI is a relative variable, the values of which may be positive or negative. If the value is positive, it will indicate that the capacity of the household to successfully manage earthquake effects is lower than the earthquake risk level and that the livelihood vulnerability level of the household is high; on the contrary, if the value is negative, the reverse will be true and the livelihood vulnerability level of the household is low. The greater the value LVI is, the higher the livelihood vulnerability level of rural household is. At the same time, based on the ER and LC, we define rural households with LVI values at or over 1.0 as highly vulnerable households to earthquakes in the area studied.

2.3. Questionnaire Survey

This study relies on a questionnaire-based survey and interviews conducted in Ning’er County, Yunnan Province in October 2007. To assess the livelihood vulnerability level of rural households, a 14-question survey was administered to rural households in Ning’er County, the area affected by the earthquake. The questionnaire comprises three parts: (1) earthquake risk; (2) the capacity to successfully manage earthquake effects; (3) the personal characteristics of the respondents.
To ensure response quality and high survey response rates, the household head was selected as the respondent in this study. The respondents were selected by a combination of cluster and random sampling methods. Specifically, we first selected investigation sites (villages) for the research based on cluster sampling and the effects of the earthquakes. We then selected rural households at each investigation site (villages) using random sampling. Finally, we selected the household head as the respondent to complete the interview and questionnaire. The investigation sites span two towns and five townships (earthquake intensity from VIII to VI) (Figure 1), and a total of 320 questionnaires and face-to-face interviews were completed by the respondents of 23 villages in Ning’er County. Because six respondents did not complete the questionnaire, the final sample contained information from 314 respondents. The overall response rate in this study was 98.13%. The sample size is sufficiently large to meet the requirements (36,496 rural households in 2007 in Ning’er County) of a 95% confidence level and 0.05 sampling error [32,33].

2.4. Sample and Data Processing

2.4.1. Sample Characteristics

Table 2 presents the basic characteristics of the respondents and their households. Males comprised 69.75% and women comprised 30.25% of the respondents. This is consistent with the fact that males are usually the heads of the household in rural areas in China. The majority of the respondents range from 30 to 50 years old—accounting for 63.37% of the total—and belonged to the Han, Yi, or Hani ethnic groups—accounting for 39.81%, 28.98%, and 23.57% of the total, respectively. The number of family members is usually 4–5 persons, accounting for 63.70% of households. With respect to earthquake experiences, the results indicated that over 85% of the respondents had experienced an earthquake prior to the 2007 Ning’er earthquake, while only 14.97% had not. Moreover, 65.61% of the respondents had experienced more than one earthquake prior to the Ning’er earthquake.

2.4.2. Data Processing and Analysis

The survey responses were entered in the Epidata Management System, a survey data management program used to construct a standard database on the LVI of rural households. We then estimated the livelihood vulnerability level of rural households based on the livelihood vulnerability evaluation indicators in Ning’er County.
In particular, the data analysis was conducted as follows: First, we assessed the earthquake risk and capacity to successfully manage earthquake effects of rural households. Next, we performed a quantitative assessment regarding the livelihood vulnerability level of local rural households. The last step was to analyze the differences among local rural households and identify the reasons for the differences by comparing the characteristics of livelihood vulnerability among rural households.

3. Livelihood Vulnerabilities of Rural Households

3.1. Earthquake Risk

Earthquake risk (ER) was indicated by two sub-components, loss of life and loss of property, which were assessed by casualties and buildings damaged, respectively. Figure 2a presents the casualties from rural households in the area studied. It was found that 87.90% (276 households) of rural households had no casualties in the Ning’er earthquake. The proportion of rural households in which a member received a minor injury is approximately 10.19% (32 households). The proportion of rural households in which a member was seriously injured or killed comprised only six households or 1.92% of the total number of rural households. Figure 2b presents the number of buildings damaged from rural households in the area studied. We can see that 92.04% (289 households) of buildings in rural households were damaged in the Ning’er earthquake. The proportion of rural households with buildings that collapsed was 27.07% (85 households). The proportion of rural households with no buildings damaged was only 7.96% (25 households) of all rural households.
Based on the expression for the ER assessment, we can quantitatively calculate the earthquake risk indexes (ERI) of rural households in Ning’er County. The result (Table 3) shows that the average ERI of rural households reached 2.08, which indicates a moderate risk for earthquakes. Rural households with ERIs of over 3.0 (indicating a high risk level for earthquakes) account for 14.02% (44 households) of the total. Rural households with a low risk level for earthquakes account for 35.03% (110 households) of all samples. Additionally, 50.96% (160 households) of rural households with ERIs of between 2.1 and 2.9 indicate that the general risk level of local rural households for earthquakes is moderate.

3.2. The Capacity to Successfully Manage Earthquake Effects

The capacity to successfully manage earthquake effects was expressed by the level of income, which includes five sub-components: human capital, physical capital, natural capital, financial capital, and social capital.

3.2.1. The Characteristics of Livelihood Capital for Local Rural Households

The analysis of human capital show that, 78.03% (245 households) of the surveyed rural households have three to five family members, and most households are families with four members (36.31% of the total); 72.29% of the surveyed households have two to three male family members. For all surveyed rural households (Table 4), the average proportion of healthy adults (18–60 years) out of all family members is 72.29%. In particular, six households in which the proportion of healthy adults below were 20% of the total household account for 1.91% of all surveyed households. Additionally, nine households (2.87% of all households) had a proportion of healthy adults between 20% and 40%. There are 68 households (21.66% of all households) with the proportions of healthy adults between 41% and 60%. There were 95 households (30.25% of all households) with the proportion of healthy adults between 61% and 80%. Households with the proportion of healthy adults of over 80% account for 43.31% (136 households) of all surveyed households, and 91 households had members who were entirely comprised of healthy adults. In terms of education level, the average proportion of family members with high school degrees or above was 16.55% of the entire household. In particular, the proportion of family members with high school degrees or above is less than 20% in 187 rural households, accounting for 59.55% of the total, and 172 households have no family members with high school degrees or above. The proportion is between 20% and 40% in 68 rural households, (21.66% of the total). The proportion is between 41% and 60% in 36 rural households, (11.46% of the total). The proportion is between 61% and 80% in 22 rural households (7.01% of the total). Only one household existed in which all family members have high school degrees or above. This shows that the education level of local rural households is generally low.
Regarding physical capital (Table 4), the investigation shows that the building structures with over 50% (184 households) of total households are assigned to the earth/wood category (E/W buildings). Additionally, 89 households’ buildings (28.34%) were constructed from brick and wood (B/W buildings). Brick and concrete buildings (B/C buildings) and reinforced concrete buildings (R/C buildings) only account for 6.05% (19 households) and 6.37% (20 households) of all households, respectively. In general, R/C and B/C buildings offer better anti-seismic performance than B/W and E/W buildings when the buildings are affected by the same seismic intensity. Therefore, according to above analysis, the general seismic performance level of local buildings was relatively poor in the area studied, which means that they are extremely vulnerable to earthquakes.
With respect to natural capital (Table 4), the investigation indicates that local crops mainly include rice, tea, tobacco, fruit, and vegetables. The crop-land area per capita of 153 households (48.73% of all households) is below 1 mu (approximately 0.165 acre). The crop-land area per capita of 66 households (21.02%) is between 1 mu and 2 mu. Eighty households had crop area per capita of between 2 mu and 5 mu, accounting for 25.48% of the total. Only 15 households (4.78%) and three households (0.96%) have per capita crop-land areas of over 5 mu and 10 mu, respectively.
Regarding financial capital (Table 4), statistics show that the annual family income of more than half of all households (57.64%, 181 households) is below 5000 RMB. The proportion of the households with annual family income of between 5000 and 10,000 RMB is 22.29% (70 households). Households with annual family income of over 10,000 RMB only account for 14.97% (47 households) of all households. More than 70% (73.25%, 230 households) of all households savings below 3000 RMB, and 76.96% (177 households) have no household savings. Households with savings of over 10,000 RMB only account for 7.32% (23 households) of the total.
The investigation of social capital show that (Table 4), the family members or property of over half of the households (53.18%, 167 households) have never been insured. Of the total, 22.93% (72 households) had purchased insurance for some family members, and 11.15% (35 households) had purchased some property insurance. Households that had purchased both life and property insurance only account for 7.01% (22 households) of all households.

3.2.2. The Capacity Indexes to Successfully Manage Earthquake Effects (LCI)

Based on the expression for LC assessment, we calculated the capacity indexes to successfully manage earthquake effects (LCI) of rural households in the area studied. The result shows (Table 5) that the average LCI of rural households is 2.14, which indicates a relatively low capacity of local rural households to successfully manage earthquake effects. Particularly, rural households with LCIs of over 3.0 (indicating a relatively high capacity to successfully manage adverse effects) only account for 5.73% (18 households) of the total. Rural households with LCIs lower than 2.0 account for 41.08% (129 households) of the entire sample, which indicates that the capacity of local rural households to successfully manage earthquake effects is relatively low.
In terms of the five sub-components (Figure 3), except for human capital (2.88), the LCIs of other types of capital are all relatively low (physical capital 1.99, natural capital 1.87, financial capital 1.89, and social capital 2.08), which also indicates that the capacity of local rural households to successfully manage earthquake effects is relatively low. This can be supported by the above analysis. Take physical capital, for example: The building structures of over 85% of total households are assigned to the earth/wood (E/W buildings) or brick and wood buildings types (B/W buildings). In general, R/C and B/C buildings have better anti-seismic performance than B/W and E/W buildings. When the buildings were affected by earthquakes, the B/W or E/W buildings are more easily damaged. In terms of financial capital, more than 70% of all households deposit less than 3000 RMB. The financial level does not effectively compensate for earthquake effects, and these households are more prone to face hardships. Furthermore, most rural households have no hazard insurance awareness, which reduces the options for dealing with the adverse effects of earthquakes.

3.3. Livelihood Vulnerability Level of Rural Households

3.3.1. Livelihood Vulnerability Index

Based on above assessment method for the LVIs of rural households, we can see that the average value of LVIs of local rural households is −0.06. The negative value indicates that the capacity of households to successfully manage earthquake effects is higher than the earthquake risk level. The value is close to zero, which indicates that the livelihood vulnerability level of local rural households is relatively moderate on the whole. Particularly, households with positive LVI values account for 48.40% (152 households) of total households, and the proportion of the households with LVI values over 1.00 is 11.46% (36 households) of the total. Although the capacity indexes of over 50% of total households (162 households) to successfully manage earthquake effects are higher than their earthquake risk indexes (LVI values being negative), the proportion of the households with LVI values lower than −1.50 is only 4.46% (14 households) of the total (Figure 4).

3.3.2. Characteristics of the Households with High Livelihood Vulnerability

Based on the definition of highly vulnerable households to earthquakes, we can see that there are 36 households with LVI values at or over 1.00, accounting for 11.46% of all households. Particularly, these highly vulnerable households can be divided into three different types (Table 6). The first type are the households with a high ER and low LC (21 households), the average ERI and LCI of which is 3.27 and 1.66, respectively. The second type are the households with a moderate ER and low LC (8 households), the average ERI and LCI of which is 2.36 and 1.29, respectively. The last type are the households with a high ER and moderate LC (7 households), the average ERI and LCI of which is 3.47 and 2.11, respectively.
Because income is the basic tool for managing earthquake effects, the income allocation and transformation level (IAT) is more important for rural households to improve livelihood capacities and reduce livelihood vulnerabilities. The IAT of different households are not the same. Based on the livelihood characteristics, we can divide 36 highly vulnerable households into five types (Table 7). Particularly, households lacking of financial capital account for 47.22% (17 households) of all highly vulnerable households, the average LVI of which is up to 1.62. Households lacking natural capital account for 22.22% (eight households) of all vulnerable households, the average LVI of which also is up to 1.59. Due to a lack of social capital and physical capital, 13.89% and 11.11% of all vulnerable households have a low capacity level for managing earthquakes, respectively. Additionally, there are two households with low capacities for managing earthquakes, which result from a lack of human capital.

4. Discussion

4.1. The Reasons for High Livelihood Vulnerability

The lack of livelihood capital is the direct reason for high livelihood vulnerability. Livelihood capital is the basic tool for managing earthquake effects. Due to the different income allocation and transformation levels, the response capacity of different households to earthquake effects is different. If one or multiple incomes are reduced, it would be difficult for the household to manage the livelihood risk with the allocation and transformation among income when facing the impact of earthquakes and other natural disaster. The high livelihood vulnerability of rural households mainly results from a lack of single or multiple livelihood capital. Based on the above analysis, households with high livelihood vulnerability all lack sufficient income. For example, the members of the households that lack human capital are elderly people, minors, or adults with poor health. Human capital is the basic condition for household survival and development. Based on the statistics of 2007, the percentage of healthy workforce over the total rural population is only 57.66% and 46.21% of the total workforce are female in Ning’er County [30]. The lack of a healthy workforce decreases the capacity of household to accumulate and develop other sources of income. Additionally, the education level of the family members is very low. The investigation showed that over 70% of the total rural populations do not have a high school degree, which also influences the capacity of the household to manage livelihood risk. Consider a household that lacks financial capital, for example. The total annual family income is less than 5000 RMB, and the household savings is below 3000 RMB. Moreover, the average per capita net income of rural residents was only 1998 RMB based on the statistics of 2007 in Ning’er County [30]. The livelihood of this type of household is mainly supported by the natural ecological system, which leads to the limitation of their income allocation and transformation level. Financial capital plays an intermediary role in the livelihood capital conversion. The shortage of financial capital decreases the transformation capacity of household income. Faced with the same earthquake, these households would more easily slip into poverty. The reduction of other incomes could also directly affect the capacity of rural household to manage earthquakes and increase their livelihood vulnerability.

4.2. The Ways to Decrease Livelihood Vulnerability

Improving the income allocation and transformation level is an effective way for rural households to decrease livelihood vulnerability in areas prone to frequent, strong earthquakes. Based on the above analysis, the average LCI of rural households is 2.14, which indicates a relatively low capacity of local rural households to successfully manage earthquake effects. The low income allocation and transformation level is the main reason for the low capacity to withstand its effects. For example, the building structures of over 85% of total households belong to the earth/wood (E/W buildings) or brick and wood building types (B/W buildings) in the area studied. When the buildings were affected by an earthquake, the B/W and E/W buildings were more easily damaged. Additionally, households with annual family incomes lower than 10,000 RMB account for over 80% of all households. More than 70% of all households deposit below 3000 RMB. This financial level does not allow for effective management of earthquake effects, and the households are more likely to face poverty. Furthermore, most rural households have no awareness of hazard insurance, which would decrease options for managing the adverse effects of earthquakes. Therefore, expanding ways to manage livelihood and improving the income allocation and transformation level is an effective way to manage earthquake impacts and decrease livelihood vulnerability of rural households in the area studied. Particularly, ways of improving the response capacity of rural households include (1) expanding social capital and improving the cultural level to increase the accumulation of family financial capital and to strengthening the physical capital allocation level (especially for building structures); (2) improving and accelerating the allocation and transformation level of household income to effectively manage the effects of earthquakes and other natural disasters; (3) strengthening the awareness and relevant knowledge of earthquake disasters, to manage successfully the effects of earthquake disasters.

4.3. Limitations of the Study

This paper constructs an assessment method of LVI for rural households based on a study of the Ning’er earthquake-stricken area. The sub-components and indicators we used to assess the LVI were selected based on the available data for our particular study communities. Therefore, it may not directly apply to other areas and households. Our intention, however, was to introduce the assessment method of LVI and demonstrate a particular application. More detailed work can be performed to move to the next stage. It is also important to note that the data and information on rural households in the area studied were collected three months after the earthquake occurred. The data and information on livelihood vulnerability only reflects that of the pre-earthquake level. At present, the post-earthquake restoration and reconstruction work has been finished, and the livelihood vulnerability of local rural households may be different from that of the pre-earthquake level. The changes would clearly be in the income, such as human capital (casualties) and physical capital (building structure changes), etc. Further analysis on livelihood vulnerability changes between pre- and post-earthquake periods may be conducted based on updated data of local rural households in the future. Finally, the limitations of the overall LVI approach include those associated with the use of indicators and indices, namely that these oversimplify a complex reality and there is no inherently straightforward way to validate indices comprised of disparate indicators [34]. Because sub-components are averaged into one major component score, the indexing approach does not incorporate variance between study households. Further, the selection of sub-components and indicators involves normative judgment. Disagreement with the sub-components and indicators may exist, and this may be discussed in a future study.

5. Conclusions

We presented the LVI assessment method for evaluating relative livelihood vulnerability of rural households to the impact of an earthquake in Ning’er, Yunnan province. The approach provides a detailed depiction of factors driving household livelihood vulnerability in a particular region.
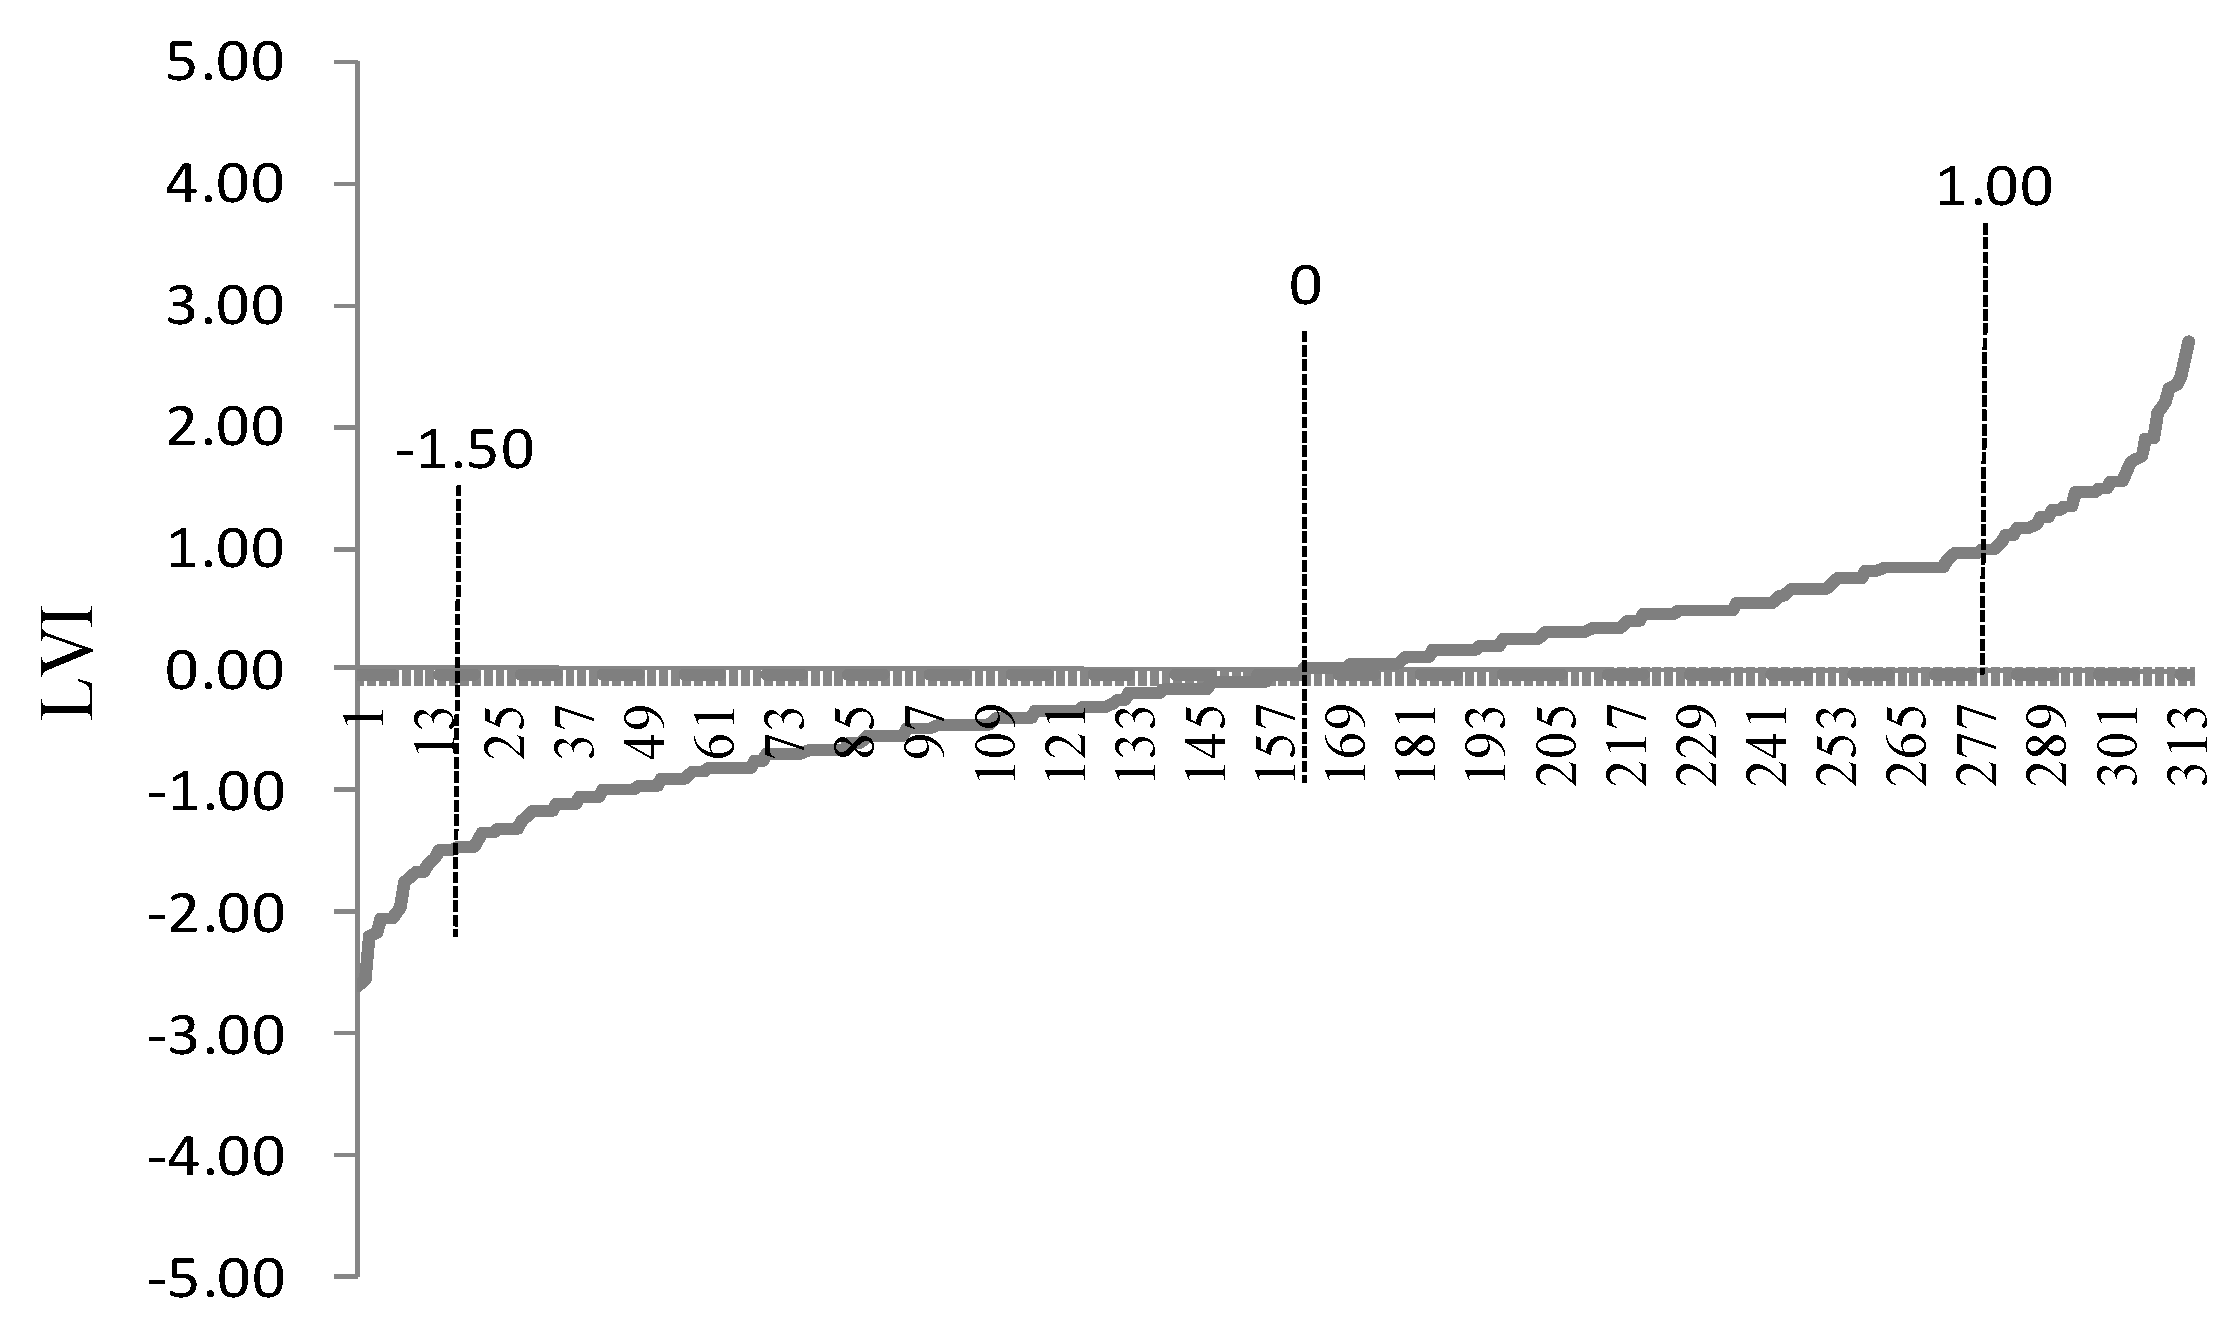
The livelihood vulnerability level of local rural households to earthquake effects is relatively moderate on the whole. The proportion of households with LVI values of over 1.00 (high livelihood vulnerability) are 11.46% (36 households) of the total. However, the proportion of the households with LVI values lower than −1.50 (low livelihood vulnerability) is only 4.46% (14 households) of the total. It is still important for local rural households to reduce earthquake risks and improve the capacity to manage earthquake impact in the area studied.
The shortage of income is the direct reason for high livelihood vulnerability for rural households in the area studied. Income is the basic tool to manage earthquake effects. High livelihood vulnerability of rural households mainly results from the lack of single or multiple income. Therefore, improving the income allocation and transformation level and expanding livelihood methods is an effective way for rural households to decrease livelihood vulnerability in an area with frequent occurrences of strong earthquakes.
The limitations of our approach include the subjectivity involved in selecting sub-components, the directionality of the relationship between the sub-components and vulnerability, the masking of extreme values by utilizing the means to calculate the indices, and the timeliness of livelihood vulnerability data. Future work may include a refinement of the sub-components and indicators to more accurately evaluate livelihood vulnerability. Additionally, livelihood vulnerability changes, especially livelihood capital changes between pre- and post-earthquake periods may be studied based on updated data of local rural households in the future. Overall, it is hoped that the LVI assessment approach will provide a tool to evaluate livelihood vulnerability to earthquake impact at the community level and develop programs to strengthen the most vulnerable households.

Acknowledgments

This work was supported by the Institute of Geology, China Earthquake Administration (No. IGCEA1406) and National Natural Science Foundation of China (40971274). We thank Qiong Wu for his help in questionnaire administration and data collection, and the anonymous reviewers for their helpful comments.

Author Contributions

Benyong Wei and Guiwu Su conceived and designed the assessment approach; Benyong Wei performed the assessment; Wenhua Qi and Lei Sun analyzed the data; Benyong Wei wrote the paper.

Conflicts of Interest

The authors declare no conflict of interest.

References

  1. Bryant, E.A. Natural Hazards; Press Cindicate of the University of Cambridge: Melbourne, Australia, 1993. [Google Scholar]
  2. Marcuson, W.F. Preventing Earthquake Disasters: The Grand Challenge in Earthquake Engineering; National Research Council, the National Academies Press: Washington, DC, USA, 2003. [Google Scholar]
  3. Gao, Q.H.; Nie, G.Z.; Zhang, Y.C. Earthquake Risk; China Meteorological Press: Beijing, China, 2011. (In Chinese) [Google Scholar]
  4. Sun, M.J.; Chen, B.F.; Ren, J.Z.; Chang, T.T. Natural disaster’s impact evaluation of rural household’s vulnerability: The case of Wenchuan earthquake. Agric. Agric. Sci. Procedia 2012, 1, 52–61. [Google Scholar] [CrossRef]
  5. Kasperson, J.X.; Kasperson, R.E.; Turner, B.L.; Hsieh, W.; Schiller, A. Vulnerability to Global Environmental Change. In The Social Contours of Risk; Kasperson, J.X., Kasperson, R.E., Eds.; Earthscan: London, UK, 2005; Volume II, pp. 245–285. [Google Scholar]
  6. UN/ISDR. Sendai Framework for Disaster Risk Reduction 2015–2030. Available online: http://www.unisdr.org/we/inform/publications/43291 (accessed on 31 May 2016).
  7. DFID. Sustainable Livelihoods Guidance Sheets. London. Available online: http://www.ennonline.net/dfidsustainableliving (accessed on 16 May 2016).
  8. Ellis, F. Rural Livelihoods and Diversity in Developing Countries; Oxford University Press: Oxford, UK, 2000. [Google Scholar]
  9. Speranza, C.I.; Kiteme, B.; Wiesmann, U. Droughts and famines: the underlying factors and the causal links among agro-pastoral households in semi-arid Makueni district, Kenya. Glob. Environ. Chang. 2008, 18, 220–233. [Google Scholar] [CrossRef]
  10. Chambers, R.; Conway, G. Sustainable Rural Livelihoods: Practical Concepts for the 21st Century; IDS Discussion Paper 296; Institute of Development Studies: Brighton, UK, 1992. [Google Scholar]
  11. Schmidt, A.; Bloemertz, L.; Macamo, E. Linking Poverty Reduction and Disaster Risk Management; Bundesministerium für Wirtschaftliche Zusammenarbeit und Entwicklung: Eschborn, Germany, 2005. [Google Scholar]
  12. De Haan, L.; Zoomers, A. Exploring the frontier of livelihood research. Dev. Chang. 2005, 36, 27–47. [Google Scholar] [CrossRef]
  13. Twigg, J. Sustainable Livelihoods and Vulnerability to Disasters. Disaster Management Working Paper. Available online: http://www.abuhrc.org/Publications/Working%20Paper%202.pdf (accessed on 15 May 2012).
  14. Whitehead, A. Tracking livelihood change: theoretical, methodological and empirical perspectives from North-East Ghana. J. South. Afr. Stud. 2002, 28, 575–598. [Google Scholar] [CrossRef]
  15. Sharp, K. Measuring Destitution: Integrating Qualitative and Quantitative Approaches in the Analysis of Survey Data. IDS Working Paper. Available online: http://www.savethechildren.org.uk/en/docs/measuring_destitution.pdf (accessed on 25 October 2013).
  16. Sharp, K. Squaring the ‘Q’s?: Methodological reflections on a study of destitution in Ethiopia. World Dev. 2007, 35, 264–280. [Google Scholar] [CrossRef]
  17. Elasha, B.O.; Elhassan, N.G.; Ahmed, H.; Zakieldin, S. Sustainable Livelihood Approach for Assessing Community Resilience to Climate Change: Case Studies from Sudan. AIACC Working Paper. Available online: http://www.aiaccproject.org/working_papers/Working%20Papers/AIACC_WP_No017.pdf (accessed on 15 October 2014).
  18. Siegel, P.B. Using an Asset-Based Approach to Identify Drivers of Sustainable Rural Growth and Poverty Reduction in Central America: A Conceptual Framework. World Bank Policy Research Working Paper. Available online: http://www-wds.worldbank.org/servlet/WDSContentServer/WDSP/IB/2005/01/19/000160016_20050119144447/Rendered/PDF/WPS3475.pdf (accessed on 25 May 2013).
  19. Hahn, M.B.; Riederer, A.M.; Foster, S.O. The Livelihood Vulnerability Index: A pragmatic approach to assessing risks from climate variability and change—A case study in Mozambique. Glob. Environ. Chang. 2009, 19, 74–88. [Google Scholar] [CrossRef]
  20. Han, Z. Fragility and rural poverty. Issues Agric. Econ. 2004, 10, 8–10. (In Chinese) [Google Scholar]
  21. Chen, C.B. Risk and vulnerability of rural household: an analysis framework and experience in poor area. Issues Agric. Econ. 2005, 8, 47–50. (In Chinese) [Google Scholar]
  22. Luo, X.F.; Jiang, S.Y.; Leng, J.L. Analysis of peasant household’s disaster vulnerability in Jianghan Plain. J. Huazhong Agric. Univ. (Soc. Sci. Ed.) 2012, 1, 17–20. (In Chinese) [Google Scholar]
  23. Gu, Y. Study on the Impacts of Labor Migration on Vulnerability of Farmer Household’s Livelihood-Based on the Case of Chongqing Hechuan. Master’s Thesis, Northwest A & F University, Xiangyang, China, 2013. [Google Scholar]
  24. Li, X.Y.; Dong, Q.; Rao, X.L.; Zhao, L.X. Method for vulnerability analysis of rural household and its localization application. Chin. Rural Econ. 2007, 4, 32–39. (In Chinese) [Google Scholar]
  25. Yan, J.Z.; Yu, O.; Wu, Y.Y.; Zhang, Y.L. Livelihood vulnerability assessment of farmers and nomads in Eastern Ecotone of Tibetan Plateau, China. Sci. Geogr. Sin. 2011, 31, 858–867. (In Chinese) [Google Scholar]
  26. Wang, Y.; Shi, P.J.; Wang, J.A. Characteristics of seismic disaster in rural area and relative disaster reduction counter measures in China. J. Nat. Dis. 2005, 14, 83–90. (In Chinese) [Google Scholar]
  27. Ge, Y.; Liu, J.; Shi, P.J. Quantifying social vulnerability for flood hazard of households: A case study of Changsha, China. J. Nat. Dis. 2006, 15, 34–39. (In Chinese) [Google Scholar]
  28. Zhang, Y.; Xu, L.S.; Chen, Y.T.; Feng, W.P.; Du, H.L. Source process of Ms 6.4 earthquake in Ning’er, Yunnan in 2007. Sci. China Ser. D Earth Sci. 2009, 52, 180–188. [Google Scholar] [CrossRef]
  29. Yang, X.P.; Chen, L.C.; Ma, W.T.; Chen, H.; Zhou, Z.; Li, Y.F.; Xie, Y.Q.; Shi, W.H.; Chang, Z.F. Structural analysis and interpretation of the surface deformation associated with the Ning’er, Yunnan Province, China, Ms 6.4 earthquake of June 3, 2007. Acta Seismol. Sin. 2008, 21, 170–180. [Google Scholar] [CrossRef]
  30. PEBS (Pu’er Hani Yi Autonomous County Bureau of Statistics). Pu’er Hani Yi Autonomous County Statistical Yearbook; Pu’er Hani Yi Autonomous County Bureau of Statistics: Yunnan, China, 2007. (In Chinese) [Google Scholar]
  31. Sullivan, C. Calculating a water poverty index. World Dev. 2002, 30, 1195–1210. [Google Scholar] [CrossRef]
  32. De Vaus, D.A. Survey in Social Research; George Allen & Unwin Ltd.: London, UK, 1986. [Google Scholar]
  33. Feng, X.T. Modem Social Survey Method, 4th ed.; Huazhong University of Science and Technology Press: Wuhan, China, 2009. (In Chinese) [Google Scholar]
  34. Vincent, K. Uncertainty in adaptive capacity and the importance of scale. Glob. Environ. Chang. 2007, 17, 12–24. [Google Scholar] [CrossRef]
Figure 1. The area studied and the distributions of the investigated spots.
Sustainability 08 00566 g001
Figure 2. Earthquake disaster losses for rural households in Ning’er County. (a) Casualties; (b) buildings damaged.
Sustainability 08 00566 g002
Figure 3. Livelihood capital indexes for rural households in Ning’er County.
Sustainability 08 00566 g003
Figure 4. The composite vulnerability indexes of rural households in Ning’er County.
Sustainability 08 00566 g004
Table 1. Livelihood vulnerability evaluation indicators for rural households in Ning’er County.
ComponentSub-ComponentIndicators
Earthquake riskloss of lifecasualties
loss of propertybuildings damaged
Capacity to withstandhuman capitalthe proportion of healthy adults and highly educated people over total population
physical capitalthe building structure
natural capitalsize of crop area per capita
financial capitalannual family income; household savings
social capitalwhether to buy insurance for family members and property or not
Table 2. The basic characteristics of the respondents (%) in Ning’er County.
GenderAgeEthnicityNumber of Family MembersEarthquake Experiences
Male69.7520–2921.97Han39.81<33.19yes85.03
Female30.2530–3937.26Yi28.98314.33no14.97
40–4926.11Hani23.57436.31
50–5910.19Hui1.27527.39
≥604.46Others6.37>518.79
Table 3. Earthquake risk indexes of rural households in Ning’er County.
Earthquake Risk LevelLowModerateHigh
ERI≤2.02.1–2.9≥3.0
Percentage of sample/%35.0350.9614.02
Table 4. The characteristics of livelihood capital for rural households in Ning’er County (% of all households).
Types of CapitalIndicatorsContents
Human capital below 20%20%–40%41%–60%61%–80%over 80%
healthy adults1.912.8721.6630.2543.31
members with high school degrees or above59.5521.6611.467.010.32
Physical capitalbuilding structuresE/WB/WB/CR/Cmissing
58.628.346.056.370.64
Natural capitalcrop planting area per capitabelow 1 mu1–2 mu2–5 mu5–10 muover 10 mu
48.7321.0225.483.820.96
Financial capitalannual family incomebelow 30003000–50005000–10,00010,000–30,000over 30,000missing
30.8926.7522.2914.010.965.10
household savingsno depositbelow 30003000–10,00010,000–30,000over 30,000missing
56.3716.8810.835.411.918.60
Social capitalmembers and property insuredno insurancefamily members insuredproperty insuredmembers and property insuredmissing
53.1822.9311.157.015.73
Table 5. Capacity index to successfully manage earthquake effects of rural households.
Manage Earthquake Effects LevelLowModerateHigh
LCI≤2.02.1–2.9≥3.0
Percentage of sample/%41.0853.185.73
Table 6. Livelihood vulnerability of households in Ning’er County.
Vulnerable HouseholdsERILCILVINumber of Households
High ERLow LC3.271.661.6121
Moderate ERLow LC2.361.291.078
High ERModerate LC3.472.111.367
Table 7. Livelihood characteristics of various highly vulnerable households in Ning’er County.
Vulnerable Household TypesHuman Capital IndexPhysical Capital IndexNatural Capital IndexFinancial Capital IndexSocial Capital IndexLVINumber of Households
Lack of human capital1.251.253.001.251.001.452
Lack of physical capital2.631.251.502.252.001.314
Lack of natural capital3.061.721.002.001.341.598
Lack of financial capital2.941.471.351.241.661.6217
Lack of social capital2.101.251.402.701.001.345

