Article

Building Simplified Life Cycle CO2 Emissions Assessment Tool (B‐SCAT) to Support Low‐Carbon Building Design in South Korea

1
Innovative Durable Building and Infrastructure Research Center, Hanyang University, 55 Hanyangdaehak‐ro, Sangnok‐gu, Ansan 426‐791, Korea
2
School of Architecture & Architectural Engineering, Hanyang University, 55 Hanyangdaehak‐ro, Sangnok‐gu, Ansan 426‐791, Korea
*
Author to whom correspondence should be addressed.
Sustainability 2016, 8(6), 567; https://0-doi-org.brum.beds.ac.uk/10.3390/su8060567
Submission received: 16 March 2016 / Revised: 1 June 2016 / Accepted: 9 June 2016 / Published: 17 June 2016
(This article belongs to the Special Issue Life Cycle Assessment on Green Building Implementation)

Abstract

:
Various tools that assess life cycle CO2 (LCCO2) emissions are currently being developed throughout the international community. However, most building LCCO2 emissions assessment tools use a bill of quantities (BOQ), which is calculated after starting a building’s construction. Thus, it is difficult to assess building LCCO2 emissions during the early design phase, even though this capability would be highly effective in reducing LCCO2 emissions. Therefore, the purpose of this study is to develop a Building Simplified LCCO2 emissions Assessment Tool (B‐SCAT) for application in the early design phase of low‐carbon buildings in South Korea, in order to facilitate efficient decision‐making. To that end, in the construction stage, the BOQ and building drawings were analyzed, and a database of quantities and equations describing the finished area were conducted for each building element. In the operation stage, the “Korea Energy Census Report” and the “Korea Building Energy Efficiency Rating Certification System” were analyzed, and three kinds of models to evaluate CO2 emissions were proposed. These analyses enabled the development of the B‐SCAT. A case study compared the assessment results performed using the B‐SCAT against a conventional assessment model based on the actual BOQ of the evaluated building. These values closely approximated the conventional assessment results with error rates of less than 3%.

1. Introduction

Since CO2 reduction has been globally established as a paradigm of sustainable development, governments all over the world are competitively announcing mid- to long-term goals for the reduction of CO2 emissions [1,2]. The USA has set its INDC (Intended Nationally Determined Contributions) to reduce CO2 emissions by 26%–28% (compared with the baseline year 2005) by the year 2025. The EU has set its INDC to reduce CO2 emissions by 40% (compared with the year 1990) by the year 2030. South Korea has set its INDC to reduce CO2 emissions by 37% (compared with Business as Usual) by the year 2030.
The building industry, which is a large-scale energy consumer accounting for more than 30% of all CO2 emissions, poses a major obstacle in CO2 reductions for all countries [3,4,5,6,7]. Accordingly, a realistic policy to reduce CO2 emissions in this industry is required [8,9,10]. Techniques for assessing life cycle CO2 (LCCO2) emissions of buildings are gaining attention [11,12,13,14], and many countries are performing diverse studies to assess and reduce building LCCO2 emissions befitting their respective national circumstances [15,16,17,18,19]. Moreover, tools for evaluating LCCO2 emissions of buildings starting in the early design phase are being developed to reduce these emissions [20,21,22], given that a building’s CO2 emissions determined during the early design phase continue to affect the building for the entirety of its life cycle [23,24]. A number of programs to address this have already been implemented throughout the world, e.g., an impact estimator for buildings developed by the ASBI in Canada, Envest2 developed by BRE in the UK, and LISA (LCA in Sustainable Architecture) developed in Australia [17,25].
South Korea has also developed diverse building CO2 emissions assessment tools such as SUSB-LCA [26], K-LCA [27], BEGAS [28], and BEGAS 2.0 [29], in order to meet global requirements. However, research reveals that previous tools have two limitations. First, most current CO2 emissions assessment tools focus on assessing operational CO2 emissions based on energy consumption during the operation stage [30,31,32,33,34]. Second, most of the LCCO2 emissions assessment tools directly use the bill of quantities (BOQ) calculated after the construction of a building begins [35,36]. These constraints complicate assessments made during the early design phase, when LCCO2 emissions can be efficiently reduced [37,38].
The purpose of this study is to develop a Building Simplified LCCO2 emissions Assessment Tool (B-SCAT) that is applicable in the early design phase for the facilitation of efficient decision-making of low-carbon buildings in South Korea. To that end, this study consists of the following steps: (1) proposal of a simplified LCCO2 emissions assessment model for buildings; (2) development of a B-SCAT; and (3) a case study comparing the assessment results of an evaluated building using a B-SCAT and a conventional assessment model based on the building’s actual BOQ.

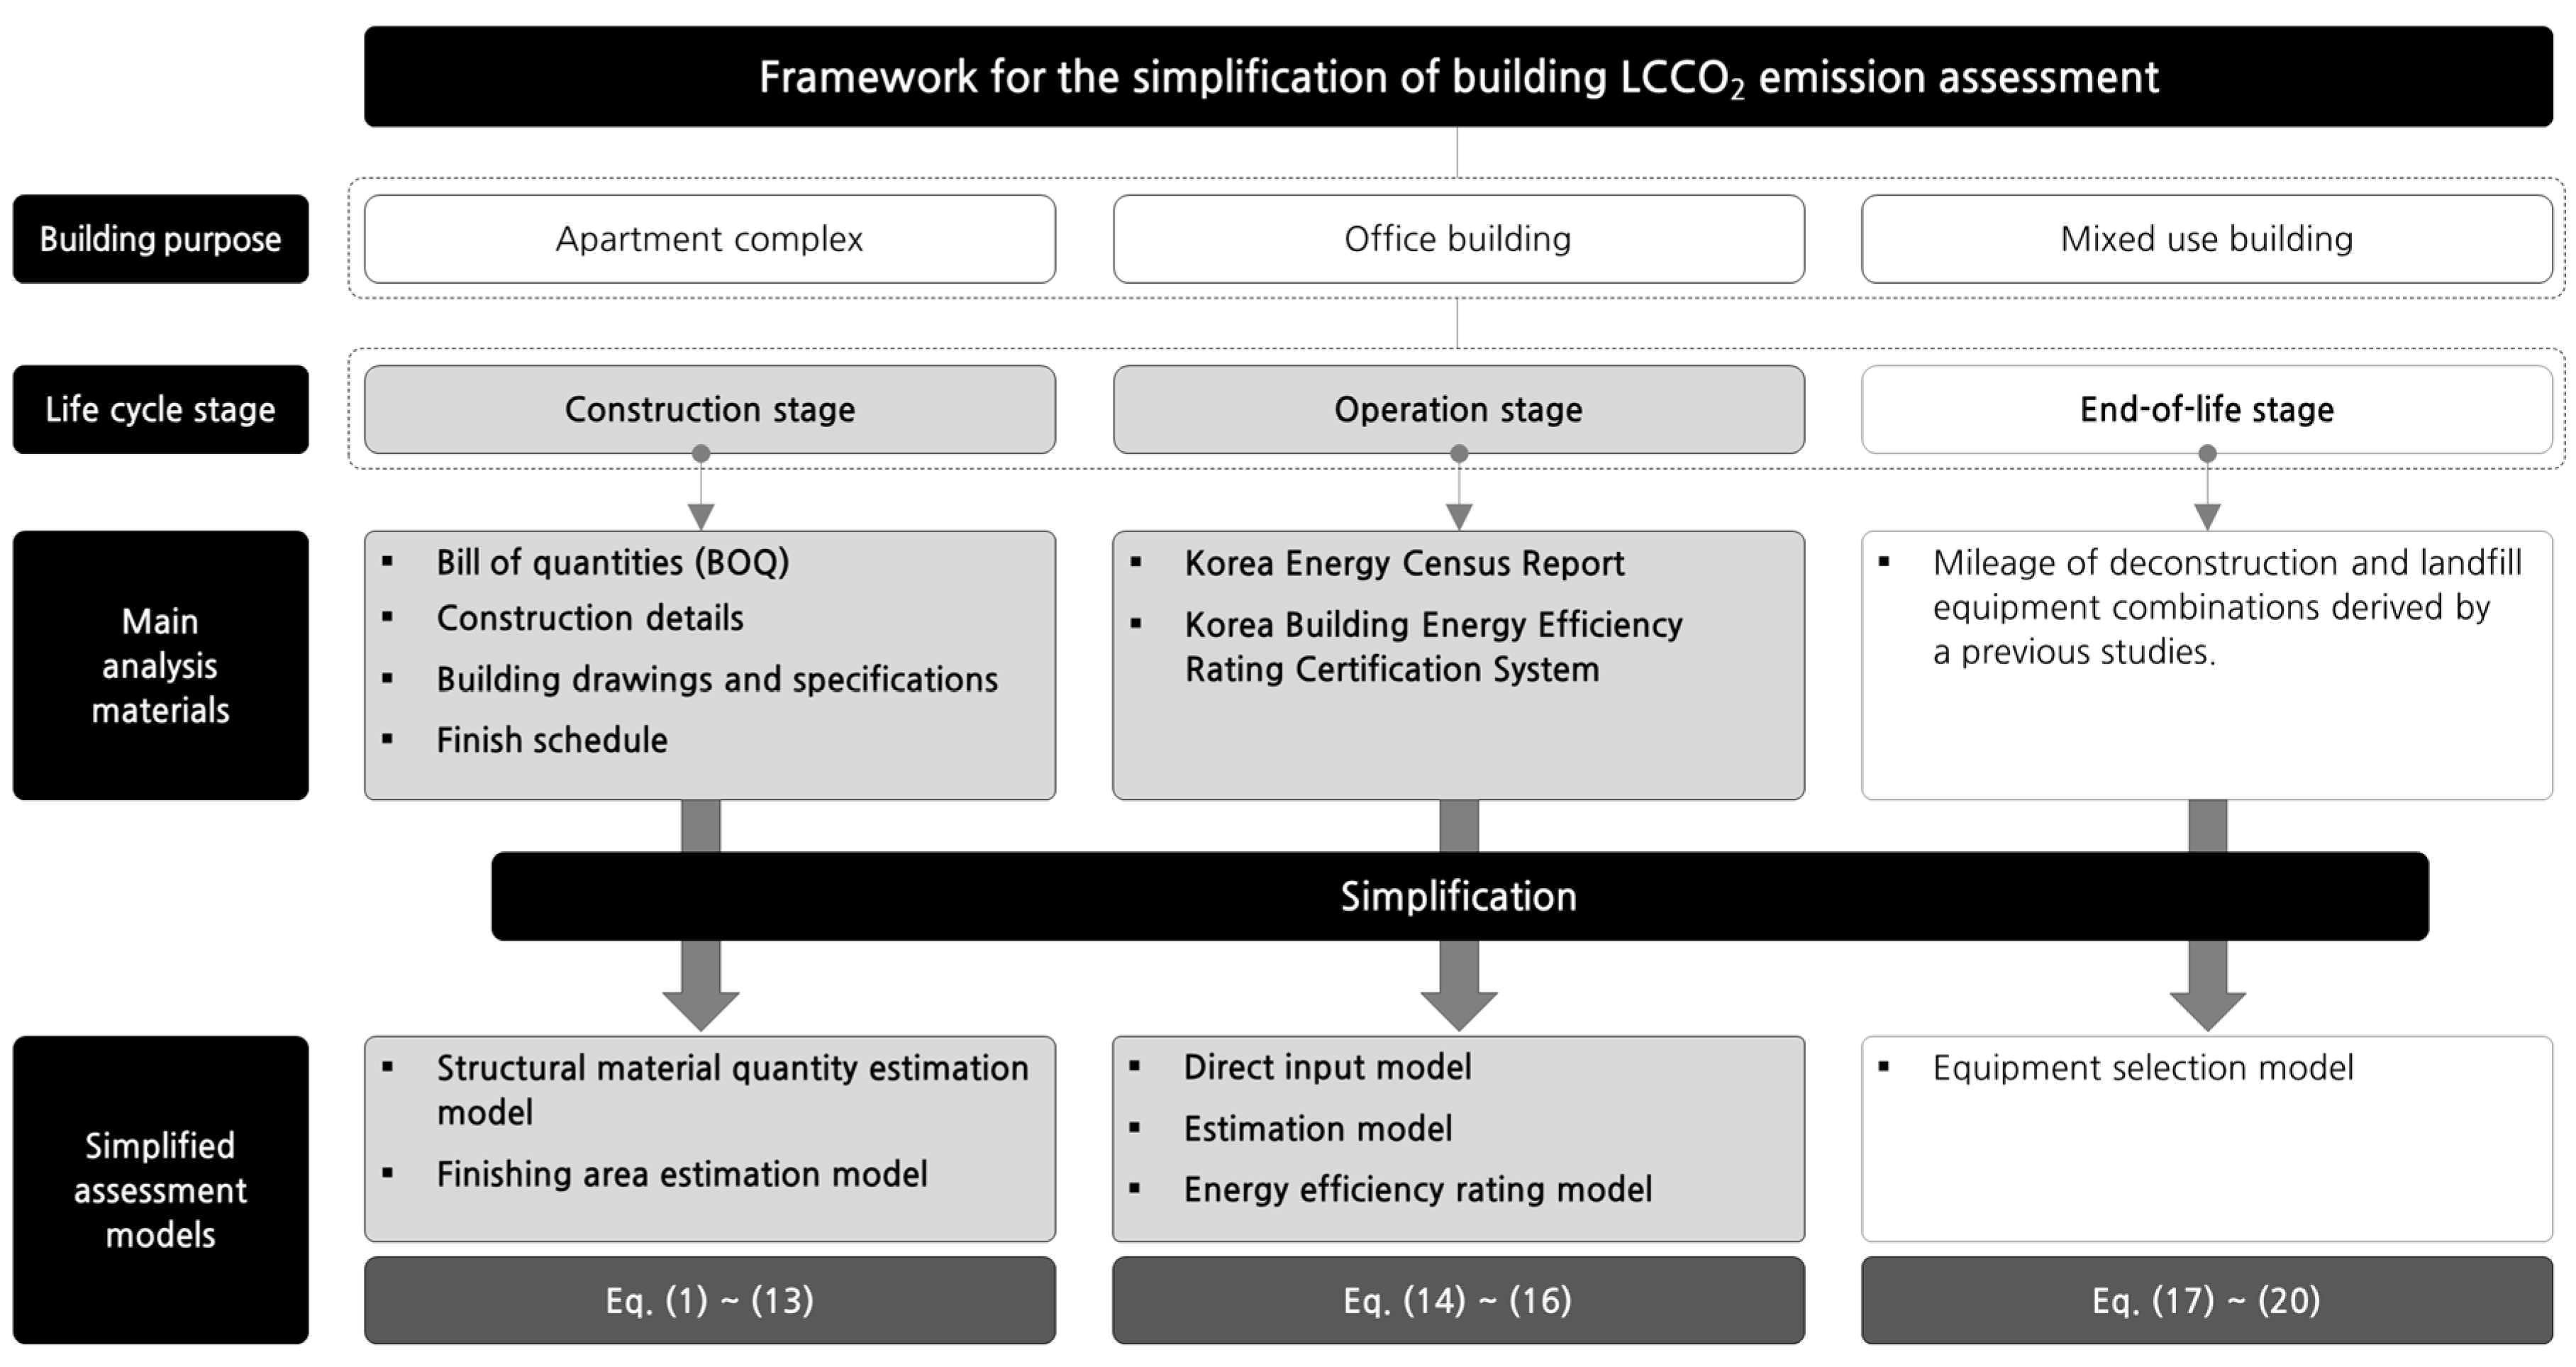
2. Proposal for Simplified LCCO2 Assessment Model for Buildings

The building LCCO2 emissions represent the total CO2 emissions in all stages from construction, operation, to end-of-life [39,40], as described in Equation (1):
LCCO 2   = CO 2 CS + CO 2 OS + CO 2 ES ,
where LCCO2 represents the life cycle CO2 emissions (kg-CO2) of the evaluated building; CO2CS represents the CO2 emissions (kg-CO2) in the construction stage; CO2OS represents the CO2 emissions (kg-CO2) in the operation stage; and CO2ES represents the CO2 emissions (kg-CO2) in the end-of-life stage.
This section proposes a simplified CO2 emissions assessment model for each stage (i.e., construction, operation, and end-of-life) that can evaluate the CO2 emissions of an apartment complex, office building, and mixed-use building during the early design phase. Figure 1 shows the framework for simplifying building LCCO2 emissions assessment in this study.

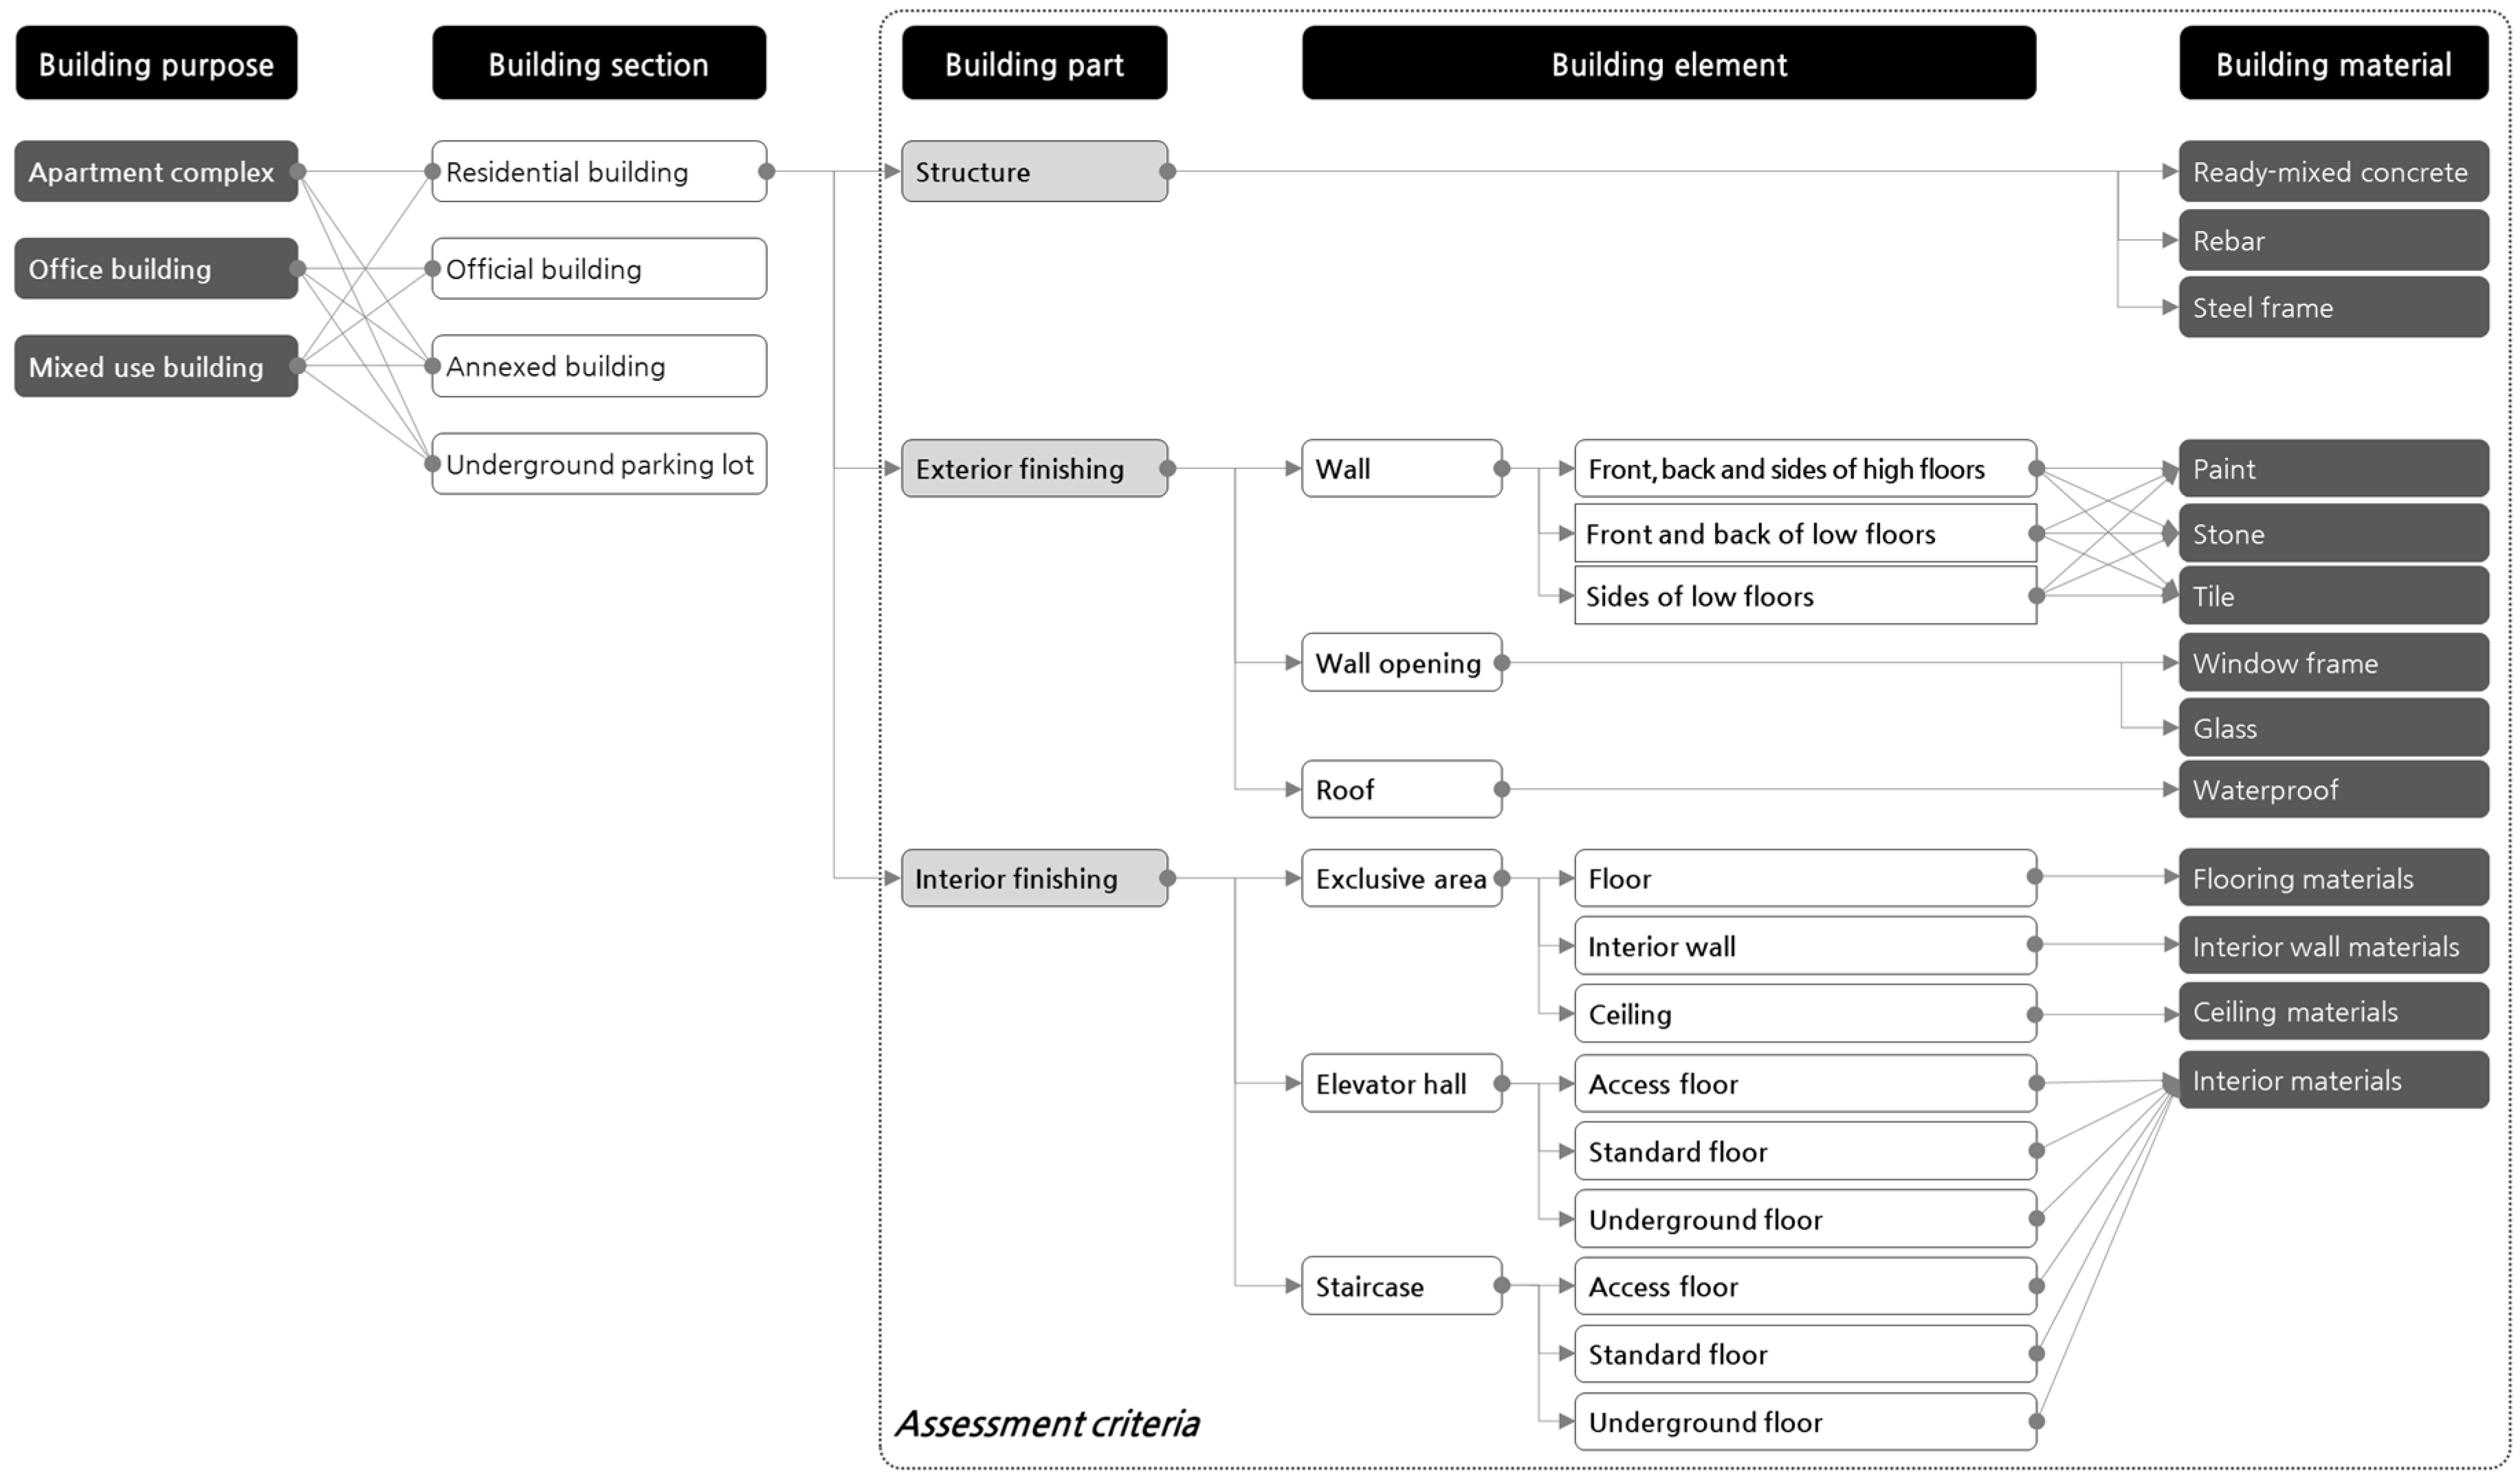
2.1. Construction Stage

Construction stage can be subdivided into the material production process and construction process, as represented in Equation (2):
CO 2 CS = CO 2 PP   + CO 2 CP ,
where CO2CS is the CO2 emissions (kg-CO2) in the construction stage; CO2PP is the CO2 emissions (kg-CO2) of the manufacturing of building materials; and CO2CP is the CO2 emissions (kg-CO2) of construction process.

2.1.1. Material Production Process

In the material production process, CO2 emitted during the manufacturing of building materials generally producing 30% of building LCCO2 emissions [29] are evaluated. The CO2 emissions of this process include those released during the production of structural materials and finishing materials, as represented in Equation (3):
CO 2 PP = CO 2 SM   + CO 2 FM ,
where CO2PP is the CO2 emissions (kg-CO2) in the material production process, mostly produced by building materials; CO2SM is the CO2 emissions (kg-CO2) of structural materials; and CO2FM is the CO2 emissions (kg-CO2) of finishing materials.
This study categorized the assessment criteria for building elements, which are included in the structural materials and finishing materials, as shown in Figure 2, to assess the CO2 emissions of the material production process while considering the function of the building. In other words, the apartment complex was subdivided into a residential building, annexed building, and underground parking lot; while the office building was subdivided into an office building, annexed building, and underground parking lot. Finally, the mixed-use building was divided into a residential building, office building, annexed building, and underground parking lot. In addition, the interior and exterior finishing materials were analyzed according to the finish schedule, and building elements were divided into the following categories: wall, wall opening, roof, exclusive space, elevator hall, and staircase.
(1) Structural Materials
To calculate the CO2 emissions of structural materials, such as ready-mixed concrete, rebar, and steel frames, the supply quantities of these materials were determined after analyzing 60 types of BOQ and construction details of recently constructed buildings. Table 1 lists the average supply quantities of structural materials per unit area by building section.
For each assessment item, the supply quantities of structural materials can be determined from the floor area, number of stories, and supply quantities coefficient, as described in Equations (4)–(6). In the ready-mixed concrete (refer to Equation (4)), the modification factor was applied in order to consider the decrease in supply quantity of the vertical members according to use of high-strength concrete [41]. Table 2 lists the modification factor of the supply quantity for high-strength concrete.
The CO2 emissions of the structure materials were then assessed using Equation (7) as follows:
SQ i RMC = FA i STD × NS i × QC i RMC × α ,
SQ i RB = FA i STD × NS i × QC i RB ,
SQ i SF = FA i STD × NS i × QC i SF ,
and
CO 2 SM = i ( SQ i RMC × CF j RMC ) + i ( SQ i RB × CF j RB ) + i ( SQ i SF × CF j SF ) ,
where SQiRMC is the supply quantity (m3) of ready-mixed concrete in vertical zone i; FAiSTD is the floor area (m2) of a standard floor in vertical zone i; and NSi is the number of stories in vertical zone i. Furthermore, QCiRMC is the supply quantity coefficient (m3/m2) of ready-mixed concrete in vertical zone i (refer to Table 1); α is the modification factor of the ready-mixed concrete (refer to Table 2); SQiRB is the supply quantity (kg) of rebar in vertical zone i; QCiRB is the supply quantity coefficient (kg/m2) of rebar in vertical zone i (refer to Table 1); SQiSF is the supply quantity (kg) of steel frame in vertical zone i; QCiSF is the supply quantity coefficient (kg/m2) of steel frame in vertical zone i (refer to Table 1); CO2SM is the CO2 emissions (kg-CO2) of structure materials; CFiRMC is the CO2 emissions factor (kg-CO2/m3) of ready-mixed concrete j (refer to Table 3); CFjRB is the CO2 emissions factor (kg-CO2/kg) of rebar j; and CFjSF is the CO2 emissions factor (kg-CO2/kg) of steel frame j.
(2) Finishing Materials
The CO2 emissions of the interior and exterior finishing materials for each building function and section were calculated using only the limited information available during the early design phase [42,43,44]. The assessment items were categorized according to building element, as shown in Figure 2. The models to determine the area of the finishing materials for each building element were developed after analyzing the 60 types of drawings and finish schedules. These models use the provisional perimeter formula developed in this study to calculate the element in which a particular finishing material was used for each building element, encompassing the interior and exterior perimeters of the standard floor for each major plane type and using the variables of numbers of units and cores, unit area, and exclusive use area, as well as the basic information entered during the first process of the assessment. Table 4 presents provisional perimeter formulas of a standard floor.
The walls, which are considered exterior finishing, were divided into the following categories according to the typical finishing execution: front, back, and sides of high floors; front and back of low floors; and sides of low floors. The area of finishing materials can be calculated as the product of exterior perimeter of the standard floor of the building calculated in Table 4, number of stories, story height, and wall surface rate as described in Equation (8). For wall openings, such as window frames and glass, as well as for the exterior walls, the area can be calculated as the product of exterior perimeter of the building standard floor, number of stories, story height, and window surface rate (1-the wall surface rate) as described in Equation (9). In addition, for the interior finishing, such as interior walls of the residential building, elevator hall, and staircases, the area can be calculated as the product of interior wall perimeter, which is calculated using the formula presented in Table 4, number of stories, story height, and number of units as described in Equation (10). The areas of floor and ceiling of the residential unit (exclusive area), access floor, and staircases in the building were determined as the area of the locations where the materials were applied, calculated from the unit area and building area determined in the first step of the assessment.
The CO2 emissions of the finishing materials can be assessed using the product of the area of the interior and exterior materials for each building element and the CO2 emissions factor for each material type, as described in Equation (11):
FA i EW = EP i STD × NS i × SH i × β i ,
FA i EO = EP i STD × NS i × SH i × γ i ,
FA i IW = IP i STD × NS i × SH i ,
and
CO 2 FM = i ( FA i EW × CF j FM ) + i ( FA i EO × CF j FM ) + ( FA ER × CF j FM ) + i ( FA i IW × CF j FM ) + i ( FA i IF × CF j FM ) + i ( FA i IC × CF j FM ) ,
where FAiEW is the area (m2) of the finishing material for the exterior wall in vertical zone i; EPiSTD is the exterior perimeter (m) of a standard floor in vertical zone i (refer to Table 4); NSi is the number of stories in vertical zone i; and SHi is story height (m) in vertical zone i. Furthermore, βi is the wall surface rate of the exterior wall in vertical zone i; FAiEO is the area (m2) of finishing material for the exterior wall opening in vertical zone i; γi is the window surface rate (1-the wall surface rate) of the exterior wall in vertical zone i; FAiIW is the area (m2) of finishing material for the interior wall in vertical zone i; IPiSTD is the interior perimeter (m) of a standard floor in vertical zone i (refer to Table 4); CO2FM is the CO2 emissions (kg-CO2) of finishing materials; FAER is the area (m2) of finishing material for the roof; FAiIF is the area (m2) of finishing material for the floor in vertical zone i; FAiIC is the area (m2) of finishing material for the ceiling in vertical zone i; and CFjFM is the CO2 emissions factor (kg-CO2/m2) of finishing material j (refer to Table 5).
(3) CO2 Emissions Factors of Building Materials
This study determined the CO2 emissions factors for each type of building material using an individual integration method and the South Korean carbon emissions factor [45] established by the South Korean Ministry of the Environment. In particular, even though the CO2 emissions factor depends on concrete strength, the current South Korean carbon emissions factor and South Korean LCI DB [46] include only some of the types of concrete and their strengths. This study used the CO2 emissions factor determined with the individual integration method for each type of concrete strength and admixture material obtained from a previous study [47,48]. Furthermore, for consistency in the assessment of the CO2 emissions factor and assessment results, this study used the South Korean carbon emissions factor as the CO2 emissions factors of all building materials, excluding ready-mixed concrete. Table 3 and Table 5 present the CO2 emissions factors of concrete and finishing materials.

2.1.2. Construction Process

In the construction process, the CO2 emissions can be evaluated in terms of energy consumption by freight vehicles transporting building materials to the building site, in addition to emissions produced by construction machinery, field offices, and other facilities involved in the construction of the building. However, it is difficult to produce a detailed construction schedule in the early design phase. Moreover, this stage makes up less than 3% of the building LCCO2 emissions. Hence, this study used the average energy consumption by unit area (i.e., diesel consumption: 5.24 ℓ/m2, gasoline consumption: 0.05 ℓ/m2, electricity consumption: 10.47 kWh/m2) derived by a previous study [42]. Equations (12) and (13) represent the CO2 emissions in the construction stage:
CO 2 CP   = ( 5.24 × CF d EN + 0.05 × CF g EN + 10.47 × CF e EN ) × GA ,
and
CO 2 CS   = 18.44 × GA ,
where CO2CP is the CO2 emissions (kg-CO2) in the construction stage; CFdEN is the CO2 emissions factor of diesel (2.58 kg-CO2/ℓ); CFgEN is the CO2 emissions factor of gasoline (2.08 kg-CO2/ℓ); CFeEN is the CO2 emissions factor of electricity (0.46 kg-CO2/kWh); and GA is the gross area (m2) of a building.

2.2. Operation Stage

The operation stage considers the CO2 emissions due to energy consumed during the service life of the building. This is a major stage responsible for about 70% of the building’s LCCO2 emissions [29]. The emissions from this stage can be assessed using the service life of the building, amount of energy consumed, and the CO2 emissions factor as described in Equation (14).
CO 2 OS = n = 1 SL ( 1 + RR ) n 1 × k ( EC k × CF k EN ) ,
where CO2OS is the CO2 emissions (kg-CO2) in the operation stage; SL is the service life of the building (years); RR is the annual reduction rate of operational energy effectiveness; ECk is the annual energy consumption of the energy source k; and CFkEN is the CO2 emissions factor of energy source k (refer to Table 6).
This study proposed three kinds of assessment models (i.e., direct input model, estimation model, and energy efficiency rating model) based on analysis of the “South Korea Energy Census Report” [49] and the “South Korea Building Energy Efficiency Rating System” [50] in order to efficiently assess energy consumption depending on the timing of the assessment and available data. Moreover, the “2006 IPCC Guidelines for National Greenhouse Gas Inventories” [51] has been analyzed to evaluate CO2 emissions during the operation stage, and the corresponding database of CO2 emissions factors has been created, as shown in Table 6. The measured CO2 emissions factors for electricity and district heating as determined by the Korea Power Exchange and Korea District Heating Corporation should be applied [52,53]. Gas and kerosene utilize the basic CO2 emissions factor of the 2006 IPCC Guidelines [51].

2.2.1. Direct Input Model

The direct input model uses the annual amount of energy from various sources consumed by a building (refer to Equation (14)). This method is used when annual energy consumption data are available, e.g., if the energy consumption can be predicted based on computer simulations during the early design phase.

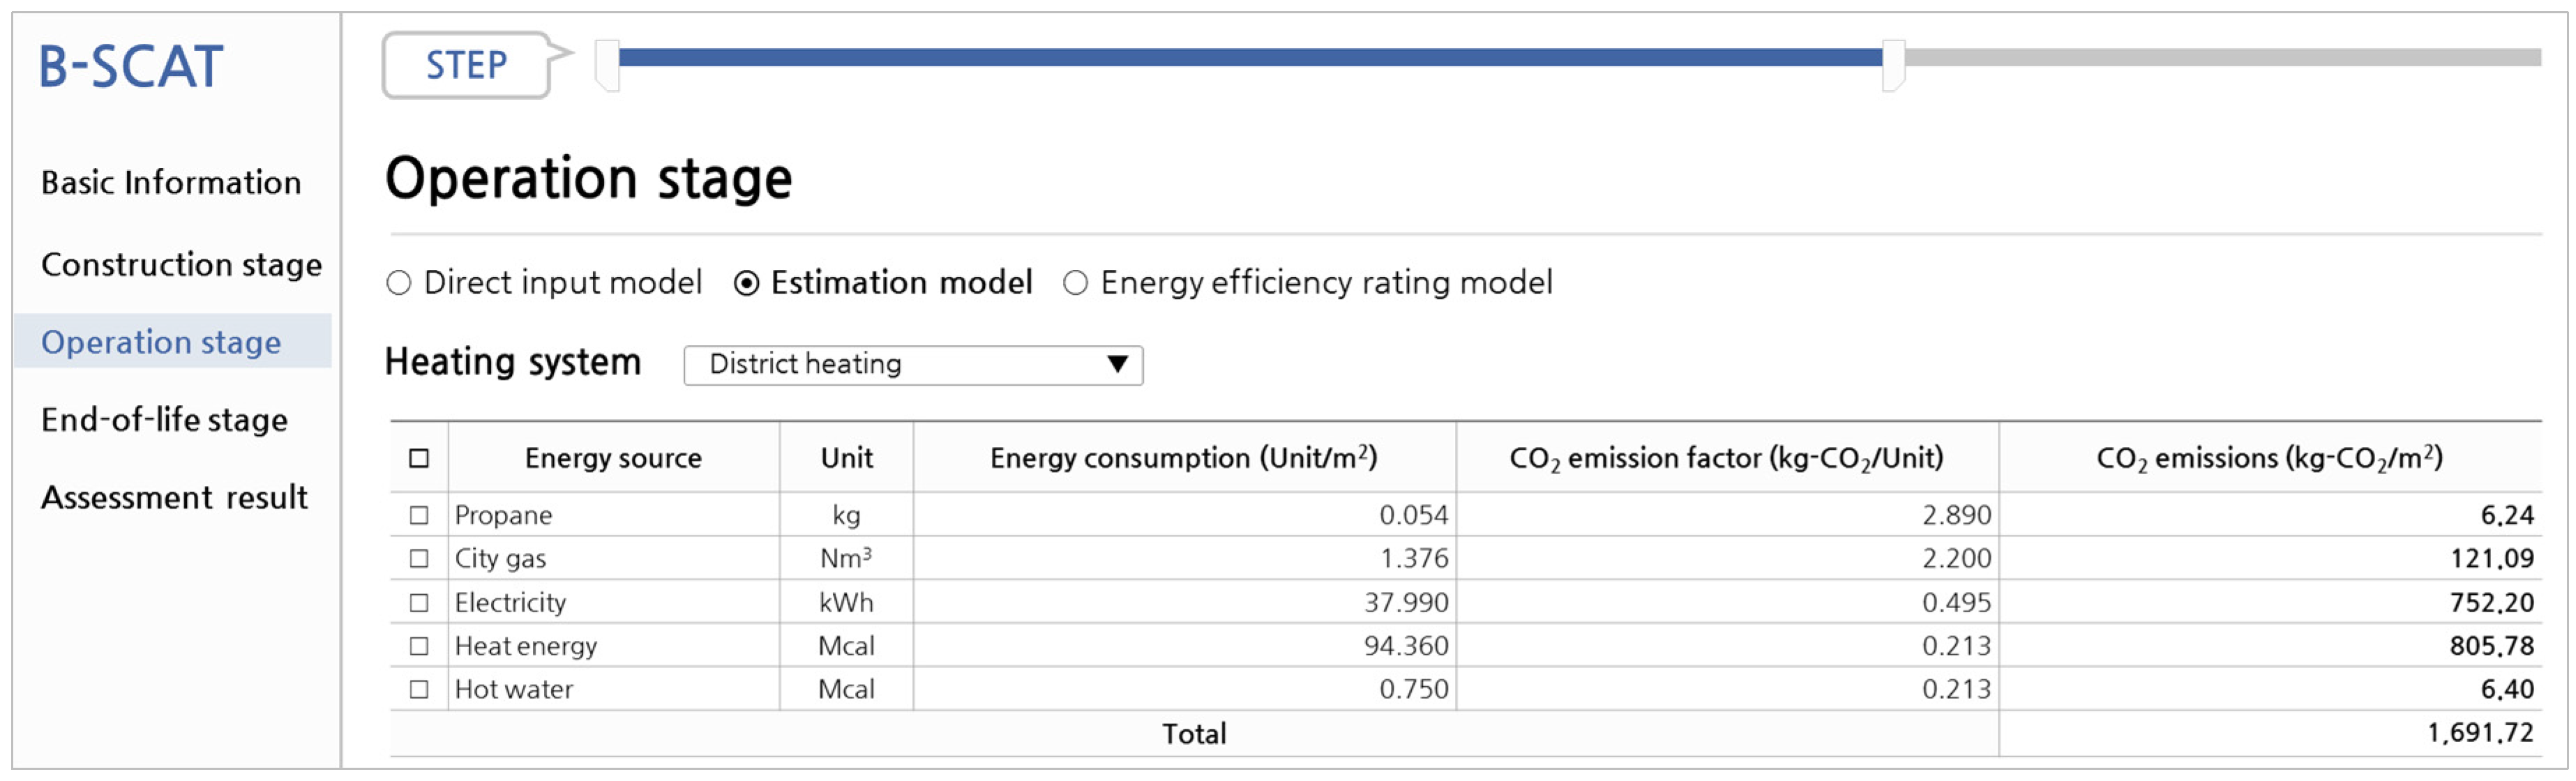
2.2.2. Estimation Model

The estimation model predicts the energy consumption pattern of a building using an analysis of previously accumulated survey data. The calculated result is typically in the form of annual energy consumption and depends on the utility and gross area of the building. To ensure the reliability of the estimation model, this study investigated and analyzed the average energy consumption based on the heating system used by the apartment building and the average energy consumption of the office building determined from the Energy Census Report (2014) [49], which is published every three years by the Korea Ministry of Trade, Industry, and Energy. The mixed-use building, which was not specified in the Energy Census Report, was categorized as part apartment and part office building and, therefore, utilized the average energy consumption values of both an apartment and office building. Table 7 lists the average energy consumption for the apartment building analyzed in this study. Equation (15) represents the estimation model for evaluating the CO2 emissions during the operation stage.
CO 2 OS = n = 1 SL ( 1 + RR ) n 1 × GA × k ( EC k EM × CF k EN ) ,
where CO2OS is the CO2 emissions (kg-CO2) in the operation stage; SL is the service life of the building (years); RR is the annual reduction rate of operational energy effectiveness; GA is the gross area (m2) of the building; ECkEM is the annual energy consumption per unit area based on the estimation model (refer to Table 7); and CFkEN is the CO2 emissions factor of energy source k (refer to Table 6).

2.2.3. Energy Efficiency Rating Model

The energy efficiency rating model is the one used by the South Korea Building Energy Efficiency Rating Certification System for the construction of an apartment building or commercial building. The annual CO2 emissions per exclusive area due to air-conditioning, heating, hot water, lighting, and ventilation were inputted into the model based upon the Building Energy Efficiency Rating Certification System [50]. Equation (16) represents the energy efficiency rating model for evaluating the CO2 emissions during the operation stage:
CO 2 OS = n = 1 SL ( 1 + RR ) n 1 × EA × l CE l EERM ,
where CO2OS represents the CO2 emissions (kg-CO2) in the operation stage; SL is the service life of the building (years); RR is the annual reduction rate of operational energy effectiveness; EA is the exclusive area (m2) of the building; and CElEERM is the annual CO2 emissions of energy consumption part l, according to the energy efficiency rating model.

2.3. End-of-Life Stage

The CO2 emissions of the end-of-life stage include those released during the building’s demolition process, transportation of the waste building materials, and the landfill gas produced by the waste building materials, as described in Equation (17). The demolition process includes an evaluation of the CO2 emissions from the equipment used to demolish the building. Waste transport emissions include CO2 emitted during the transport of the generated waste to the landfill. Once in landfill, an evaluation is performed on the CO2 emissions generated by the waste building materials as landfill gas. However, it is difficult to obtain detailed disposal information in the early design phase. Hence, in this study, the oil consumption for each combination of demolition equipment and landfill equipment was organized into a database and adapted using CO2 emissions assessment methods based on an analysis of the results of previous studies [20,54,55]. Table 8 lists the equipment mileage used during the demolition and landfill processes, and Equations (18)–(20) represent CO2 emissions in each process of the end-of-life stage:
CO 2 ES = CO 2 DP + CO 2 TP + CO 2 LP ,
CO 2 DP = QW × EM m DP × CF d EN ,
CO 2 TP = QW × DT × CF TR ,
and
CO 2 LP = QW × EM m LP × CF d EN ,
where CO2ES represents the CO2 emissions (kg-CO2) in the end-of-life stage; CO2DP is the CO2 emissions (kg-CO2) in the demolition process based on demolition equipment; CO2TP is the CO2 emissions (kg-CO2) in the transportation process based on transportation vehicles; CO2LP is the CO2 emissions (kg-CO2) in the disposal process based on disposal equipment; QW is the quantities of wasted building materials (ton); EMmDP is the mileage (ℓ/ton) of demolition equipment m (refer to Table 8); CFdEN is the CO2 emissions factor of diesel (2.58 kg-CO2/ℓ); DT is the distance (km) that waste building materials are transported to the landfill site; CFTR is the CO2 emissions factor of a truck (0.249 kg-CO2/ton·km); and EMmLP is the mileage (ℓ/ton) of landfill equipment m (refer to Table 8).

3. Development of a B-SCAT

This section describes the development of a B-SCAT for supporting low-carbon building design and efficient decision-making processes in the early design phase of a building. This tool divides the assessment procedure into basic information, construction, operation, and end-of-life steps. In particular, it facilitates assessment by making simple selections of supply materials for each building area in the construction stage. This process enables diverse alternative assessments to be made within a limited timeframe. Default values calculated from the database were provided for the construction process, operation stage, and end-of-life stage in order to reduce the time and labor required for the assessment.

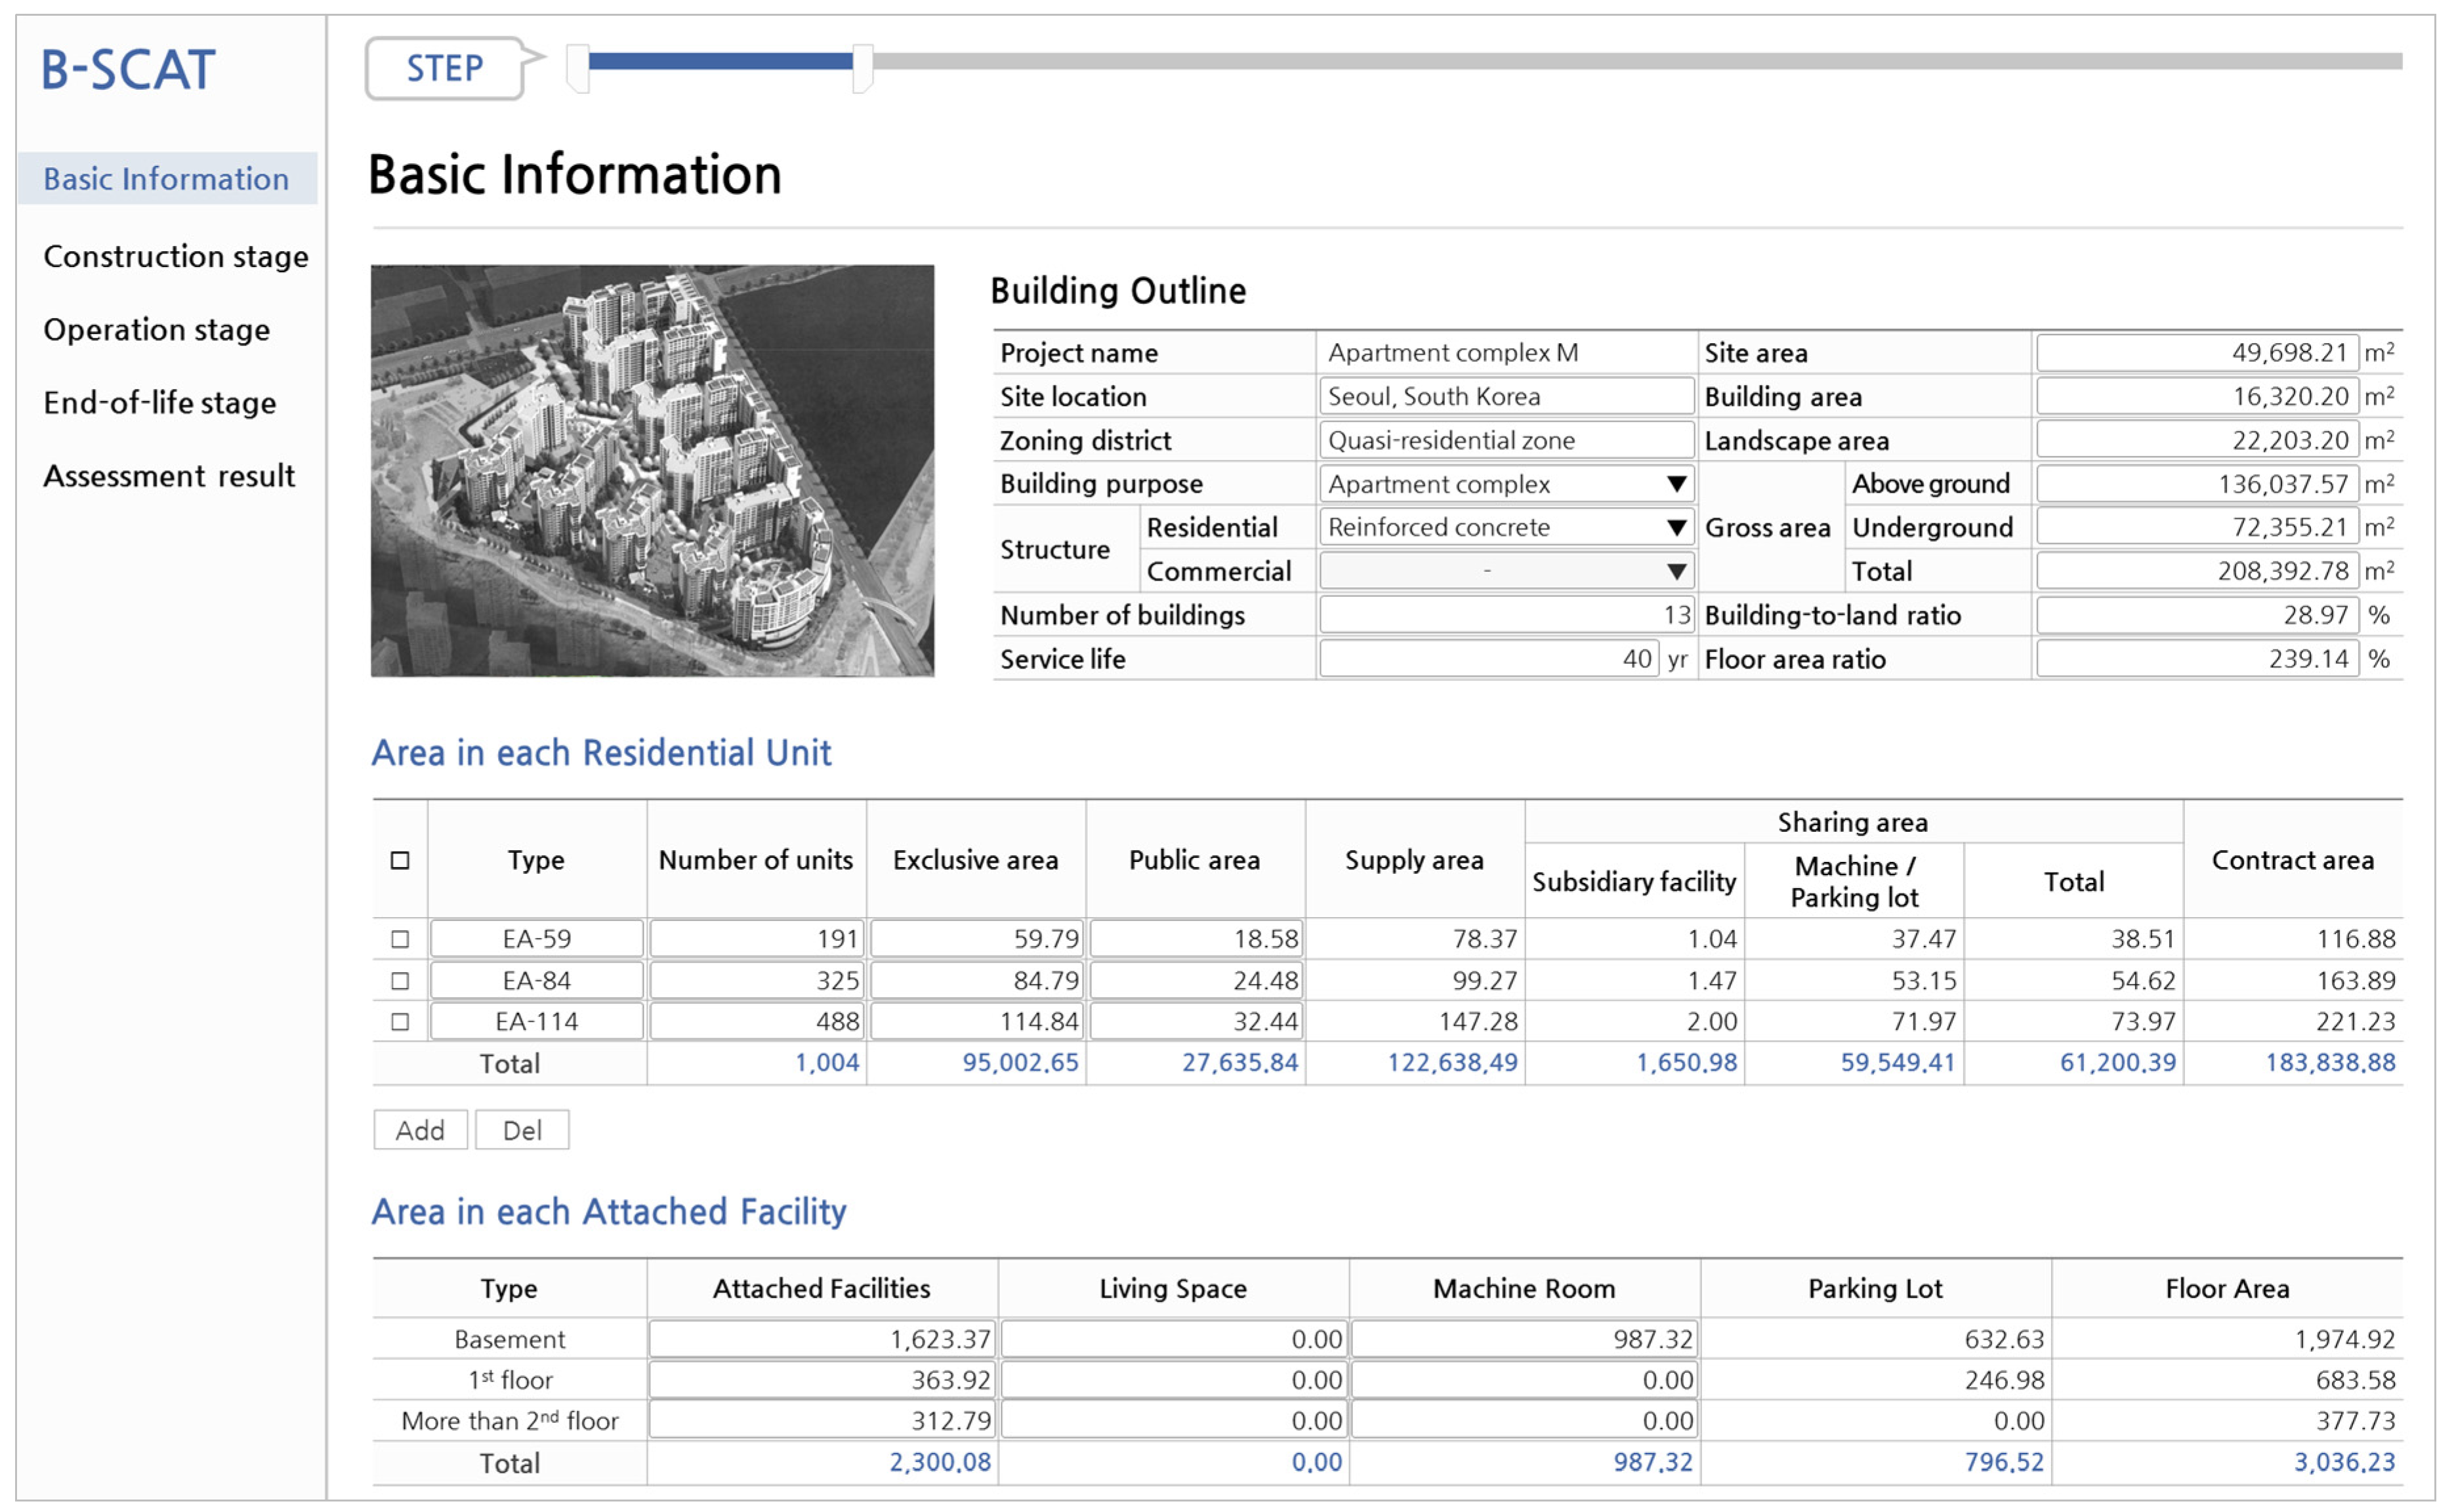
3.1. Step 1: Basic Information

The basic information includes the architectural scheme data of the evaluated building. Items, such as site location and zone, are entered; the function and structural form of the evaluated building are selected; and the gross area, building-to-land ratio, and floor area ratio within the complex profile are calculated. In addition, the details of the evaluated building are set, establishing details, such as standard floor area, exclusive area, number of units, number of stories, structural type, plane type, and wall surface rate. Figure 3 illustrates the interface of the basic information in the B-SCAT.

3.2. Step 2: Construction Stage

During the construction stage, the CO2 emissions resulting from the production of building materials are assessed, and the input interface is established depending on the function of the building. To assess the CO2 emissions for an apartment complex, data on the residential building, annexed building, underground parking lot, and landscaping were entered. To assess the emissions for an office building, data on the office building, annexed building, underground parking lot, and landscaping were entered. To assess the emissions for a mixed-use building, data on the residential building, office building, annexed building, underground parking lot, and landscaping were entered. In addition, the CO2 emissions were assessed by selecting the type of materials supplied as structural and finishing materials for each assessment item. Figure 4 illustrates the interface of the construction stage.

3.3. Step 3: Operation Stage

The assessment method of the operation stage is divided into three types. In the direct input model, the annual energy consumption of the evaluated building is entered and assessed directly. The estimation model assesses the CO2 emissions based on annual energy consumption per unit area, which depends on the building function and heating system. This model utilizes the database included in the tool and can be useful when energy consumption data is unavailable for the building of interest. The energy efficiency rating model assesses the CO2 emissions by directly inputting the assessment results of the CO2 emissions of a building, utilizing the Energy Efficiency Rating Certification System of the evaluated building or the energy simulation program provided by the Korea Energy Management Corporation. Figure 5 illustrates the interface of the operation stage.

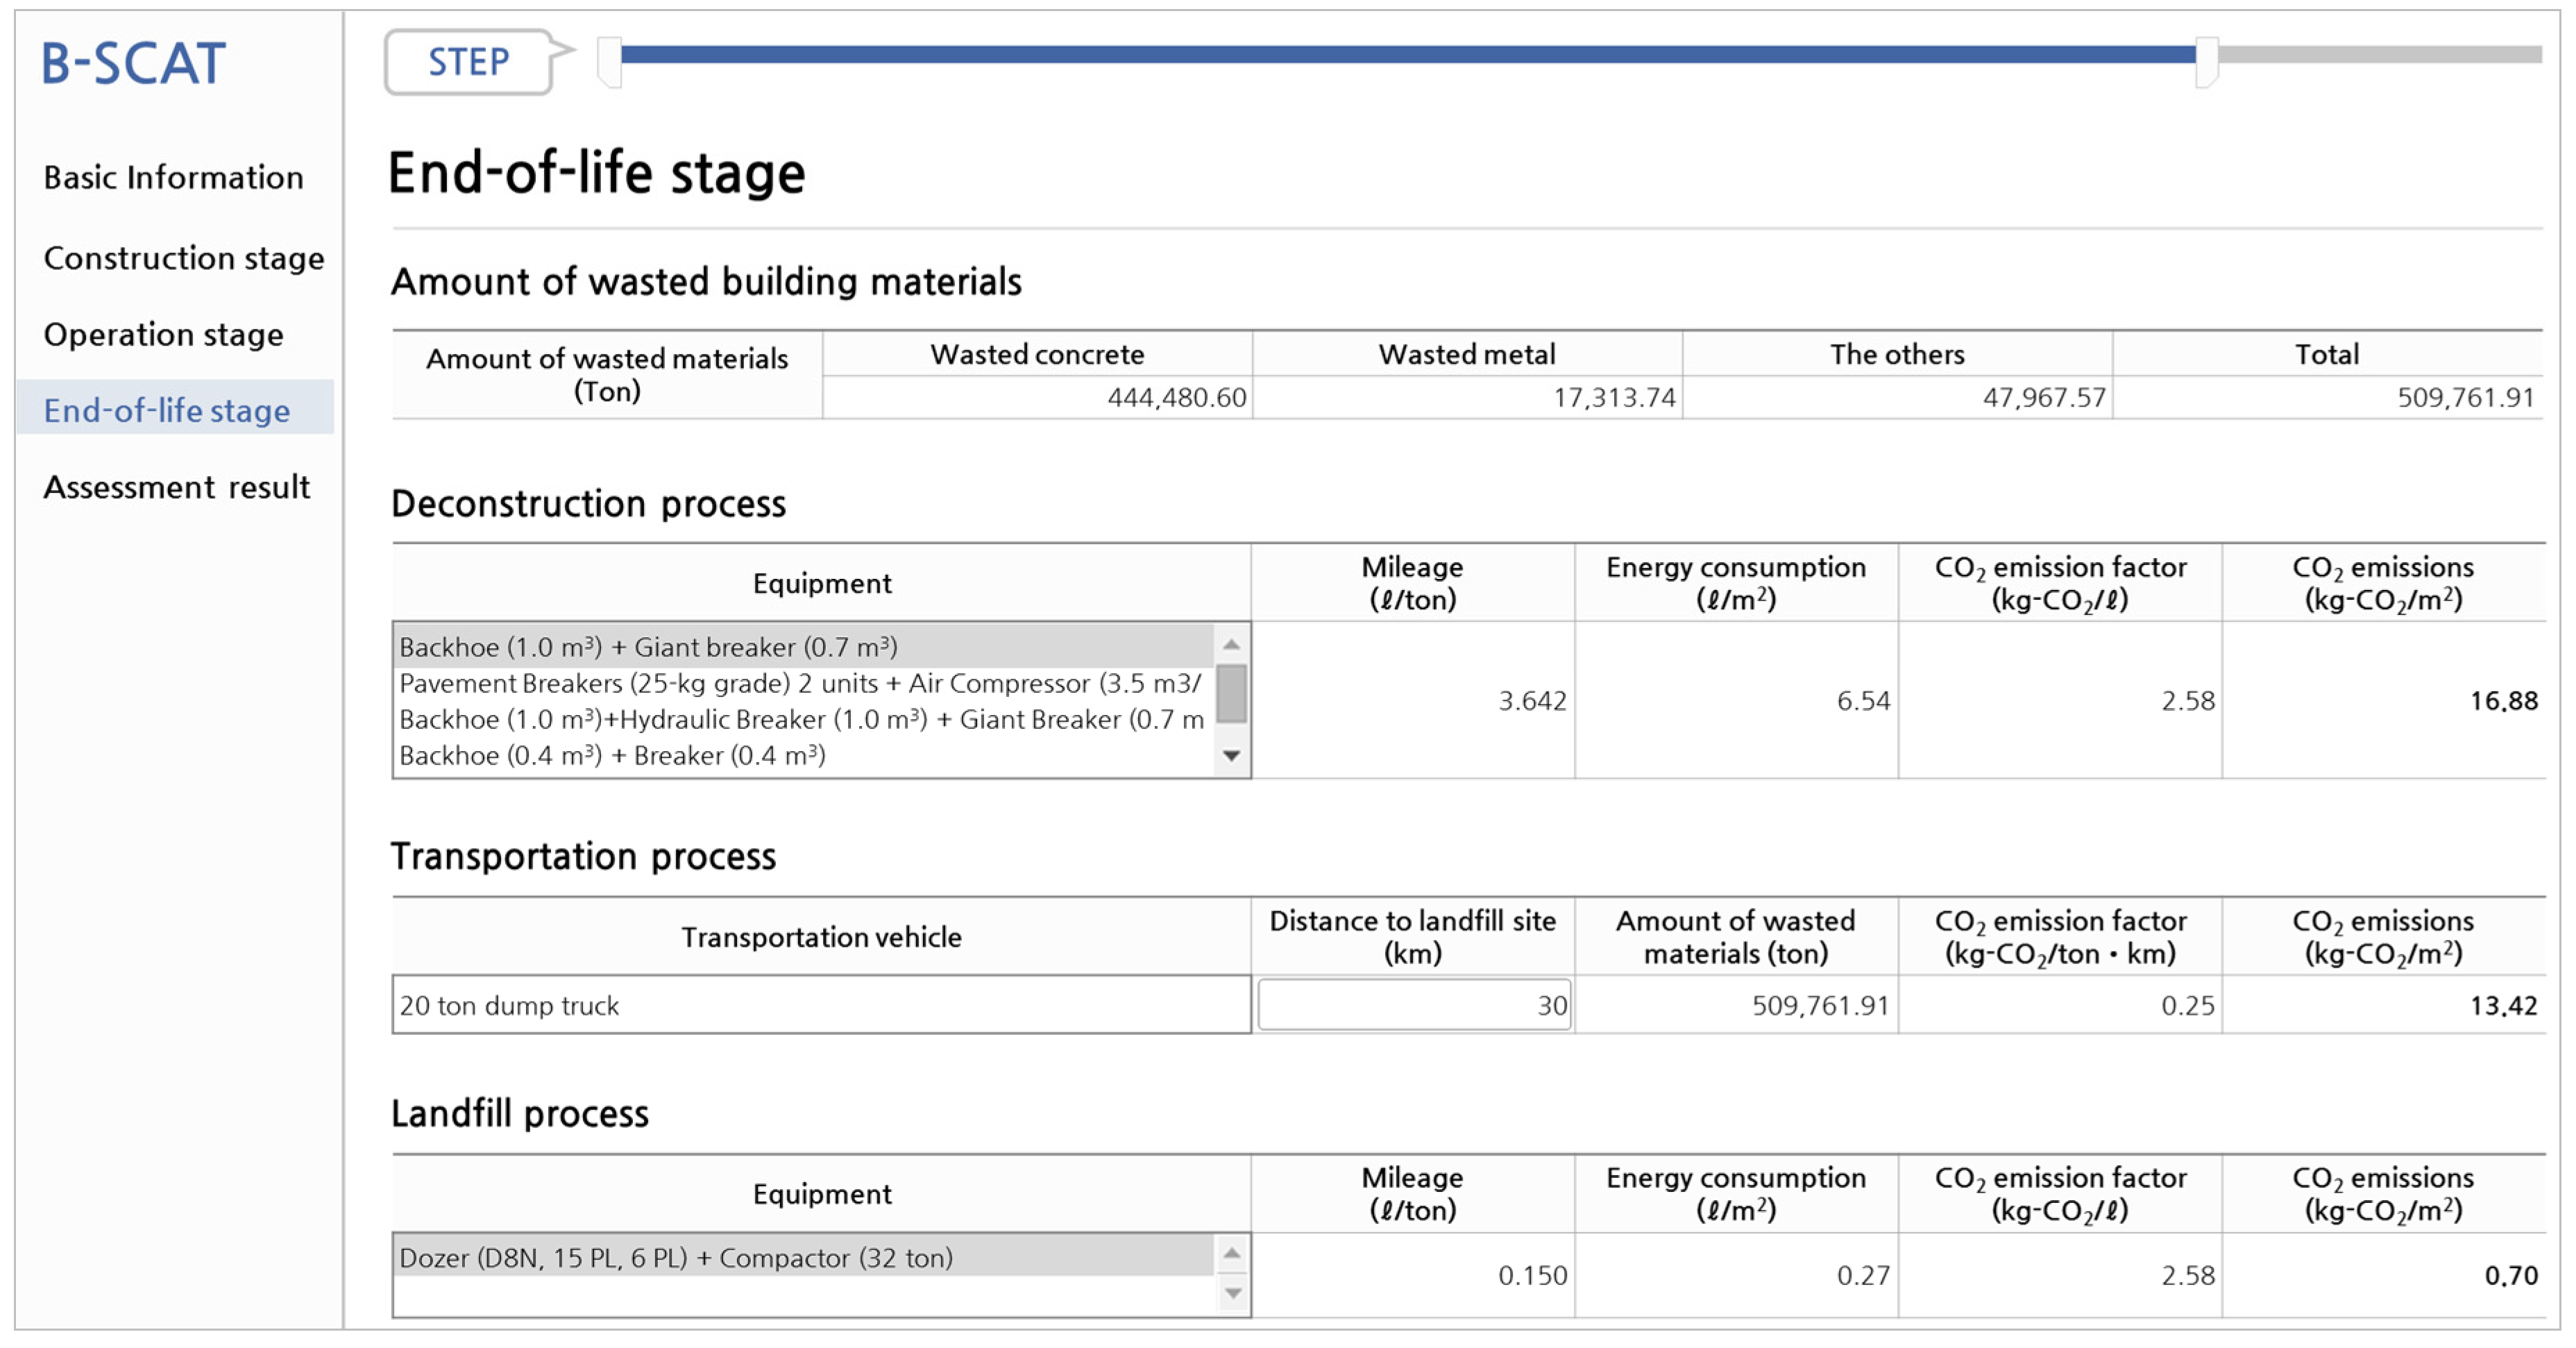
3.4. Step 4: End-of-Life Stage

The end-of-life stage involves an assessment of the CO2 emissions produced at the end of a building’s life cycle, when structures are demolished and waste building material is generated and processed. The assessment includes analysis of the equipment used in the building demolition and waste landfill process. Figure 6 illustrates the interface of the end-of-life stage.

3.5. Step 5: Assessment Results

The assessment results, as shown in Figure 7, are displayed on one screen that includes all of the details of the assessment of the LCCO2 emissions. The upper region of the comprehensive assessment view displays the profile of the building of interest, the assessment method used for each stage, the details of the database used, and the basis for the calculations. The lower region presents a comparative analysis of the CO2 emissions assessment results in each stage according to the standard building type selected during the assessment.

4. Case Study

To review the applicability of the B-SCAT, an assessment was conducted using the basic data for a building that was recently completed. For comparison with the assessment results, the finishing materials used during the production process of construction stage were selected based on the same basic drawings and specifications drafted during the early design phase used for those results.

4.1. Evaluated Building

The project’s evaluated building comprised Apartment Complex M, which contains 13 residential buildings. Table 9 presents the architectural scheme of the analyzed building.

4.2. Assessment Conditions

As shown in Table 10, the assessment conditions were selected according to the input items for each assessment stage, which were based on the plan, drawings, and specifications of the apartment complex.
B-SCAT, and the construction and design provisions of the evaluated building, were analyzed according to the input items of the residential and annexed buildings. The plane type and structural form of the residential building were determined to be the flat-type and tower-type, reinforced concrete structure, and wall type, respectively, and the wall surface ratio was set at 55%. In addition, the superintendent office, holding facilities, and sports center were identified as annexes in the analysis, and their wall surface ratio was also set to 60%. In the construction stage, the materials used for each assessment item in each building element were analyzed based on an analysis of the plan of the apartment complex and the table of interior and exterior finishing materials. In particular, the use of 27 MPa ordinary concrete was assumed for the first to the sixth floors of the residential buildings, in the interest of structural stability, while the use of 21 MPa concrete was assumed for the seventh floors and higher, to achieve economic efficiency. In addition, the exterior walls were assumed to use granite and stone moldings for the first three floors and water-based paint for the fourth floors and higher. Aluminum window frames and insulating glass were assumed for all 13 buildings of the apartment complex. The annexed buildings, low-rise buildings with 1 to 3 stories, which comprised the superintendent office, holding facilities, and sports center, were assumed to use 21 MPa concrete. Given the function of those buildings, it was assumed the exterior walls were marble and granite, and the interior walls had terrazzo and water-based paint. In the operation stage, given the absence of results from a simulation of the energy consumption of the apartment complex or from the preliminary Energy Efficiency Rating Certification System, the estimation model was used for analysis. The local heating system, which is the actual heating system of the evaluated building, was selected to calculate CO2 emissions. The service life of the evaluated building was set to 40 years, according to the building durability period of the South Korean Corporate Tax Act [56]. The reduction rate of operational energy effectiveness was assumed as 0%, 1%, and 1.5% in the end-of-life stage, the equipment selected for demolition included a backhoe (1.0 m3) and a giant breaker (0.7 m3). Also included was the 30 km distance between the building site and the landfill processing site. A bulldozer (D8N, 15 PL, 6 PL) and compactor (32 tons) were selected as the equipment used in the landfill process.

4.3. Assessment Results

Figure 8 presents the results of the LCCO2 emissions assessment of the apartment complex. The CO2 emissions produced during the construction stage were assessed as 502.76 kg-CO2/m2 using the tool developed in this study and 515.71 kg-CO2/m2 based on the actual BOQ, yielding an error rate of 2.51%. The CO2 emissions of the operation stage, which applied 0% of the reduction rate of operational energy effectiveness, were assessed as 1691.72 kg-CO2/m2. In addition, the LCCO2 emissions were assessed as 2225.48 kg-CO2/m2 and 2238.43 kg-CO2/m2, respectively, yielding an error rate of approximately 0.58%.

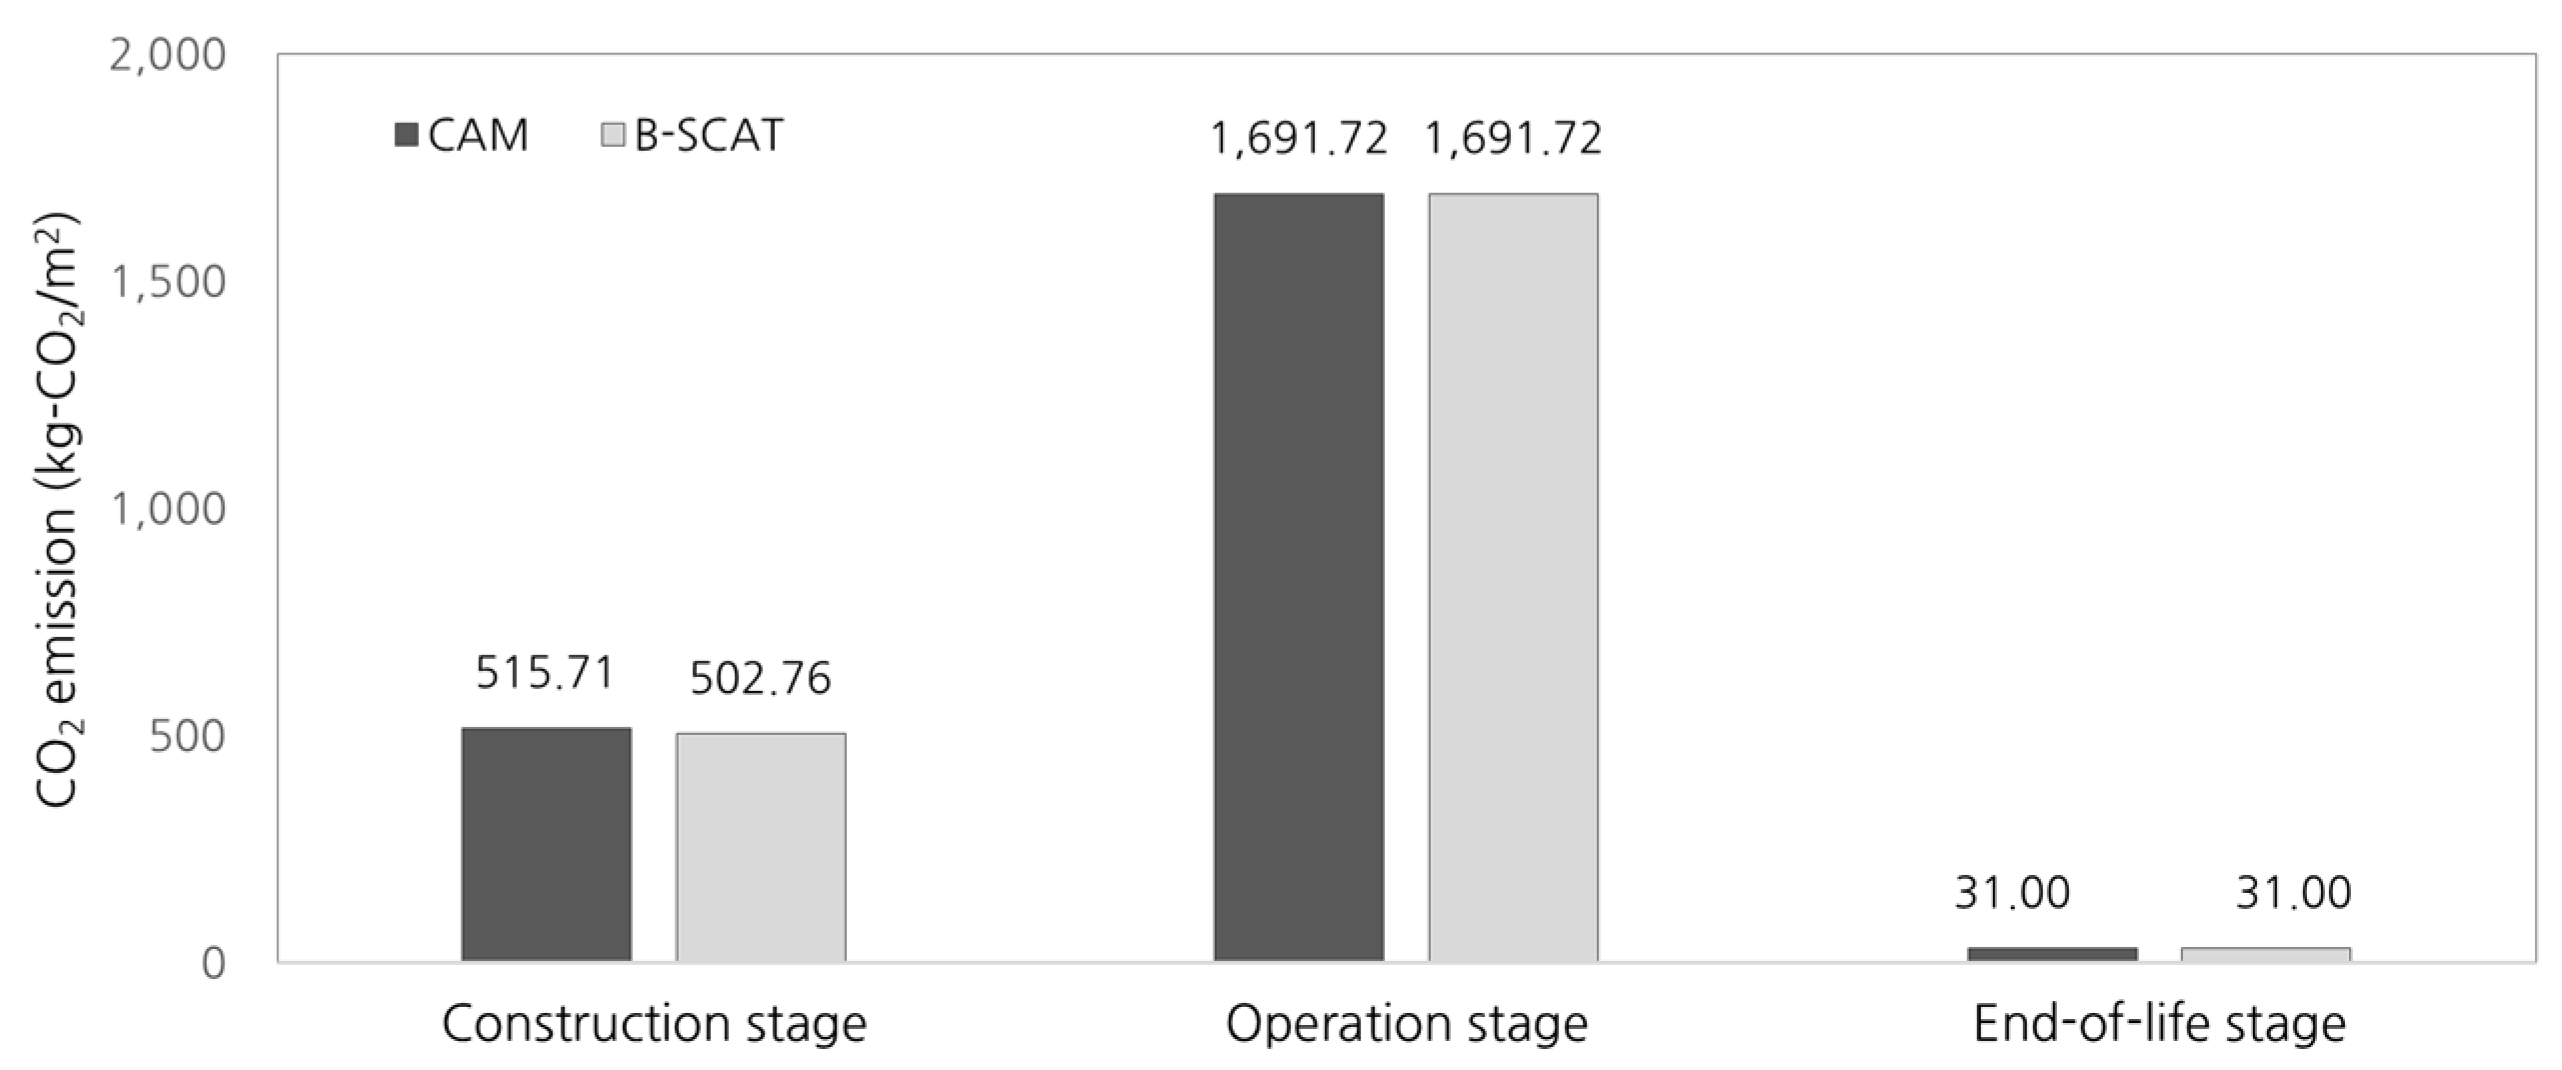
4.4. Comparative Analysis of Assessment Results of Construction Stage

From the assessment results from the previously conducted building LCCO2 emissions assessment tool and from the drawings and specifications, this study conducted a comparative analysis of the assessment results of the production stage after subdividing the results into residential buildings, annexed buildings, and underground parking lots.

4.4.1. Residential Buildings

As shown in Figure 9, this study conducted a comparative analysis of the CO2 emissions per unit area of the supply materials for each residential building region calculated using this tool. The assessment items (Buildings 701, 702, 703, and 704) and the average CO2 emissions per unit area of the residential buildings were calculated using the BOQ. Consequently, the results calculated with the tool for Buildings 701, 702, 703, and 704 were 443.74 kg-CO2/m2, 437.13 kg-CO2/m2, 438.42 kg-CO2/m2, and 445.16 kg-CO2/m2, respectively. Compared with the value of 449.23 kg-CO2/m2 assessed from the BOQ, these values yielded error rates of 1.22%, 2.69%, 2.41%, and 0.91%, respectively. In addition, the average assessment result of the tool was 441.59 kg-CO2/m2, which closely approximated the BOQ assessment results with an error rate of 1.70%.

4.4.2. Annexed Building

For the annexed buildings, as shown in Figure 10, a comparative analysis was conducted on the CO2 emissions per unit area of supply materials for each building part in the superintendent office (SO), holding facilities (HF), and sports center (SC). The annexed buildings’ average CO2 emissions per unit area were calculated from the BOQ. Consequently, the results assessed using this tool for the SO, the HF, and the SC were 427.46 kg-CO2/m2, 445.65 kg-CO2/m2, and 432.54 kg-CO2/m2, respectively; these are valid results compared with the value of 442.52 kg-CO2/m2 obtained from the BOQ. In addition, the error rates were 3.40%, 0.71%, and 2.26%, respectively, and the average error rate was 1.65%.

4.4.3. Underground Parking Lot

As shown in Figure 11, a comparative analysis was conducted on the CO2 emissions per unit area of supply materials for each building part of the underground parking lot (PL). The average CO2 emissions per unit area of the underground parking lot was calculated from the BOQ. Consequently, the results assessed using this tool for the PL was 676.52 kg-CO2/m2, respectively; this is a valid result compared with the value of 654.27 kg-CO2/m2 obtained from the BOQ. In addition, the error rate was 3.40%, respectively.

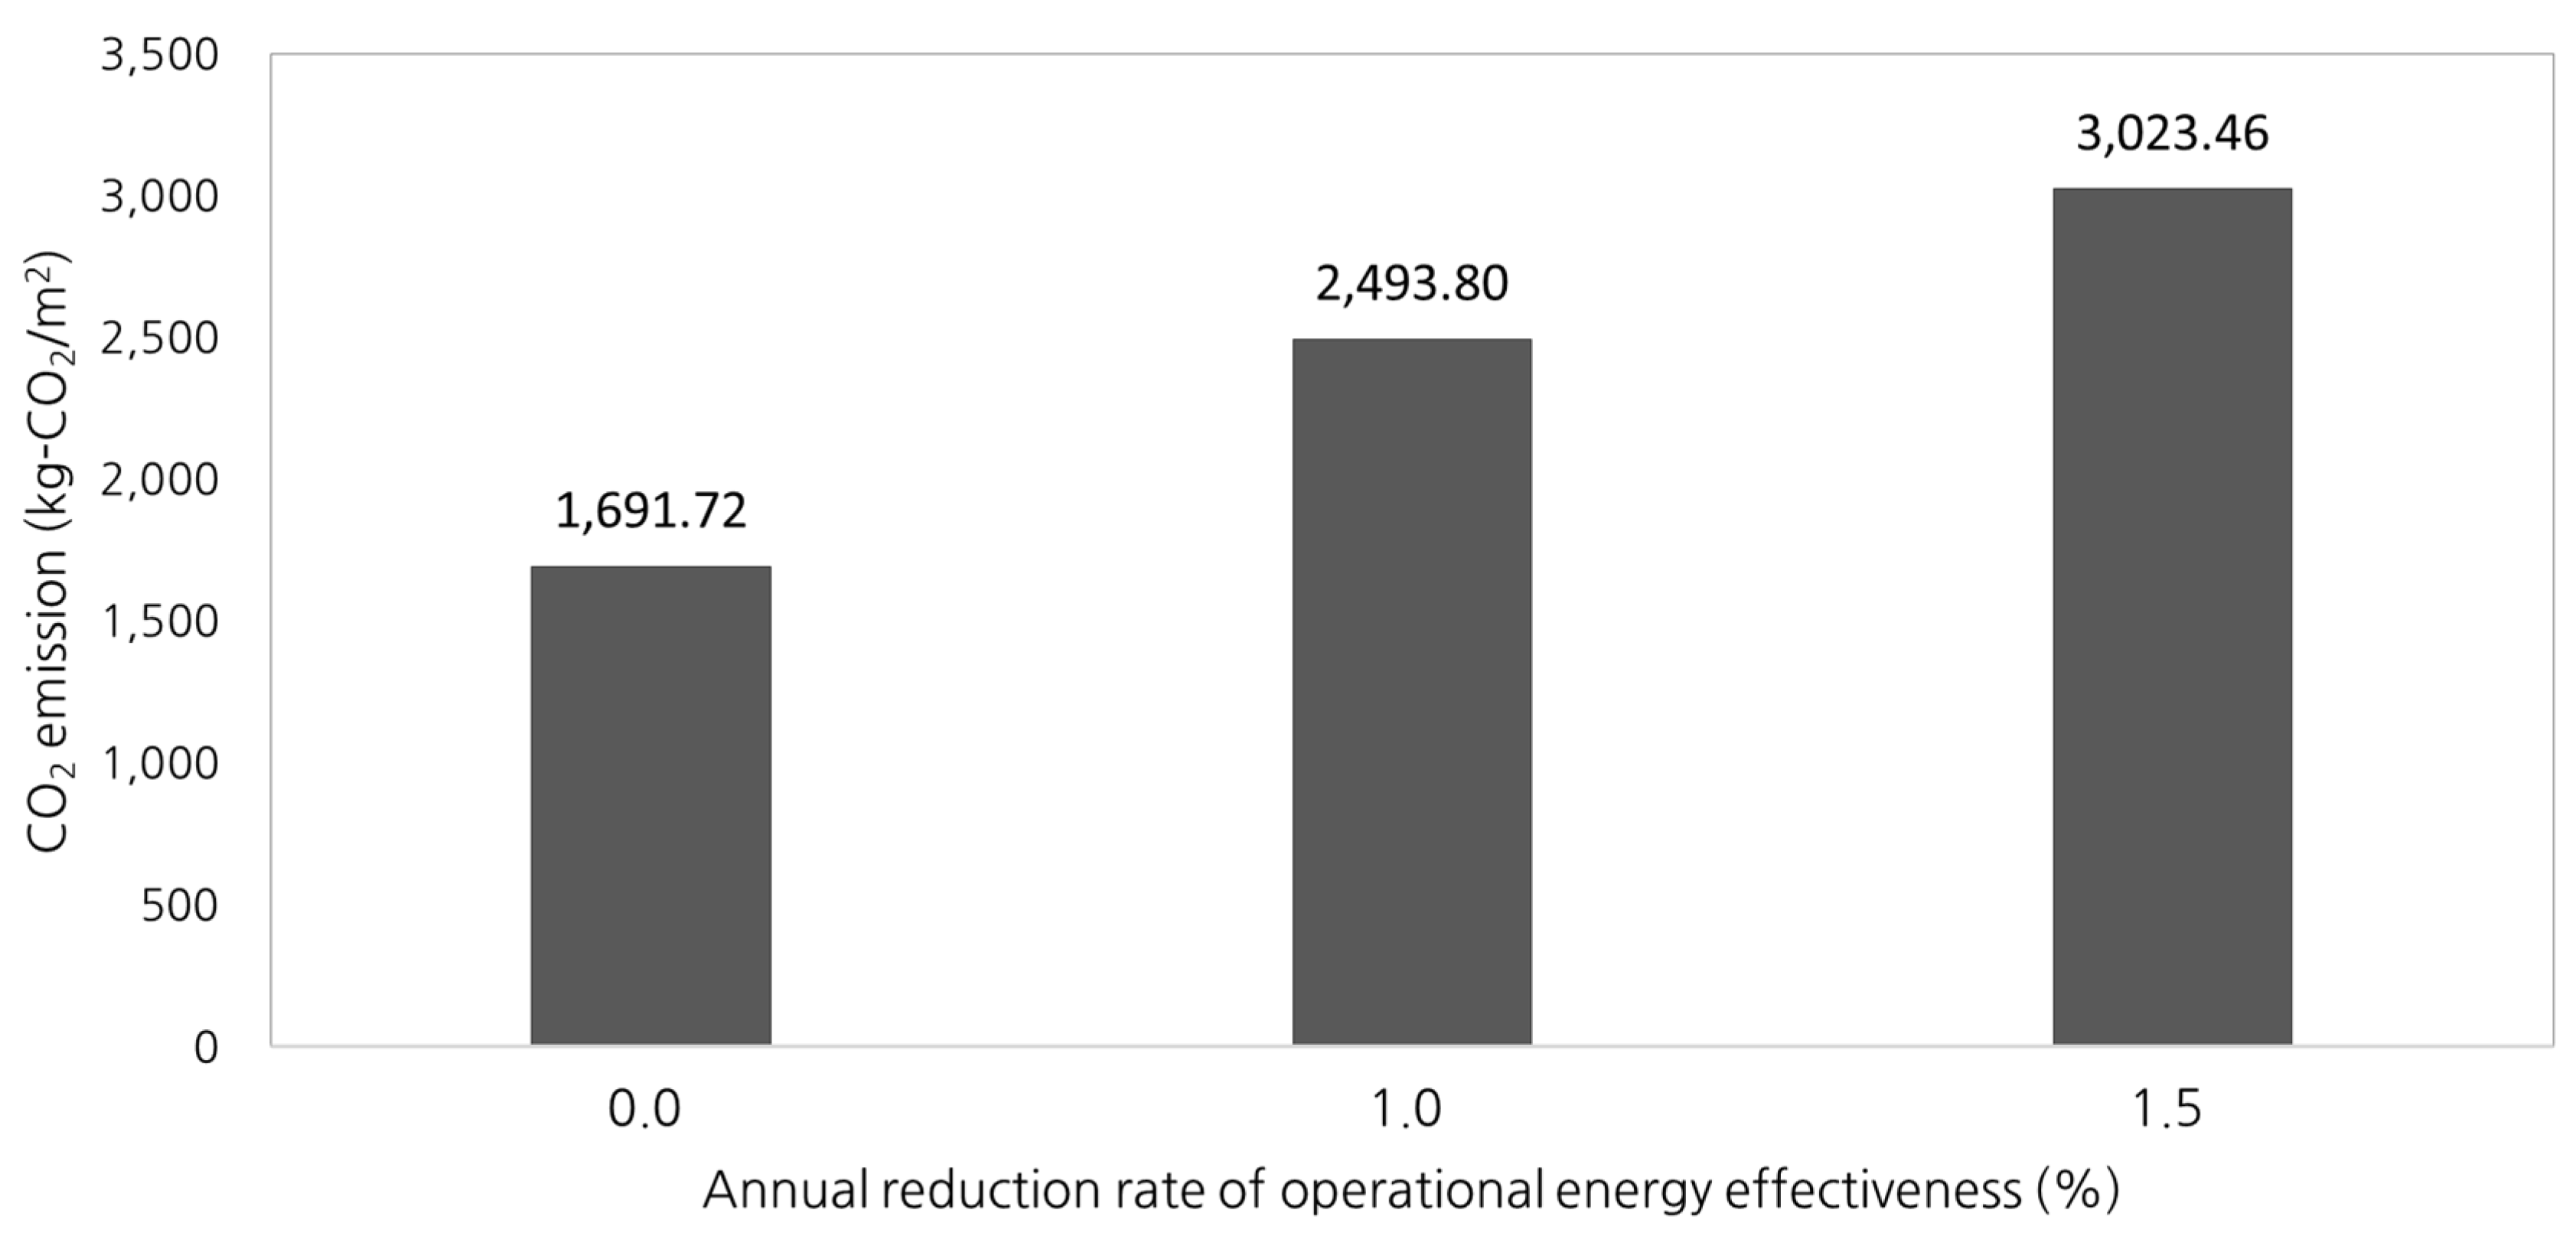
4.5. Comparative Analysis of Assessment Results of Operation Stage

As shown in Figure 12, this study conducted a comparative analysis of the CO2 emissions per unit area of operation stage by the reduction rate of operational energy effectiveness. The assessment results applied 0%, 1%, and 1.5% of the reduction rate of operational energy effectiveness were 1691.72 kg-CO2/m2, 2493.80 kg-CO2/m2, and 3023.46 kg-CO2/m2, respectively. Through this evaluation result, it confirmed that the evaluation result of the operational stage changed according to whether or not the annual reduction rate of operational energy effectiveness and size of this value was applied. That is, even if 1% of the annual reduction rate of operational energy effectiveness was applied, 47% of energy consumption increased, and 79% of energy consumption increased in 1.5% application during the service life of the building (40 years). Therefore, in order to achieve the low-carbon building, the selection of energy equipment, which have low reduction rates of operational energy effectiveness, is very important.

5. Conclusions

The purpose of this study was to develop a B-SCAT that is applicable in the early design phase for low-carbon building design. The conclusions of this study are as follows:
(1)
After separating the life cycle of a building into various stages, including construction, operation, and end-of-life, a simplified LCCO2 emissions assessment model and B-SCAT were developed for application to the early design phase of buildings.
(2)
In the construction stage, the supply quantities coefficient of structural materials for each building function and section were analyzed, and the equations were constructed based on an analysis of the types and areas of the finishing materials used for each building element.
(3)
In the operation stage, the model of assessment was identified using models for direct input, estimation, and energy efficiency rating in order to provide a proactive assessment according to the time of the assessment and the available data. An assessment method was subsequently proposed.
(4)
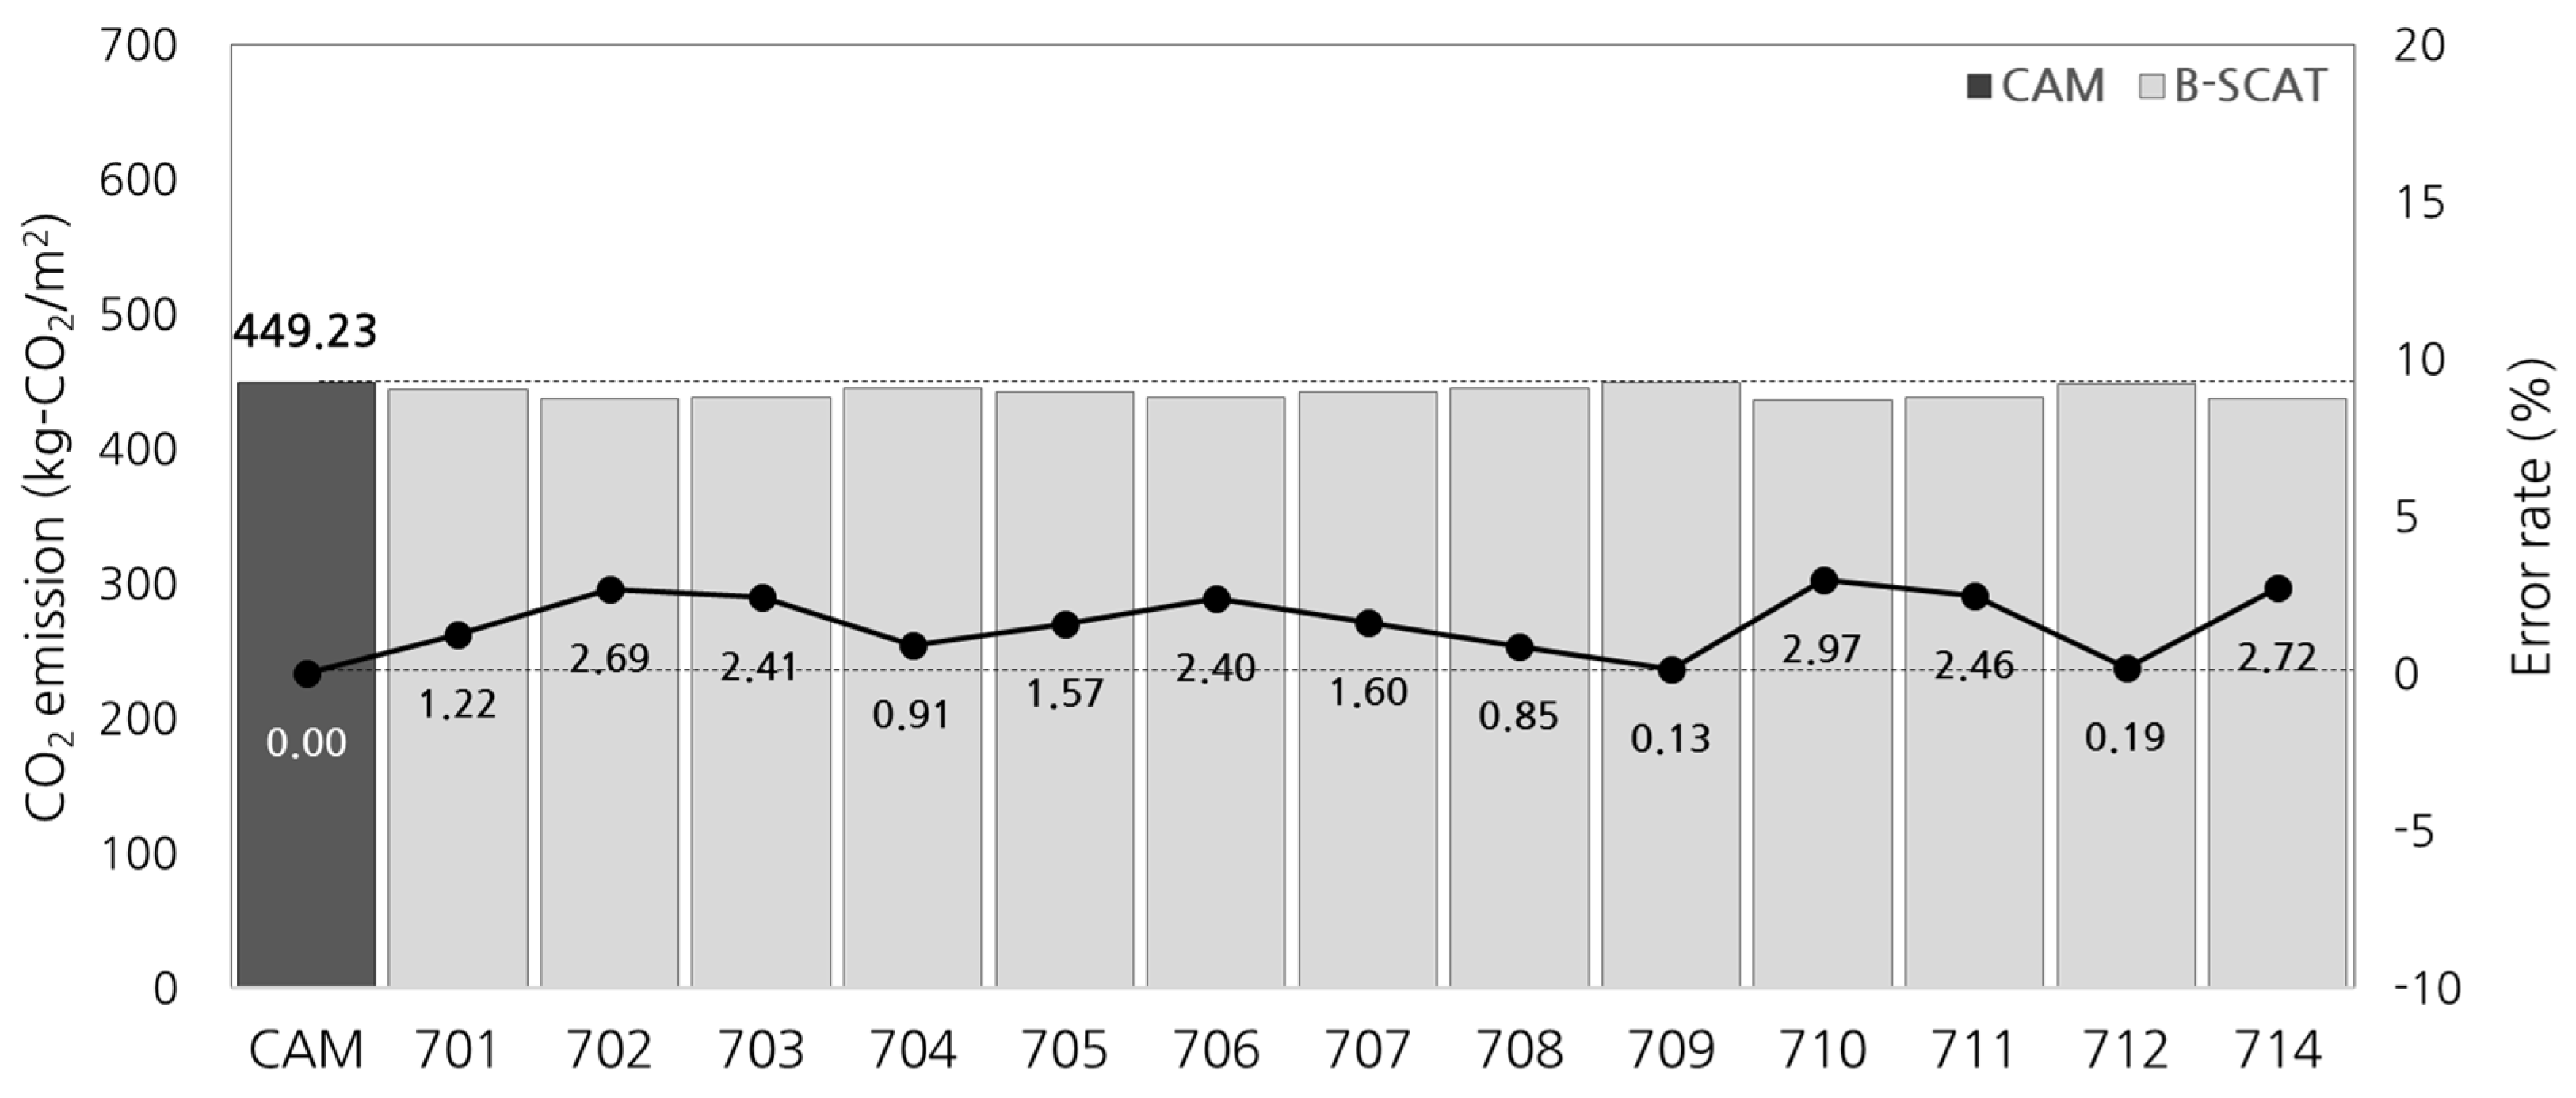
The average of the CO2 emissions assessment results for residential buildings tested during the case study of the B-SCAT was 441.59 kg-CO2/m2 per unit area; this is close to the assessment result of 449.23 kg-CO2/m2 based on the BOQ, yielding an error rate of 1.70%.
(5)
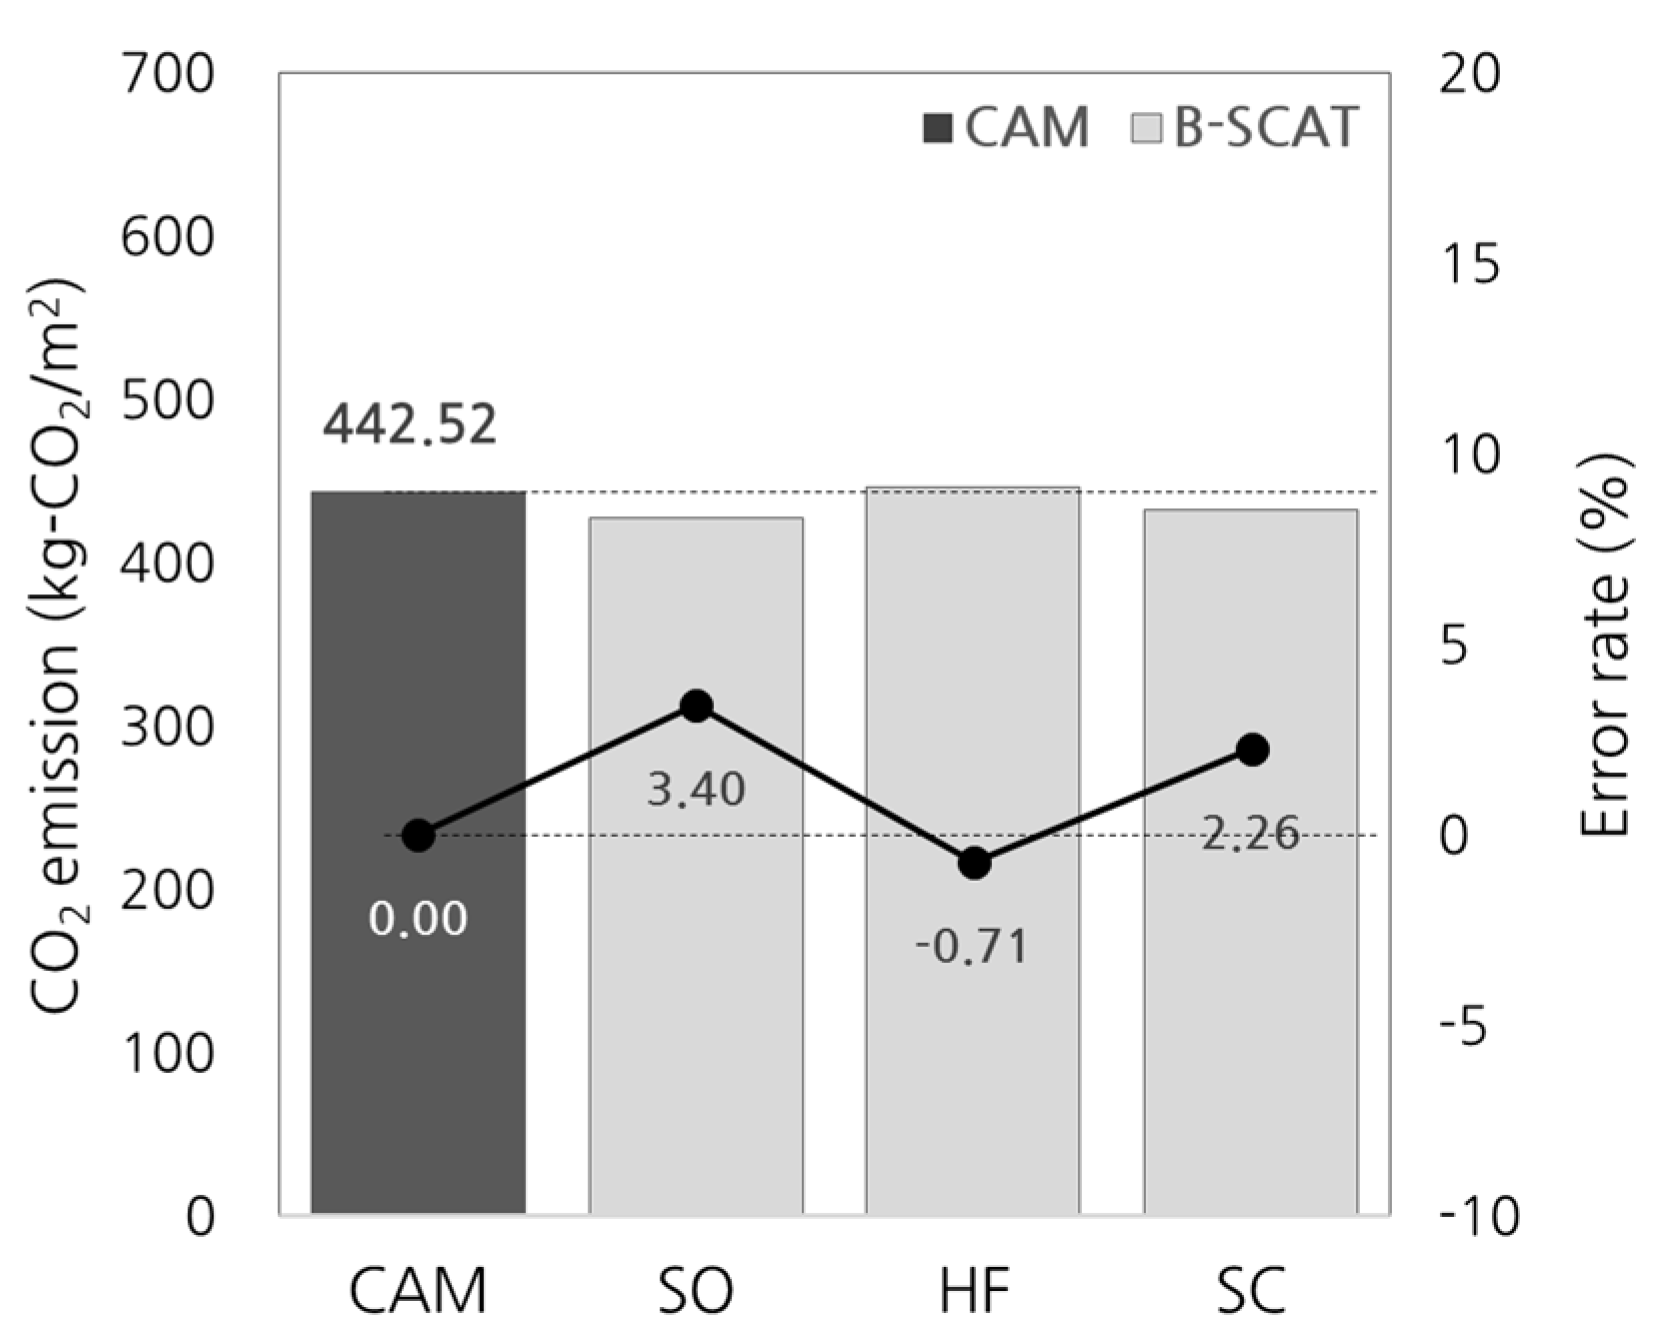
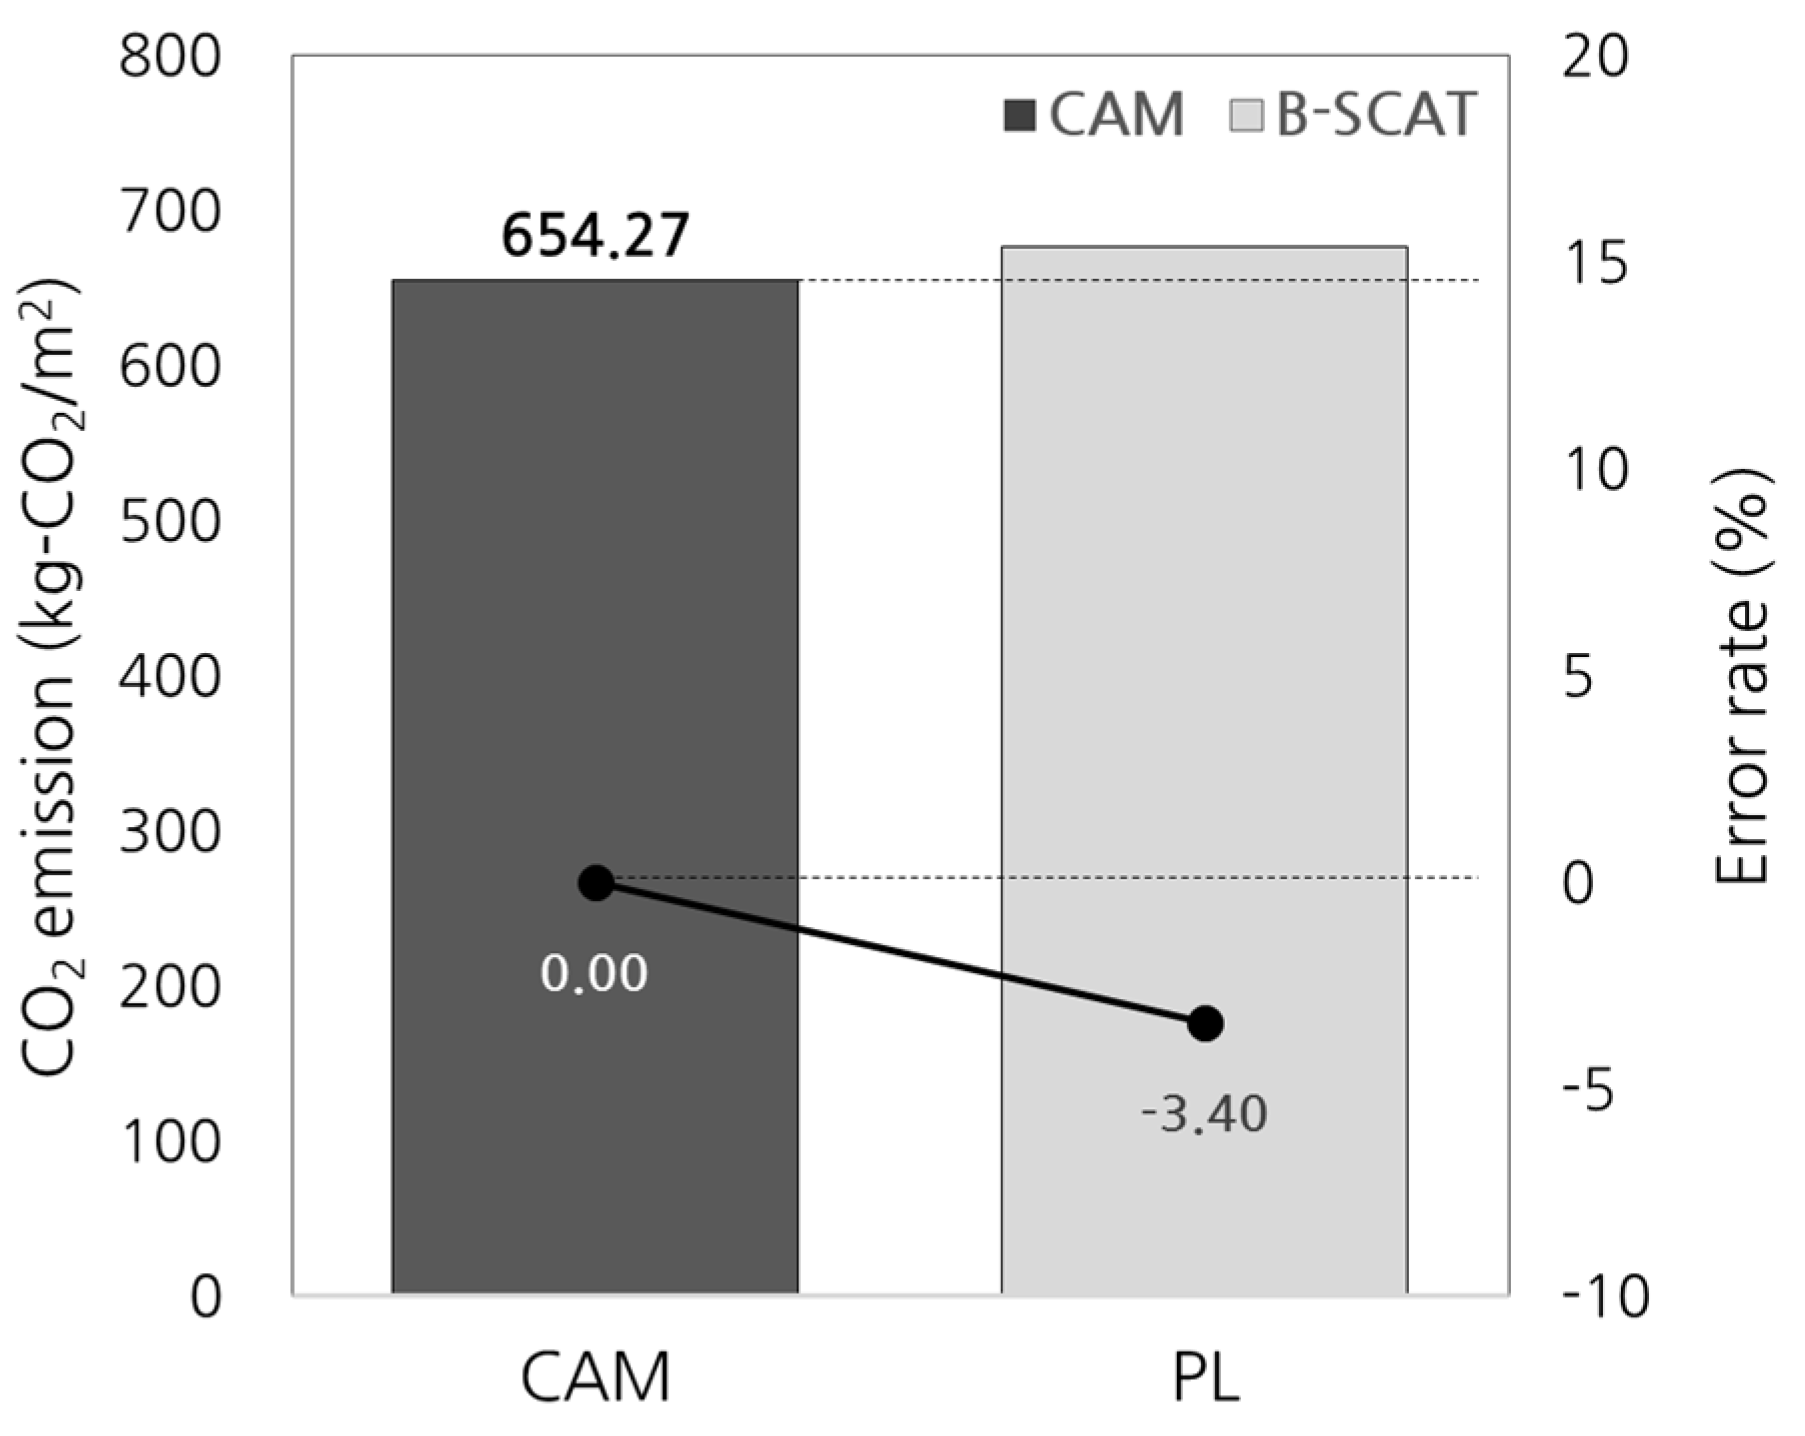
According to the analysis of the annexed buildings and underground parking lots using the B-SCAT, the average CO2 emissions were determined to be 435.22 kg-CO2/m2 and 676.52 kg-CO2/m2 per unit area, respectively, which closely approximates the results of 442.52 kg-CO2/m2 and 654.27 kg-CO2/m2, respectively, based on the BOQ, with error rates of 1.65% and 3.40% respectively.
The B-SCAT developed by this study for use in the early design phase is expected to predict the environmental performance of future construction projects and alternative assessments, leading to low-carbon building designs.
Currently, according to application of the mainly-constructed database in Korea, it is considered to broaden the range of the B-SCAT database in order that other countries utilize B-SCAT. Especially, it is considered to be possible to apply identical building life cycle CO2 emission assessment methods in the early stage of a project, which is suggested in this paper, to other countries.

Acknowledgments

This research was supported by Basic Science Research Program through the National Research Foundation of Korea (NRF) funded by the Ministry of Science, ICT & Future Planning (No. 2015R1A5A1037548) and the National Research Foundation of Korea (NRF) grant funded by the Korea government (MSIP) (No. 20110028794).

Author Contributions

All authors contributed substantially to all aspects of this article.

Conflicts of Interest

The authors declare no conflict of interest.

Abbreviations

The following abbreviations are used in this manuscript:
LCCO2Life Cycle CO2
BOQBill of Quantities
B-SCATBuilding Simplified LCCO2 emissions Assessment Tool
INDCIntended Nationally Determined Contributions

References

  1. Wang, Q.; Chen, X. Energy policies for managing China’s carbon emission. Renew. Sustain. Energy Rev. 2015, 50, 470–479. [Google Scholar] [CrossRef]
  2. Gorobets, A. Eco-centric policy for sustainable development. J. Clean. Prod. 2014, 64, 654–655. [Google Scholar] [CrossRef]
  3. Mahapatra, K. Energy use and CO2 emission of new residential buildings built under specific requirements—The case of Växjö municipality, Sweden. Appl. Energy 2015, 152, 31–38. [Google Scholar] [CrossRef]
  4. Shi, Q.; Yu, T.; Zuo, J. What leads to low-carbon buildings? A China study. Renew. Sustain. Energy Rev. 2015, 50, 726–734. [Google Scholar] [CrossRef]
  5. Li, J.; Colombier, M. Managing carbon emissions in China through building energy efficiency. J. Environ. Manag. 2009, 90, 2436–2447. [Google Scholar] [CrossRef] [PubMed]
  6. Stojiljkovic, M.M.; Ignjatovic, M.G.; Vuckovic, G.D. Greenhouse gases emission assessment in residential sector through buildings simulations and operation optimization. Energy 2015, 92, 420–434. [Google Scholar] [CrossRef]
  7. International Energy Agency (IEA). Energy Technology Perspectives OECD/IEA; IEA: Paris, France, 2010. [Google Scholar]
  8. Zuo, J.; Zhao, Z.Y. Green building research-current status and future agenda: A review. Renew. Sustain. Energy Rev. 2014, 30, 271–281. [Google Scholar] [CrossRef]
  9. Urge-Vorsatz, D.; Koeppel, S.; Mirasgedis, S. Appraisal of policy instruments for reducing buildings’ CO2 emissions. Build. Res. Inf. 2007, 35, 458–477. [Google Scholar] [CrossRef]
  10. Annunziata, E.; Frey, M.; Rizzi, F. Towards nearly zero-energy buildings: The state-of-art of national regulations in Europe. Energy 2013, 57, 125–133. [Google Scholar] [CrossRef]
  11. Rashid, A.F.A.; Yusoff, S. A review of life cycle assessment method for building industry. Renew. Sustain. Energy Rev. 2015, 45, 244–248. [Google Scholar] [CrossRef]
  12. Bribián, I.Z.; Usón, A.A.; Scarpellini, S. Life cycle assessment in buildings: State-of-the-art and simplified LCA methodology as a complement for building certification. Build. Environ. 2009, 44, 2510–2520. [Google Scholar] [CrossRef]
  13. Wen, T.J.; Siong, H.C.; Noor, Z.Z. Assessment of embodied energy and global warming potential of building construction using life cycle analysis approach: Case studies of residential buildings in Iskandar Malaysia. Energy Build. 2015, 93, 295–302. [Google Scholar] [CrossRef]
  14. Basbagill, J.; Flager, F.; Lepech, M.; Fischer, M. Application of life-cycle assessment to early stage building design for reduced embodied environmental impacts. Build. Environ. 2013, 60, 81–92. [Google Scholar] [CrossRef]
  15. Kovacic, I.; Zoller, V. Building life cycle optimization tools for early design phases. Energy 2015, 92, 409–419. [Google Scholar] [CrossRef]
  16. Asdrubail, F.; Baldassarri, C.; Fthenakis, V. Life cycle analysis in the construction sector: Guiding the optimization of conventional Italian buildings. Energy Build. 2013, 64, 73–89. [Google Scholar] [CrossRef]
  17. The American Institute of Architects (AIA). AIA Guide to Building Life Cycle Assessment in Practice; AIA: Washington, DC, USA, 2010. [Google Scholar]
  18. Haapio, A.; Viitaniemi, P. A critical review of building environmental assessment tools. Environ. Impact Assess. Rev. 2008, 28, 469–482. [Google Scholar] [CrossRef]
  19. Srinivasan, R.S.; Ingwersen, W.; Trucco, C.; Ries, R.; Campbell, D. Comparison of energy-based indicators used in life cycle assessment tools for buildings. Build. Environ. 2014, 79, 138–151. [Google Scholar] [CrossRef]
  20. Roh, S.; Tae, S.; Shin, S.; Woo, J. Development of an optimum design program (SUSB-OPTIMUM) for the life cycle CO2 assessment of an apartment house in Korea. Build. Environ. 2014, 73, 40–54. [Google Scholar] [CrossRef]
  21. Tsai, W.; Lin, S.; Liu, J.; Lin, W.; Lee, K. Incorporating life cycle assessments into building project decision-making: An energy consumption and CO2 emission perspective. Energy 2011, 36, 3022–3029. [Google Scholar] [CrossRef]
  22. Castellano, J.; Castellano, D.; Ribera, A.; Ciurana, J. Developing a simplified methodology to calculate CO2/m2 emissions per year in the use phase of newly-built, single-family houses. Energy Build. 2015, 109, 90–107. [Google Scholar] [CrossRef]
  23. Islam, H.; Jollands, M.; Setunge, S. Life cycle assessment and life cycle cost implication of residential buildings—A review. Renew. Sustain. Energy Rev. 2015, 42, 129–140. [Google Scholar] [CrossRef]
  24. Alshamrani, O.S.; Galal, K.; Alkass, S. Integrated LCA-LEED sustainability assessment model for structure and envelope systems of school buildings. Energy Build. 2014, 80, 61–70. [Google Scholar] [CrossRef]
  25. BRE. Envest2 and IMPACT. Available online: http://www.bre.co.uk/page.jsp?id=2181 (accessed on 8 May 2016).
  26. Lee, K.; Tae, S.; Shin, S. Development of a life cycle assessment program for building (SUSB-LCA) in South Korea. Renew. Sustain. Energy Rev. 2009, 13, 1994–2002. [Google Scholar] [CrossRef]
  27. Jeong, Y.S.; Choi, G.S.; Kang, J.S.; Lee, S.E. Development of Life Cycle Assessment Program (K-LCA) for Estimating Environmental Load of Buildings. Archit. Inst. Korea 2008, 24, 259–266. [Google Scholar]
  28. Roh, S.; Tae, S.; Shin, S. Development of building materials embodied greenhouse gases assessment criteria and system (BEGAS) in the newly revised Korea Green Building Certification System (G-SEED). Renew. Sustain. Energy Rev. 2014, 35, 410–421. [Google Scholar] [CrossRef]
  29. Roh, S.; Tae, S.; Suk, S.J.; Ford, G.; Shin, S. Development of a building life cycle carbon emissions assessment program (BEGAS 2.0) for Korea’s green building index certification system. Renew. Sustain. Energy Rev. 2016, 53, 954–965. [Google Scholar] [CrossRef]
  30. Luo, Z.; Yang, L.; Liu, J. Embodied carbon emissions of office building: A case study of China’s 78 office buildings. Build. Environ. 2016, 95, 365–371. [Google Scholar] [CrossRef]
  31. Dong, Y.H.; Ng, S.T. A life cycle assessment model for evaluating the environmental impacts of building construction in Hong Kong. Build. Environ. 2015, 89, 183–191. [Google Scholar] [CrossRef]
  32. Radhi, H.; Sharples, S. Global warming implications of facade parameters: A life cycle assessment of residential buildings in Bahrain. Environ. Impact Assess. Rev. 2013, 38, 99–108. [Google Scholar]
  33. Taborianski, V.M.; Prado, R.T.A. Methodology of CO2 emission evaluation in the life cycle of office building façades. Environ. Impact Assess. Rev. 2012, 33, 41–47. [Google Scholar] [CrossRef] [Green Version]
  34. Jang, M.; Hong, T.; Ji, C. Hybrid LCA model for assessing the embodied environmental impacts of buildings in South Korea. Environ. Impact Assess. Rev. 2015, 50, 143–155. [Google Scholar] [CrossRef]
  35. Kim, C.J.; Kim, J.; Hong, T.; Koo, C.; Jeong, K.; Park, H.S. A program-level management system for the life cycle environmental and economic assessment of complex building projects. Environ. Impact Assess. Rev. 2015, 54, 9–21. [Google Scholar] [CrossRef]
  36. Roh, S.; Tae, S.; Baek, C.; Shin, S.; Lee, J.; Lee, J.; An, J. The development of object-oriented building life cycle CO2 assessment system (LOCAS). Archit. Inst. Korea 2012, 28, 101–108. [Google Scholar]
  37. Baek, C.; Park, S.H.; Suzuki, M.; Lee, S.H. Life cycle carbon dioxide assessment tool for buildings in the schematic design phase. Energy Build. 2013, 61, 175–187. [Google Scholar] [CrossRef]
  38. Tae, S.; Shin, S. Current work and future trends for sustainable buildings in South Korea. Renew. Sustain. Energy Rev. 2009, 13, 1910–1921. [Google Scholar] [CrossRef]
  39. ISO. ISO 21931-1: Sustainability in Building Construction—Framework for Methods of Assessment of the Environmental Performance of Construction Works—Part 1: Buildings; ISO: Geneva, Switzerland, 2010. [Google Scholar]
  40. Sharma, A.; Saxena, A.; Sethi, M.; Shree, V. Life cycle assessment of buildings: A review. Renew. Sustain. Energy Rev. 2011, 15, 871–875. [Google Scholar] [CrossRef]
  41. Tae, S.; Baek, C.; Shin, S. Life cycle CO2 evaluation on reinforced concrete structures with high-strength concrete. Environ. Impact Assess. Rev. 2011, 31, 253–260. [Google Scholar] [CrossRef]
  42. Tae, S.; Shin, S.; Woo, J.; Roh, S. The development of apartment house life cycle CO2 simple assessment system using standard apartment houses of South Korea. Renew. Sustain. Energy Rev. 2011, 15, 1454–1467. [Google Scholar] [CrossRef]
  43. Kim, J.; Koo, C.; Kim, C.; Hong, T.; Park, H. Integrated CO2, cost, and schedule management system for building construction projects using the earned value management theory. J. Clean. Prod. 2015, 103, 275–285. [Google Scholar] [CrossRef]
  44. Huedo, P.; Mulet, E.; Lopez-Mesa, B. A model for the sustainable selection of building envelope assemblies. Environ. Impact Assess. Rev. 2016, 57, 63–77. [Google Scholar] [CrossRef]
  45. Korea Environmental Industry & Technology Institute (KEITI). Korea Carbon Emission Factor. 2010. Available online: http://www.edp.or.kr/lci/co2.asp (accessed on 8 May 2016). (In Korean)
  46. Korea Environmental Industry & Technology Institute (KEITI). Korea Life Cycle Inventory Database. 2004. Available online: http://www.edp.or.kr/lci/lci_db.asp (accessed on 8 May 2016). (In Korean)
  47. Park, J.; Tae, S.; Kim, T. Life cycle CO2 assessment of concrete by compressive strength on construction site in Korea. Renew. Sustain. Energy Rev. 2012, 16, 2490–2496. [Google Scholar] [CrossRef]
  48. Kim, T.; Tae, S.; Roh, S. Assessment of the CO2 emission and cost reduction performance of a low-carbon-emission concrete mix design using an optimal mix design system. Renew. Sustain. Energy Rev. 2013, 25, 729–741. [Google Scholar] [CrossRef]
  49. Ministry of Trade, Industry and Energy (MOTIE): South Korea. In 2014 Energy Consumption Survey; Ministry of Trade, Industry and Energy: Sejong, Korea, 2015. (In Korean)
  50. Korea Energy Management Corporation (KEMCO). South Korea Building Energy Efficiency Rating System. 2010. Available online: http://www.kemco.or.kr/building/v2/buil_cert/buil_cert_4_1.asp (accessed on 8 May 2016). (In Korean)
  51. IPCC. IPCC Guidelines for National Greenhouse Gas Inventories; IPCC: Geneva, Switzerland, 2006. [Google Scholar]
  52. Korea Power Exchange (KPX). CO2 Emissions Factors for Electricity. 2013. Available online: http://www.kpx.or.kr/KOREAN/htdocs/popup/pop_1224.html (accessed on 8 May 2016). (In Korean)
  53. Korea District Heating Corporation (KDHC). CO2 Emissions Factors for District Heating. 2013. Available online: http://www.kdhc.co.kr/content.do?sgrp=S10&siteCmsCd=CM3650&topCmsCd=CM3655&cmsCd=CM4018&pnum=1&cnum=9 (accessed on 8 May 2016). (In Korean)
  54. Korea Institute of Civil Engineering and Building Technology (KICT). Standard Estimating System of the Construction Work; Korea Institute of Civil Engineering and Building Technology: Goyang, Korea, 2014. (In Korean) [Google Scholar]
  55. Korea Institute of Civil Engineering and Building Technology (KICT). Standard of Estimate for Construction; Korea Institute of Civil Engineering and Building Technology: Goyang, Korea, 2014. (In Korean) [Google Scholar]
  56. Korea Legislation Research Institute (KLRI). Korea Corporate Tax Act: Korea Ministry of Strategy and Finance. Available online: http://elaw.klri.re.kr/kor_service/lawView.do?hseq=28577&lang=ENG (accessed on 8 May 2016).
Figure 1. Framework of the simplification of building LCCO2 emissions assessment.
Sustainability 08 00567 g001
Figure 2. Assessment criteria of building elements.
Sustainability 08 00567 g002
Figure 3. Interface of the basic information.
Sustainability 08 00567 g003
Figure 4. Interface of the construction stage.
Sustainability 08 00567 g004
Figure 5. Interface of the operation stage.
Sustainability 08 00567 g005
Figure 6. Interface of the end-of-life stage.
Sustainability 08 00567 g006
Figure 7. Interface of the assessment result.
Sustainability 08 00567 g007
Figure 8. Assessment results.
Sustainability 08 00567 g008
Figure 9. Assessment results for each residential building.
Sustainability 08 00567 g009
Figure 10. Assessment results for each annexed building.
Sustainability 08 00567 g010
Figure 11. Assessment results for each underground parking lot.
Sustainability 08 00567 g011
Figure 12. Assessment results by the annual reduction rate of operational energy effectiveness.
Sustainability 08 00567 g012
Table 1. Average supply quantities of structural materials per unit area.
Building SectionStructure TypeStructure FormPlane TypeStructural Material
Ready-Mixed Concrete (m3/m2)Rebar (kg/m2)Steel Frame (kg/m2)
Residential buildingRC 1WallFlat-type0.6660.00-
Tower-type0.5962.20-
Mixed-type0.6361.10-
ColumnFlat-type0.6563.52-
Tower-type0.5775.56-
Mixed-type0.6169.54-
Flat slabFlat-type0.6282.34-
Tower-type0.5677.50-
Mixed-type0.5879.92-
SRC 2ColumnFlat-type0.3537.6774.98
Tower-type0.3229.0174.98
Mixed-type0.3333.3474.98
Office buildingSRCWall-0.4663.0059.07
Curtain wall-0.3041.5859.07
Annexed buildingRCWall-0.7487.00-
Underground parking lotRCColumn-1.46157.00-
1 RC: Reinforced concrete; 2 SRC: Steel framed reinforced concrete.
Table 2. Modification factors of the ready-mixed concrete.
Strength (MPa)Reduction Ratio (%)Modification Factor
21-1.000
24-1.000
274.770.952
309.700.903
3516.840.852
4022.610.774
5030.080.699
6032.110.679
Table 3. CO2 emissions factors of concrete.
Strength (MPa)Admixture MaterialMixture Composition (%)CO2 Emissions Factor (kg-CO2/m3)
Blast Furnace SlagFly-Ash
21---346.0
Blast furnace slag100328.5
200297.2
300266.0
400230.7
Fly-ash010328.3
020296.8
030265.3
040229.8
Blast furnace slag + Fly-ash1010297.0
1020265.5
1030234.0
2010265.7
2020234.2
3010234.5
27---364.0
Blast furnace slag100329.7
200294.1
300258.5
400226.7
Fly-ash010329.4
020293.6
030257.8
040225.6
Blast furnace slag + Fly-ash1010293.9
1020258.0
1030222.2
2010258.3
2020222.5
3010222.7
Table 4. Provisional perimeter formulas of a standard floor.
ClassificationFlat-TypeTower-Type
Types 2 and 4Types 3 and 4
Exterior materialExterior wallFront, back, and side walls on high floors ( 2 J + K + 2 ) A ( 3 J + 1 ) A
Front and back on low floors ( 2 J + K ) A ( 2 J + 1 ) A
Side wall on low floors 2 A J A
Interior materialInterior wallResidential exclusive area ( 4 J + K ) a ( 4 J + 1 ) a
Elevator hall/Staircase 4 K a 4 a
J: Number of units; K: Number of cores; A: Floor area; a: Exclusive area.
Table 5. CO2 emissions factors of finishing materials.
ClassificationElementFinishing MaterialUnitsCO2 Emissions Factor (kg-CO2/Unit)
Exterior materialExterior wallWater-based paintm20.36
Silicone-based paintm20.32
Stone coatm211.22
Granite with stone moldingm213.43
Tilem27.06
Window framePVC window framem25.91
Aluminum window framem27.57
Curtain wall window framem24.65
GlassPlate glassm29.86
Insulating glassm222.43
Tempered glassm213.35
Table 6. CO2 emissions factors of energy sources.
ClassificationCO2 Emissions FactorUnitSource
Kerosene2.441kg-CO2/ℓ2006 IPCC Guidelines for National Greenhouse Gas Inventory [51]
Medium quality heavy oil3.003kg-CO2/ℓ
Diesel2.580kg-CO2/ℓ
Gasoline2.080kg-CO2/ℓ
Propane2.889kg-CO2/kg
Gas2.200kg-CO2/Nm3
Electricity0.495kg-CO2/kWhKorea Power Exchange
District heating0.051kg-CO2/MJKorea District Heating Corporation
Table 7. Average energy consumption values of the apartment building components.
ClassificationKerosene (ℓ/year/m2)Medium Quality Heavy Oil (ℓ/year/m2)Propane (kg/year/m2)City Gas-Cooking (Nm3/year/m2)City Gas-Heating (Nm3/year/m2)Electricity (kWh/year/m2)Heat Energy (Mcal/year/m2)Hot Water (Mcal/year/m2)
Heating SystemHeat Source
Individual heatingPetroleum6.801-1.1890.008-30.785--
LPG--5.529--31.355--
Electricity0.045-1.3460.021-37.099--
City Gas--0.0131.1417.93435.287--
Central heatingOrdinary-2.5670.1811.0395.79333.458-0.587
Petroleum-10.4920.6490.567-29.277-0.484
City Gas--0.0301.1917.67034.813-0.621
District heatingOrdinary--0.0541.376-37.99094.3600.750
Table 8. Mileage of demolition and landfill equipment.
UsageEquipment Combination and DimensionsMileage (ℓ/ton)
DemolitionBackhoe (1.0 m3) + Giant Breaker (0.7 m3)3.642
Pavement Breakers (25-kg grade) 2 units + Air Compressor (3.5 m3/min)2.385
Backhoe (1.0 m3) + Hydraulic Breaker (1.0 m3) + Giant Breaker (0.7 m3)4.286
Backhoe (0.4 m3) + Breaker (0.4 m3)4.760
LandfillDozer (D8N, 15 PL, 6 PL) + Compactor (32 tons)0.150
Table 9. Architectural scheme of the analyzed building.
Project NameApartment Complex M
Zoning districtQuasi-residential areaSite area49,698.21m2
StructureReinforced concrete structureBuilding area16,320.20m2
Number of buildings13Landscape area22,203.20m2
Unit typeTypes 2, 4, and 6Gross areaAbove ground136,037.57m2
Plane typeFlat type, Tower typeUnderground72,355.21m2
Service life40 yearsTotal208,392.78m2
Heating systemLocal heatingBuilding-to-land ratio28.97%
Construction period25 monthsFloor area ratio239.14%
Table 10. Assessment conditions.
ClassificationB-SCATConventional Assessment Model
Construction stageBasic drawing and specificationBOQ
Default value (=18.44 kg-CO2/m2)
Operation stageEstimation model (local heating) (Reduction rate of operational energy effectiveness: 0%, 1%, 1.5%)
End-of-life stageDemolition processBackhoe (1.0 m3) + giant breaker (0.7 m3)
Transportation process20-ton dump truck (distance: 30 km)
Landfill processDozer (D8N, 15 PL, 6 PL) + compactor (32 tons)

