
A Study on Life Cycle CO2 Emissions of Low-Carbon Building in South Korea

Abstract
:1. Introduction
2. Literature Review
2.1. Previous Studies Regarding Environmental Impact Assessment on Buildings Using LCA
2.2. The Status of the Development of Low-Carbon Construction Materials
3. Research Methods
3.1. Research Scope and Method
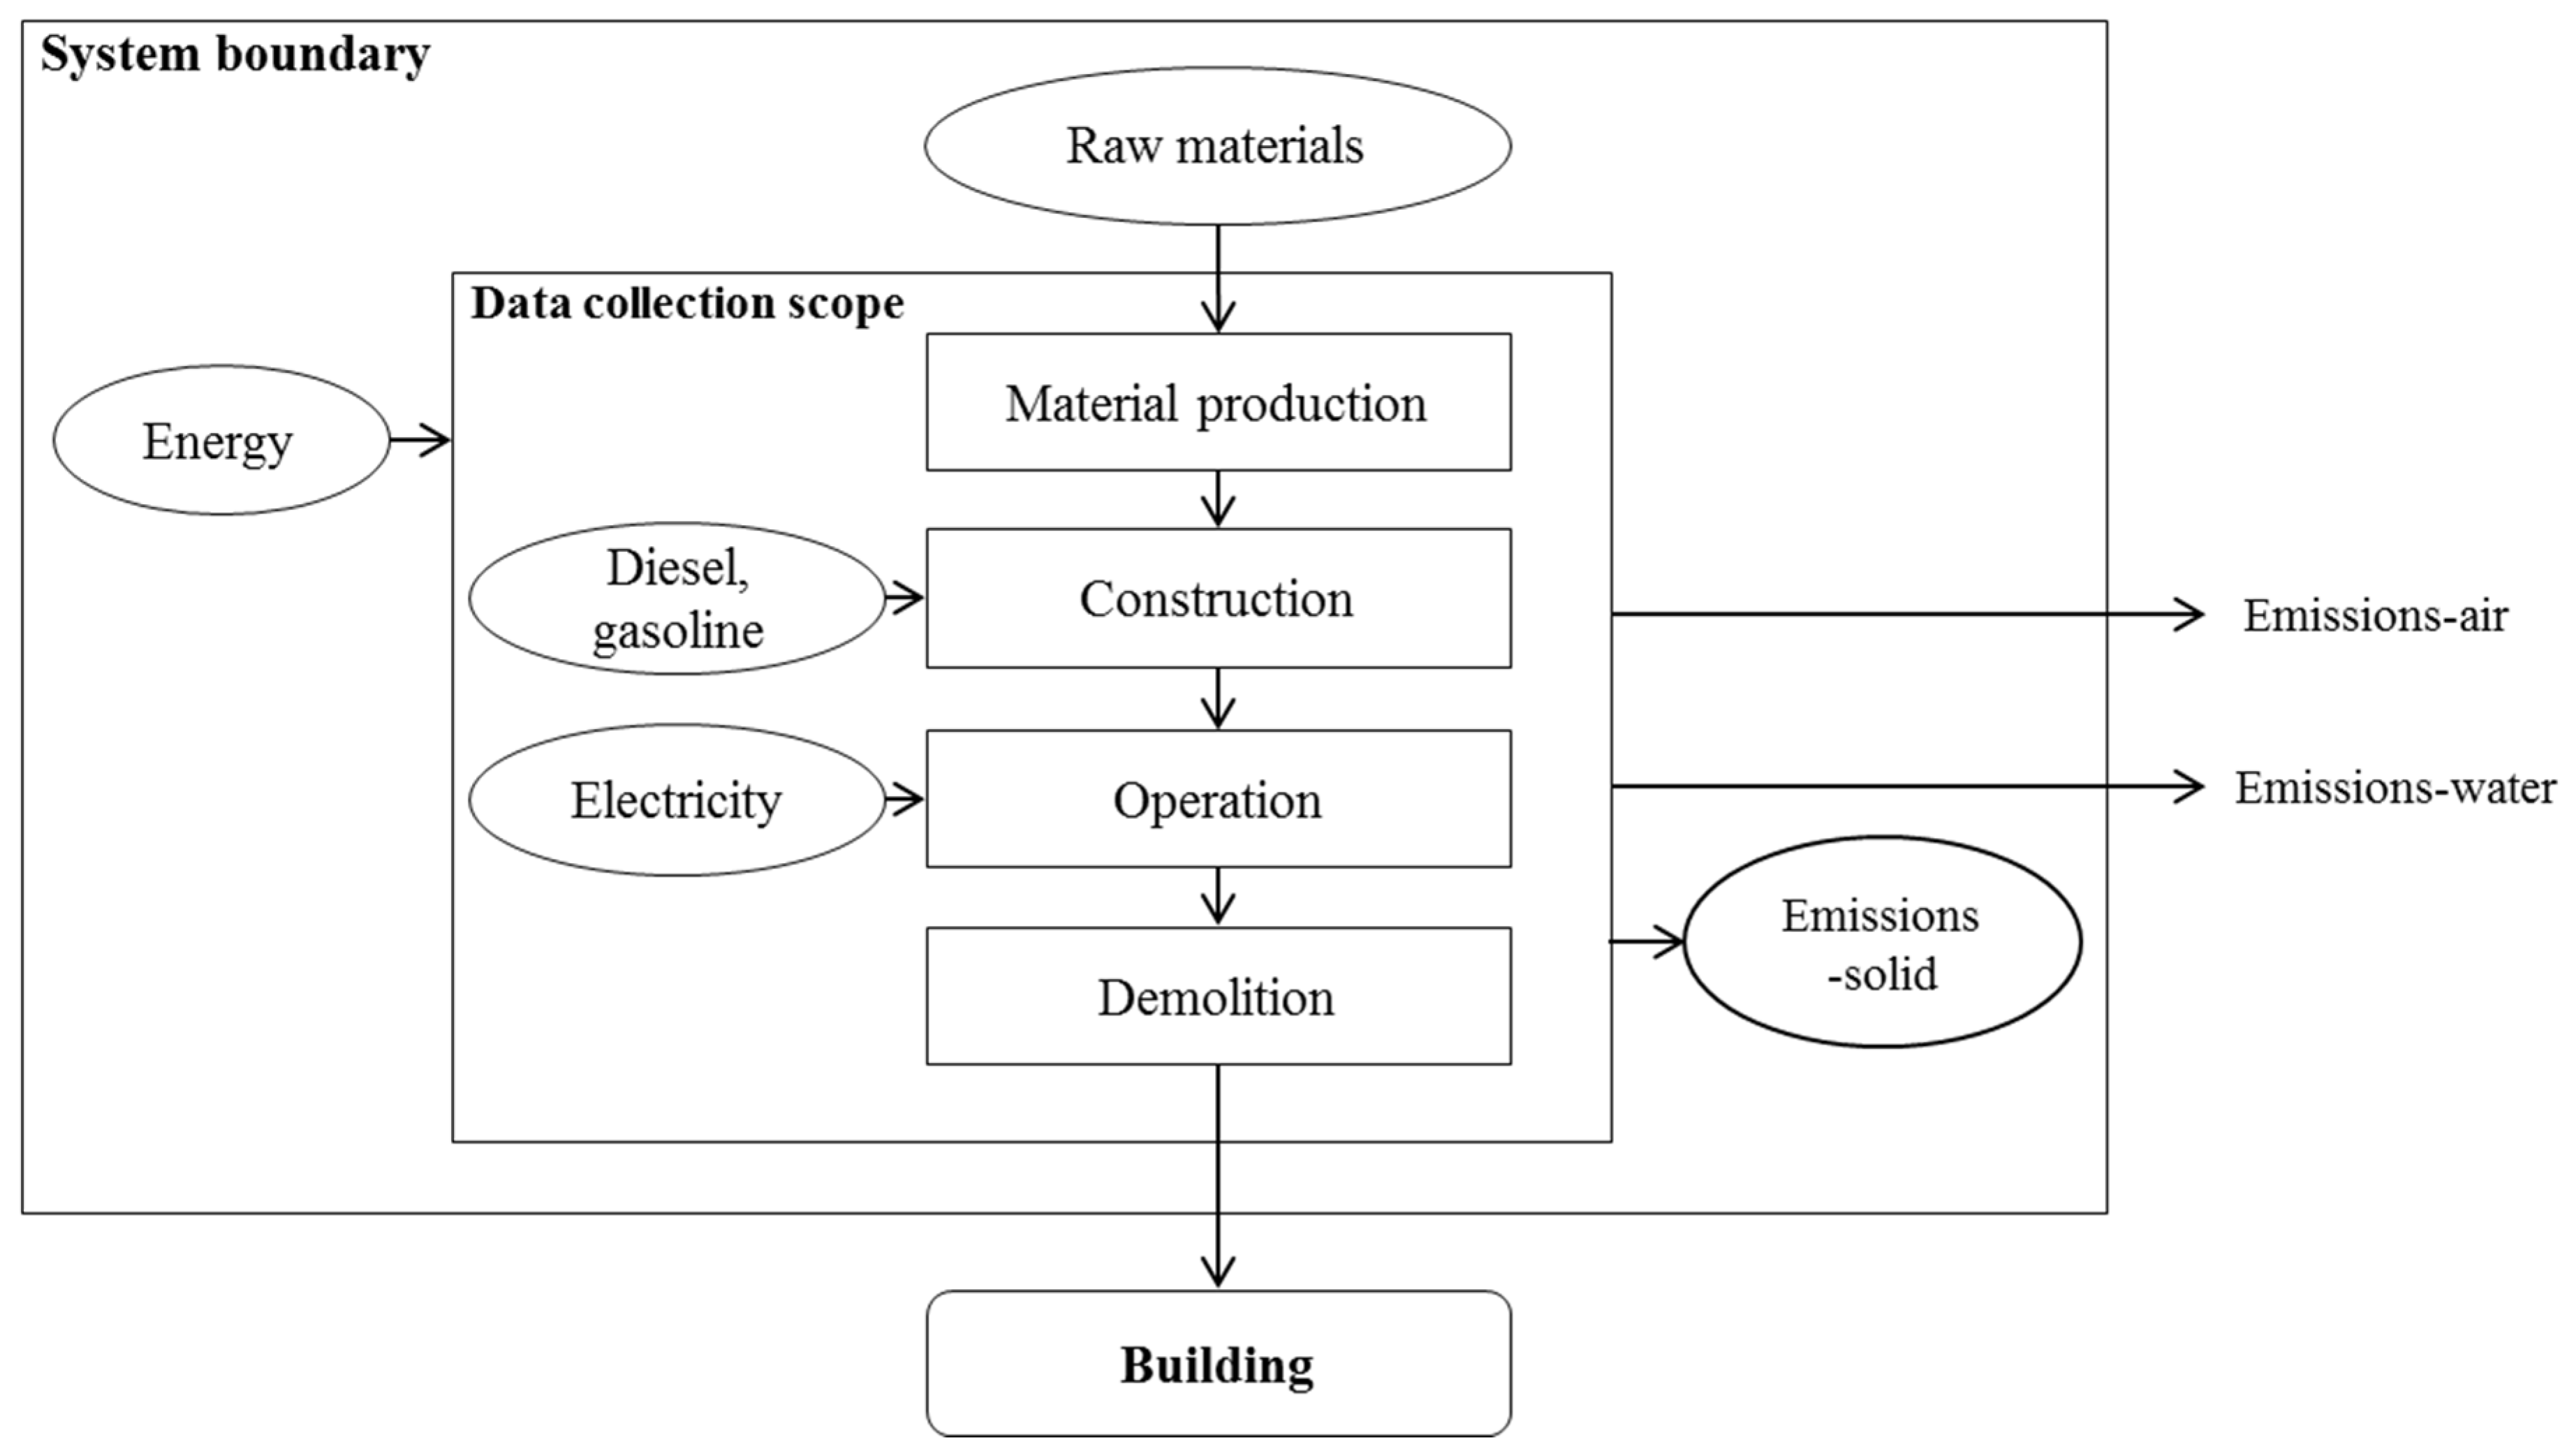
3.1.1. System Boundary
3.1.2. Environmental Load Assessment Plan by Life Cycle
3.2. Utilization of the LCI Database of the Construction Materials
3.3. Assumptions and Restrictions
4. LCCO2 Assessment of a Low-Carbon Building
4.1. Overview of LCA-Targeted Building
4.2. Material Production Phase
4.3. Construction Phase
4.4. Operation and Maintenance Phase
4.5. Demolition Phase
5. Results of Carbon Emissions by the Life Cycle Phase of Low-Carbon Buildings
5.1. Material Production Phase
5.2. Construction Phase
5.3. Operation and Maintenance Phase
5.4. Demolition Phase
5.5. The Results of the LCCO2 Assessment of the Low-Carbon Building
6. Discussion and Limitation
7. Conclusions
- (1)
- The carbon-reduction technologies for construction materials include: the reduction of resource consumption by using recycled materials or industrial byproducts (manufacture phase); the decrease in CO2 emissions by shortening the production processes or changing fuels; the decrease in resource consumption throughout the life of buildings by reducing the consumption of materials for repair with construction materials that reduce energy consumption and have a long lifespan (operation and maintenance phase).
- (2)
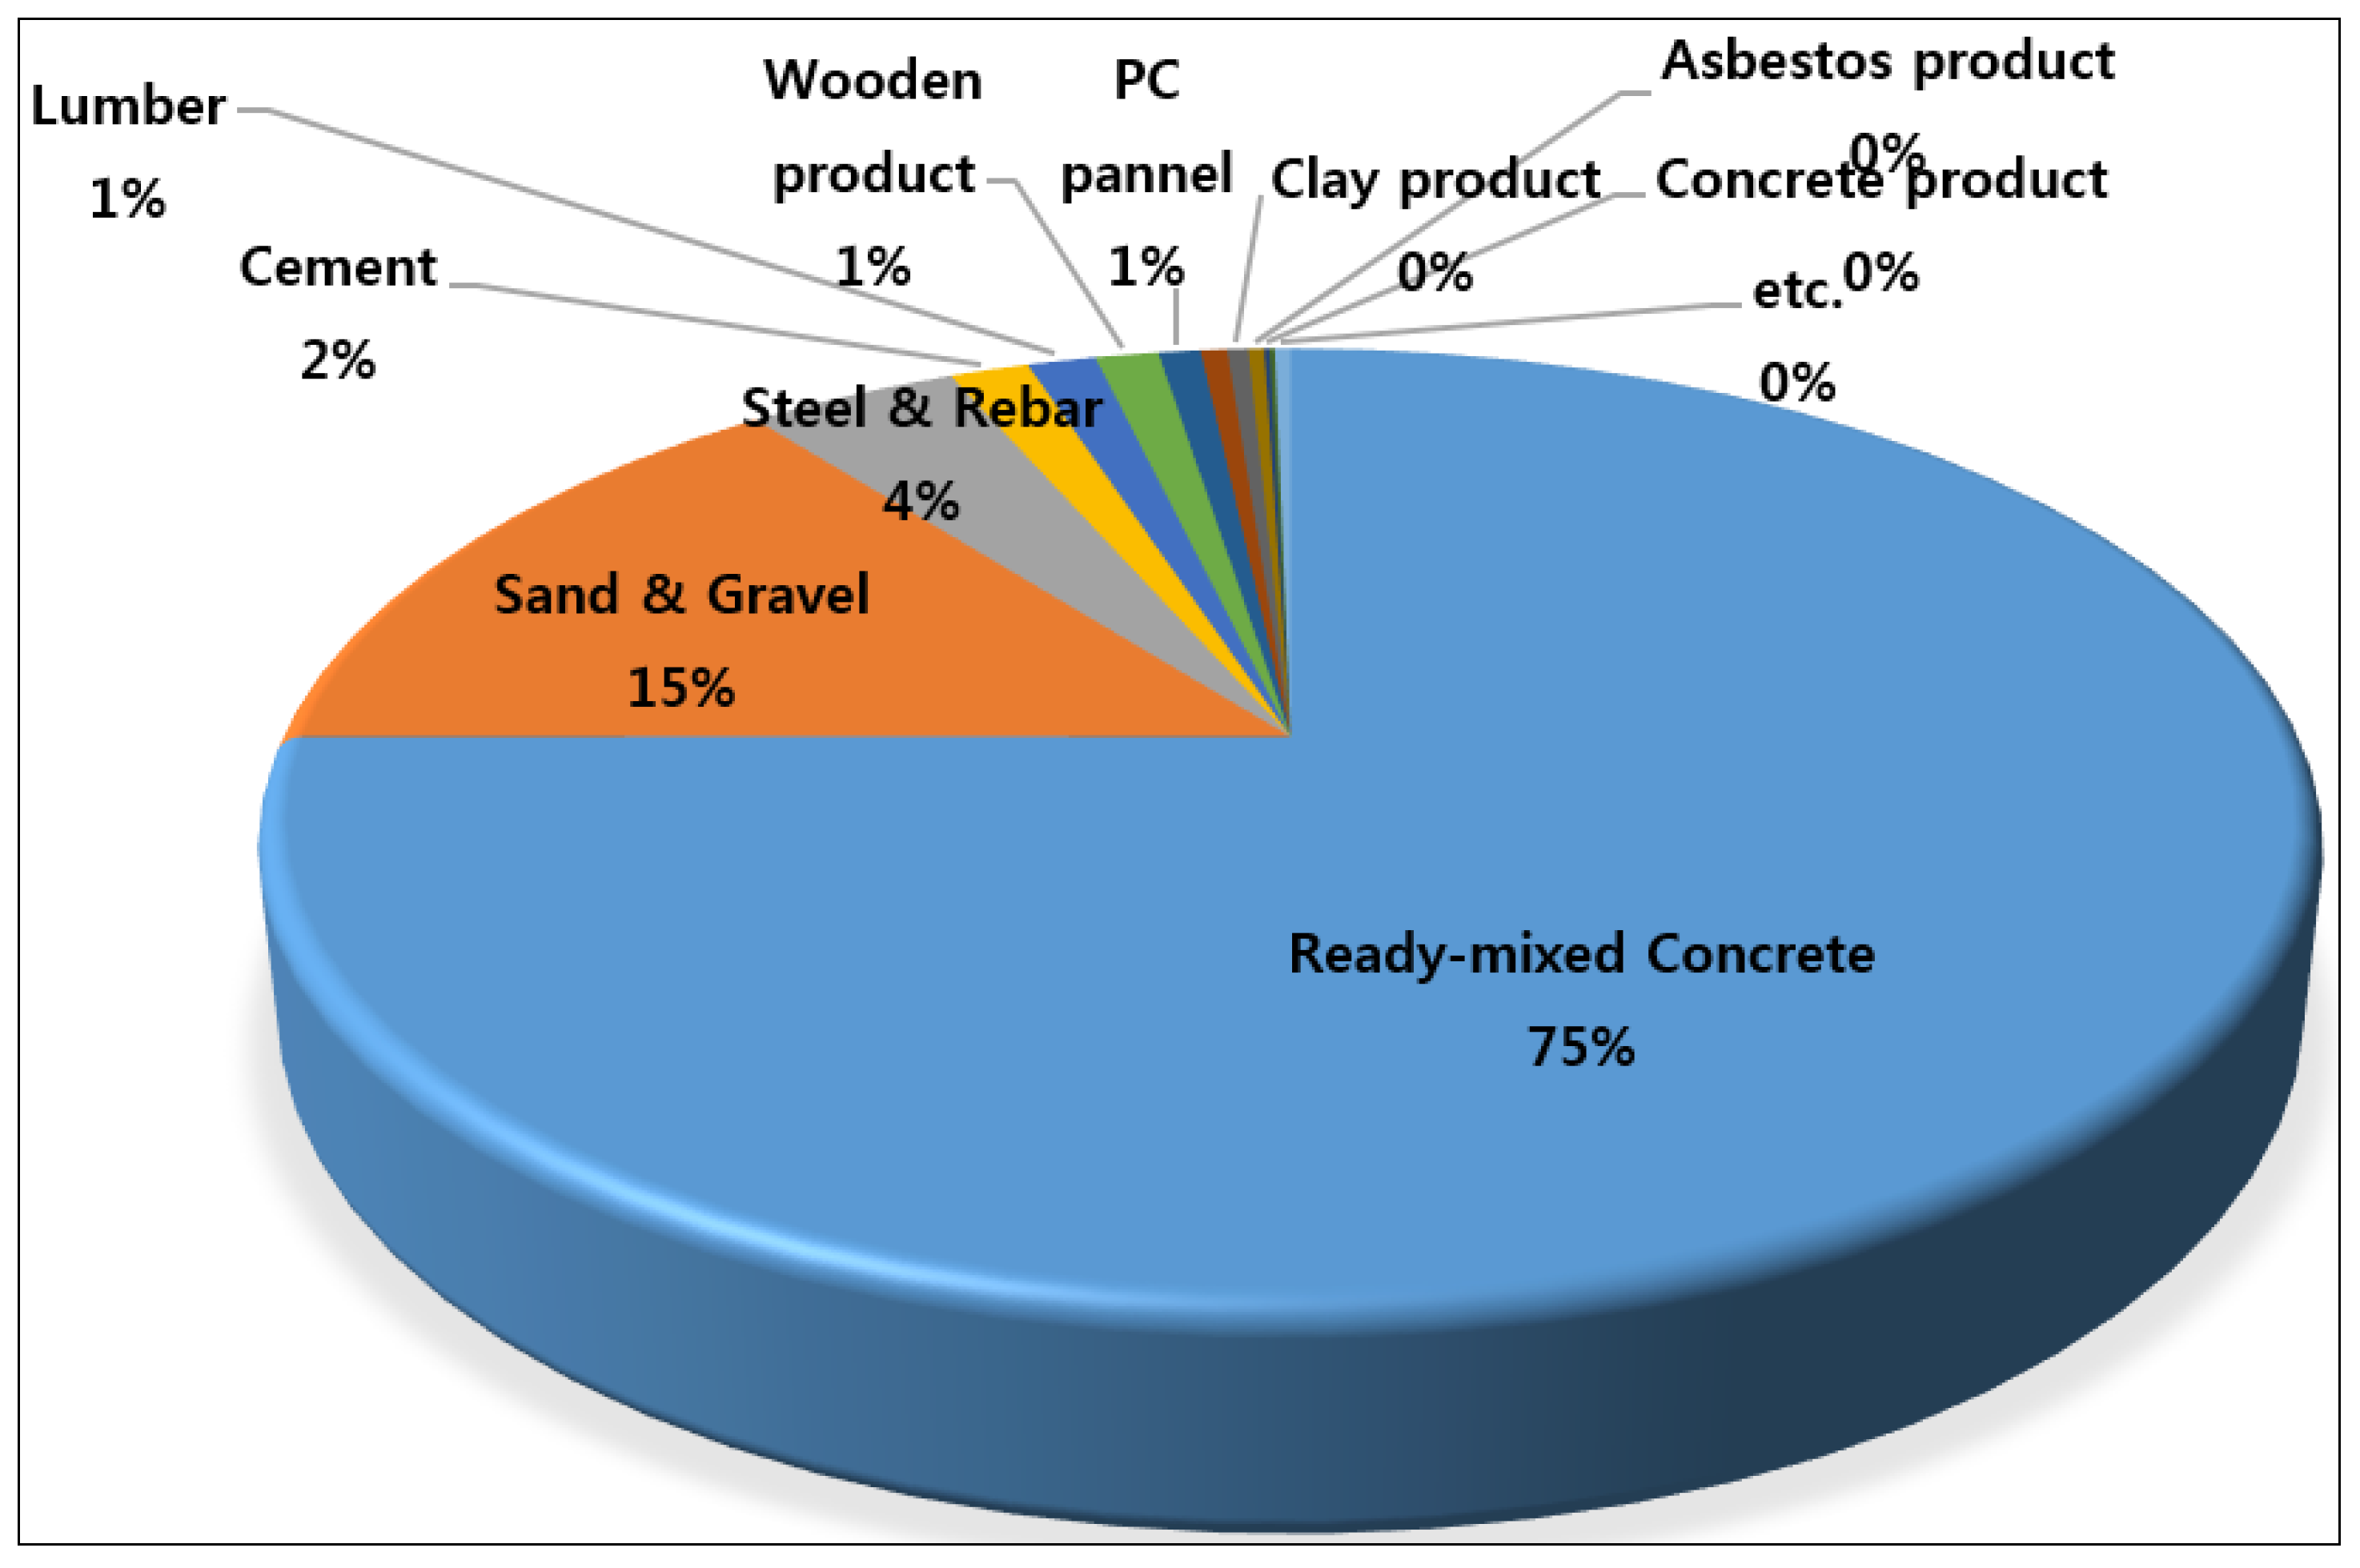
- A low-carbon building refers to one built with low-carbon construction materials and conventional ones. A total of 3115 tons of construction materials were added. Among them, those for a building frame (ex: ready-mixed concrete, sand and gravel, reinforcing bar, pipe, etc.) accounted for over 80%.
- (3)
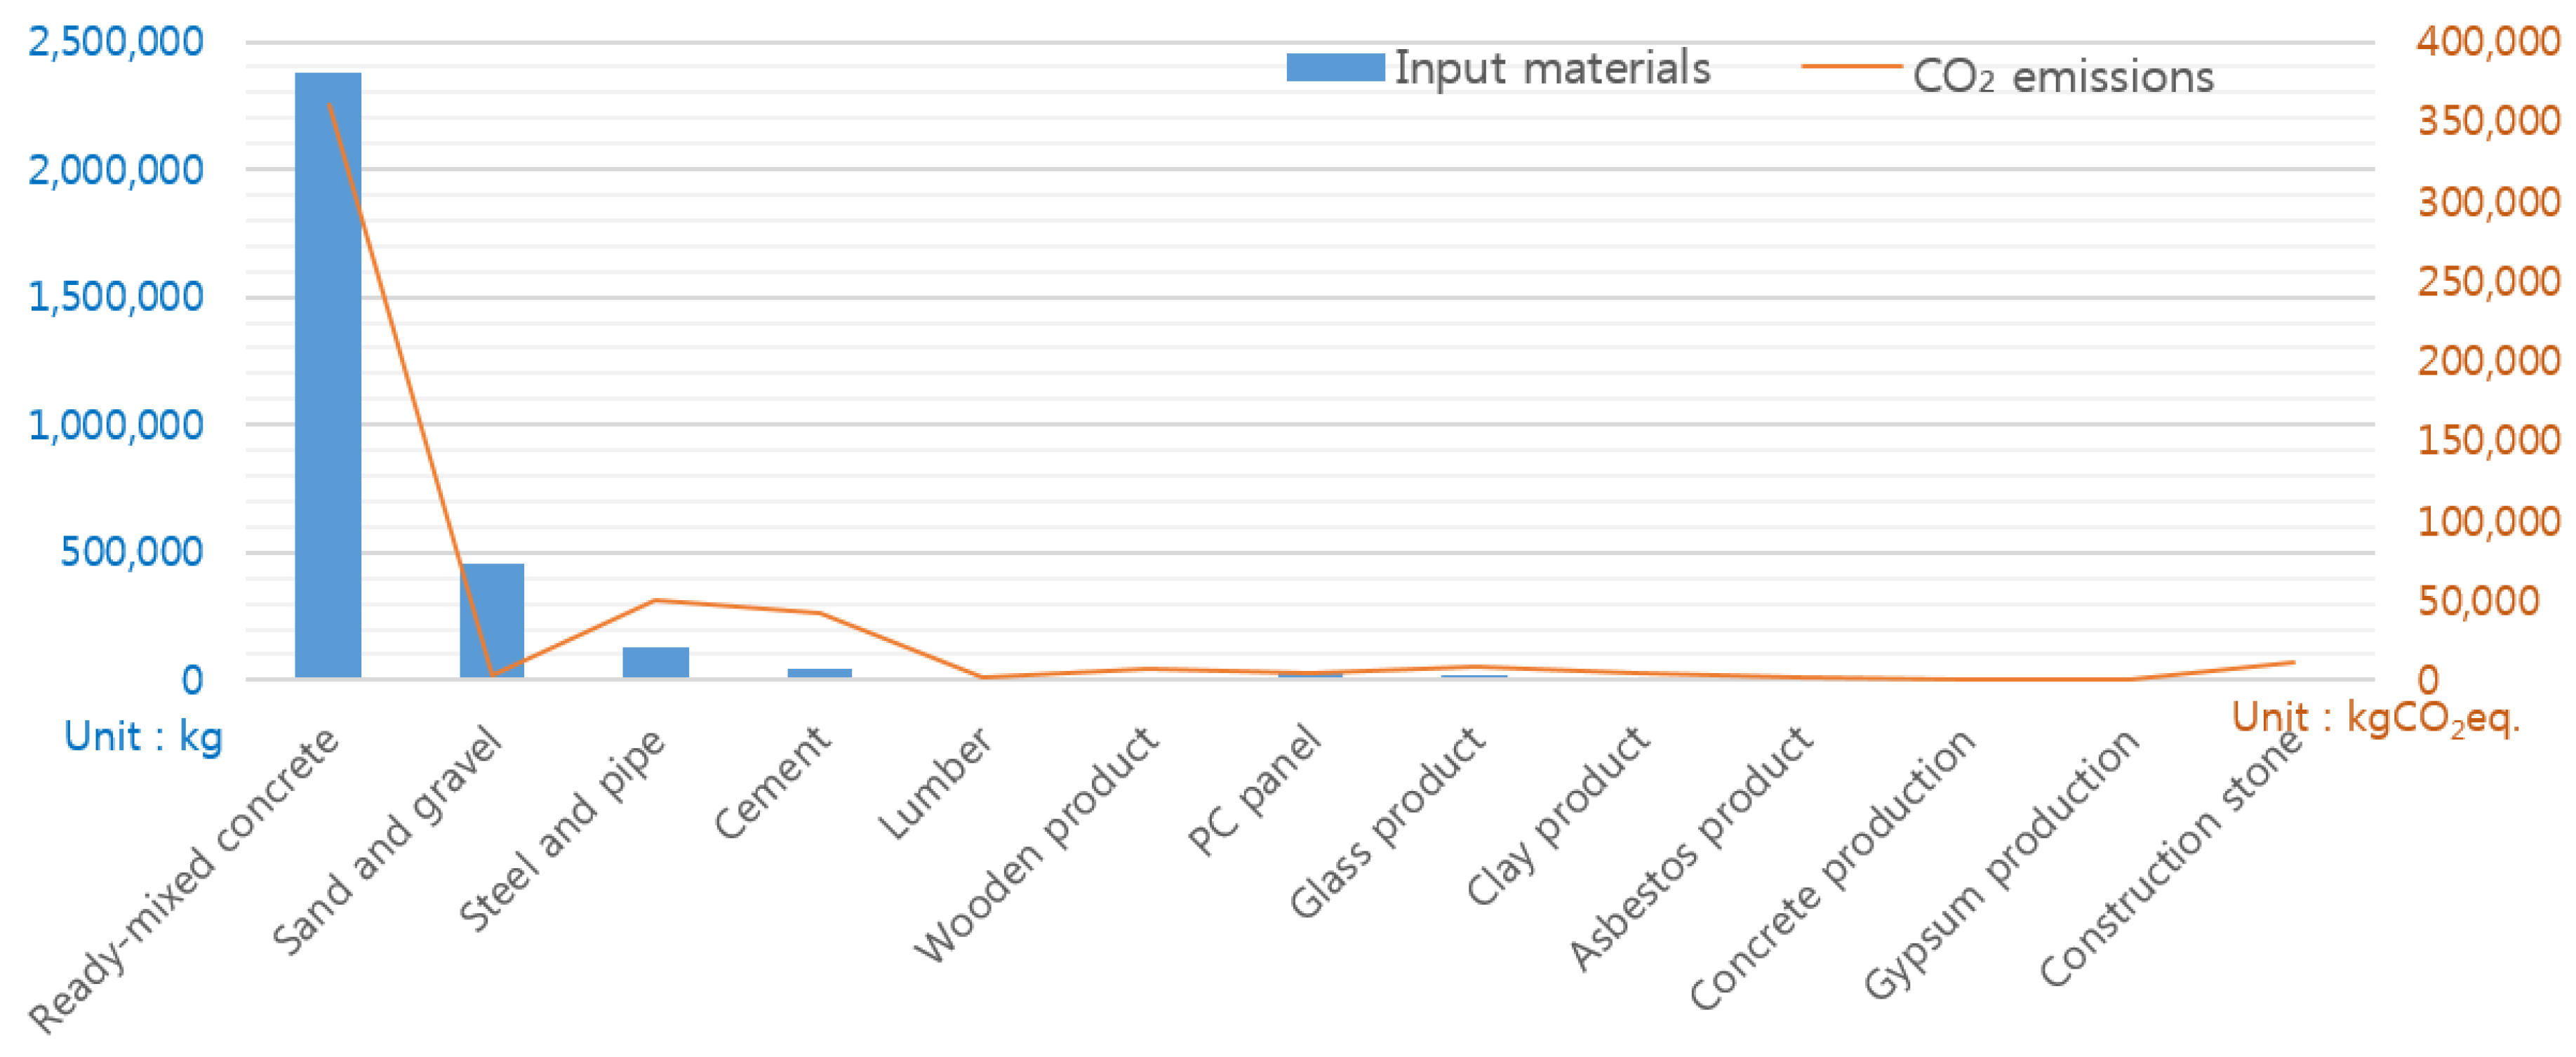
- According to the analysis on CO2 emissions by input material, ready-mixed concrete, wood, reinforcing bar and cement were the major sources of CO2 emissions. They accounted for 92.8% of total annual CO2 emissions.
- (4)
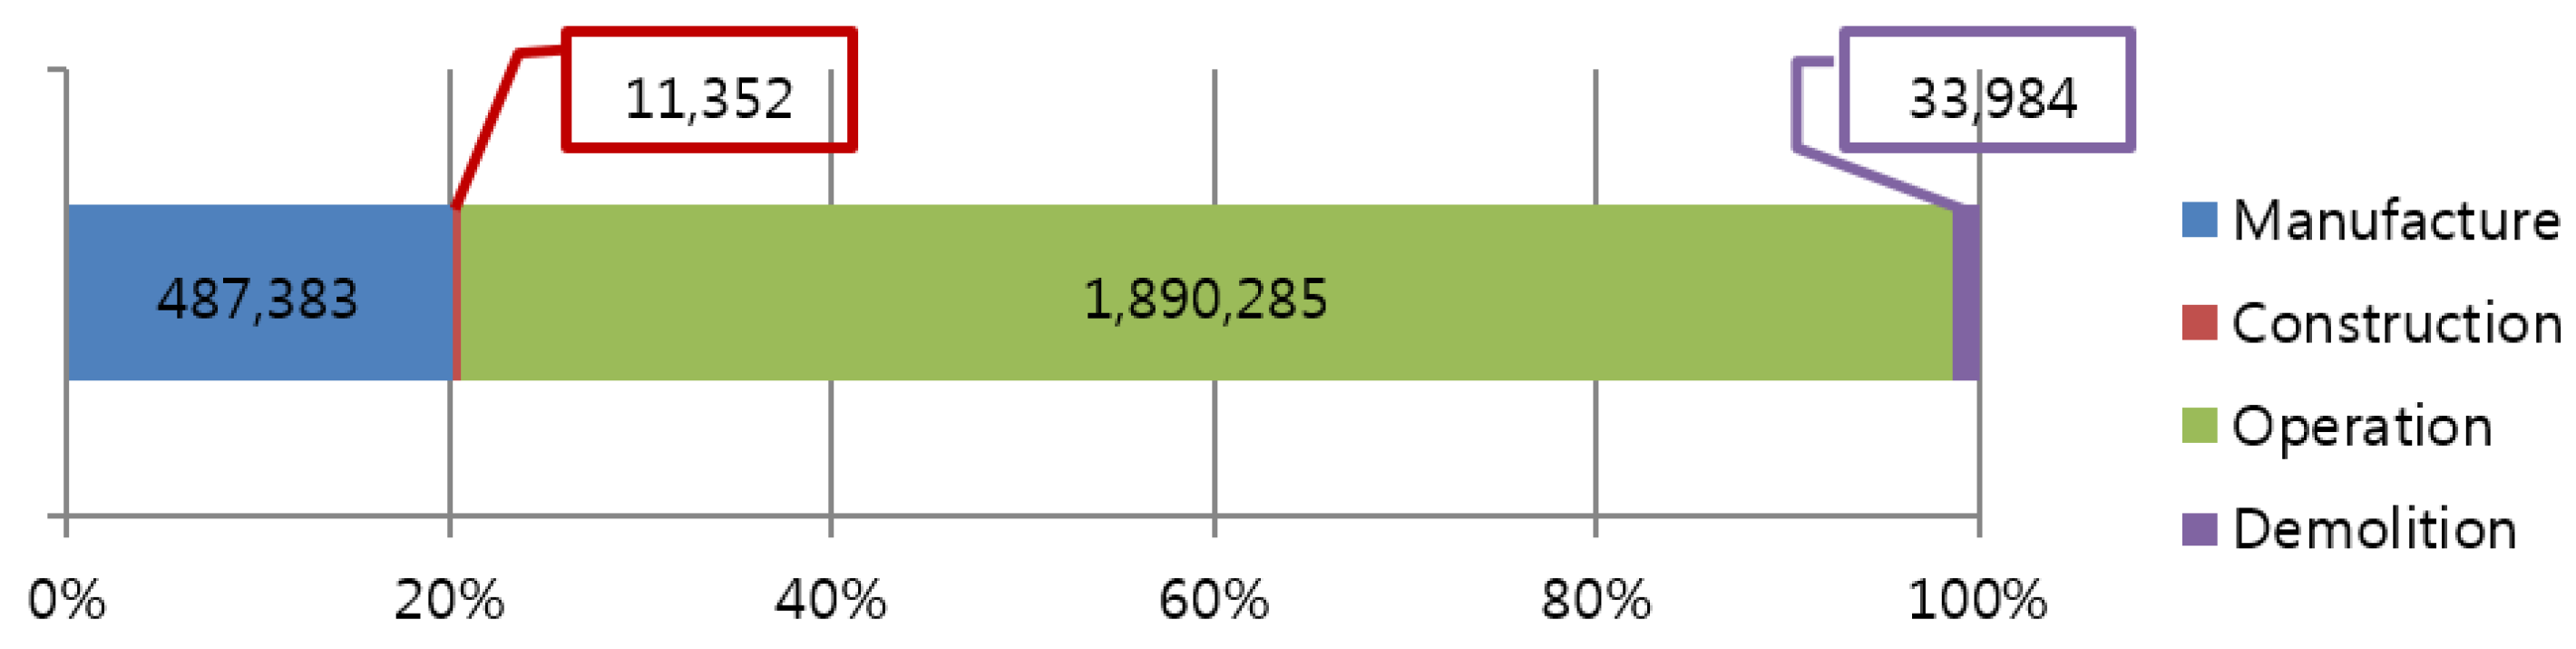
- Total CO2 emissions generated throughout the life (30 years) of low-carbon buildings are 2,423,004 kg CO2 eq. In terms of CO2 emissions by stage, the operation and maintenance phase (78.0%) was the highest, followed by the manufacture phase (20.1%), the demolition phase (1.4%) and the construction phase (0.5%). When compared to the studies (domestic papers) under simulation conditions [41], the results were similar to this study in terms of emission ratio in the order of operation stage (81.39%–86.45%), production stage (11.66%–15.85%), construction stage (1.49%–2.15%) and disposal stage (0.4%–0.61%). In overseas studies, as well [42], the operation stage (77%–85%) was the highest, followed by the production and construction stages (14%–21%) in terms of emission ratio. These results reveal that energy-saving and carbon emission reduction effects would increase during building maintenance.
- (5)
- Regarding LCCO2 emissions, carbon emissions were the highest in the manufacture of ready-mixed concrete for which heating energy, electricity and input materials were mostly used. This kind of result stems from the input of the materials for low-carbon concrete and energy-saving ones.
- (6)
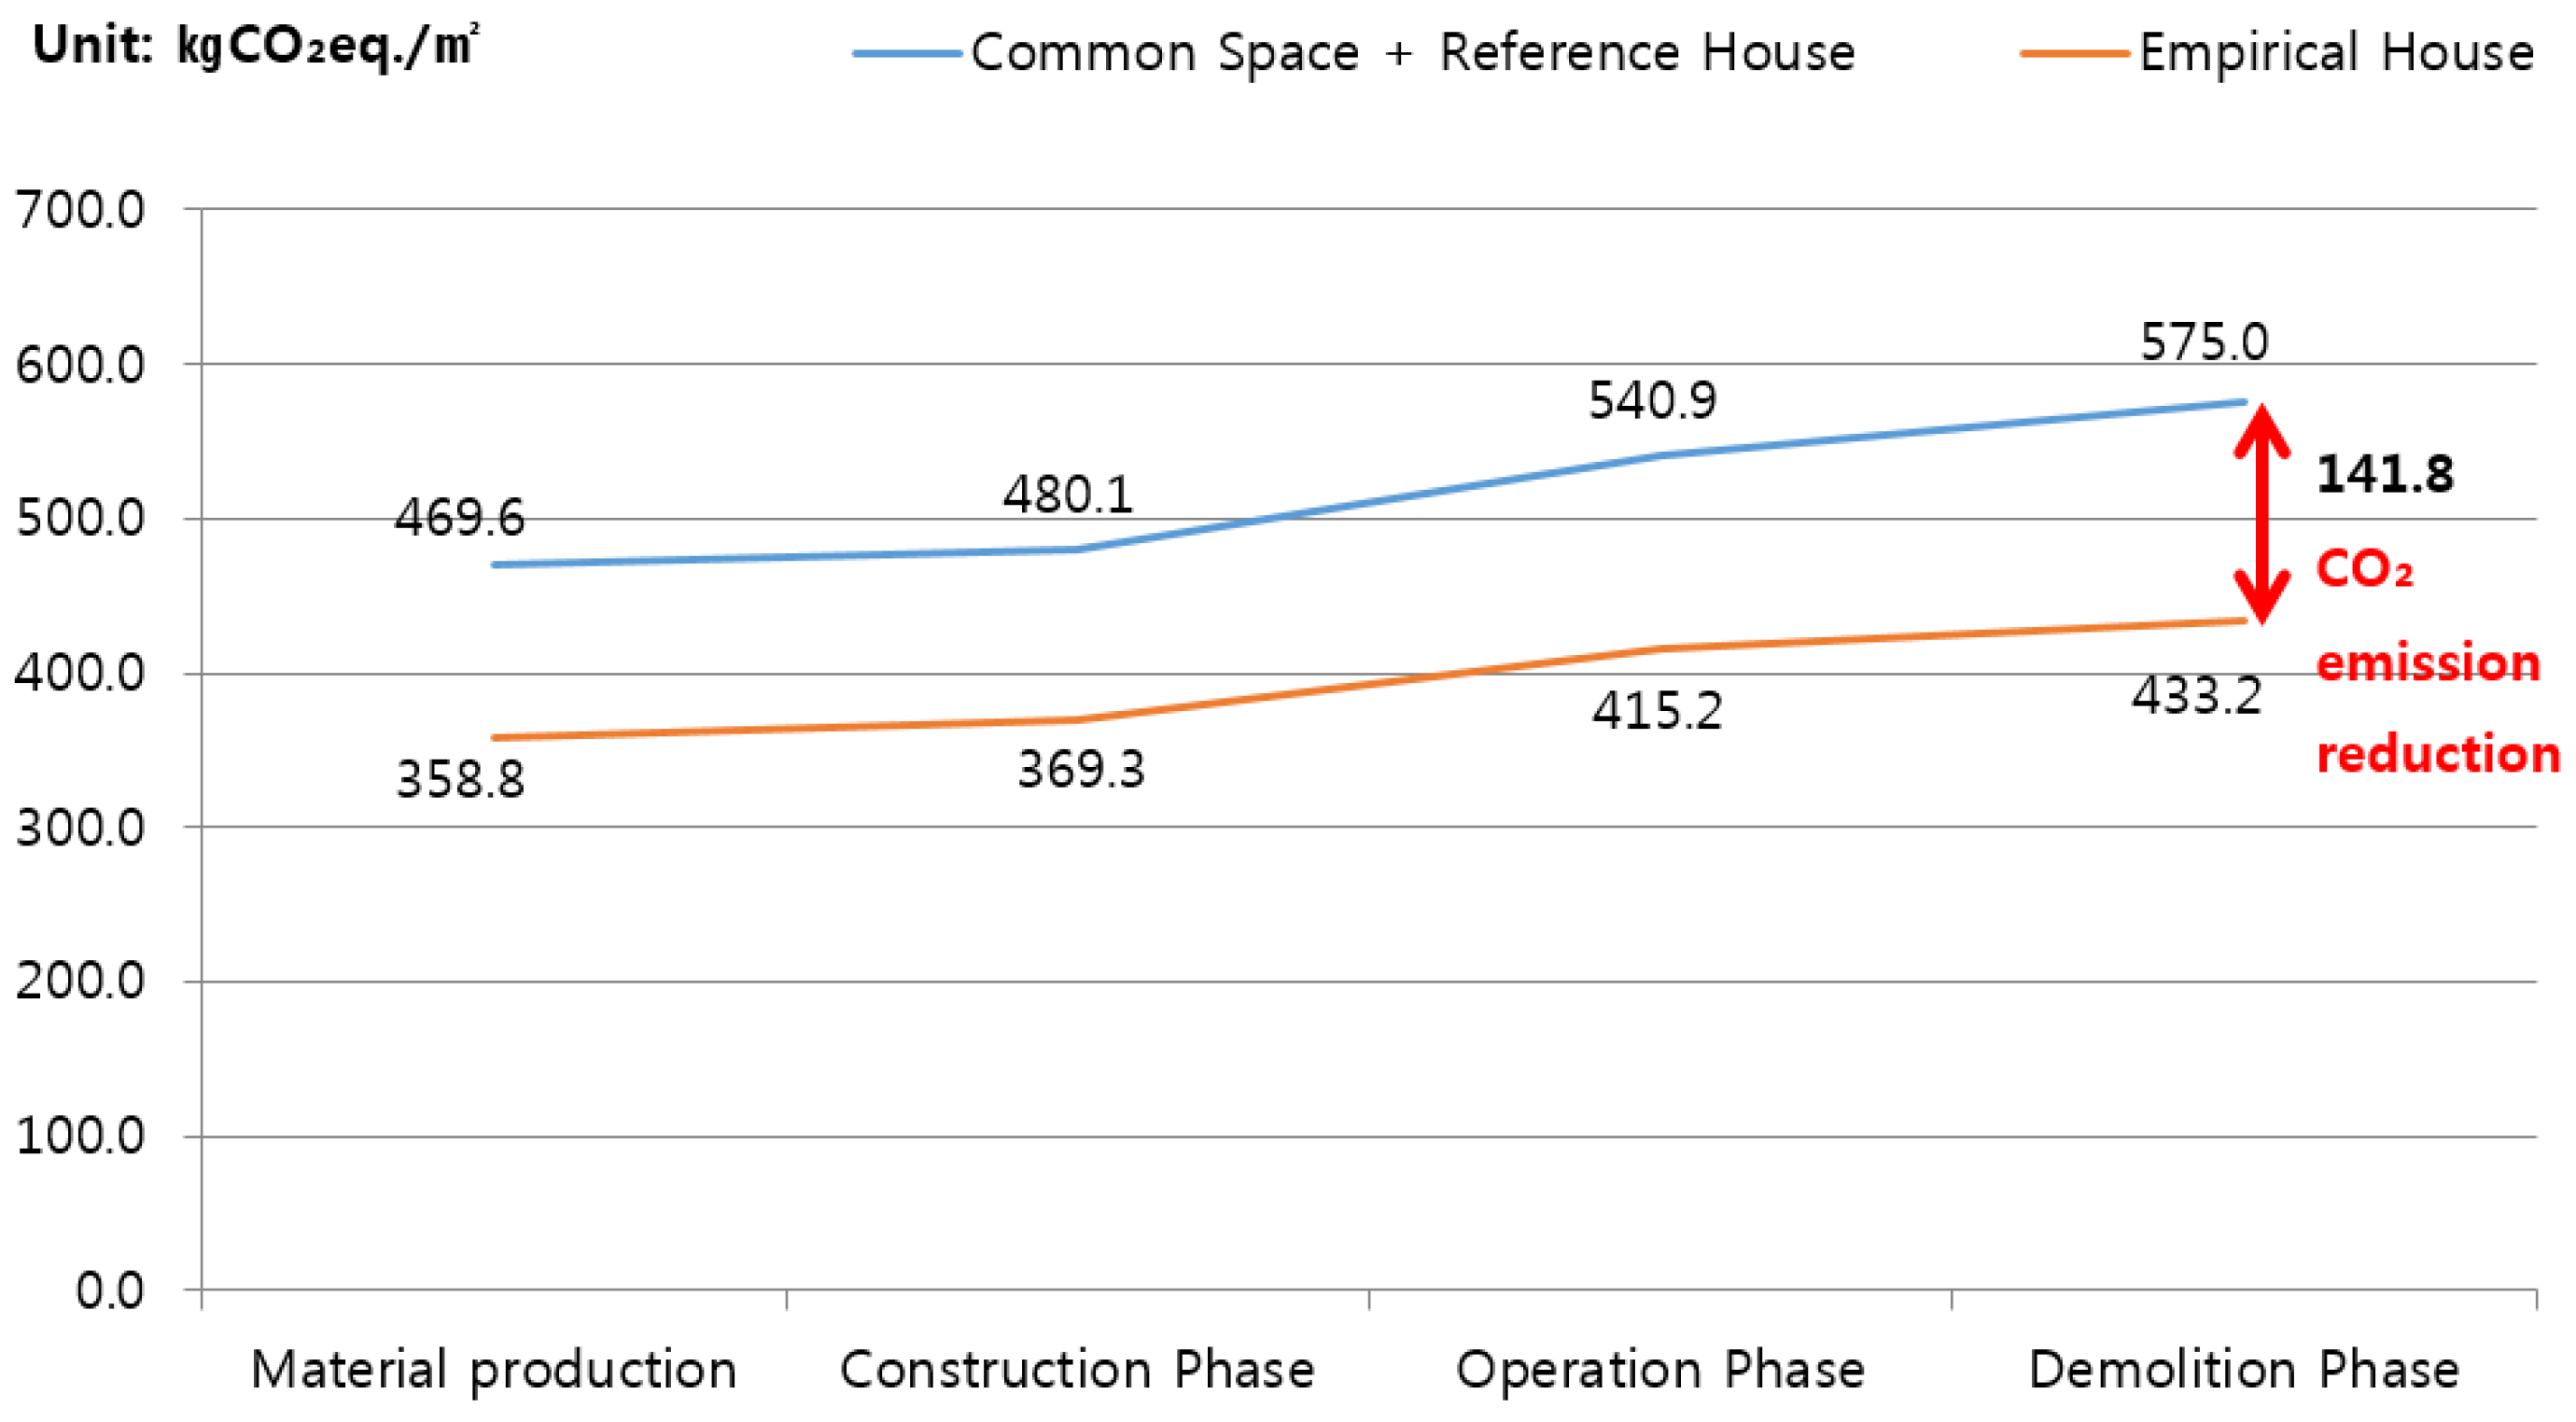
- Compared to common and reference areas, empirical houses reduced CO2 emissions by about 25% (141.8 kg CO2 eq./m2 per year).
- (7)
- To reduce CO2 emissions throughout the life of buildings, it is needed to consider the embodied energy of construction materials and embodied CO2 emissions at the construction material manufacture phase, as well as at the operation and maintenance phase. There should be an in-depth study on carbon-reduction of construction materials in empirical houses.
Acknowledgments
Author Contributions
Conflicts of Interest
References and Notes
- World Energy Outlook. International Energy Agency : Paris, France, 2015. Available online: http://www.worldenergyoutlook.org (accessed on 27 April 2016).
- Cho, S.H.; Chae, C.U. The Comparative Study on the Environmental Impact Assessment of Construction Material through the Application of Carbon Reducing Element-Focused on Global Warming Potential of Concrete Products-. Korea Inst. Ecol. Archit. Environ. 2015, 33, 149–156. [Google Scholar] [CrossRef]
- International Standard. ISO 14044: Life Cycle Assessment (Requirements and Guidelines); International Organization for Standardization: Geneva, Switzerland, 2006; Available online: http://www.iso.org/iso/home/store/catalogue_tc/catalogue_detail.htm?csnumber=38498 (accessed on 19 April 2016).
- Sartori, I.; Hestnes, A.G. Energy use in the life cycle of conventional and low-energy buildings: A review article. Energy Build. 2007, 39, 249–257. [Google Scholar] [CrossRef]
- Verbeeck, G.; Hens, H. Life cycle inventory of buildings: A contribution analysis. Build. Environ. 2010, 45, 964–967. [Google Scholar] [CrossRef]
- Wu, H.J.; Yuan, Z.W.; Zhang, L.; Bi, J. Life cycle energy consumption and CO2 emission of an office building in China. Int. J. Life Cycle Assess. 2012, 17, 105–118. [Google Scholar] [CrossRef]
- Asdrubali, F.; Baldassarri, C.; Fthenakis, V. Life Cycle Analysis in the construction sector: Guiding the optimization of conventional Italian buildings. Energy Build. 2013, 64, 73–89. [Google Scholar] [CrossRef]
- Wang, T.; Seo, S.W.; Liao, P.C.; Fang, D.P. GHG emission reduction performance of state-of-the-art green buildings: Review of two case studies. Renew. Sustain. Energy Rev. 2016, 56, 484–493. [Google Scholar] [CrossRef]
- Liu, T.; Wang, Q.; Su, B. A review of carbon labeling: Standards, implementation, and impact. Renew. Sustain. Energy Rev. 2016, 53, 68–79. [Google Scholar] [CrossRef]
- Rogers, J.G.; Cooper, S.J.G.; O’Grady, Á.; McManus, M.C.; Howard, H.R.; Hammond, G.P. The 20% house—An integrated assessment of options for reducing net carbon emissions from existing UK houses. Appl. Energy 2015, 138, 108–120. [Google Scholar] [CrossRef] [Green Version]
- Mahapatra, K. Energy use and CO2 emission of new residential buildings built under specific requirements —The case of Växjö municipality, Sweden. Appl. Energy 2015, 152, 31–38. [Google Scholar] [CrossRef]
- Wu, P.; Xia, B.; Zhao, X. The importance of use and end-of-life phases to the life cycle greenhouse gas (GHG) emissions of concrete—A review. Renew. Sustain. Energy Rev. 2014, 37, 360–369. [Google Scholar] [CrossRef]
- Charoenkit, S.; Kumar, S. Environmental sustainability assessment tools for low carbon and climate resilient low income housing settlements. Renew. Sustain. Energy Rev. 2014, 38, 509–525. [Google Scholar] [CrossRef]
- Ng, P.K.; Mithraratne, N. Lifetime performance of semi-transparent building-integrated photovoltaic (BIPV) glazing systems in the tropics. Renew. Sustain. Energy Rev. 2014, 31, 736–745. [Google Scholar] [CrossRef]
- Thakur, A.; Canter, C.E.; Kumar, A. Life-cycle energy and emission analysis of power generation from forest biomass. Appl. Energy 2014, 128, 246–253. [Google Scholar] [CrossRef]
- Schakel, W.; Meerman, H.; Talaei, A.; Ramírez, A.; Faaij, A. Comparative life cycle assessment of biomass co-firing plants with carbon capture and storage. Appl. Energy 2014, 131, 441–467. [Google Scholar] [CrossRef]
- Amponsah, N.Y.; Troldborg, M.; Kington, B.; Aalders, I.; Hough, R.L. Greenhouse gas emissions from renewable energy sources—A review of lifecycle considerations. Renew. Sustain. Energy Rev. 2014, 39, 461–475. [Google Scholar] [CrossRef]
- Zhang, X.; Shen, L.; Zhang, L. Life cycle assessment of the air emissions during building construction process A case study in Hong Kong. Renew. Sustain. Energy Rev. 2013, 17, 160–169. [Google Scholar] [CrossRef]
- Baek, C.; Park, S.H.; Suzuki, M.; Lee, S.H. Life cycle carbon dioxide assessment tool for buildings in the schematic design phase. Energy Build. 2013, 61, 275–287. [Google Scholar] [CrossRef]
- Bribián, I.Z.; Usón, A.A.; Scarpellini, S. Life cycle assessment in buildings: State-of-the-art and simplified LCA methodology as a complement for building certification. Build. Environ. 2009, 44, 2510–2520. [Google Scholar] [CrossRef]
- Verbeeck, G.; Hens, H. Life cycle inventory of buildings: A calculation method. Build. Environ. 2010, 45, 1037–1041. [Google Scholar] [CrossRef]
- Verbeeck, G.; Hens, H. Life cycle inventory of buildings: A contribution analysis. Build. Environ. 2010, 45, 964–967. [Google Scholar] [CrossRef]
- Tang, J.; Cai, X.; Li, H. Study on development of low-carbon building based on LCA. Energy Procedia 2011, 5, 708–712. [Google Scholar] [CrossRef]
- Hong, T.; Ji, C. Comparison of the CO2 Emissions of Buildings using Input-Output LCA Model and Hybrid LCA Model. Korea Inst. Constr. Eng. Manag. 2014, 15, 119–127. [Google Scholar] [CrossRef]
- Jang, M.; Hong, T.; Ji, C. Hybrid LCA model for assessing the embodied environmental impacts of buildings in South Korea. Environ. Impact Assess. Rev. 2014, 50, 143–155. [Google Scholar] [CrossRef]
- Moonm, H.; Hyunm, C.; Hong, T. Prediction Model of CO2 Emission for Residential Buildings in South Korea. J. Manag. Eng. 2014, 30, 04014001. [Google Scholar] [CrossRef]
- Ji, C.Y.; Hong, T.H.; Jeong, J.W. Environmental Impacts Assessment of Elementary School Buildings and Establishment of the Reference Target using Life Cycle Assessment Model. Korea Inst. Constr. Eng. Manag. 2015, 16, 49–58. [Google Scholar] [CrossRef]
- Lee, K. A Study on the Application of Life Cycle Assessment for the remodeled Multifamily Housing—Focused on the Inventory Analysis of LCA-. Korea Inst. Constr. Eng. Manag. 2002, 18, 16–23. [Google Scholar]
- Park, J.Y.; Kim, S.H.; Chae, C.U. A Comparative Analysis on Life Cycle CO2 Emission between a Modular Housing and a R.C. Apartment Housing. Archit. Inst. Korea 2014, 30, 35–43. [Google Scholar]
- Gong, Y.R.; Tae, S.H.; Song, S.W.; Roh, S.J. A Study on the Environmental Impact Assessment for Passive Apartment based on Life Cycle Assessment. Korea Inst. Build. Constr. 2014, 14, 537–543. [Google Scholar] [CrossRef]
- Lee, S.W.; Tae, S.H.; Kim, T.H.; Roh, S.J. Development of Green Template for Building Life Cycle Assessment Using BIM. J. Korea Spatial Inf. Soc. 2015, 23, 1–8. [Google Scholar] [CrossRef]
- The Korea Construction Daily article. Development of Technology for Integrated Management of CO2 Generated by Construction Materials, 2014. Available online: http://www.conslove.co.kr/news/articleView.html?idxno=33497 (accessed on 20 April 2016).
- Korea Institute of Civil Engineering and Building Technology. Development of carbon reducing concrete structural materials and energy-saving building materials, 2011–2016. Available online: https://www.cmcr.re.kr (accessed on 19 April 2016).
- Korea Environmental Industry & Technology Institute. Environmental Labeling Certification. Available online: www.edp.or.kr/edp (accessed on 22 April 2016).
- Korea Institute of Civil Engineering and Building Technology. The Environmental Performance Assessment and Revitalization Strategy for Han-Ok, 2010. Available online: http://www.prism.go.kr/homepage/researchCommon/retrieveResearchDetailPopup.do?research_id=1611000-200900048 (accessed on 18 April 2016).
- Korea Ministry of Land, Infrastructure and Transport, Korea Agency for Infrastructure Technology Advancement. Building materials Environmental Information DB Final Report, 2008. Available online: http://contents.archives.go.kr/next/search/showDetailPopup.do?rc_code=1310377&rc_rfile_no=201103732500&rc_ritem_no= (accessed on 18 April 2016).
- Korea Environmental Industry & Technology Institute. Korea LCI DB Information. Available online: www.edp.or.kr/edp (accessed on 19 April 2016).
- Ecoinvent Centre. Ecoinvent Database. 2005. Available online: http://www.ecoinvent.org/ (accessed on 19 April 2016).
- Korea Ministry of Land, Infrastructure and Transport. Korea Housing Act. Available online: http://elaw.klri.re.kr/kor_service/lawView.do?hseq=25579&lang=ENG (accessed on 27 April 2016).
- Korea Ministry of Strategy and Finance. Korea Corporate Tax Act. Available online: http://elaw.klri.re.kr/kor_service/lawView.do?hseq=28577&lang=ENG (accessed on 27 April 2016).
- Statistics Korea. Wastes Generation and Disposal in Korea, 2013. Available online: http://www.index.go.kr/potal/main/EachDtlPageDetail.do?idx_cd=1477 (accessed on 27 April 2016).
- Weon, Y.H. A Study of Life-Cycle Energy Consumption and Basic Unit of CO2 Emission of Prototype Office Building. The Graduate School of Kwangwoon University, 2013; pp. 87–91. [Google Scholar]


| Categories | High Strength Ready-Mixed Concrete (A, B, C) | Non-Cement Concrete Panel (D) | Amorphous Steel Fiber Concrete (E, G) |
|---|---|---|---|
| End product | Ready-mixed concrete | Ready-mixed concrete | Ready-mixed concrete |
| Standard | 25-50-600 (slump flow) | 0.6 m × 3.0 m × 0.1 m | 25-24-150 |
| Function | To form structural frame of reinforced concrete building | To form structural frame of reinforced concrete building | To form structural frame of reinforced concrete building |
| Functional unit | 50 MPa ready-mixed concrete 1-m3 production | Ready-mixed concrete 1-m3 production (Panel 1 unit module (46 kg)) | 24 MPa ready-mixed concrete 1-m3 production |
| CO2 reduction technology | Resource recycling (use of industrial waste) Long life span (high strength) | Non-cement Use of industrial waste materials Long life span (high strength) Industrial waste reduction | Use of industrial waste materials Reduction of energy consumption for the production stage Increasing of the durability life by crack reducing |
| Reference product | 50 MPa OPC concrete | Extrusion concrete panel | 24 MPa OPC concrete |
| Division | Non-cement concrete for PC element (F) | Low energy curing concrete panel (H) | Carbon negative cement (I) |
| End product | Ready-mixed concrete | Ready-mixed concrete | Carbon negative cement |
| Standard | 25-50-150 | KS F 4735 | - |
| Function | To form structural frame of reinforced concrete building | To form structural frame of reinforced concrete building | To use for construction in building and civil engineering |
| Functional unit | 50 MPa ready-mixed concrete 1-m3 production | Low energy curing concrete panel 1 kg production | Carbon negative cement 1-kg production |
| CO2 reduction technology | Recycling materials 100% | Reduction of energy consumption for the production stageUse of industrial waste materials | Reduction of CO2 emissions from raw materials Use of industrial waste materials |
| Reference product | Precast concrete | Extrusion concrete panel | Portland cement |
| No. | Low-Carbon Materials | CO2 Emissions | Baseline CO2 Emissions | Reduction Rate |
|---|---|---|---|---|
| A | HVMA Concrete | 92.0 | 375.0 | 75% |
| B | HVMA SCC Concrete | 145.0 | 417.0 | 65% |
| C | Non-cement Concrete | 149.0 | 539.0 | 72% |
| D | Non-cement Concrete Panel | 193.0 | 404.0 | 52% |
| E | Amorphous Steel Fiber Concrete | 253.6 | 320.0 | 21% |
| F | High Thermal Insulation External Wall PC | 345.0 | 559.0 | 38% |
| G | Fiber Reinforced High Strength Concrete | 0.3 | 0.9 | 67% |
| H | Low Energy Curing Concrete Panel | 0.3 | 0.4 | 25% |
| I | Carbon Negative Cement | 0.6 | 0.9 | 44% |
| Division | Unit process | Description |
|---|---|---|
| Material production phase | Construction material production | The process of the manufacturing and processing of raw materials; the building materials to be charged into the building consume resources and the energy required for production, such as the production of products |
| Construction phase | Material transport | The process of transporting the material to be put into the building from the dealer or store to construction sites |
| Construction activities | The transported material on site, using a variety of construction equipment; the process of applying the building | |
| Operation and maintenance phase | Use | The process that residents maintain a comfortable life by using various equipment during their life time |
| Maintenance | The process of maintaining the building as the initial conditions by repairing works | |
| Demolition phase | Destruction | The process of the building by using the construction machinery demolition |
| Waste material transport | The process of transporting the waste materials to a treatment plant in accordance with the disposal method after the destruction process | |
| Recycling | The process of converting recyclable waste materials to new raw materials or manufacturing new products through crushing and screening work | |
| Waste landfill/incineration | The process of burying or burning the non-reusable residue waste |
| Division | Input Materials | Unit | Environmental Impact Database (GWP) (kg-CO2 eq./unit *) | Resources | |
|---|---|---|---|---|---|
| Material production phase | Ready-mixed concrete (25-24-15) | m3 | 4.29 × 10² kg-CO2 eq./m3 | KLCI DB | |
| Ready-mixed concrete (25-18-8) | m3 | 4.29 × 10² kg-CO2 eq./m3 | KLCI DB | ||
| Ready-mixed concrete (25-50-600) | m3 | 3.75 × 10² kg-CO2 eq./m3 | CFF (Korea) | ||
| Ready-mixed concrete (25-18-12) | m3 | 3.20 × 10² kg-CO2 eq./m3 | CFF (Korea) | ||
| Ready-mixed concrete (K product) | kg | 3.54 × 10² kg-CO2 eq./kg | CFF (Korea) | ||
| Ready-mixed concrete (E product) | kg | 9.20 × 10 kg-CO2 eq./kg | CFF (Korea) | ||
| Ready-mixed concrete (D product) | kg | 1.45 × 10² kg-CO2 eq./kg | CFF (Korea) | ||
| Ready-mixed concrete (R product) | kg | 2.54 × 10² kg-CO2 eq./kg | CFF (Korea) | ||
| Lightweight wall panel (K Lab product) | kg | 1.93 × 10² kg-CO2 eq./kg | CFF (Korea) | ||
| LEC panel (KH product) | kg | 2.90 × 10⁻¹ kg-CO2 eq./kg | CFF (Korea) | ||
| Dry mortar (P product) | m3 | 6.76 × 10⁻¹ kg-CO2 eq./m3 | CFF (Korea) | ||
| High thermal insulation PC (H product) | m3 | 3.45 × 10² kg-CO2 eq./m3 | CFF (Korea) | ||
| Lumber | m3 | 5.21 × 10 kg-CO2 eq./m3 | KLCI DB | ||
| Steel and pipe | kg | 3.96 × 10⁻¹ kg-CO2 eq./kg | KLCI DB | ||
| Concrete brick | kg | 1.23 × 10⁻¹ kg-CO2 eq./kg | KLCI DB | ||
| Brick masonry | kg | 3.98 × 10⁻¹ kg-CO2 eq./kg | KLCI DB | ||
| Tile | kg | 3.53 × 10⁻¹ kg-CO2 eq./kg | KLCI DB | ||
| Granite | kg | 1.13 × 10 kg-CO2 eq./kg | KLCI DB | ||
| Scagliola | kg | 1.34 × 10 kg-CO2 eq./kg | KLCI DB | ||
| Aluminum panel | kg | 2.11 kg-CO2 eq./kg | KLCI DB | ||
| Thermopane | m2 | 2.24 × 10 kg-CO2 eq./m2 | KLCI DB | ||
| Gypsum board | kg | 2.15 × 10⁻¹ kg-CO2 eq./kg | KLCI DB | ||
| Foam polystyrene insulation | kg | 1.90 × 10⁻¹ kg-CO2 eq./kg | KLCI DB | ||
| Cement | kg | 9.44 × 10⁻¹ kg-CO2 eq./kg | KLCI DB | ||
| Sand | kg | 3.87 kg-CO2 eq./kg | KLCI DB | ||
| Gravel | kg | 1.13 × 10 kg-CO2 eq./kg | KLCI DB | ||
| Construction Phase | Diesel | kg | 6.82 × 10⁻² kg-CO2 eq./kg | KLCI DB | |
| Gasoline | kg | 8.32 × 10⁻² kg-CO2 eq./kg | KLCI DB | ||
| Electricity (production) | kwh | 4.95 × 10⁻¹ kg-CO2 eq./kwh | KLCI DB | ||
| Operation and maintenance phase | Electricity(production) | kwh | 4.95 × 10⁻¹ kg-CO2 eq./kwh | KLCI DB | |
| Gas (production) | Nm3 | 4.81× 10⁻¹ kg-CO2 eq./Nm3 | KLCI DB | ||
| Gas (combustion) | Nm3 | 2.30 kg-CO2 eq./Nm3 | KLCI DB | ||
| Demolition phase | Recycling | Waste wood | kg | 1.39 × 10⁻² kg-CO2 eq./kg | KLCI DB |
| Waste glass | kg | 9.76 × 10⁻³ kg-CO2 eq./kg | KLCI DB | ||
| Waste concrete | kg | 1.38 × 10⁻² kg-CO2 eq./kg | KLCI DB | ||
| Waste steel | kg | 3.79 × 10⁻³ kg-CO2 eq./kg | KLCI DB | ||
| Landfill | Waste wood | kg | 6.07 × 10⁻² kg-CO2 eq./kg | KLCI DB | |
| Waste glass | kg | 7.00 × 10⁻³ kg-CO2 eq./kg | KLCI DB | ||
| Waste concrete | kg | 7.00 × 10⁻³ kg-CO2 eq./kg | KLCI DB | ||
| Waste steel | kg | 7.00 × 10⁻³ kg-CO2 eq./kg | KLCI DB | ||
| Incineration | Waste wood | kg | 1.17 × 10⁻² kg-CO2 eq./kg | KLCI DB | |
| Waste glass | kg | 2.42 × 10⁻² kg-CO2 eq./kg | KLCI DB | ||
| Waste steel | kg | 1.70 × 10⁻² kg-CO2 eq./kg | KLCI DB | ||
| Division | Description | ||
|---|---|---|---|
 | Building | Low-carbon material building | |
| Site | Goyang-Si, Gyeonggi-do, Korea | ||
| Lot area | 372 m2 | ||
| Gross floor area | 1078 m2 | ||
| Structure | Reinforced concrete structure | ||
| Parking | 5 cars | ||
| Division | Area (m2) | Use | |
| 1st floor | 335 | Common space (PR (publicrelations) hall, monitoring space) | |
| 2nd floor | 302 | ||
| 3rd floor | 220 (House 170) | Reference house (85 m2), empirical house (85 m2) | |
| 4th floor | 220 (House 170) | Reference (85 m2), empirical house (85 m2) | |
| Roof floor | 13 | (Excluded from the GFA (Gross Floor Area)) | |
| Total | 1078 | ||
 | |||
| Division | 1st, 2nd Floor Common Space | 3rd, 4th Floor Reference House | 3rd, 4th Floor Empirical House (Low-Carbon Materials) | |
|---|---|---|---|---|
| Assessment scope | Temporal | Life cycle of 30 years | ||
| Spatial | Resources and energy, which is input and output into the building life cycle (production of building materials, construction, use, disposal) | |||
| Function | The function of the support for a variety of business activities | The function of household-dwelling | ||
| Functional unit | The office building for 30 years | A residential building for one household during 30 years | ||
| Reference flow | Resources and energy, which are put into the office buildings for 30 years | Resources and energy input to a building for a household during 30 years | ||
| Reference flow unit | kgCO2 eq./m2.30 years | |||
| Materials | Inputs (kg) | Contribution Rate (%) | Cumulative Contribution Rate (%) |
|---|---|---|---|
| Ready-mixed concrete | 2,379,155 | 75.0 | 75.0 |
| Sand and gravel | 459,200 | 14.5 | 89.5 |
| Steel and pipe | 127,696 | 4.0 | 93.5 |
| Cement | 47,090 | 1.5 | 95.0 |
| Lumber | 40,347 | 1.3 | 96.3 |
| Wooden product | 38,731 | 1.2 | 97.5 |
| PC panel | 24,700 | 0.8 | 98.3 |
| Glass product | 16,451 | 0.5 | 98.8 |
| Clay product | 11,862 | 0.4 | 99.2 |
| Asbestos product | 10,853 | 0.3 | 99.5 |
| Concrete production | 4124 | 0.1 | 99.6 |
| Gypsum production | 2829 | 0.1 | 99.7 |
| Paint | 2291 | 0.1 | 99.8 |
| Adhesive | 1813 | 0.1 | 99.9 |
| Steel pipe | 1787 | 0.1 | 100.0 |
| Stone | 1004 | 0.0 | 100.0 |
| Steel wire | 668 | 0.0 | 100.0 |
| Rolled steel materials | 662 | 0.0 | 100.0 |
| etc. | 1024 | 0.0 | 100.0 |
| Total | 3,172,285 | 100 | 100.0 |
| Division | Inputs (kg) | CO2 Emissions (kg CO2 eq.) | Percentage (%) |
|---|---|---|---|
| Ready-mixed concrete | 2,379,155 | 360,577 | 72.7 |
| Sand and gravel | 459,200 | 2647 | 0.5 |
| Steel and pipe | 127,696 | 50,247 | 10.1 |
| Cement | 47,090 | 42,404 | 8.6 |
| PC panel | 24,700 | 4485 | 0.9 |
| Glass product | 16,451 | 7959 | 1.6 |
| Wooden product | 15,284 | 7063 | 1.4 |
| Lumber | 14,580 | 1356 | 0.3 |
| Clay product | 11,862 | 4486 | 0.9 |
| Asbestos product | 10,853 | 2062 | 0.4 |
| Concrete production | 4124 | 508 | 0.1 |
| Gypsum production | 2829 | 608 | 0.1 |
| Construction stone | 1004 | 11,400 | 2.3 |
| Total | 3,114,828 | 495,802 | 100 |
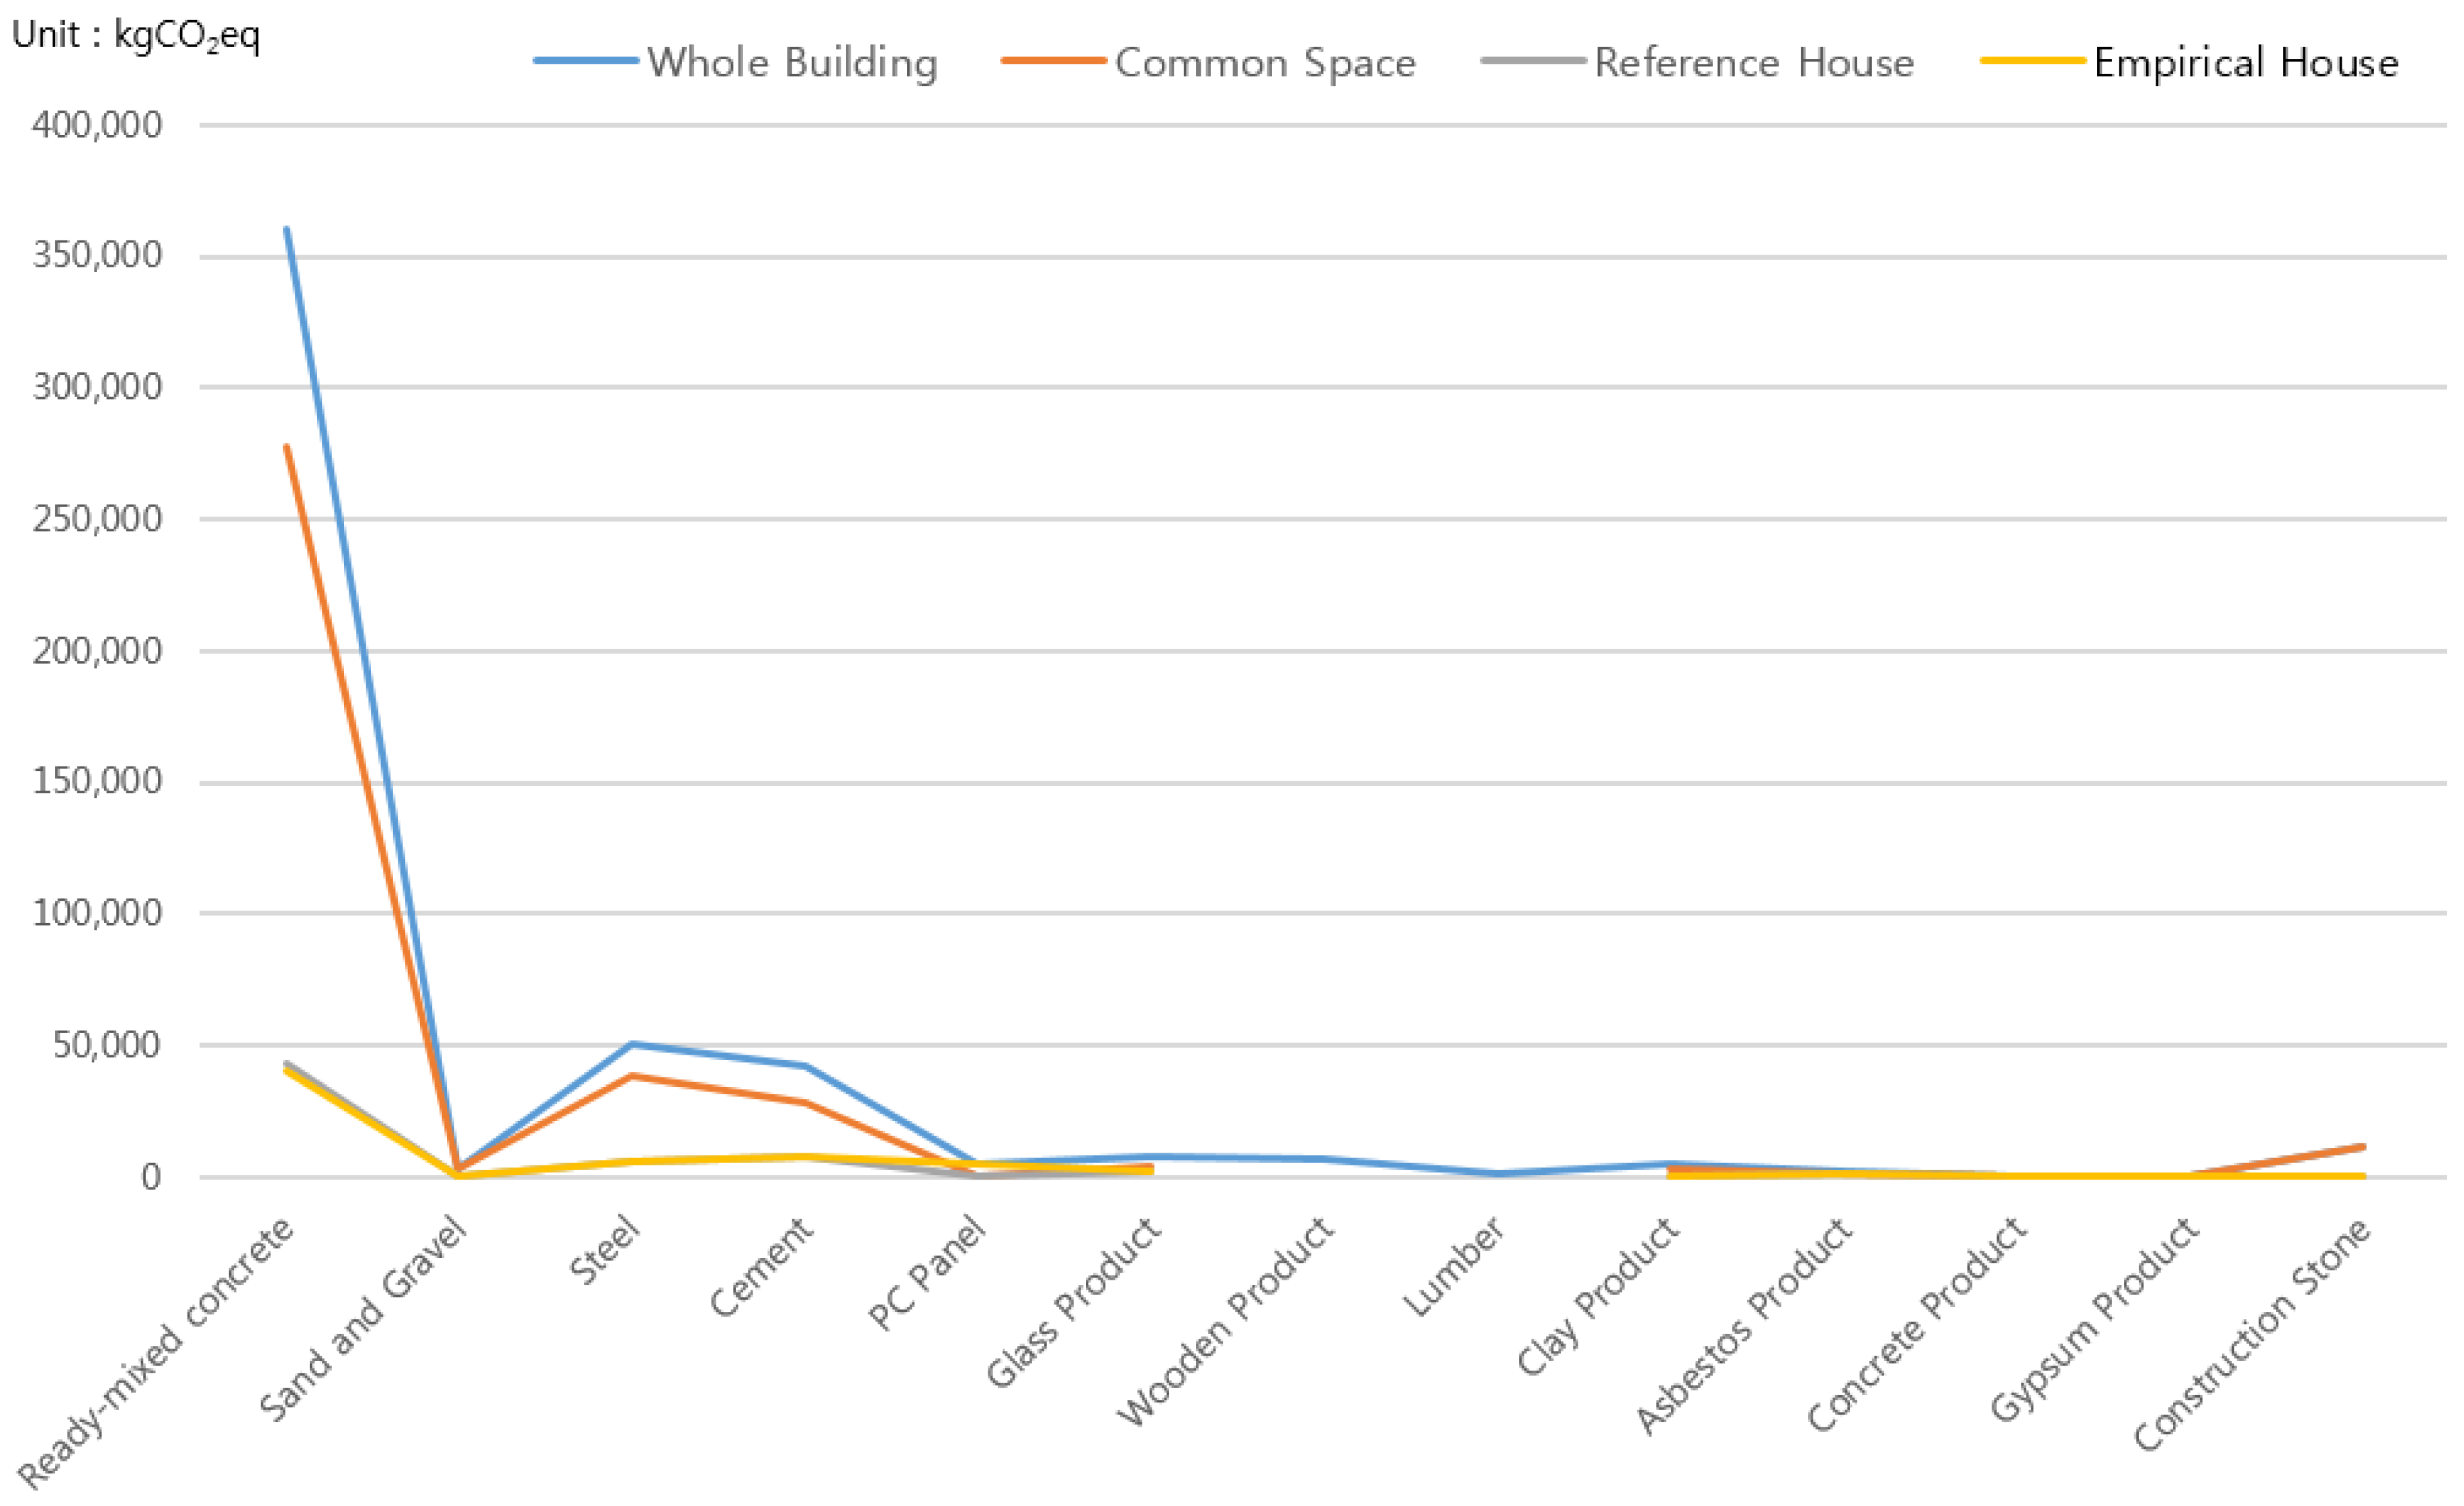
| Division | Ready-Mixed Concrete | Sand and Gravel | Steel and Pipe | Cement | PC Panel | Glass Product | Wooden Product | Lumber | Clay Product | Asbestos Product | Concrete Production | Gypsum Production | Construction Stone | Total | |
|---|---|---|---|---|---|---|---|---|---|---|---|---|---|---|---|
| Inputs (kg) | Whole building | 2,379,155 | 459,200 | 127,696 | 47,090 | 24,700 | 16,451 | 15,284 | 14,580 | 11,862 | 10,853 | 4124 | 2829 | 1004 | 3,114,828 |
| Common space | 1,957,600 | 411,136 | 97,521 | 30,422 | - | 9722 | 15,284 | 14,580 | 8315 | 3612 | 4124 | 119 | 988 | 2,553,423 | |
| Reference House | 256,450 | 24,029 | 15,088 | 8335 | - | 3987 | 1774 | 3622 | - | 1354 | 8 | 314,647 | |||
| Empirical house | 165,381 | 24,036 | 15,084 | 8333 | 24,700 | 2742 | 1774 | 3619 | - | 1355 | 8 | 247,032 | |||
| CO2 emissions (kg CO2 eq.) | Whole building | 360,577 | 2647 | 50,247 | 42,404 | 4485 | 7959 | 7063 | 1356 | 4486 | 2062 | 508 | 608 | 11,400 | 495,802 |
| Common space | 277,967 | 2531 | 38,309 | 28,025 | - | 3997 | 3236 | 686 | 508 | 26 | 11,198 | 366,483 | |||
| Reference House | 42,632 | 58 | 5969 | 7190 | - | 2347 | 625 | 688 | - | 291 | 101 | 59,901 | |||
| Empirical house | 39,978 | 58 | 5969 | 7190 | 4485 | 1614 | 625 | 688 | - | 291 | 101 | 60,999 | |||
| Equipment | Distance (km) | Inputs | Unit | CO2 Emission Unit | CO2 Emissions (kg CO2 eq.) | |
|---|---|---|---|---|---|---|
| Truck (2.5 ton) | 30 | 784,887 | kg | 1.46 × 10⁻¹ | kgCO2/ton·km | 3437.8 |
| Concrete mixer truck | 10 | 1051 | m3 | 6.74 × 10⁻¹ | kgCO2/m3·km | 7083.7 |
| Total | 10,521.5 | |||||
| Energy Sources | Inputs | Unit | CO2 Emission Unit | CO2 Emissions (kg CO2 eq.) | |
|---|---|---|---|---|---|
| Diesel | 1180 | kg | 4.80E-01 | kgCO2/kg | 566.4 |
| Gasoline | 40 | kg | 8.32E-02 | kgCO2/kg | 3.3 |
| Electricity | 529 | kwh | 4.95E-01 | kgCO2/kwh | 261.9 |
| Total | 831.6 | ||||
| Division | Electricity | LNG | Yearly CO2 Emissions (kg CO2 eq./y) | 30 Years CO2 Emissions (kg CO2 eq./30 y) | ||
|---|---|---|---|---|---|---|
| Consumption (kwh/y∙m2) | CO2 Emissions (kg CO2 eq./y∙m2) | Consumption (Nm3/y∙m2) | CO2 Emissions (kg CO2 eq./y∙m2) | |||
| Consumption per unit of empirical house | 41.7 | 18 | 10.0 | 27.9 | 7803 | 234,090 |
| Consumption per unit (except empirical house) | 41.7 | 18 | 16.1 | 42.8 | 55,206 | 1,656,192 |
| Total | 83.4 | 36 | 26.1 | 70.7 | 63,009 | 1,890,282 |
| Division | Waste Concrete | Waste Steel | Waste Wood | Waste Glass | Total Emissions | ||
|---|---|---|---|---|---|---|---|
| Disposal volumes (kg) | Total | 2,379,155 | 127,696 | 29,602 | 16,451 | 2,552,904 | |
| Common space | 1,957,600 | 97,521 | 19,340 | 9722 | 2,084,183 | ||
| Reference house | 256,450 | 15,088 | 132 | 3987 | 275,657 | ||
| Empirical house | 165,381 | 15,084 | 130 | 2742 | 183,337 | ||
| CO2 emissions (kg CO2 eq.) | Total | 32,311 | 503 | 436 | 161 | 33,984 | |
| Common space | 26,586 | 384 | 285 | 95 | 27,350 | ||
| Reference house | 3483 | 59 | 2 | 39 | 3583 | ||
| Empirical house | 2963 | 59 | 2 | 27 | 3051 | ||
| Division | Manufacture | Construction | Operation | Demolition | Yearly CO2 Emissions | Emissions per Unit Area |
|---|---|---|---|---|---|---|
| Consumption per unit of empirical house | 60,999 | 1790 | 7803 | 3051 | 73,643 | 433 |
| Consumption per unit (except empirical house) | 426,384 | 9562 | 55,206 | 30,933 | 522,085 | 575 |
| Yearly total emissions | 487,383 | 11,352 | 63,009 | 33,984 | 595,728 | 552.6 |
| (%) | 81.8% | 1.9% | 10.6% | 5.7% | 100.0% | |
| 30 years total emissions | 487,383 | 11,352 | 1,890,285 | 33,984 | 2,423,004 | 2248 |
| (%) | 20.1% | 0.5% | 78.0% | 1.4% | 100.0% |
© 2016 by the authors; licensee MDPI, Basel, Switzerland. This article is an open access article distributed under the terms and conditions of the Creative Commons Attribution (CC-BY) license (http://creativecommons.org/licenses/by/4.0/).
Share and Cite
Cho, S.-H.; Chae, C.-U. A Study on Life Cycle CO2 Emissions of Low-Carbon Building in South Korea. Sustainability 2016, 8, 579. https://0-doi-org.brum.beds.ac.uk/10.3390/su8060579
Cho S-H, Chae C-U. A Study on Life Cycle CO2 Emissions of Low-Carbon Building in South Korea. Sustainability. 2016; 8(6):579. https://0-doi-org.brum.beds.ac.uk/10.3390/su8060579
Chicago/Turabian StyleCho, Su-Hyun, and Chang-U Chae. 2016. "A Study on Life Cycle CO2 Emissions of Low-Carbon Building in South Korea" Sustainability 8, no. 6: 579. https://0-doi-org.brum.beds.ac.uk/10.3390/su8060579