
Coordinated Development Analysis of the “Resources-Environment-Ecology-Economy-Society” Complex System in China


Abstract
:1. Introduction
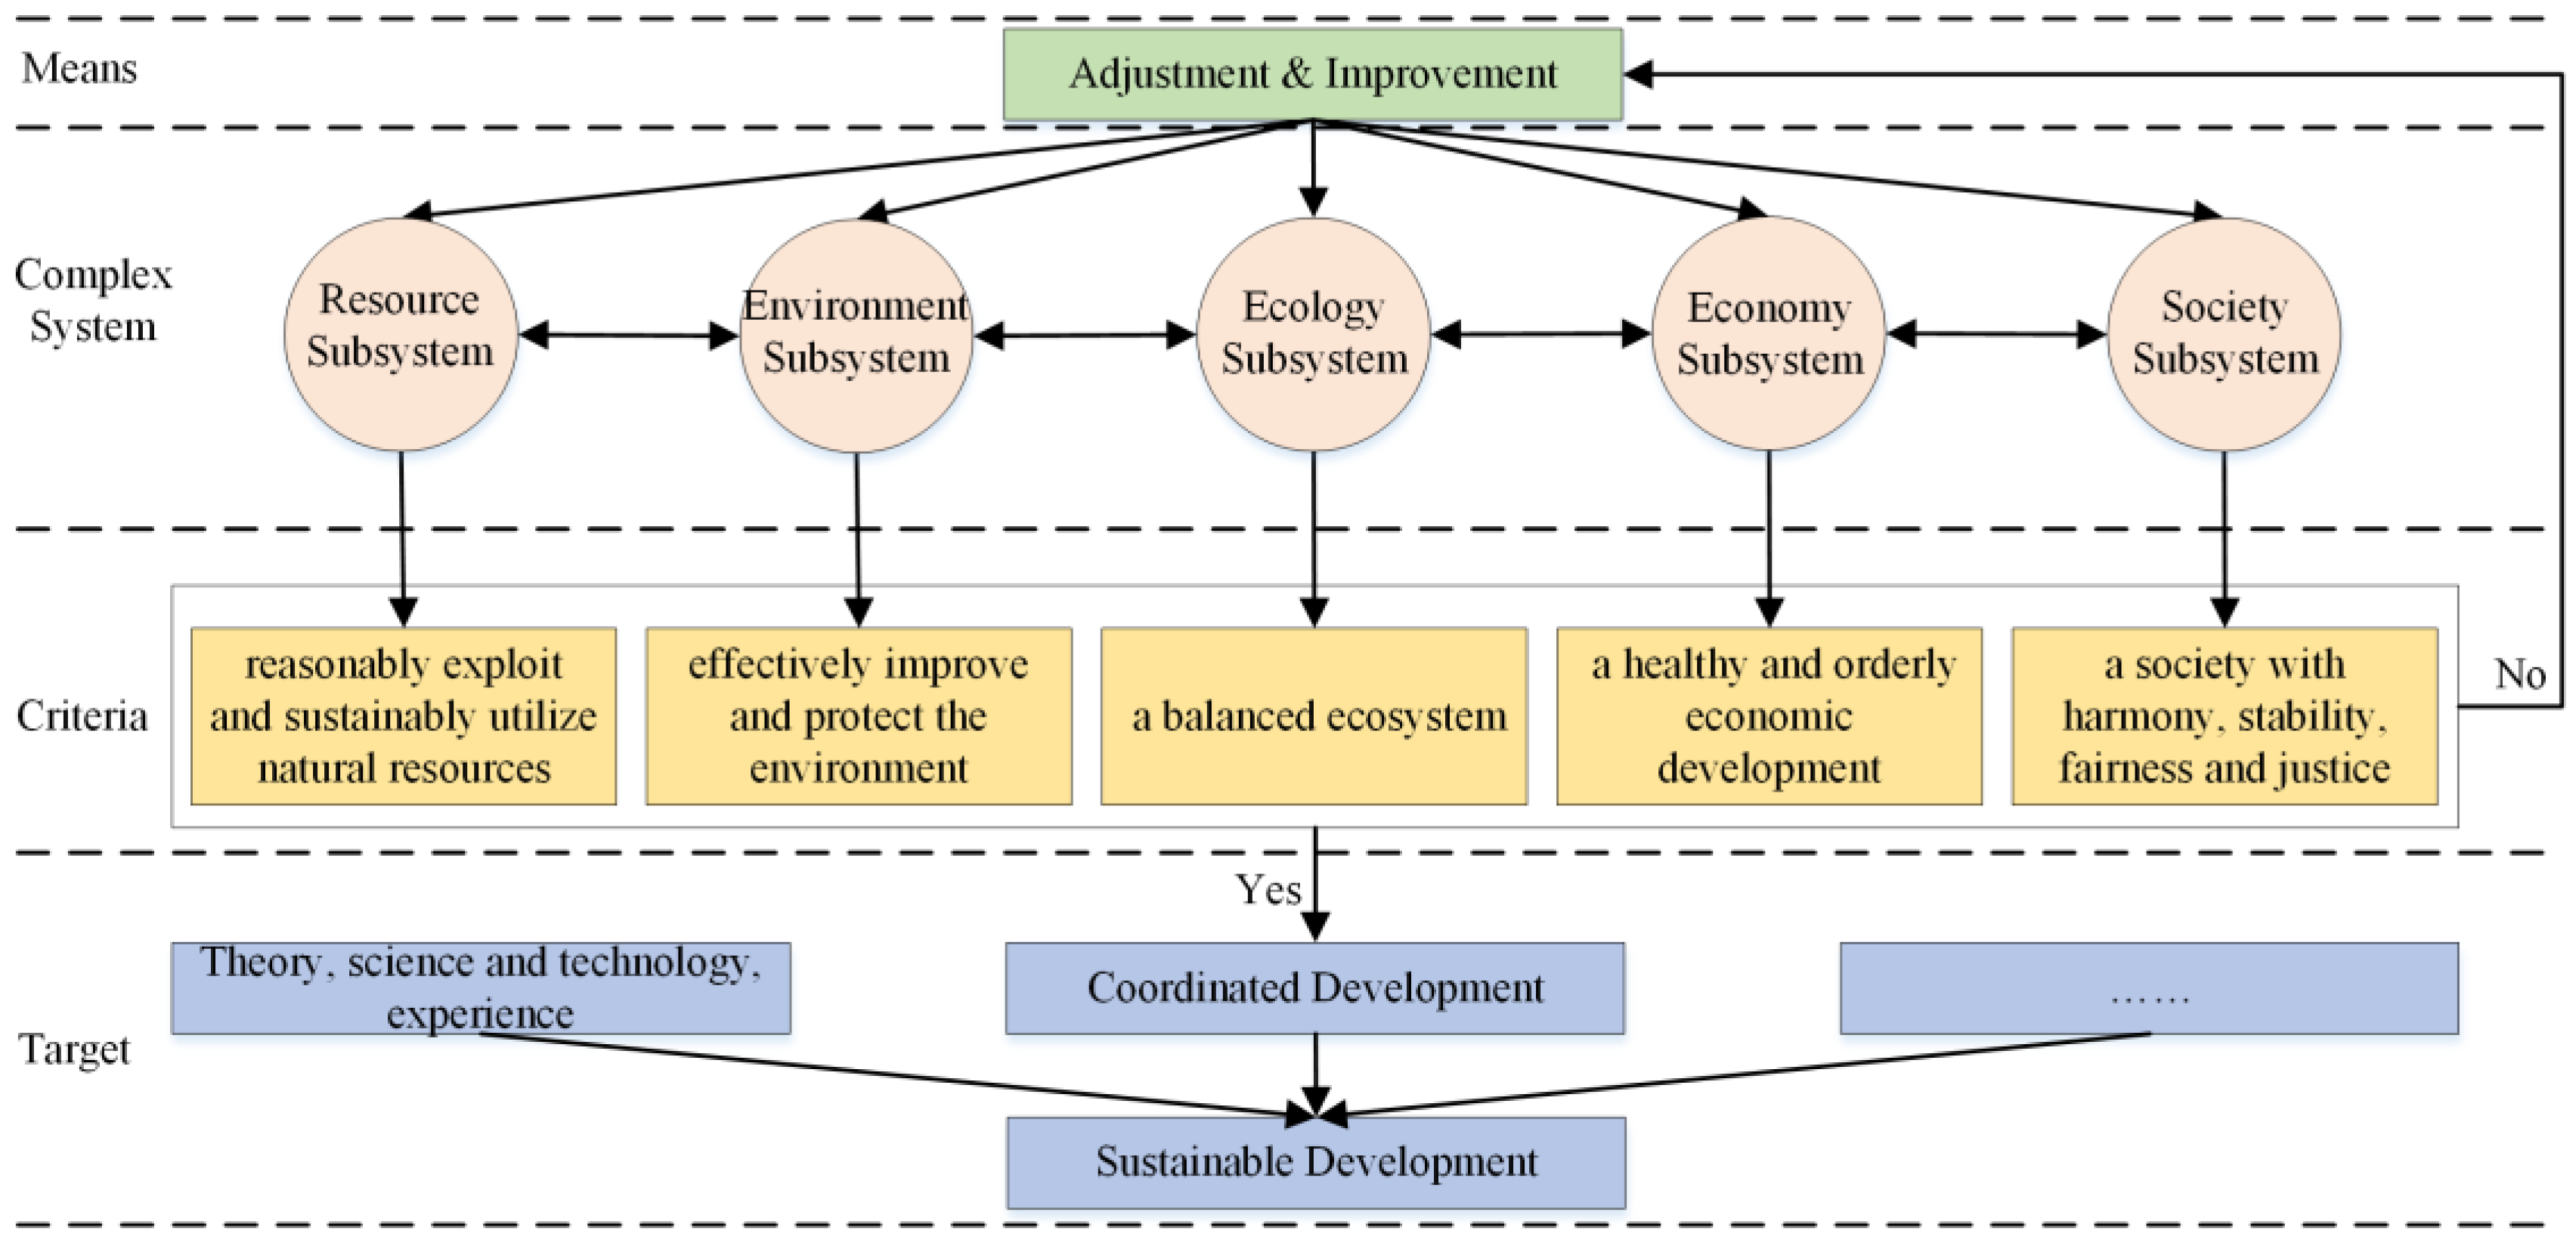
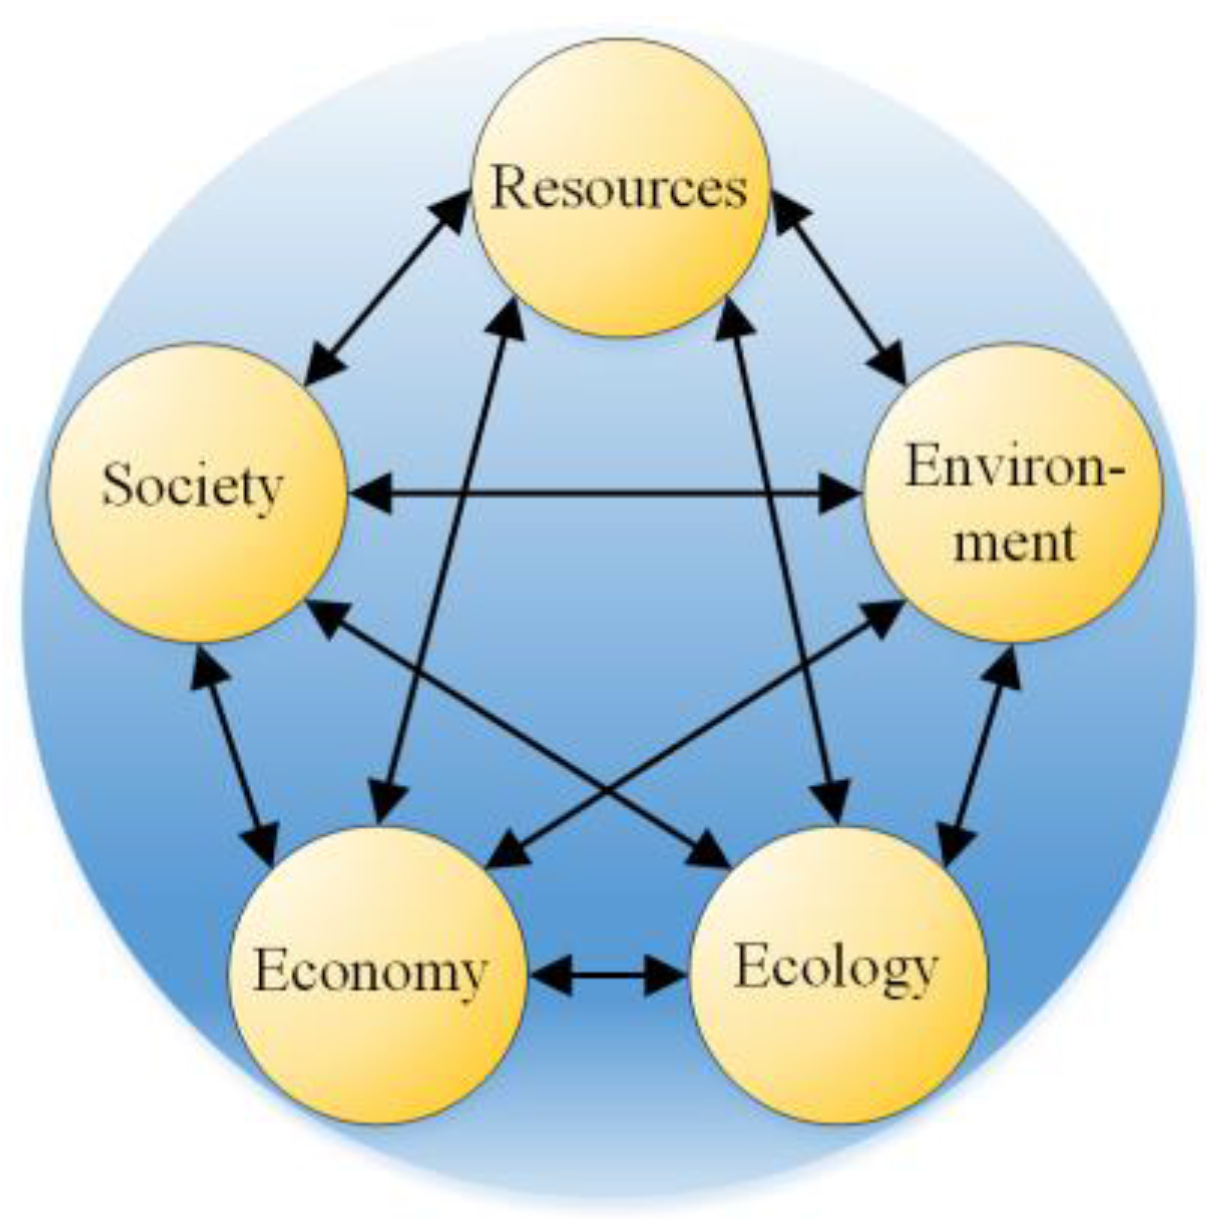
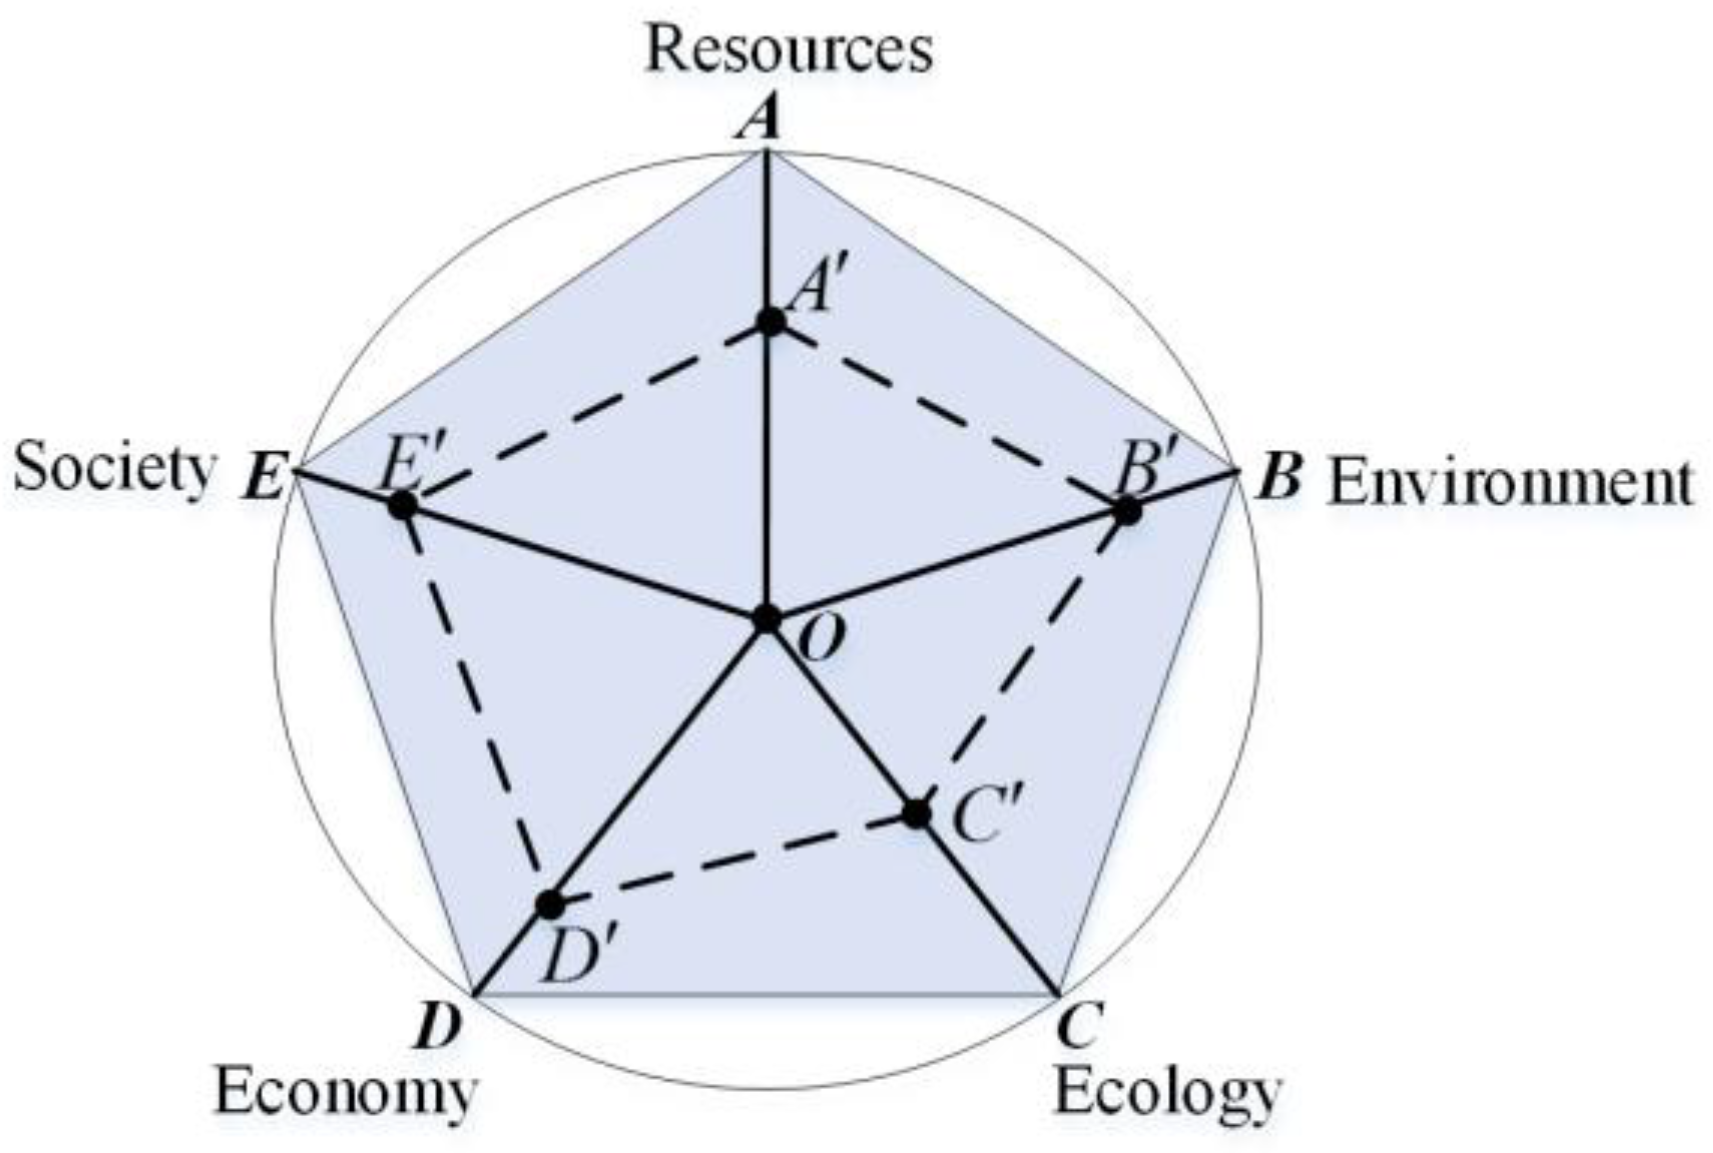
2. CSR3ES
3. Data Preparation
3.1. Region Scale and Experimental Data
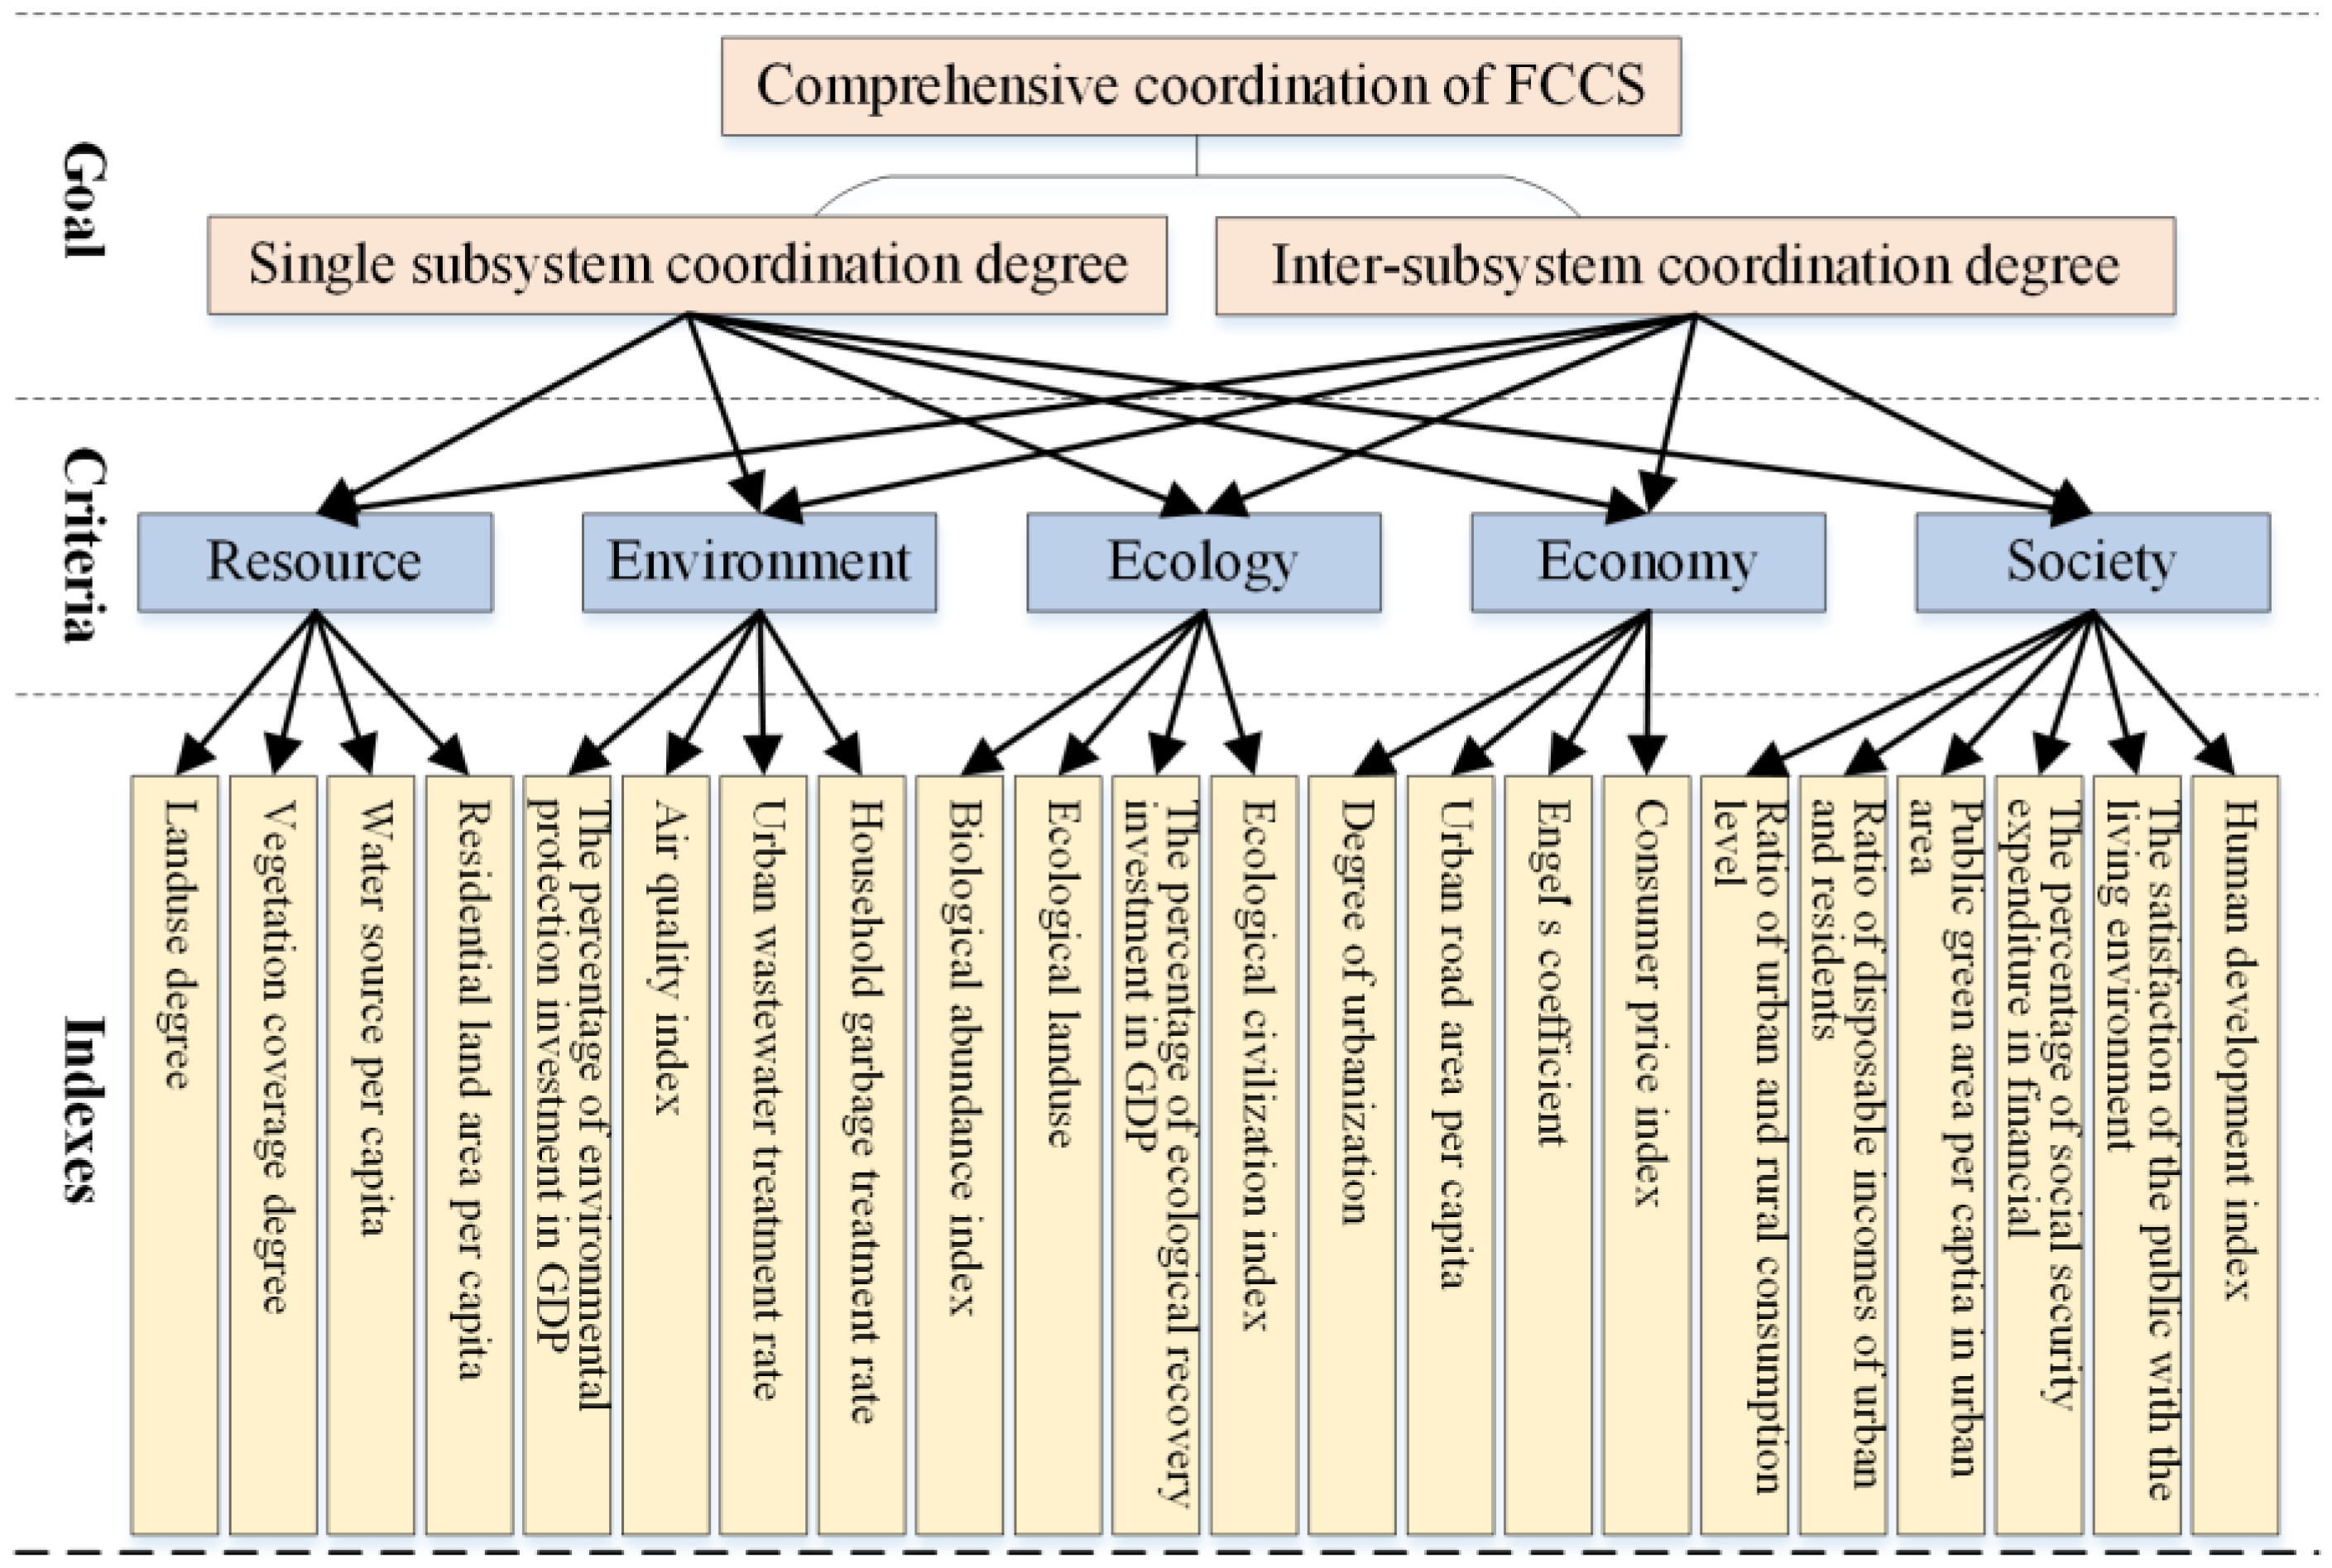
3.2. Index System Establishment
- (1)
- The selected indices should cover broad rather than detailed contents, and they should be able to describe and embody the status and changing trends of all related aspects (resources, environment, ecology, society, economy, etc.).
- (2)
- The selected indices should be of high interest and popularity, easy to understand by decision makers, and easy to communicate to the public.
- (3)
- The data used for index calculation should be reliable and accessible.
- (4)
- It should be feasible to obtain important data for index calculation from collected data and documents.
- (5)
- The comprehensive indices should be able to be employed to evaluate existing and emerging problems, diagnose factors causing the damages, and guide the formulation and implementation of policies and measures.
3.3. Data Normalization
4. Research Methods
4.1. Inner-Subsystem Coordination Degree
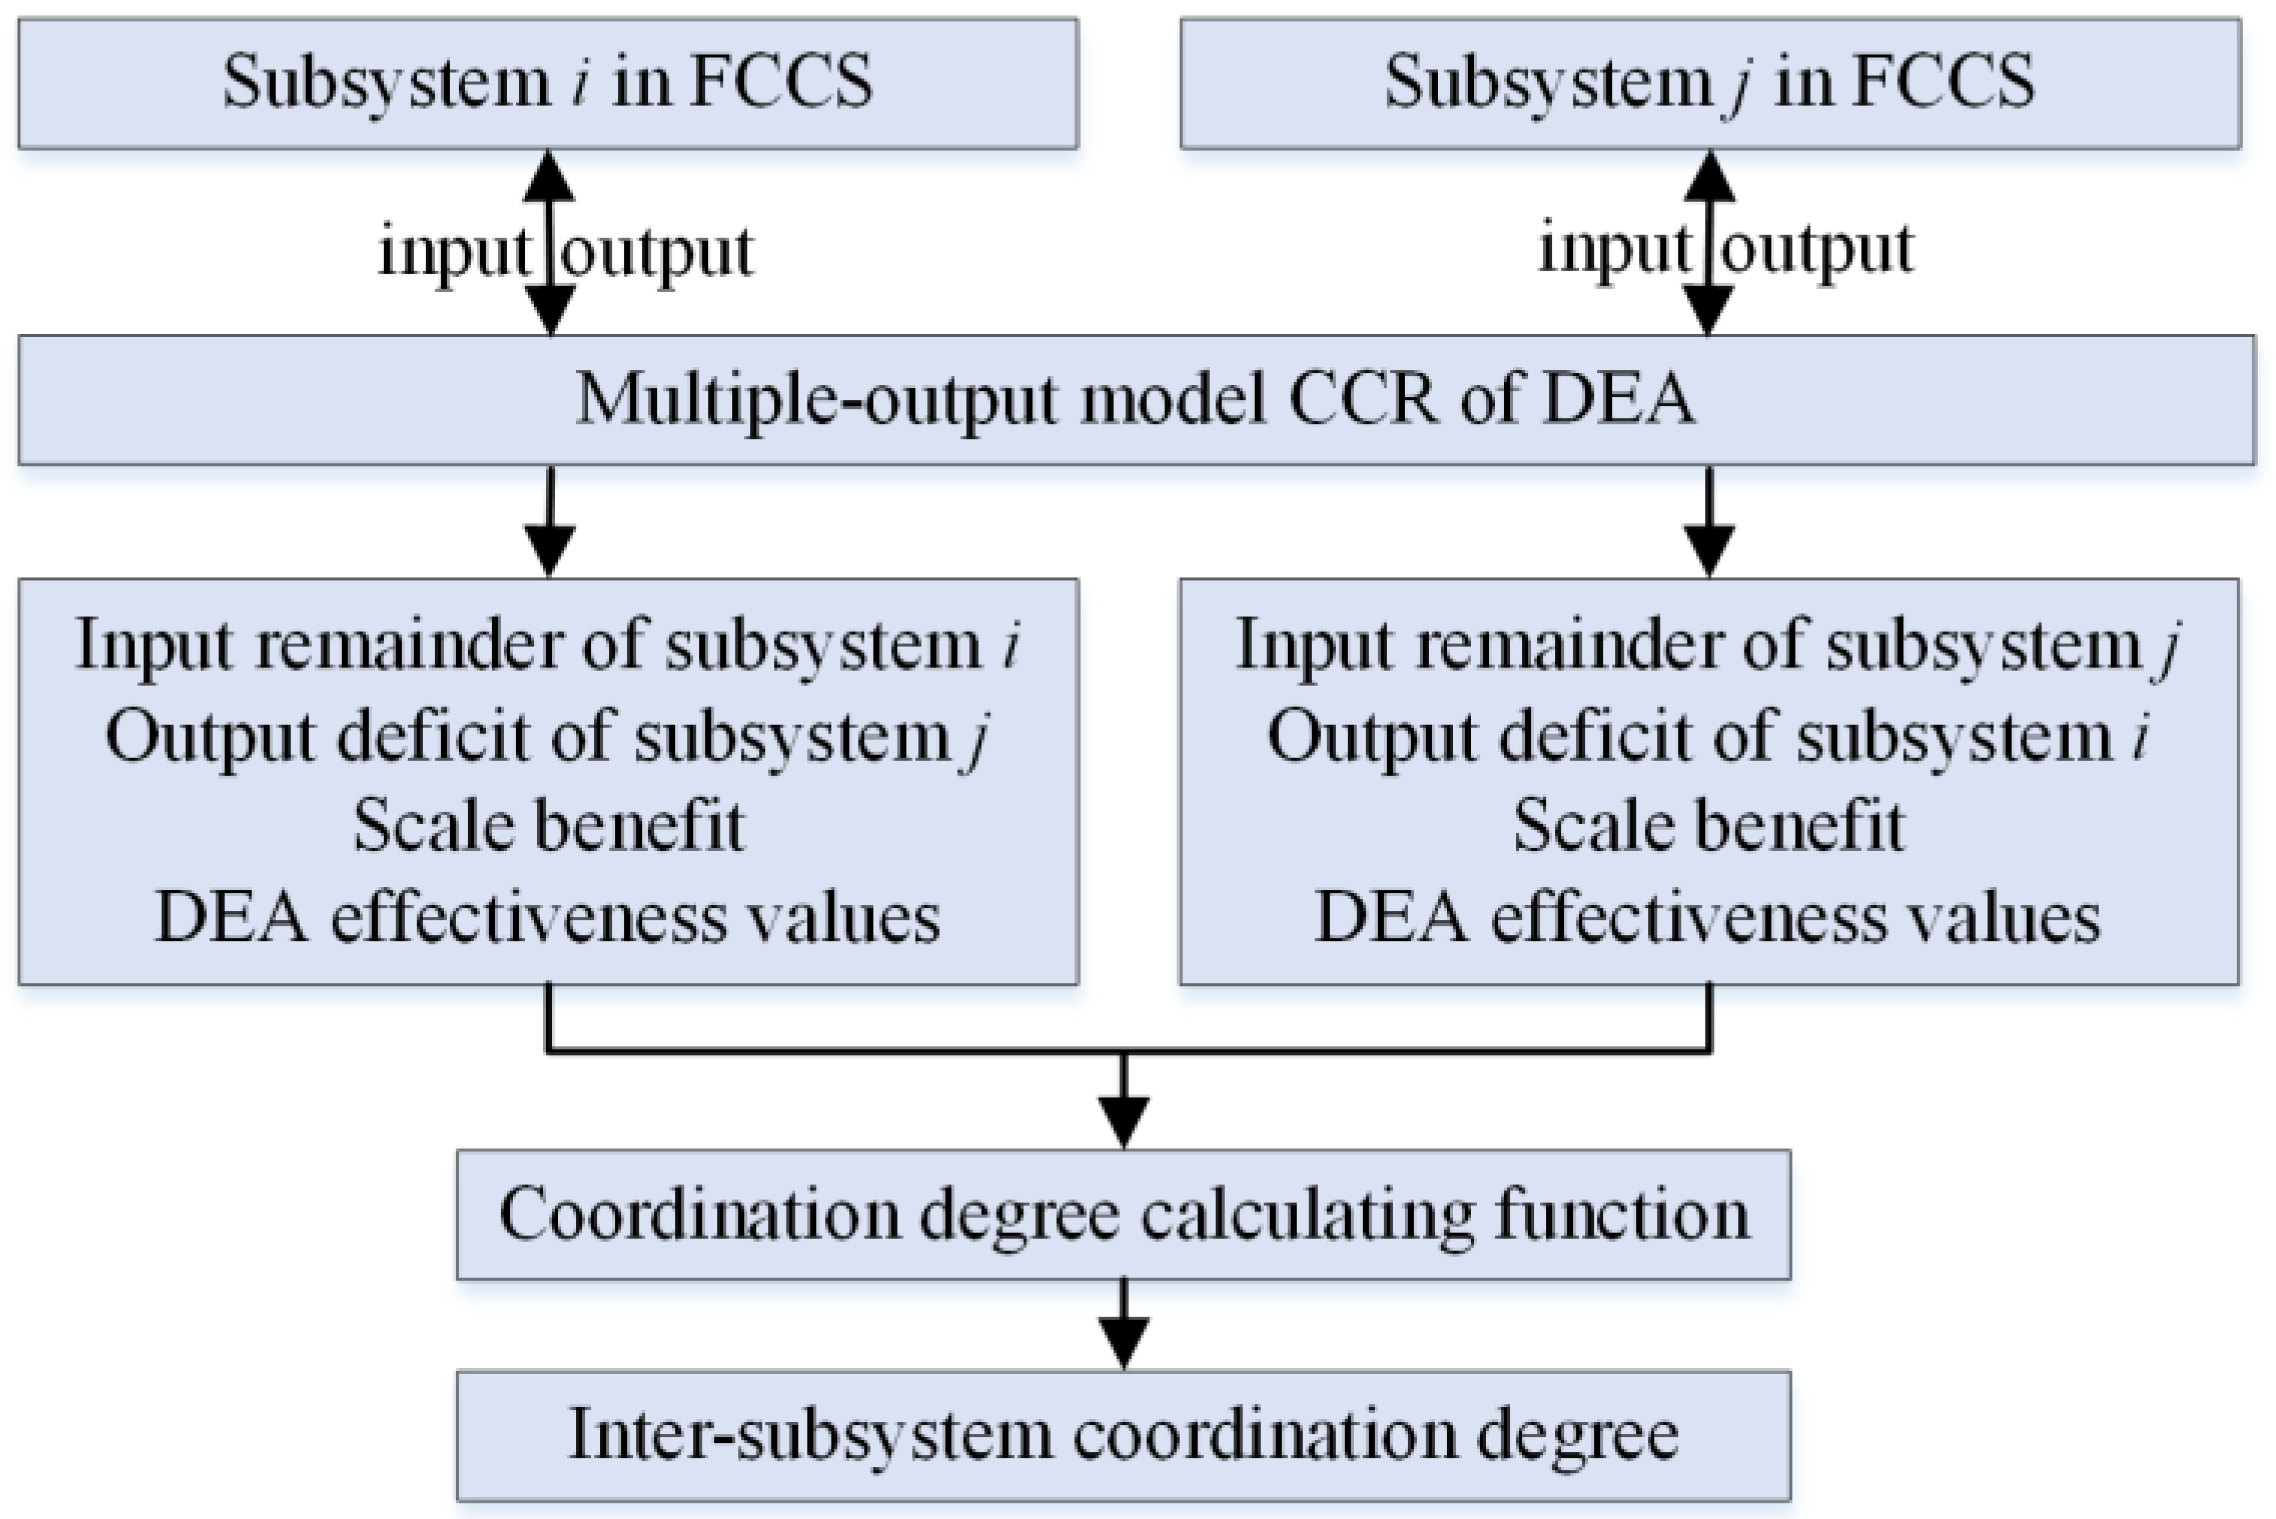
4.2. Inter-System Coordination Degree
4.3. Comprehensive Coordination Degree of CSR3ES
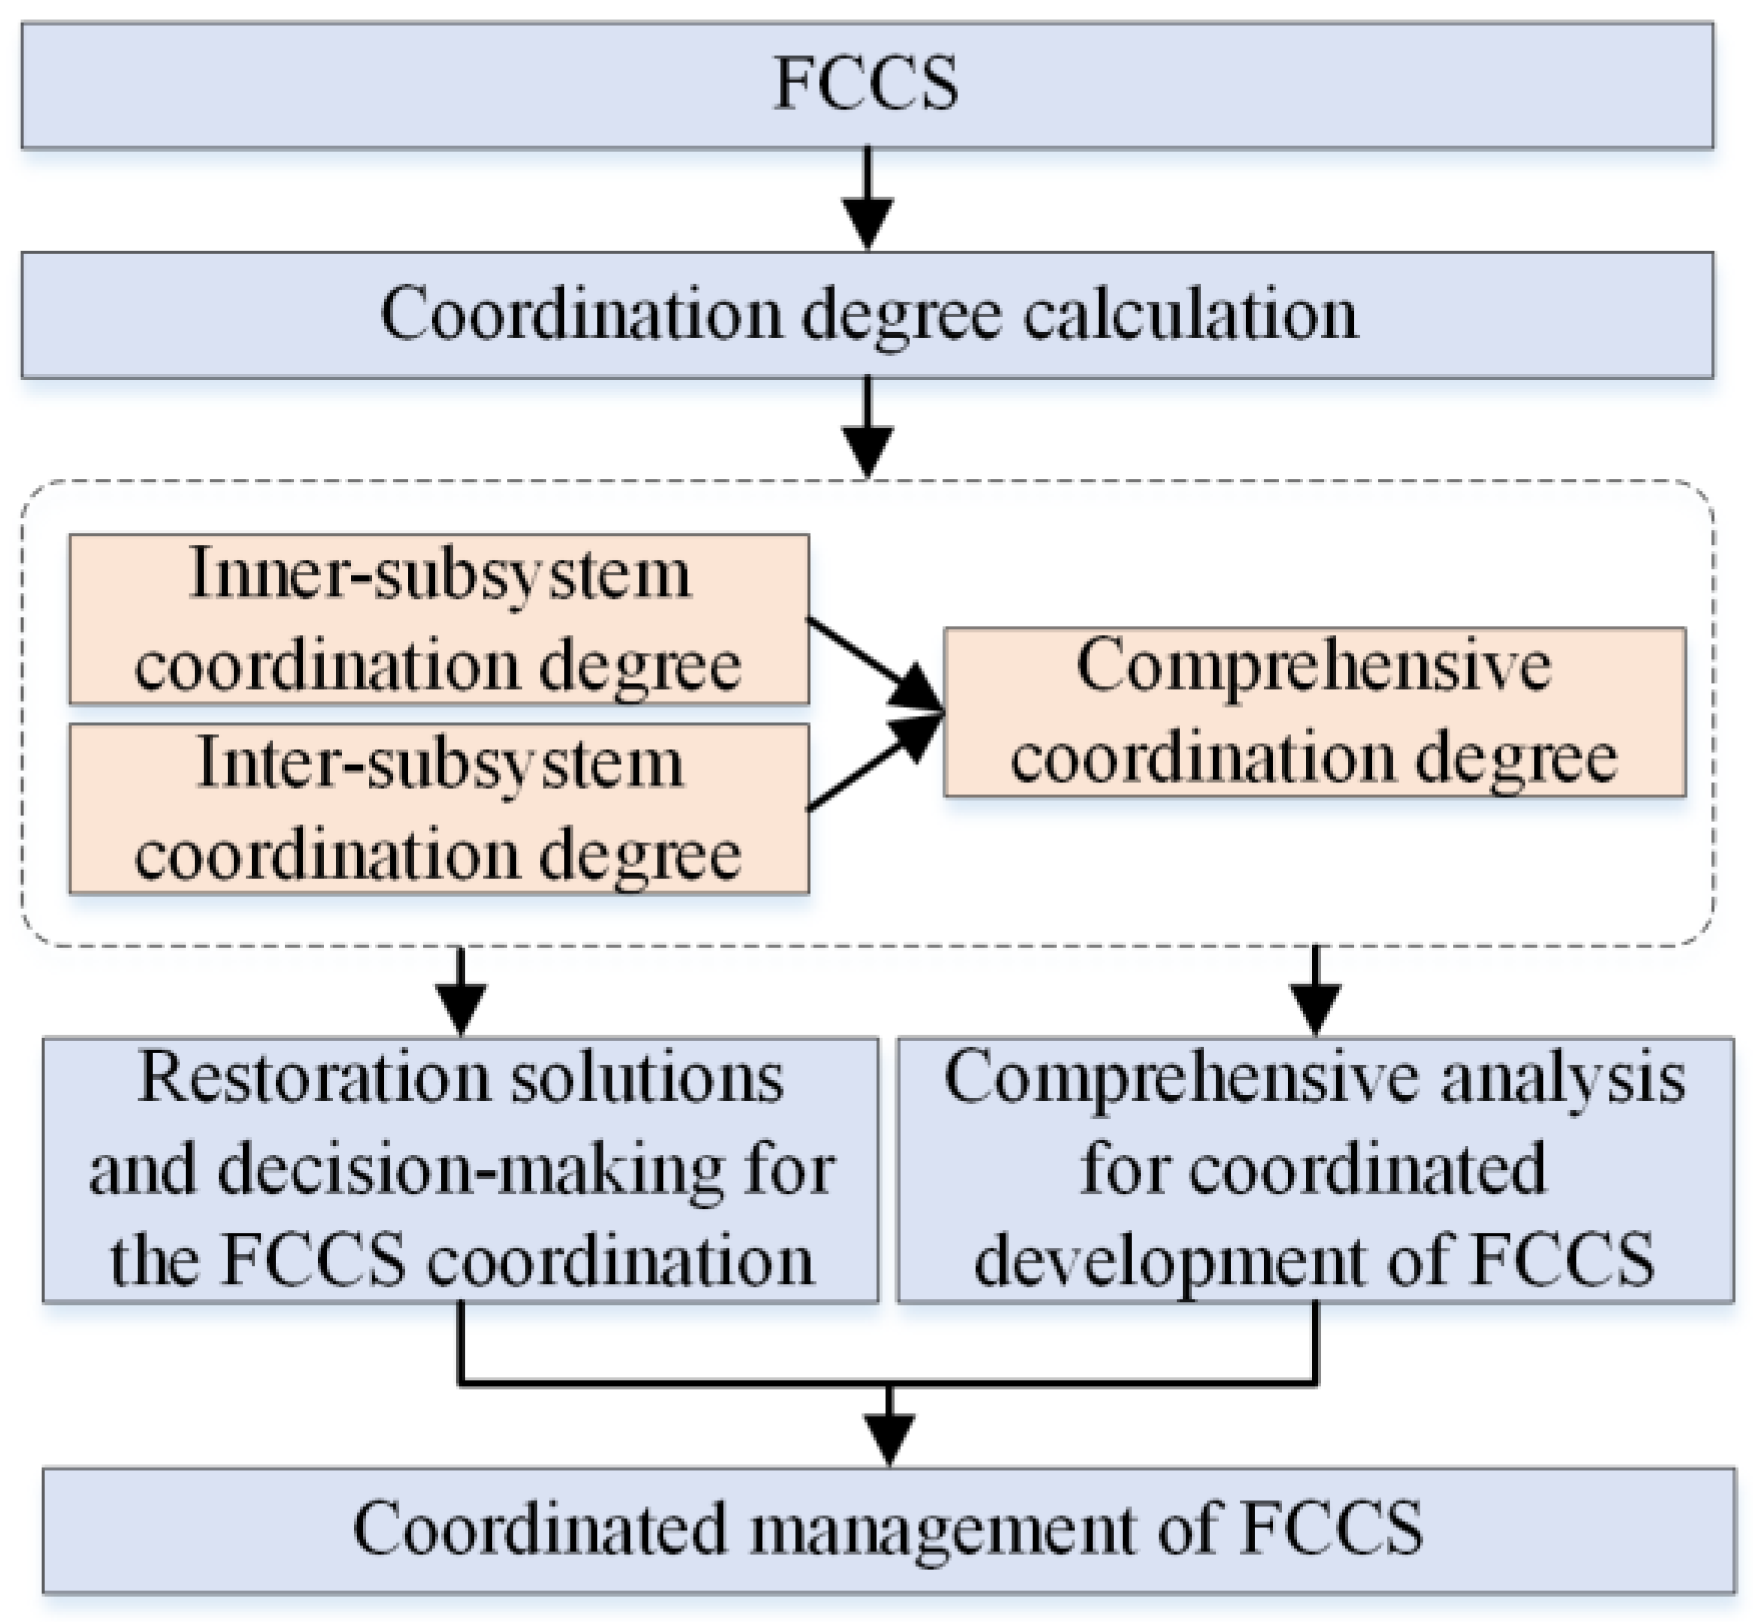
4.4. Coordination Management of CSR3ES
5. Result Analyses
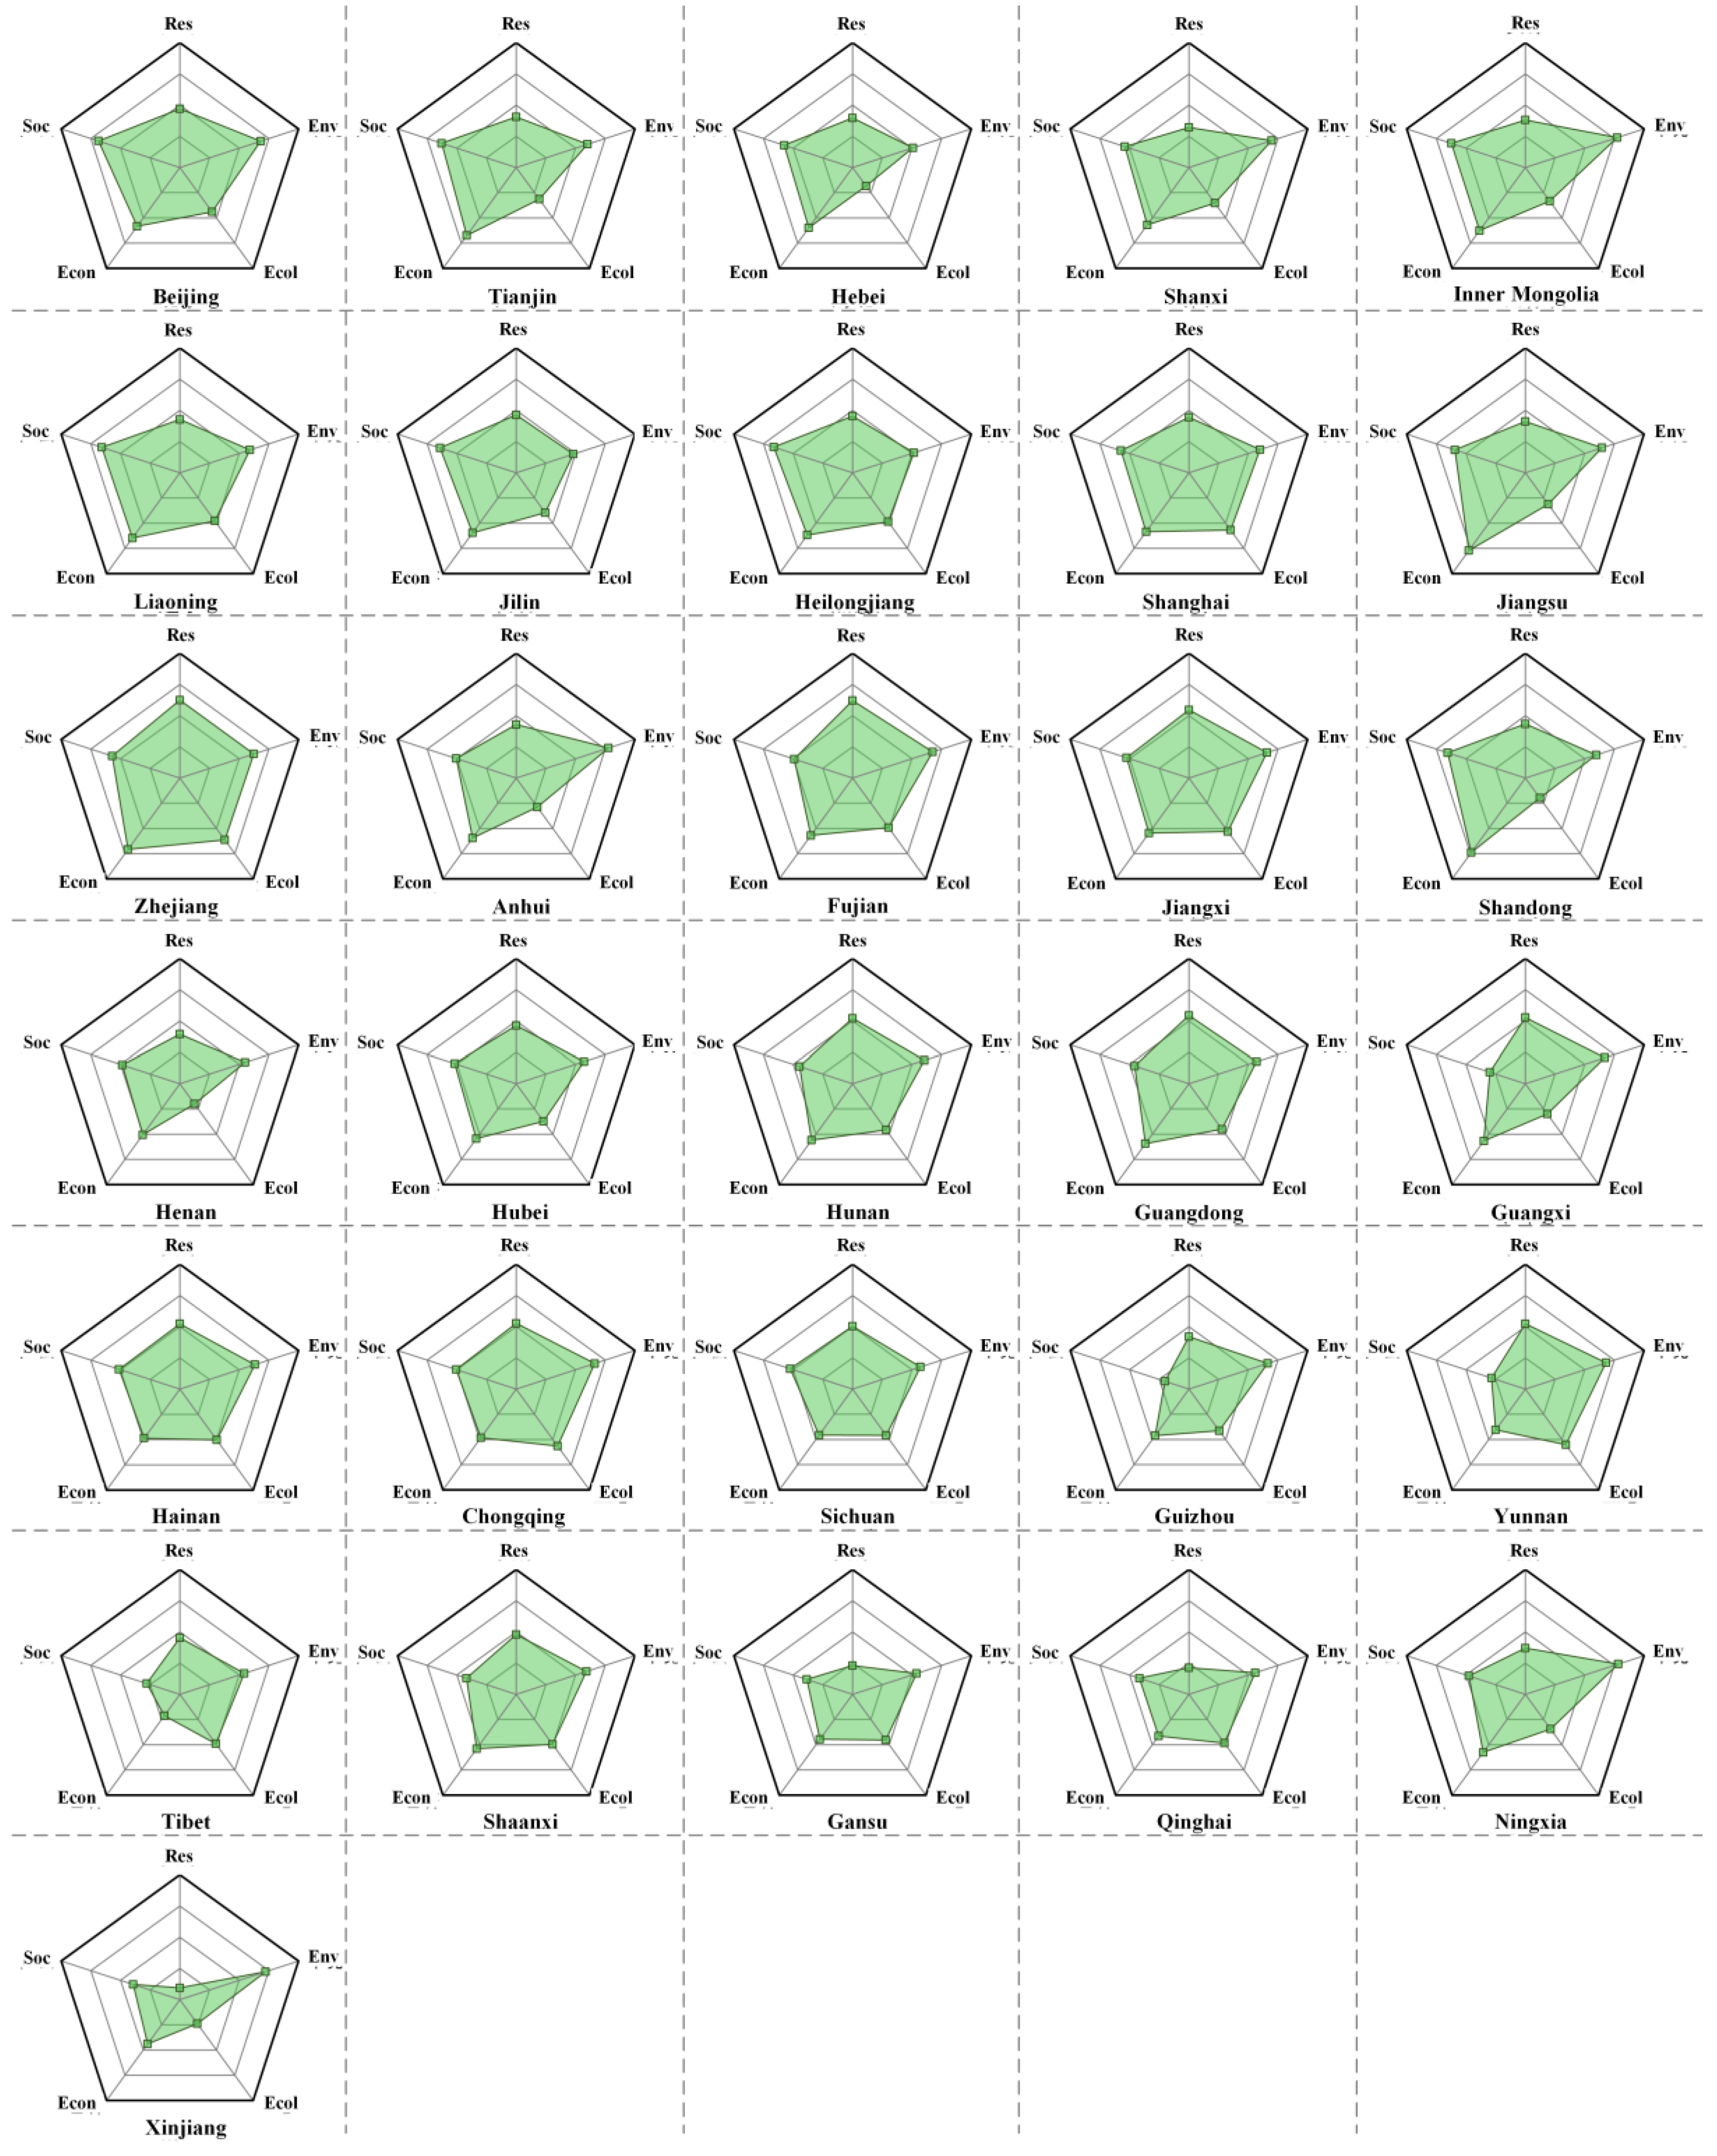
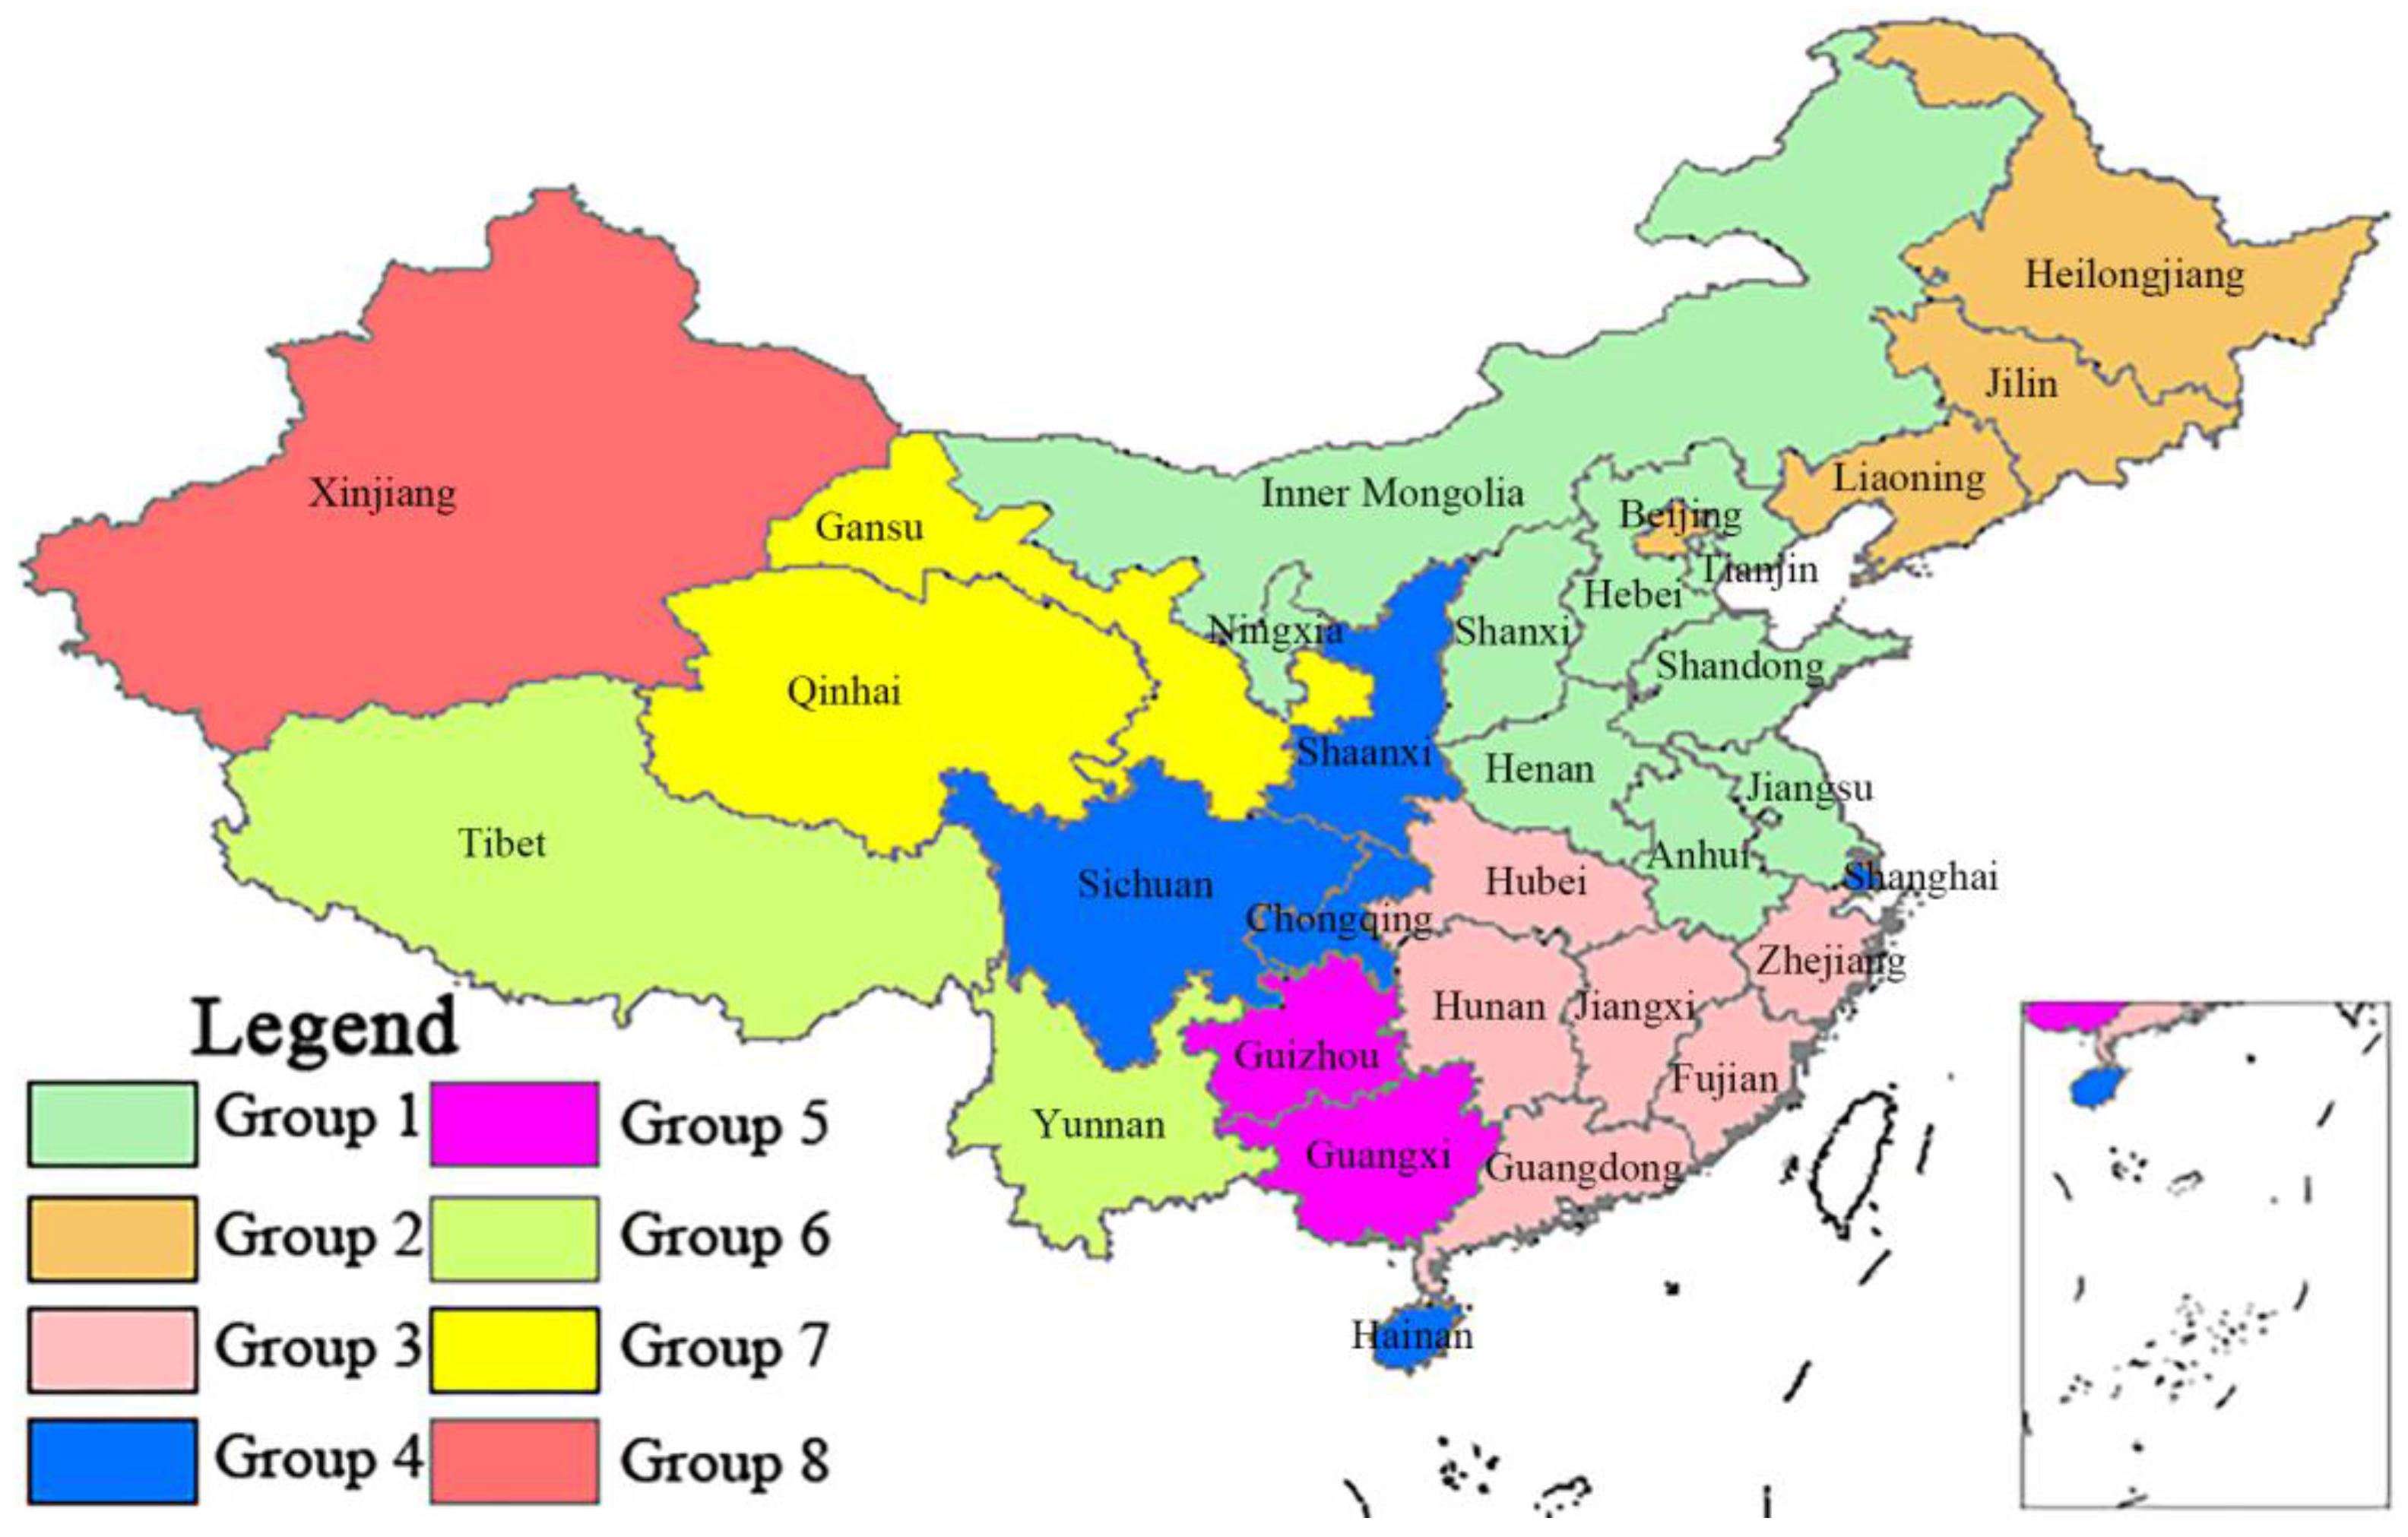
5.1. Analyzing Subsystem Coordination Degree of PARs
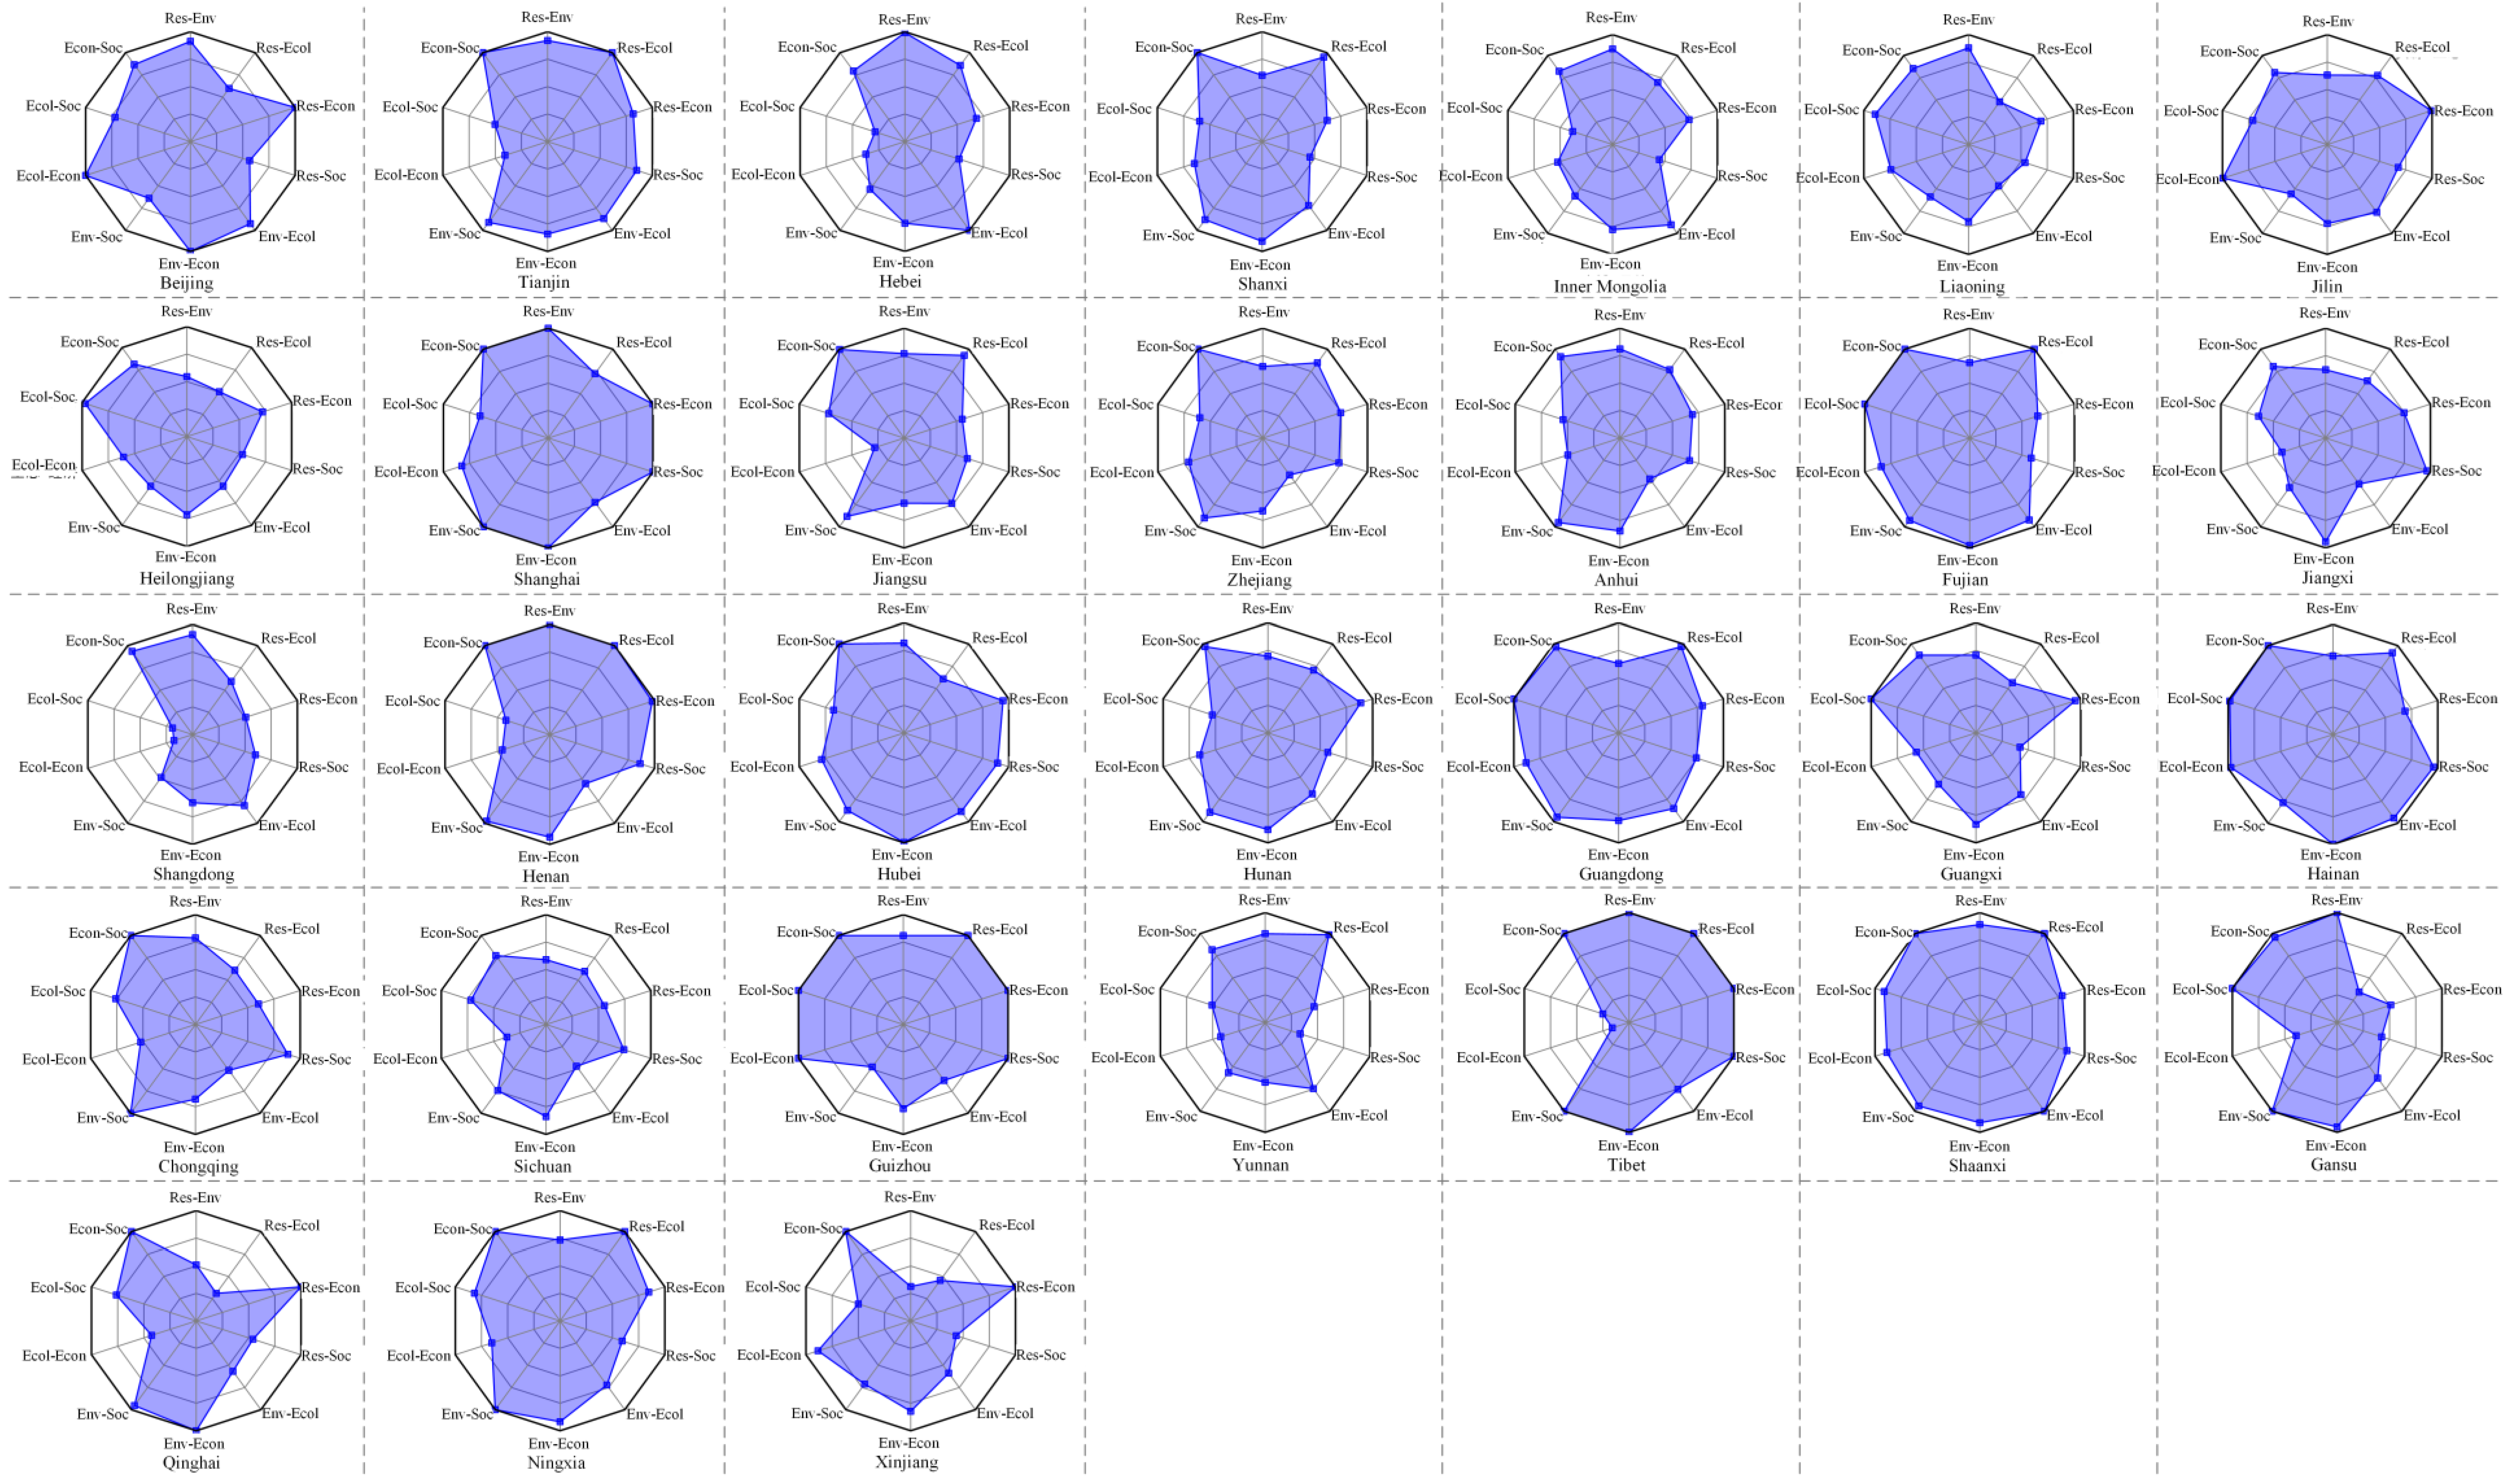
5.2. Analysis of Inter-Subsystem Coordination Degrees of PARs
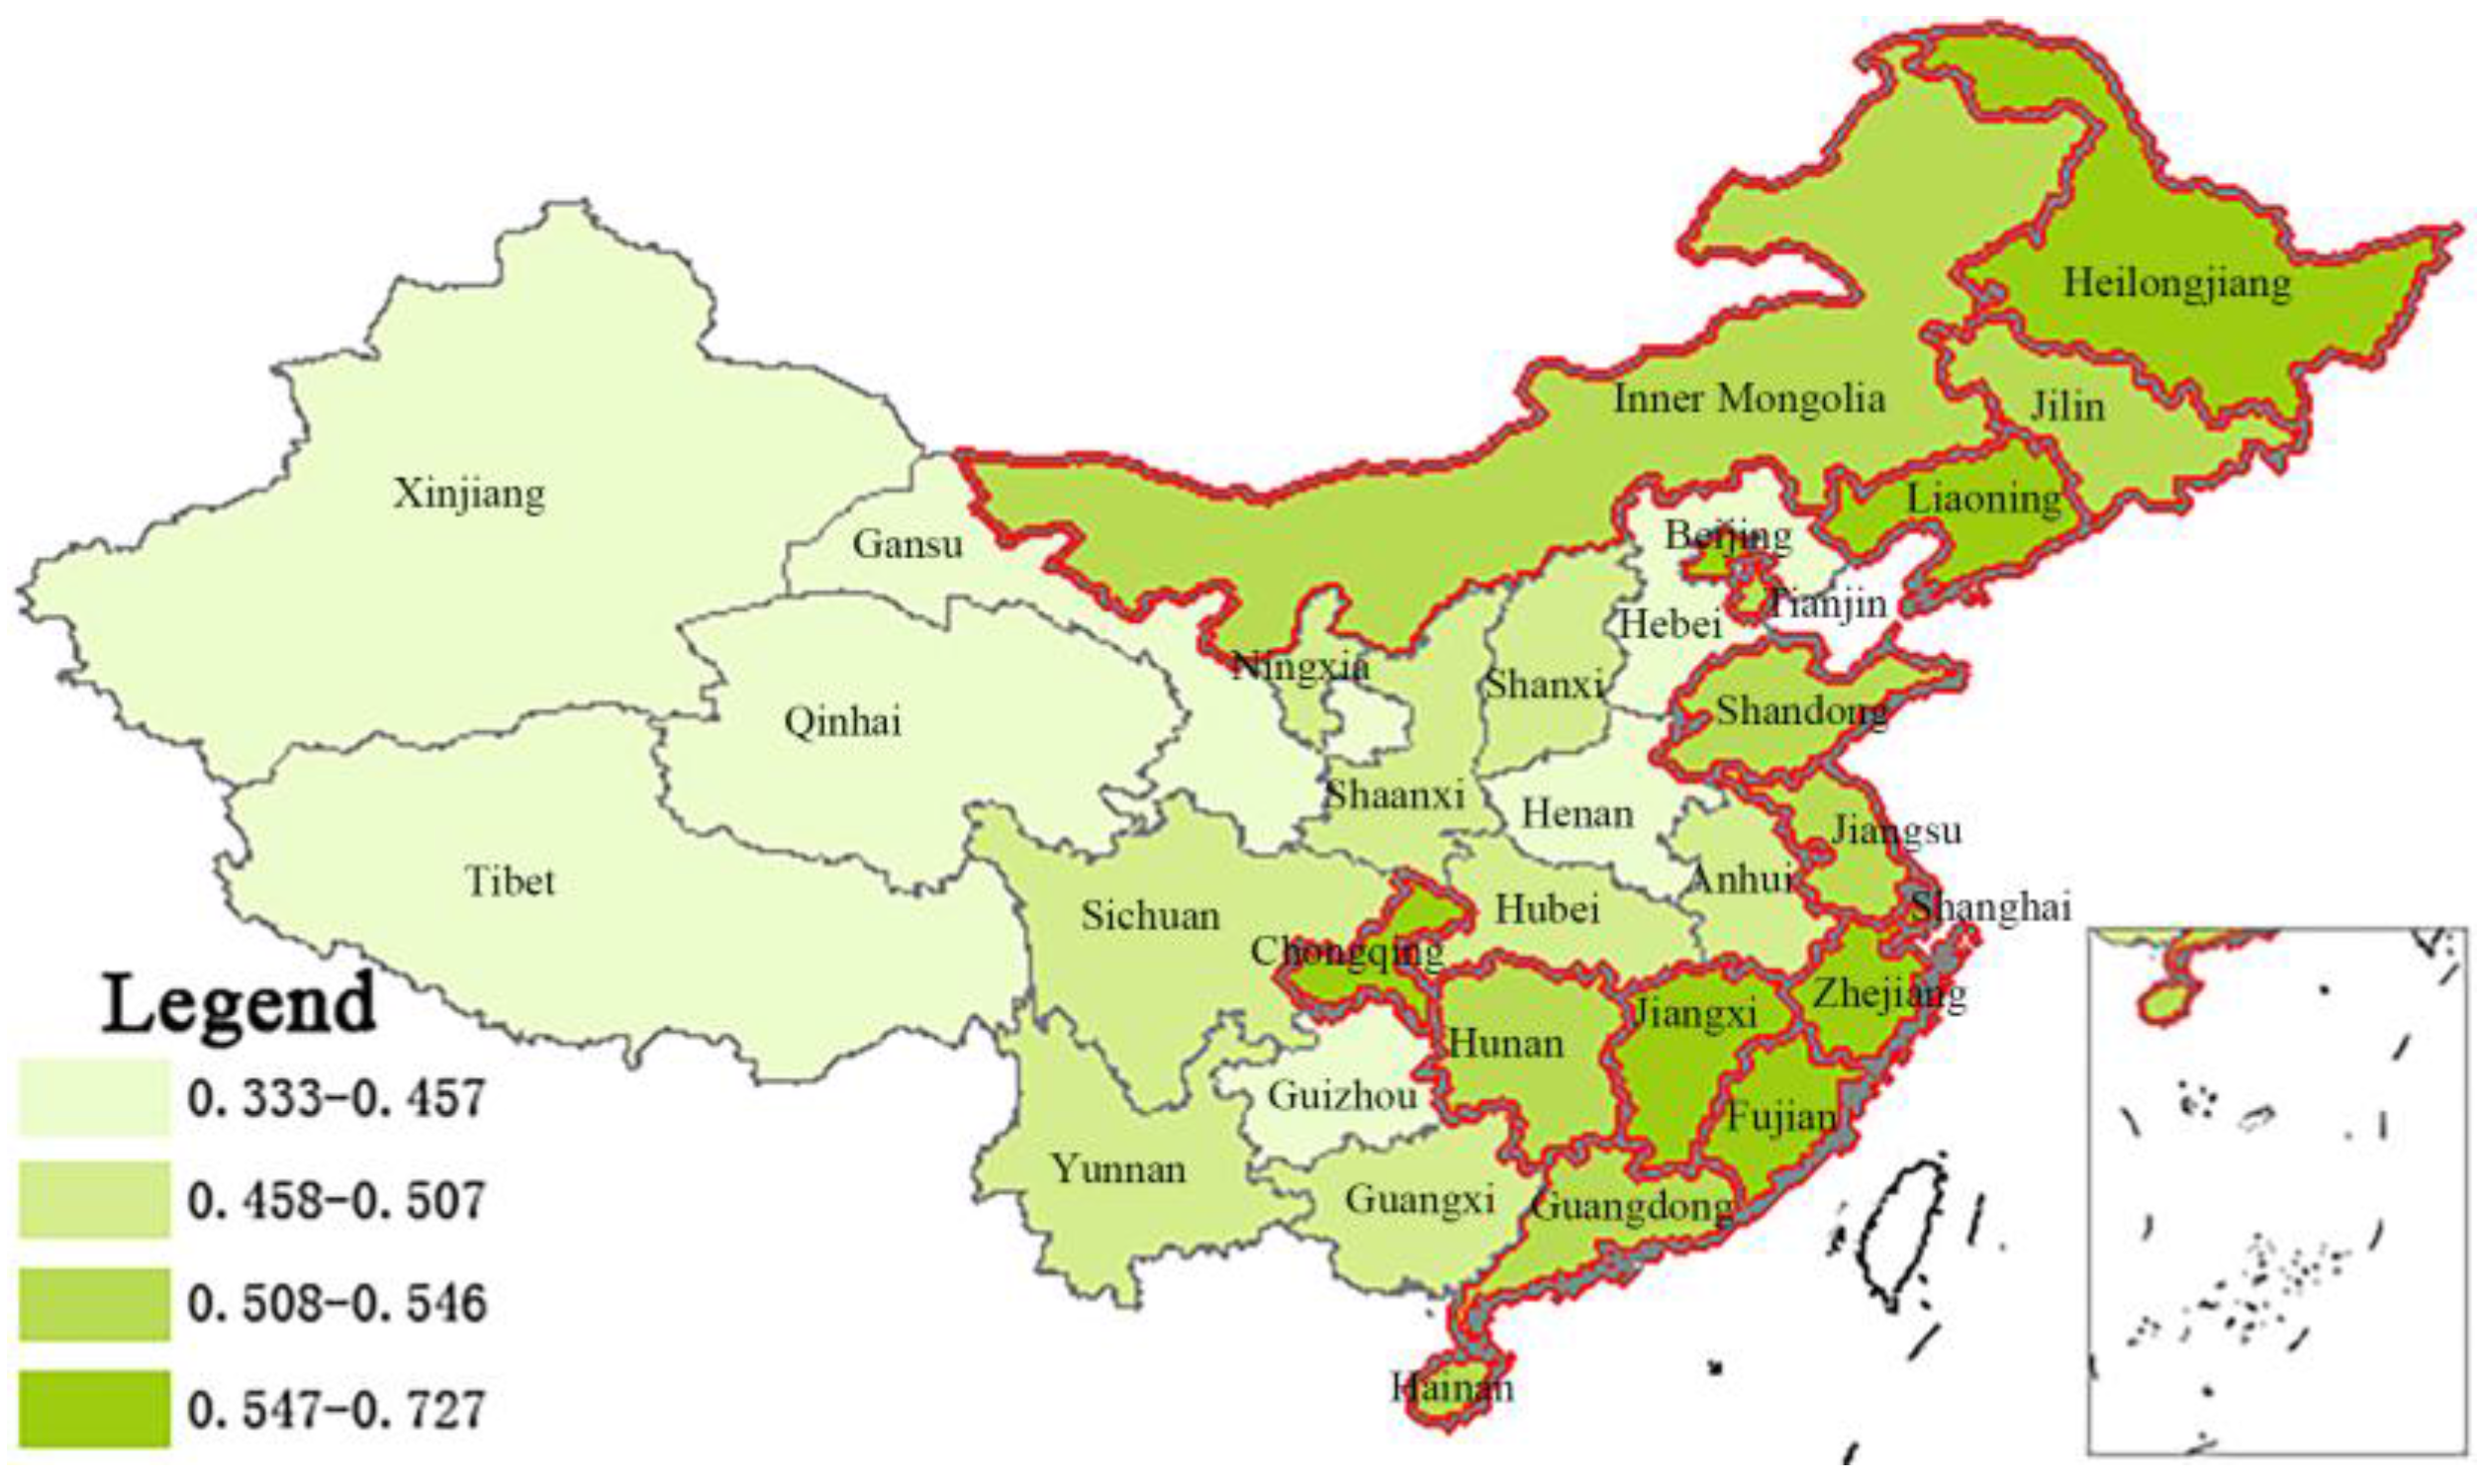
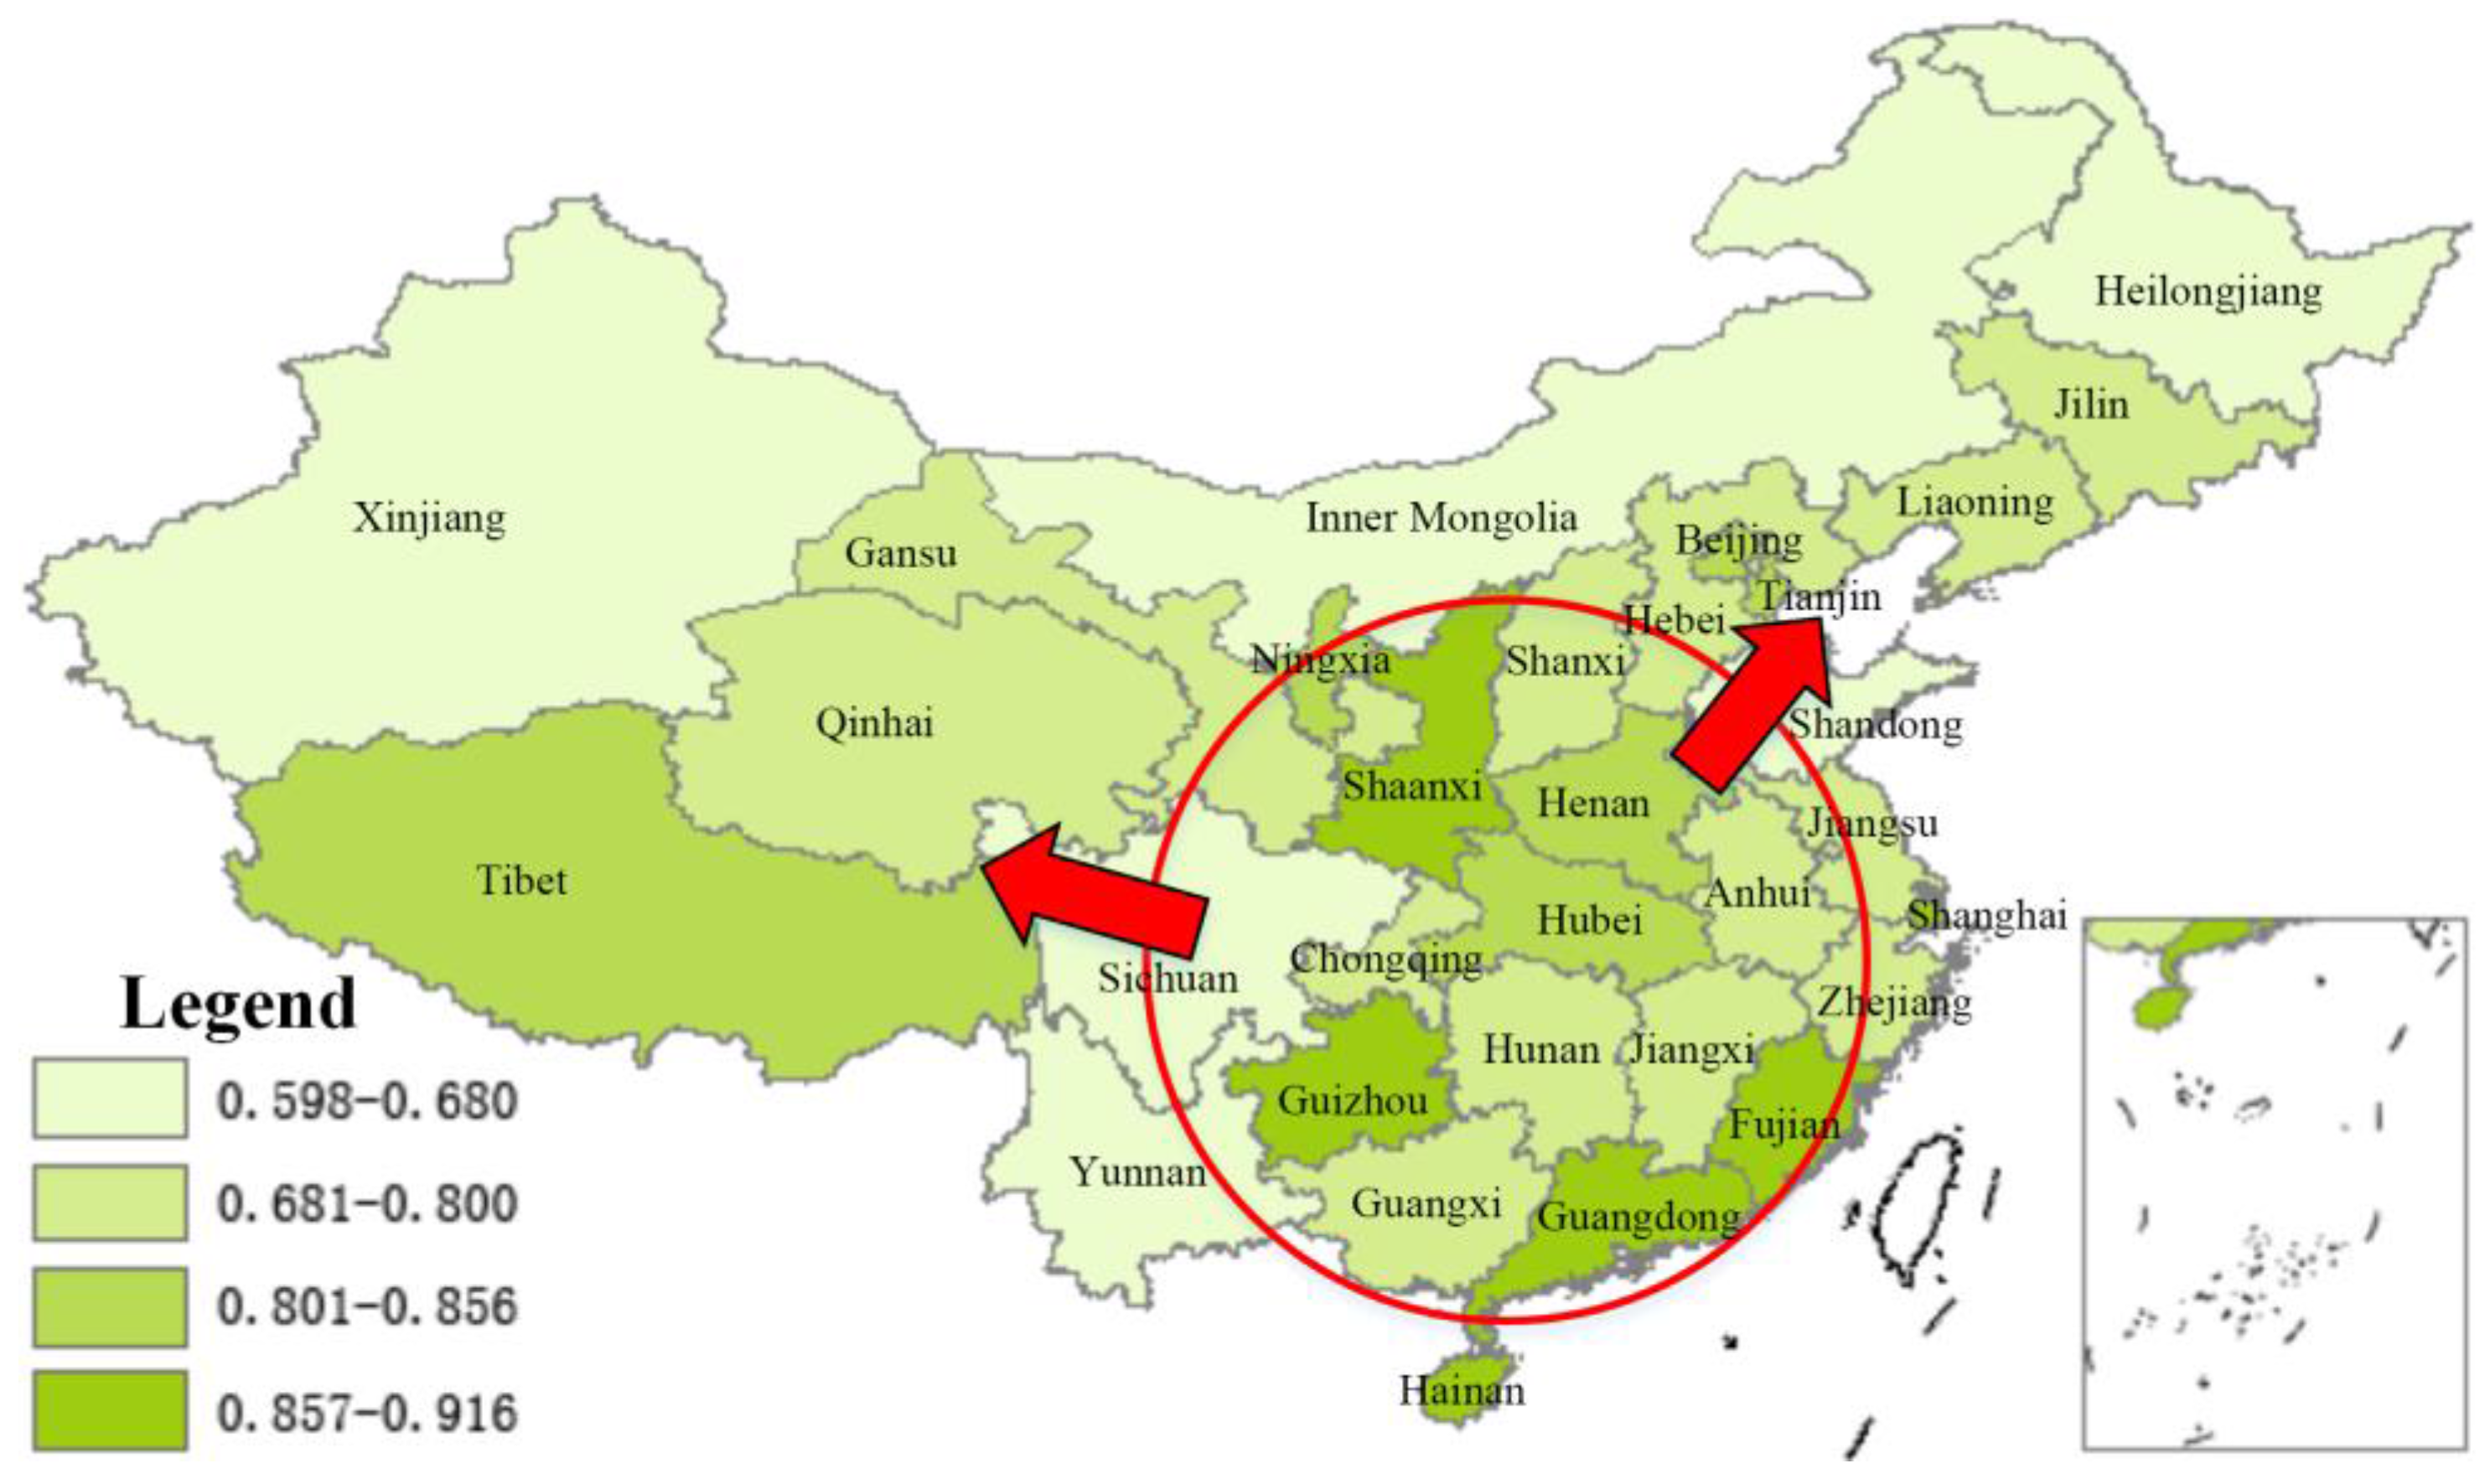
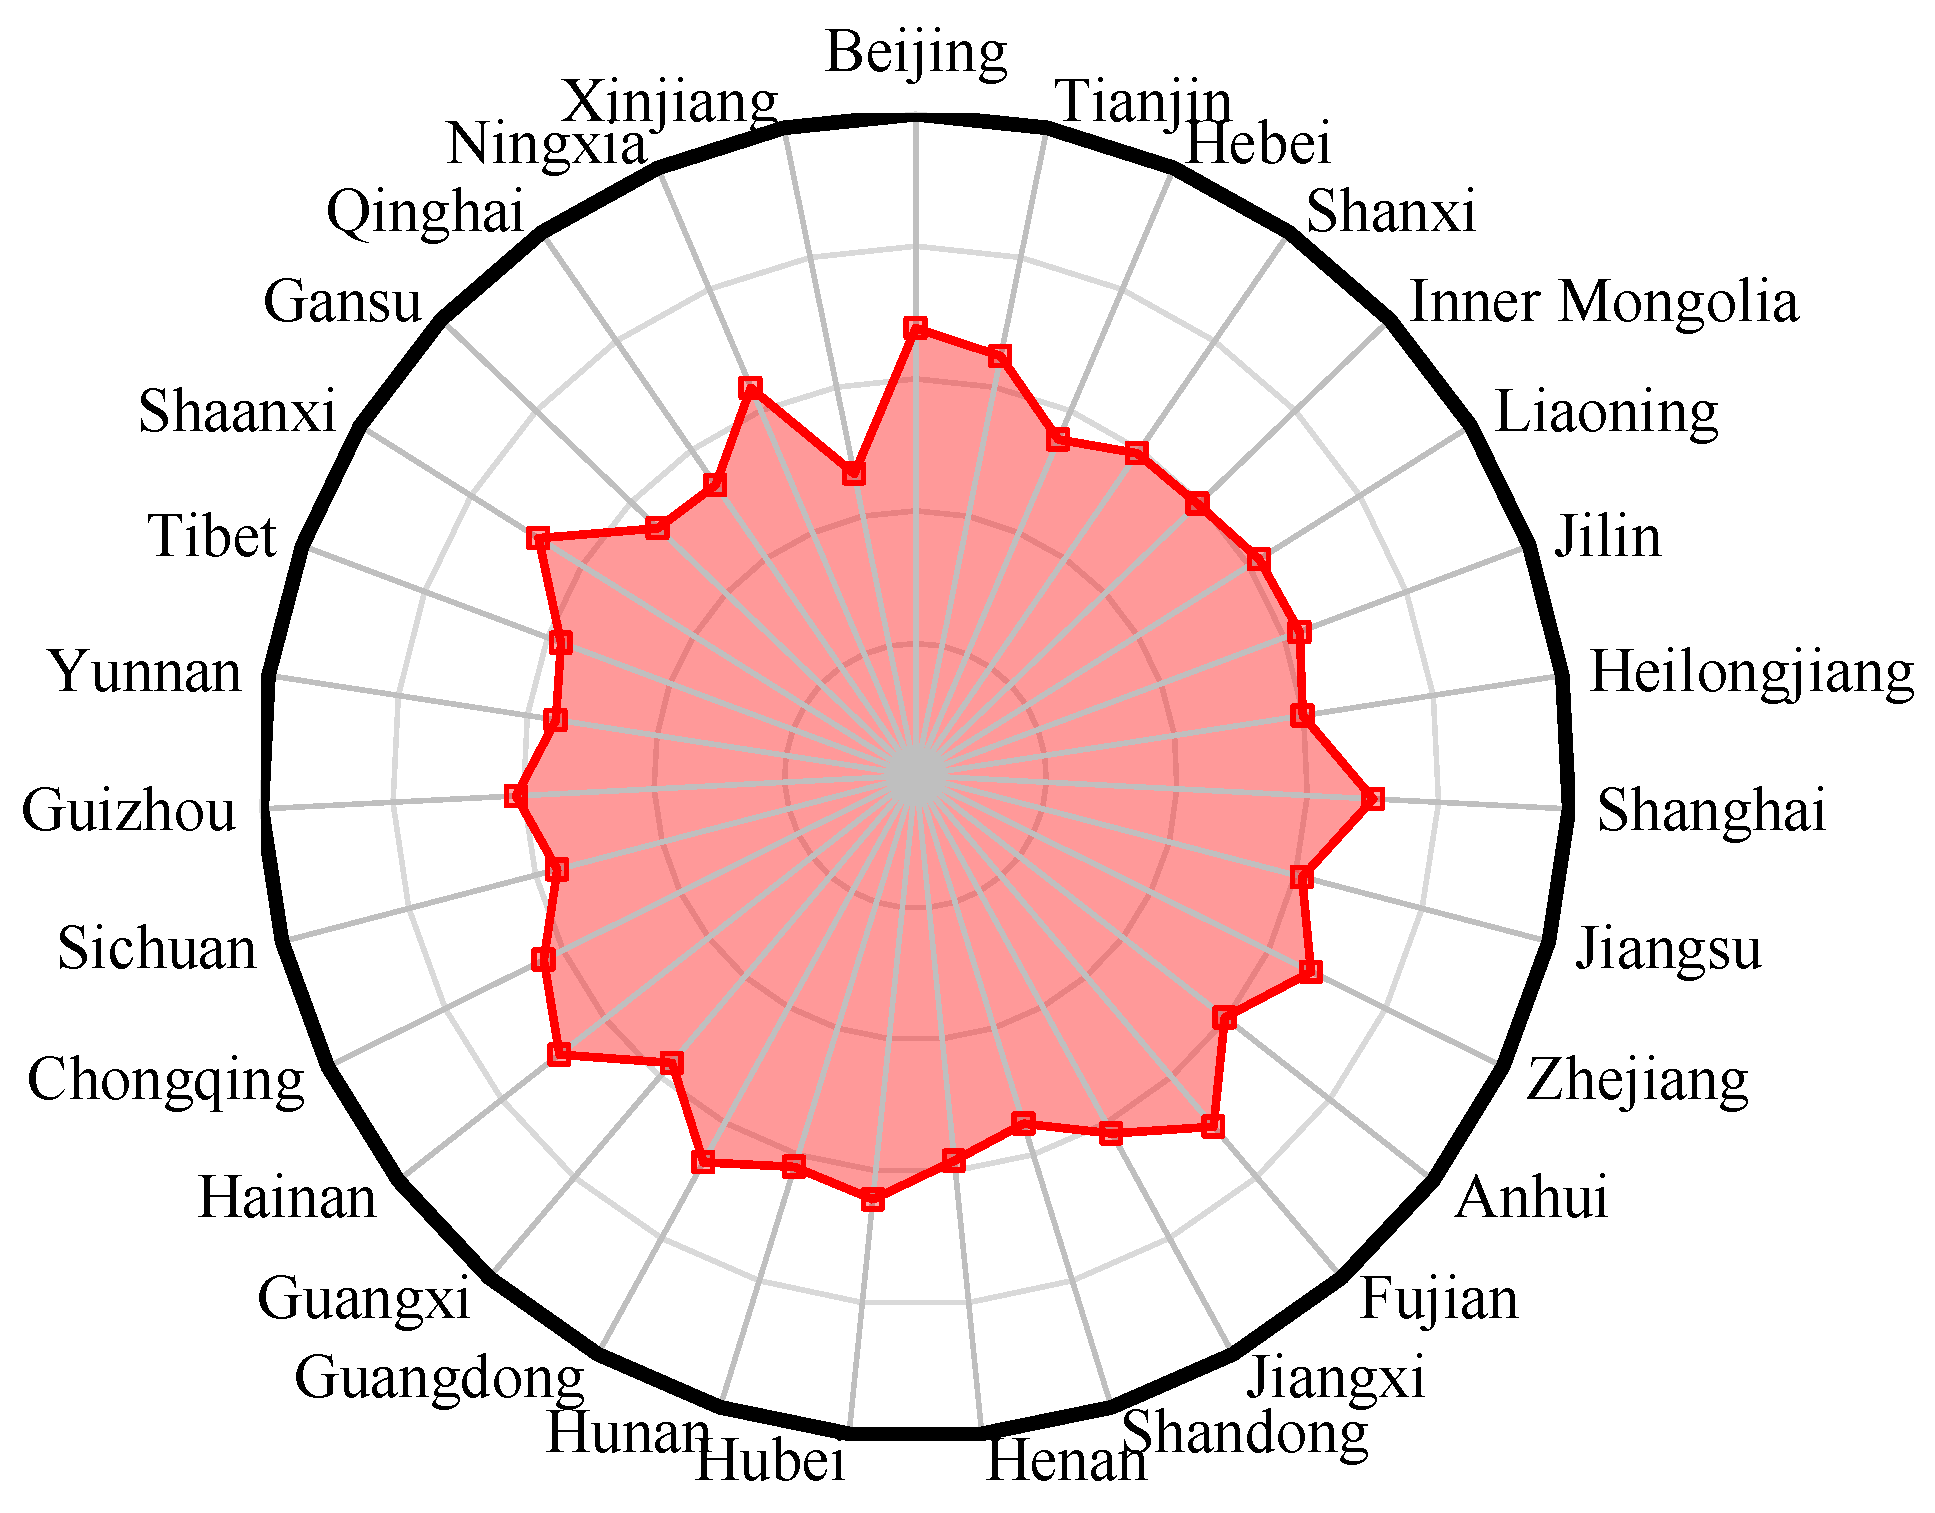
5.3. Analyzing Comprehensive Coordination Degree of CSR3ES
5.4. Improvement and Measures for the Regional Coordinated Development of PARs
6. Discussion and Conclusions
Acknowledgments
Author Contributions
Conflicts of Interest
References
- Kelly, K.L. A systems approach to identifying decisive information for sustainable development. Eur. J. Oper. Res. 1998, 109, 452–464. [Google Scholar] [CrossRef]
- Parris, T.M.; Kates, R.W. Characterizing and measuring sustainable development. Annu. Rev. Environ. Resour. 2003, 28, 1–1328. [Google Scholar] [CrossRef]
- Lele, S.M. Sustainable development: A critical review. World Dev. 1991, 19, 607–621. [Google Scholar] [CrossRef]
- Lin, Z.M.; Xia, B. Analysis of sustainable development ability of the urban ecosystem in Guangzhou City in the perspective of entropy. Acta Geogr. Sin. 2013, 68, 45–57. (In Chinese) [Google Scholar]
- Jordan, S.J.; Hayes, S.E.; Yoskowitz, D.; Smith, L.M.; Summers, J.K.; Russell, M. Accounting for natural resources and environmental sustainability: Linking ecosystem services to human well-being. Environ. Sci. Technol. 2010, 44, 1530–1536. [Google Scholar] [CrossRef] [PubMed]
- Sachs, J.D. Challenges of sustainable development under globalization. Int. J. Dev. Issues 2005, 4, 1–20. [Google Scholar] [CrossRef]
- Young, O.R.; Lambin, E.F.; Alcock, F.; Haberl, H.; Karlsson, S.Y.; McConnell, W.J.; Myint, T.; Pahl-Wostl, C.; Polsky, C.; Ramakrishnan, P.S.; et al. A Portfolio Approach to Analyzing Complex Human-Environment Interactions: Institutions and Land Change. Ecol. Soc. 2006, 11, 3213–3217. [Google Scholar]
- Liu, Y.Q.; Xu, J.P.; Luo, H.W. An Integrated Approach to Modelling the Economy-Society-Ecology System in Urbanization Process. Sustainability 2014, 6, 1946–1972. [Google Scholar] [CrossRef]
- Boone, R.B.; Galvin, K.A. Simulation as an approach to social-ecological integration, with an emphasis on agent-based modeling. In Understanding Society and Natural Resources; Springer Netherlands: Dordrecht, The Netherlands, 2014; pp. 179–202. [Google Scholar]
- Giddings, B.; Hopwood, B.; O’Brien, G. Environment, economy and society: Fitting them together into sustainable development. Sustain. Dev. 2002, 10, 187–196. [Google Scholar] [CrossRef]
- Wang, J.H.; Tian, J.H.; Li, X.Y.; Ma, Y.J.; Yi, W.J. Evaluation of concordance between environment and economy in Qinghai Lake Watershed, Qinghai Tibet Plateau. J. Geogr. Sci. 2011, 21, 949–960. (In Chinese) [Google Scholar] [CrossRef]
- Mao, H.Y. Study on Coordinating Development of Economic, Social Growth with Population, Resources and Environment at County Level. Acta Geogr. Sin. 1991, 46, 385–395. (In Chinese) [Google Scholar]
- Wang, H.; Liu, F.; Yuan, Y.; Liang, W. Spatial-Temporal Analysis of the Economic and Environmental Coordination Development Degree in Liaoning Province. Geogr. J. 2013, 2013, 1–8. [Google Scholar] [CrossRef]
- Guo, Y.T.; Wang, H.W.; Nijkamp, P.; Wu, J.G. Space-time indicators in interdependent urban-environmental systems: A study on the Huai River Basin in China. Habitat Int. 2015, 45, 135–146. [Google Scholar] [CrossRef]
- Guan, D.J.; Gao, W.J.; Su, W.C.; Li, H.F.; Hokao, K. Modeling and dynamic assessment of urban economy-resource-environment system with a coupled system dynamics—Geographic information system model. Ecol. Ind. 2011, 11, 1333–1344. [Google Scholar] [CrossRef]
- Tao, S.; Cai, J.M.; Chahine, T.; Xu, H.; Niu, F.Q. Modeling urban metabolism of Beijing city, China: With a coupled system dynamics: Emergy model. Stoch. Environ. Res. Risk Assess. 2014, 28, 1511–1524. [Google Scholar]
- Wei, Y.M.; Tsai, H.T.; Fan, Y.; Zeng, R. Beijing’s coordinated development of population, resources, environment, and economy. Int. J. Sustain. Dev. World Ecol. 2004, 11, 235–246. [Google Scholar] [CrossRef]
- Yan, L.; Luo, B.R.; Ma, Y.Z.; Liu, H.L. The Structure and Application of Huge Closed-Loop System of Resources-Environment-Ecology. In Proceedings of the 2012 International Conference on Cybernetics and Informatics, Chongqing, China, 21–23 September 2012; Springer: New York, NY, USA, 2014; pp. 1047–1053. [Google Scholar]
- Li, Y.R.; Wang, J.; Liu, Y.S.; Long, H.L. Spatial pattern and influencing factors of the coordination development of industrialization, informatization, urbanization and agricultural modernization in China: A prefecture level exploratory spatial data analysis. Acta Geogr. Sin. 2014, 69, 199–212. (In Chinese) [Google Scholar]
- Zhang, X.; Hu, H.; Xu, J.; Yin, H.W. Coordination of urbanization and water ecological environment in Shayinghe River Basin, China. Chin. Geogr. Sci. 2011, 21, 476–495. (In Chinese) [Google Scholar] [CrossRef]
- Li, Z.J. A Correct Understanding of Resource, Environment and Ecology. Green China 2013, 10, 46–51. (In Chinese) [Google Scholar]
- Haken, H. Synergtics: The Mysteries of Nature; Shanghai Translation Publishing House: Shanghai, China, 2005. [Google Scholar]
- Vattam, S.; Goel, A.K.; Rugaber, S.; Hmelo-Silver, C.E.; Jordan, R.; Gray, S.; Sinha, S. Understanding Complex Natural Systems by Articulating Structure-Behavior-Function Models. Educ. Technol. Soc. 2011, 14, 66–81. [Google Scholar]
- Miguel, M.S.; Johnson, J.H.; Kertesz, J.; Kaski, K.; Díaz-Guilera, A.; MacKay, R.S.; Loreto, V.; Érdi, P.; Helbing, D. Challenges in complex systems science. Eur. Phys. J. Special Top. 2012, 214, 245–271. [Google Scholar] [CrossRef]
- Hubbard, G.D. Geographic Conditions, Influences, Controls. Ohio J. Sci. 1932, 32, 39–54. [Google Scholar]
- Espinosa, A.; Porter, T. Sustainability, complexity and learning: Insights from complex systems approaches. Learn. Organ. 2011, 18, 54–72. [Google Scholar]
- Šiljak, D.D. When is a complex ecosystem stable? Math. Biosci. 1975, 25, 25–50. [Google Scholar] [CrossRef]
- Chen, C.; Huang, X.; Chen, C.L. The Coordination and Regulation of Areal System in China. Sci. Geogr. Sin. 2010, 30, 321–328. (In Chinese) [Google Scholar]
- Ioppolo, G.; Heijungs, R.; Cucurachi, S.; Salomone, R.; Kleijn, R. Urban Metabolism: Many open questions for future answers. In Pathways to Environmental Sustainability: Methodologies and Experiences; Salomone, R., Saija, G., Eds.; Springer International Publishing AG: Dordrecht, The Netherlands, 2014; pp. 23–32. [Google Scholar]
- National Bureau of Statistics of China. China Statistical Yearbook; China Statistics Press: Beijing, China, 2014. (In Chinese)
- National Bureau of Statistics of China, Ministry of Environment Protection of the People’s Republic of China. China’s Statistical Yearbook on Environment; China Statistics Press: Beijing, China, 2014. (In Chinese)
- Ministry of Land and Resources of the People’s Republic of China. China Land and Resources Statistical Yearbook; Geological Publishing House: Beijing, China, 2014. (In Chinese)
- China Water Conservancy Yearbook Compilation Committee. China Water Conservancy Yearbook; Water & Power Press: Beijing, China, 2014. (In Chinese) [Google Scholar]
- Hwang, C.L.; Yoon, K. Methods for Multiple Attribute Decision Making; Springer Berlin Heidelberg: Berlin, Germany, 1981; pp. 58–191. [Google Scholar]
- Xu, X.M.; Niu, D.X.; Qiu, J.P.; Wu, M.Q.; Wang, P.; Qian, W.Y.; Jin, X. Comprehensive Evaluation of Coordination Development for Regional Power Grid and Renewable Energy Power Supply Based on Improved Matter Element Extension and TOPSIS Method for Sustainability. Sustainability 2016, 8, 143–159. [Google Scholar] [CrossRef]
- Zhang, S.H.; Wang, G.Q.; Yang, J.; Huang, L.Q.; Li, L.Q.; Qiao, F. Ecological restoration decision using compound system theory. J. Tsinghua Univ. 2011, 50, 1906–1909. (In Chinese) [Google Scholar]


| Category | Feature | Common Method |
|---|---|---|
| Distance type | Long-term, macroeconomic, static, whole, complex | Deviation coefficient method, membership function method, gene coefficient method, set pair analysis, data envelopment analysis and so on |
| Change type | Transient, dynamic, local, complex | Grey system model, differential coefficient method and so on |
| Integrated type | Long-term, static, whole, simple | Geometric mean method, coupling degree method and so on |
| PARs | Res | Env | Ecol | Econ | Soc | CCD |
|---|---|---|---|---|---|---|
| Beijing | 0.4699 | 0.6815 | 0.4403 | 0.5831 | 0.6858 | 0.5655 |
| Tianjin | 0.4043 | 0.6015 | 0.3148 | 0.6743 | 0.6283 | 0.5143 |
| Hebei | 0.3963 | 0.5086 | 0.1840 | 0.5974 | 0.5764 | 0.4423 |
| Shanxi | 0.3203 | 0.6975 | 0.3536 | 0.5688 | 0.5400 | 0.4799 |
| Inner Mongolia | 0.3796 | 0.7745 | 0.3332 | 0.6250 | 0.6237 | 0.5267 |
| Liaoning | 0.4266 | 0.5909 | 0.4776 | 0.6468 | 0.6578 | 0.5566 |
| Jilin | 0.4635 | 0.4816 | 0.3961 | 0.5964 | 0.6424 | 0.5159 |
| Heilongjiang | 0.4531 | 0.5172 | 0.4860 | 0.6177 | 0.6647 | 0.5473 |
| Shanghai | 0.4437 | 0.5985 | 0.5683 | 0.5847 | 0.5731 | 0.5527 |
| Jiangsu | 0.4104 | 0.6457 | 0.3126 | 0.7715 | 0.5939 | 0.5310 |
| Zhejiang | 0.6242 | 0.6231 | 0.6138 | 0.7070 | 0.5702 | 0.6268 |
| Anhui | 0.4284 | 0.7782 | 0.2886 | 0.5946 | 0.5051 | 0.4993 |
| Fujian | 0.6206 | 0.6756 | 0.4916 | 0.5691 | 0.4920 | 0.5686 |
| Jiangxi | 0.5456 | 0.6576 | 0.5303 | 0.5458 | 0.5254 | 0.5604 |
| Shandong | 0.4332 | 0.5975 | 0.1983 | 0.7384 | 0.655 | 0.5081 |
| Henan | 0.3937 | 0.5499 | 0.2006 | 0.5060 | 0.4849 | 0.4158 |
| Hubei | 0.4631 | 0.5714 | 0.3725 | 0.5438 | 0.5188 | 0.4904 |
| Hunan | 0.5210 | 0.6051 | 0.4573 | 0.5594 | 0.4468 | 0.5158 |
| Guangdong | 0.5436 | 0.5696 | 0.4497 | 0.5939 | 0.458 | 0.5204 |
| Guangxi | 0.5271 | 0.6686 | 0.2998 | 0.5670 | 0.2992 | 0.4583 |
| Hainan | 0.5225 | 0.6324 | 0.5037 | 0.4868 | 0.5124 | 0.5313 |
| Chongqing | 0.5263 | 0.6618 | 0.5653 | 0.4827 | 0.5062 | 0.5488 |
| Sichuan | 0.5030 | 0.5721 | 0.4592 | 0.4569 | 0.5256 | 0.5029 |
| Guizhou | 0.4190 | 0.6635 | 0.4132 | 0.4621 | 0.202 | 0.4292 |
| Yunnan | 0.5228 | 0.6797 | 0.5519 | 0.4044 | 0.2853 | 0.4937 |
| Tibet | 0.4527 | 0.5428 | 0.4905 | 0.2120 | 0.2793 | 0.4004 |
| Shaanxi | 0.4791 | 0.5914 | 0.4959 | 0.5391 | 0.4189 | 0.5041 |
| Gansu | 0.2300 | 0.5394 | 0.4535 | 0.4454 | 0.3856 | 0.4077 |
| Qinghai | 0.2127 | 0.5585 | 0.4838 | 0.4142 | 0.4183 | 0.4127 |
| Ningxia | 0.3702 | 0.7826 | 0.3448 | 0.5752 | 0.4762 | 0.4915 |
| Xinjiang | 0.0938 | 0.7235 | 0.2389 | 0.4391 | 0.3933 | 0.3333 |
| Subsystem | Top Ten | Bottom Ten |
|---|---|---|
| Resources | Zhejiang, Fujian, Jiangxi, Guangdong, Guangxi, Chongqing, Yunnan, Hainan, Hunan, Sichuan | Jiangsu, Tianjin, Hebei, Henan, Inner Mongolia, Ningxia, Shanxi, Gansu, Qinghai, Xinjiang |
| Environment | Ningxia, Anhui, Inner Mongolia, Xinjiang, Shanxi, Beijing, Yunnan, Fujian, Guangxi, Guizhou | Sichuan, Hubei, Guangdong, Qinghai, Henan, Tibet, Gansu, Heilongjiang, Hebei, Jilin |
| Ecology | Zhejiang, Shanghai, Chongqing, Yunnan, Jiangxi, Hainan, Shaanxi, Fujian, Tibet, Heilongjiang | Ningxia, Inner Mongolia, Tianjin, Jiangsu, Guangxi, Anhui, Xinjiang, Henan, Shandong, Hebei |
| Economy | Jiangsu, Shandong, Zhejiang, Tianjin, Liaoning, Inner Mongolia, Heilongjiang, Hebei, Jilin, Anhui | Henan, Hainan, Chongqing, Guizhou, Sichuan, Gansu, Xinjiang, Qinghai, Yunnan, Tibet |
| Society | Beijing, Heilongjiang, Liaoning, Shandong, Jilin, Tianjin, Inner Mongolia, Jiangsu, Hebei, Shanghai | Guangdong, Hunan, Shaanxi, Qinghai, Xinjiang, Gansu, Guangxi, Yunnan, Tibet, Guizhou |
| PARs | Res-Env | Res-Ecol | Res-Econ | Res-Soc | Env-Ecol | Env-Econ | Env-Soc | Ecol-Econ | Ecol-Soc | Econ-Soc | CCD |
|---|---|---|---|---|---|---|---|---|---|---|---|
| Beijing | 0.9134 | 0.5977 | 1.0000 | 0.5656 | 0.9256 | 1.0000 | 0.6379 | 1.0000 | 0.7176 | 0.8659 | 0.8102 |
| Tianjin | 0.9199 | 1.0000 | 0.8176 | 0.8501 | 0.8683 | 0.8429 | 0.9099 | 0.4057 | 0.5010 | 1.0000 | 0.8163 |
| Hebei | 0.9923 | 0.8566 | 0.6826 | 0.5179 | 1.0000 | 0.7446 | 0.5385 | 0.3721 | 0.2832 | 0.7938 | 0.6907 |
| Shanxi | 0.6038 | 0.9509 | 0.6220 | 0.4581 | 0.7190 | 0.9093 | 0.8798 | 0.6464 | 0.5967 | 1.0000 | 0.7341 |
| Inner Mongolia | 0.8701 | 0.6983 | 0.7304 | 0.4463 | 0.9053 | 0.7761 | 0.5795 | 0.5229 | 0.3798 | 0.8238 | 0.6731 |
| Liaoning | 0.8808 | 0.4808 | 0.6902 | 0.5383 | 0.4652 | 0.7034 | 0.5907 | 0.7414 | 0.8901 | 0.8544 | 0.6878 |
| Jilin | 0.6332 | 0.7779 | 0.9941 | 0.6774 | 0.7655 | 0.7194 | 0.5574 | 0.9937 | 0.7097 | 0.8107 | 0.7587 |
| Heilongjiang | 0.5452 | 0.5034 | 0.7237 | 0.5315 | 0.5605 | 0.7121 | 0.5605 | 0.6048 | 0.9700 | 0.8141 | 0.6541 |
| Shanghai | 1.0000 | 0.7246 | 1.0000 | 1.0000 | 0.7242 | 1.0000 | 1.0000 | 0.8239 | 0.6494 | 1.0000 | 0.8892 |
| Jiangsu | 0.7692 | 0.9292 | 0.5552 | 0.6035 | 0.7366 | 0.5943 | 0.8812 | 0.2801 | 0.7183 | 0.9962 | 0.7001 |
| Zhejiang | 0.6526 | 0.8469 | 0.7453 | 0.7288 | 0.4161 | 0.6651 | 0.9000 | 0.7071 | 0.5997 | 1.0000 | 0.7224 |
| Anhui | 0.8119 | 0.7693 | 0.6914 | 0.6634 | 0.4607 | 0.8460 | 0.9508 | 0.4975 | 0.5423 | 0.9166 | 0.7141 |
| Fujian | 0.6867 | 1.0000 | 0.6496 | 0.5884 | 0.9218 | 0.9782 | 0.9258 | 0.8426 | 1.0000 | 1.0000 | 0.8590 |
| Jiangxi | 0.6225 | 0.6448 | 0.7484 | 0.9684 | 0.5174 | 0.9452 | 0.5571 | 0.4171 | 0.6387 | 0.8072 | 0.6813 |
| Shandong | 0.9090 | 0.5966 | 0.5072 | 0.6012 | 0.8005 | 0.6223 | 0.4833 | 0.1768 | 0.1907 | 0.9350 | 0.5981 |
| Henan | 1.0000 | 1.0000 | 0.9775 | 0.8620 | 0.5528 | 0.9352 | 0.9762 | 0.4531 | 0.4188 | 1.0000 | 0.8232 |
| Hubei | 0.8172 | 0.6072 | 0.9461 | 0.8932 | 0.8851 | 0.9976 | 0.8723 | 0.7853 | 0.6718 | 1.0000 | 0.8462 |
| Hunan | 0.6974 | 0.7079 | 0.8866 | 0.5727 | 0.6877 | 0.8802 | 0.8937 | 0.6494 | 0.5302 | 0.9708 | 0.7437 |
| Guangdong | 0.6328 | 0.9696 | 0.8007 | 0.7411 | 0.8519 | 0.7985 | 0.9493 | 0.8823 | 1.0000 | 0.9661 | 0.8573 |
| Guangxi | 0.7079 | 0.5646 | 0.9485 | 0.4215 | 0.6960 | 0.8335 | 0.5771 | 0.5679 | 1.0000 | 0.8746 | 0.7127 |
| Hainan | 0.7142 | 0.9187 | 0.6889 | 0.9602 | 0.9417 | 1.0000 | 0.7694 | 0.9729 | 0.9837 | 1.0000 | 0.8927 |
| Chongqing | 0.7887 | 0.6089 | 0.6021 | 0.8829 | 0.5167 | 0.6800 | 1.0000 | 0.5222 | 0.7602 | 1.0000 | 0.7303 |
| Sichuan | 0.5900 | 0.5976 | 0.5580 | 0.7429 | 0.4708 | 0.8396 | 0.7446 | 0.3742 | 0.7164 | 0.7756 | 0.6349 |
| Guizhou | 0.8096 | 1.0000 | 1.0000 | 1.0000 | 0.6311 | 0.7685 | 0.4782 | 1.0000 | 1.0000 | 1.0000 | 0.8707 |
| Yunnan | 0.8076 | 0.9865 | 0.4677 | 0.3345 | 0.7465 | 0.5460 | 0.5663 | 0.4228 | 0.5060 | 0.8193 | 0.6254 |
| Tibet | 1.0000 | 1.0000 | 1.0000 | 1.0000 | 0.7549 | 1.0000 | 1.0000 | 0.1591 | 0.2494 | 1.0000 | 0.8341 |
| Shaanxi | 0.8919 | 1.0000 | 0.7875 | 0.8317 | 1.0000 | 0.9141 | 0.9408 | 0.8855 | 0.9118 | 0.9989 | 0.9155 |
| Gansu | 1.0000 | 0.3420 | 0.5120 | 0.4253 | 0.6264 | 0.9513 | 1.0000 | 0.3904 | 1.0000 | 0.9592 | 0.7244 |
| Qinghai | 0.5088 | 0.3091 | 1.0000 | 0.5413 | 0.5683 | 1.0000 | 0.9532 | 0.4253 | 0.7620 | 1.0000 | 0.6955 |
| Ningxia | 0.7327 | 1.0000 | 0.8467 | 0.5931 | 0.7224 | 0.9192 | 1.0000 | 0.6509 | 0.8159 | 1.0000 | 0.8261 |
| Xinjiang | 0.3136 | 0.4555 | 1.0000 | 0.4347 | 0.5875 | 0.8234 | 0.7111 | 0.8833 | 0.4989 | 1.0000 | 0.6511 |
| Inter-Subsystem | Top Ten | Bottom Ten |
|---|---|---|
| Resource-Environment | Shanghai, Henan, Tibet, Gansu, Hebei, Tianjin, Beijing, Shandong, Shaanxi, Liaoning | Fujian, Zhejiang, Jilin, Guangdong, Jiangxi, Shanxi, Sichuan, Heilongjiang, Qinghai, Xinjiang |
| Resource-Ecology | Tianjin, Fujian, Henan, Guizhou, Tibet, Shaanxi, Ningxia, Yunnan, Guangdong, Shanxi | Hubei, Beijing, Sichuan, Shandong, Guangxi, Heilongjiang, Liaoning, Xinjiang, Gansu, Qinghai |
| Resource-Economy | Beijing, Shanghai, Guizhou, Tibet, Qinghai, Xinjiang, Jilin, Henan, Guangxi, Hubei | Hainan, Hebei, Fujian, Shanxi, Chongqing, Sichuan, Jiangsu, Gansu, Shandong, Yunnan |
| Resource-Society | Shanghai, Guizhou, Tibet, Jiangxi, Hainan, Hubei, Chongqing, Henan, Tianjin, Shaanxi | Qinghai, Liaoning, Heilongjiang, Hebei, Shanxi, Inner Mongolia, Xinjiang, Gansu, Guangxi, Yunnan |
| Environment-Ecology | Hebei, Shaanxi, Hainan, Beijing, Fujian, Inner Mongolia, Hubei, Tianjin, Guangdong, Shandong | Xinjiang, Qinghai, Heilongjiang, Henan, Jiangxi, Chongqing, Sichuan, Liaoning, Anhui, Zhejiang |
| Environment-Economy | Beijing, Shanghai, Hainan, Tibet, Qinghai, Hubei, Fujian, Gansu, Jiangxi, Henan | Guizhou, Hebei, Jilin, Heilongjiang, Liaoning, Chongqing, Zhejiang, Shandong, Jiangsu, Yunnan |
| Environment-Society | Shanghai, Chongqing, Tibet, Gansu, Ningxia, Henan, Qinghai, Anhui, Guangdong, Shaanxi | Liaoning, Inner Mongolia, Guangxi, Yunnan, Heilongjiang, Jilin, Jiangxi, Hebei, Shandong, Guizhou |
| Ecology-Economy | Beijing, Guizhou, Jilin, Hainan, Shaanxi, Xinjiang, Guangdong, Fujian, Shanghai, Hubei | Qinghai, Yunnan, Jiangxi, Tianjin, Gansu, Sichuan, Hebei, Jiangsu, Shandong, Tibet |
| Ecology-Society | Fujian, Guangdong, Guangxi, Guizhou, Gansu, Hainan, Heilongjiang, Shaanxi, Liaoning, Ningxia | Anhui, Hunan, Yunnan, Tianjin, Xinjiang, Henan, Inner Mongolia, Hebei, Tibet, Shandong |
| Economy-Society | Tianjin, Shanxi, Shanghai, Zhejiang, Fujian, Henan, Hubei, Hainan, Chongqing, Guizhou | Guangxi, Beijing, Liaoning, Inner Mongolia, Yunnan, Heilongjiang, Jilin, Jiangxi, Hebei, Sichuan |
| PARs | CCD | 1 | PARs | CCD | 1 | PARs | CCD | 1 |
|---|---|---|---|---|---|---|---|---|
| Beijing | 0.6769 | >0 | Anhui | 0.5971 | >0 | Sichuan | 0.5651 | >0 |
| Tianjin | 0.6479 | >0 | Fujian | 0.6989 | >0 | Guizhou | 0.6113 | >0 |
| Hebei | 0.5527 | >0 | Jiangxi | 0.6179 | >0 | Yunnan | 0.5557 | >0 |
| Shanxi | 0.5935 | >0 | Shandong | 0.5513 | >0 | Tibet | 0.5779 | >0 |
| Inner Mongolia | 0.5954 | >0 | Henan | 0.5851 | >0 | Shaanxi | 0.6794 | >0 |
| Liaoning | 0.6187 | >0 | Hubei | 0.6442 | >0 | Gansu | 0.5435 | >0 |
| Jilin | 0.6257 | >0 | Hunan | 0.6194 | >0 | Qinghai | 0.5357 | >0 |
| Heilongjiang | 0.5983 | >0 | Guangdong | 0.6679 | >0 | Ningxia | 0.6372 | >0 |
| Shanghai | 0.7010 | >0 | Guangxi | 0.5715 | >0 | Xinjiang | 0.4658 | >0 |
| Jiangsu | 0.6097 | >0 | Hainan | 0.6887 | >0 | |||
| Zhejiang | 0.6729 | >0 | Chongqing | 0.6331 | >0 |
| PARs | Improvement Directions for Inner-Subsystem | Improvement Directions for Inter-Subsystems | Improvement Measures |
|---|---|---|---|
| Beijing | Ecology | Resources–Society | Improve ecology and resources subsystems to achieve coordinated development between resources and society subsystems. |
| Tianjin | Ecology | Ecology–Economy | Improve ecology subsystem to achieve coordinated development between ecology and economy subsystems. |
| Hebei | Ecology | Ecology–Society | Improve ecology subsystem to achieve coordinated development between ecology and society subsystems. |
| Shanxi | Resources | Resources–Society | Improve resources subsystem to achieve coordinated development between resources and society subsystems. |
| Inner Mongolia | Ecology | Ecology–Society | Improve ecology subsystem to achieve coordinated development between ecology and society subsystems. |
| Liaoning | Resources | Environment–Ecology | Improve environment and ecology subsystems to achieve their coordinated development. |
| Jilin | Ecology | Environment–Society | Improve environment and society subsystems to achieve coordinated development between environment and society subsystems. |
| Heilongjiang | Resources | Resources–Ecology | Improve resources and ecology subsystems to achieve their coordinated development. |
| Shanghai | Resources | Ecology–Society | Improve resources subsystem to achieve coordinated development between ecology and society subsystems. |
| Jiangsu | Ecology | Ecology–Economy | Improve ecology subsystem to achieve coordinated development between ecology and economy subsystems. |
| Zhejiang | Social | Environment–Ecology | Improve society subsystem to achieve coordinated development between environment and ecology subsystems. |
| Anhui | Ecology | Environment–Ecology | Improve ecology subsystem to achieve coordinated development between environment and ecology subsystems. |
| Fujian | Ecology | Resources–Society | Improve ecology and society subsystems to achieve coordinated development between resources and society subsystems. |
| Jiangxi | Social | Ecology–Economy | Improve to society subsystem to achieve their coordinated development between ecology and economy subsystems. |
| Shandong | Ecology | Ecology–Economy | Improve ecology subsystem to achieve coordinated development between ecology and economy subsystems. |
| Henan | Ecology | Ecology–Society | Improve ecology subsystem to achieve coordinated development between ecology and society. subsystems |
| Hubei | Ecology | Resources–Ecology | Improve ecology and resources subsystems to achieve their coordinated development. |
| Hunan | Society | Ecology–Society | Improve ecology and society subsystems to achieve their coordinated development. |
| Guangdong | Ecology | Resources–Environment | Improve ecology subsystem to achieve coordinated development between resources and environment subsystems. |
| Guangxi | Society | Resources–Society | Improve society subsystem to achieve coordinated development between resources and society subsystems. |
| Hainan | Economy | Resources–Economy | Improve economy subsystem to achieve coordinated development between resources and economy subsystems. |
| Chongqing | Economy | Environment–ecology | Improve economy subsystem to achieve coordinated development between environment and ecology subsystems. |
| Sichuan | Economy | Ecology–Economy | Improve economy and ecology subsystems to achieve their coordinated development. |
| Guizhou | Society | Environment–Society | Improve society subsystem to achieve coordinated development between environment and society subsystems. |
| Yunnan | Society | Resources–Society | Improve society subsystem to achieve coordinated development between society and resources subsystems. |
| Tibet | Economy | Ecology–Economy | Improve economy subsystem to achieve coordinated development between ecology and economy subsystems. |
| Shaanxi | Society | Resources–Economy | Improve society subsystem to achieve coordinated development between resources and economy subsystems. |
| Gansu | Resources | Resources–Ecology | Improve resources subsystem to achieve coordinated development between resources and ecology subsystems. |
| Qinghai | Resources | Resources–Ecology | Improve resources subsystem to achieve coordinated development between resources and ecology subsystems. |
| Ningxia | Ecology | Resources–Society | Improve resources subsystem to achieve coordinated development between resources and society subsystems. |
| Xinjiang | Resources | Resources–Environment | Improve resources subsystem to achieve coordinated development between resources and environment subsystems. |
© 2016 by the authors; licensee MDPI, Basel, Switzerland. This article is an open access article distributed under the terms and conditions of the Creative Commons Attribution (CC-BY) license (http://creativecommons.org/licenses/by/4.0/).
Share and Cite
Xie, M.; Wang, J.; Chen, K. Coordinated Development Analysis of the “Resources-Environment-Ecology-Economy-Society” Complex System in China. Sustainability 2016, 8, 582. https://0-doi-org.brum.beds.ac.uk/10.3390/su8060582
Xie M, Wang J, Chen K. Coordinated Development Analysis of the “Resources-Environment-Ecology-Economy-Society” Complex System in China. Sustainability. 2016; 8(6):582. https://0-doi-org.brum.beds.ac.uk/10.3390/su8060582
Chicago/Turabian StyleXie, Mingxia, Jiayao Wang, and Ke Chen. 2016. "Coordinated Development Analysis of the “Resources-Environment-Ecology-Economy-Society” Complex System in China" Sustainability 8, no. 6: 582. https://0-doi-org.brum.beds.ac.uk/10.3390/su8060582