Article

Evaluation of Sustainable Development of Resources-Based Cities in Shanxi Province Based on Unascertained Measure

Institute of Geographic Sciences and Natural Resources Research, the Chinese Academy of Sciences, Beijing 100101, China
*
Author to whom correspondence should be addressed.
Sustainability 2016, 8(6), 585; https://0-doi-org.brum.beds.ac.uk/10.3390/su8060585
Submission received: 31 March 2016 / Revised: 25 May 2016 / Accepted: 16 June 2016 / Published: 22 June 2016

Abstract

:
An index system is established for evaluating the level of sustainable development of resources-based cities, and each index is calculated based on the unascertained measure model for 11 resources-based cities in Shanxi Province in 2013 from three aspects; namely, economic, social, and resources and environment. The result shows that Taiyuan City enjoys a high level of sustainable development and integrated development of economy, society, and resources and environment. Shuozhou, Changzhi, and Jincheng have basically realized sustainable development. However, Yangquan, Linfen, Lvliang, Datong, Jinzhong, Xinzhou and Yuncheng have a low level of sustainable development and urgently require a transition. Finally, for different cities, we propose different countermeasures to improve the level of sustainable development.

1. Introduction

In 1987, the World Commission on Environment and Development (WCED) proposed the concept of “sustainable development”. In 1996, the first official reference to “sustainable cities” was raised at the Second United Nations Human Settlements Conference, namely, as being comprised of economic growth, social equity, higher quality of life and better coordination between urban areas and the natural environment [1]. Since then, the research on sustainable cities has increasingly been gaining attention. Evaluating sustainable development is the basis of urban sustainable development research, and precise evaluation is key in guiding the formulation and implementation the sustainable development strategy. At present, China has become the world’s second largest economy and the largest consumer of energy and emitter of carbon emissions. The urbanization process in China has a profound impact on the global ecological environment. Therefore, the implementation of sustainable development is the only viable way for Chinese urbanization to continue [2,3,4], while meeting the urgent requirements of the international situation. The promotion of sustainable development in resource-based cities, that is a city that is heavily dependent on its natural resources, is one of the major strategic issues in the current Chinese urbanization process.
The Chinese State Council has released the 2013–2020 National Planning for Sustainable Development of Resources-Based Cities [5] (hereafter referred to as the Planning), showing the nation’s high priority of the transition of resources-based cities to a sustainable model of development. A total of 262 resources-based cities are included in the scope of the Planning, including 10 prefecture-level cities and three county-level cities in Shanxi Province.
Resources-based cities have emerged and prospered by relying on the exploitation of natural resources and primary processing industries. Since the resources processing cost is lower than that of other forms of production, the natural resources industries have higher output and attract more talent to these cities. This further increases the dependence of economic and social development on natural resources industries in these cities. However, given the non-renewable nature and continued exhaustion of natural resources, the resources-based cities and natural resources industries will eventually decline. Even on a global scale, the transition of resources-based cities is inevitable. Thus, sustainable development is a must for resources-based cities, and the core issue is to realize comprehensive exploitation and utilization of mineral resources, increase the resources utilization rate and reduce environmental damage and waste, so as to finally realize integrated development of economy, society, and resources and environment.
Existing studies on sustainable development of resources-based cities generally cover the various aspects of transition policy, transition mechanisms, transition pathways, and some achievements that have been made concerning transition evaluation [6,7,8,9,10,11,12,13,14,15,16,17]. The evaluation index system of the sustainable development of resources-based cities is developed by reference to the latest research trend in general theory for sustainable development both inside and outside of China, and the inherent features of the resources-based cities are considered. The evaluation of sustainable development of resources-based cities has attracted increasing attention recently. Zhao et al. [18] employed analytic hierarchy process (AHP), and Li et al. [19] used BP neural network in establishing an evaluation index system of sustainable development of mining cities, which was composed of 22 indices in four aspects; economic, social, resources, and environment. Liu [20] applied principal component analysis to the evaluation of comprehensive development of Huangshi City, Hubei Province from 2000 to 2002. Hao et al. [21] applied entropy theory to the quantification of inherent information of resources-based cities dependent on coal for the given year. By assigning different weights to the indices, the evaluation index system of sustainable development was established from four aspects; namely, economic, social, and resources and environment. This system was then used for the evaluation of the overall sustainable development of Jixi City from 1995 to 2000. Sha et al. [22] established the evaluation index system of sustainable development for mining economic zones, which consisted of 17 indices under five subsystems: economic, social, environmental, resources, and intellectual. Later, they used principal component analysis for the evaluation of sustainable development of mining economic zones in Anhui Province in 2011. Wang et al. [23] performed an empirical analysis on 11 prefecture-level cities in Shanxi Province and established the evaluation index system of transition efficiency from three aspects: economic, social and resources and environment. Classification and comparison were carried out on the transition efficiency of 11 prefecture-level cities in 2008–2013 using DEA confrontational cross-evaluation. Zhang [24] applied the principle of system dynamics to the issue of sustainable development in Hebi City, providing new insight into industrial structure optimization. Zeng et al. [25] established the evaluation index system of circular economy development for resources-based cities, and carried out an empirical analysis on the resources-based cities by combining factor analysis and clustering analysis.
In recent years, many modern mathematical methods such as Analytic Hierarchy Process (AHP) [18,26,27,28], multi-criteria decision analysis [28,29], principal component analysis [20], system dynamics [24], etc. have been widely used to the research the evaluation of sustainable development, and positive results achieved in practical applications. However, sustainable development of resources-based cities is a multi-index decision-making process of uncertain problems. Because the mining method selection is an uncertain multi-index problem with multiple targets, not only considering many quantitative indices, but also a large number of qualitative indices would result in great uncertainty and vagueness. Unascertained theory can better integrate these uncertain data, then analyze by synthesis, and provide a better approach to solve such problems. Currently, the theory has been widely used in the social sciences and natural sciences. However, it is insufficient to only use unascertained measure to confirm the complex index system. AHP uses research objects as a system, in accordance with the decomposition, comparative judgment, and comprehensive thinking mode, to make decisions. It is able to divide various factors into a complex system of an orderly hierarchy that is interconnected and systematized. Through analyzing objective reality, according to the relative importance of each level, it quantifies using mathematical methods to determine the relative importance order weights of all the elements of each level. To this end, the author optimizes the combination of the unascertained measure theory and the analytic hierarchy process, building a comprehensive evaluation model of sustainable development of resources-based cities. This evaluation model was used for 11 cities in Shanxi Province, with a focus on research comparing the level of sustainable development of resource-based cities. Finally, according to the different circumstances of each city, suggestions are made for sustainable development of resources-based cities.

2. Construction of Evaluation Index System

2.1. Selection Principle of Evaluation Index

For the evaluation system of sustainable development of resources-based cities, there are four basic principles when selecting specific index [30] as follows.
(1)
Scientific: An evaluation system of sustainable development of resources-based cities should be set up on a scientific basis, so that we can scientifically, objectively and accurately measure and reflect the level of sustainable development of such cities.
(2)
Completeness: A scientific evaluation index system requires that each index can be selected as an organic whole, is visible from all levels, and all angles fully, and accurately reflect and describe the level of sustainable development of resources-based cities.
(3)
Typicality: The index must have a typical representation that accurately reflects the level of sustainable development. Each index cannot be too complicated or overlapping, but cannot be too simple either, avoiding omissions, errors, or reflecting false phenomenon.
(4)
Maneuverability: Because the evaluation system of sustainable development of resources-based cities is a complex system, an index must be chosen that has strong measurability and comparability, with a focus on accessibility of index data, simple choosing, easy collecting, and being a representative index with a simple measurement method that is easy to implement.

2.2. Determination of the Evaluation Index

Since 1992, when the United Nations Environment and Development Conference was held in Rio de Janeiro, the international community has continued to promote the implementation of various sustainable development plans and agendas. In 1994, China adopted “The Administrative Center for China‘s Agenda: 21” [31], which proposed to promote integrated economic, social, environmental and resource strategies for sustainable development objectives. Therefore, this paper based on the idea of resource-based city situation and sustainable development, with reference to relevant research results [18,19,20,21,22,23,26,27,28,29,32] and combining with the real conditions in Shanxi Province, and finally establishes a comprehensive index from three aspects, economy, society, and resources and environment, and 12 specific indices.
(1)
Economic indices include GDP per capita, industrial output per capita, fiscal revenue per capita, added value of the three major industries, proportion of added value of the three major industries to GDP, and fixed assets investment per capita.
(2)
Social indices include the total population of a city at the end of the year, employed population of a city, income per capita of a city, and residential area per capita.
(3)
Resources and environmental indices include resource inventory, mining scale, the level of resources utilization, output value of natural resources industries, waste disposal capacity, land reclamation and processing, frequency of an excellent air quality rating, green area per capita, and green ratio.
Resources and environmental dimensions are combined into one, and thus three dimensions, economic, social, and resources and environment, are evaluated. The evaluation index system established consists of 12 indices (Table 1).

3. The Unascertained Measure

The idea of Uncertainty was proposed in 1848, when Mill published The Principles of Political Economy. The mathematician Kolmogorov brought attention to stochastic problems as he firstly proposed in 1933, and established the probability theory and axiomatic approach [33]. In 1965, Zadeh created fuzzy set theory, and proposed the idea of fuzzy information, and developed uncertainty research area [34]. In 1982, Deng founded the gray system theory [35]. In 1990, the scientist Wang put forward unascertained information according to the research needs of the construction engineering theory [36]. In 1991, Wang establish universal grey set based on the gray system theory, which contains various types of uncertainty information [37]. From the research of many scholars, uncertain information can presently be summarized into the four categories of fuzzy information, random information, unascertained information and gray information.
Currently, fuzzy information, random information and gray information of the uncertainty information had defined identities, but Chinese scholars still hold a different understanding of unascertained information. Research in this area has two main schools of thought internationally; they are Shafer’s credibility theory [38] and Zadeh’s credibility theory of fuzzy mathematics [39]. Although theorists do not have a clear and common definition for unascertained information, but most generally agreed that it basically represents a state where the decision-makers have insufficient information to determine the real state and the number relationship. That is, the limitations of both subjective and objective conditions contribute to an unclear understanding and insufficient information for decision-makers. This is different from randomness for the future, and fuzziness which cannot give something a clear definition and evaluation, and it is also different from the features of gray information.
In 1990, Wang proposed the third concept of the unascertained information that is distinct from random and fuzzy information in the study of architectural engineering theory. The concepts of unascertained information and the previous gray information are the same, and both of them are used to describe the incomplete information. However, the unascertained and the gray differ from each other in that gray information expresses more certain information than the uncertain information. Based on Wang’s idea of unascertained information coupled with the work from Wu and Liu [40,41] and other scholars, the unascertained information has currently already become a systematic theory and method.
Setting F as the property space of a certain universe U , { F 1 F 2 F n } are some of the divisions of F , and there are many factors x to affect universe U that are referred to as attributes or indices. Supposing there are m attributes { I 1 I 2 I m } that affect factors x , then I = { I 1 I 2 I m } can be called attribute space in universe U . If x i for any given U , set observed value I j of factors x about some kind of attribute j as x i j that can be precisely measured. However, when information is incomplete or unknown, it is difficult or even impossible to show the properties F of factor x i with observed value x i j . In fact, the expression of varying degrees in nature reflects the difference in quantization of some attributes, and then the degree of quantization can be present in the form of data that can be estimated or indirectly measured. However, the measurement standards and conditions, including normalization, additivity and non-negativity, must to be met. Only in this way, can we obtain a measurement to describe the degree of nature, which is referred to as an unascertained measure.

4. The Establishment of the Unascertained Measure Model

Set x 1 , x 2 , , x n as evaluation objects of study, set universe U = { x 1 , x 2 , , x n } . The evaluation x i U ( i = 1 , 2 , , n ) has m first indices I 1 , I 2 , , I m , and I ¯ = { I 1 , I 2 , , I m } . For I i I ¯ has k secondary evaluation indices I i 1 , I i 2 , , I i k , and I i ¯ = { I i 1 , I i 2 , , I i k } . Therefore, x i j can be expressed as k dimensional vector x i j = { x i j 1 , x i j 2 , , x i j k } , x i j r means the value of the secondary indices of I j , which is x i ’s first index. Each x i j r has p evaluation grades c 1 , c 2 , , c p , and the evaluation space is C = { c 1 , c 2 , , c p } .

4.1. The Single-Index Measure

4.1.1. The Single-Index Measure Matrix

Set μ i j r q = μ ( x i j r c q ) to express the degree that x i j r belongs to c q , which is the q t h evaluation class (rating). μ must meet the following conditions:
0 μ ( x i j r q c q ) 1 ,   i = 1 , 2 , , n ;   j = 1 , 2 , , m ;   r = 1 , 2 , , k ;   q = 1 , 2 , , p
μ ( x i j r C ) = 1 ,   i = 1 , 2 , , n ;   j = 1 , 2 , , m ;   r = 1 , 2 , , k
μ ( x i j r l = 1 q c l ) = l = 1 q μ ( x i j r c l ) ,   q = 1 , 2 , , p
Define Equation (2) as the normalization and Equation (3) as the additivity. That which meets the three equations above is unascertained measurement. The matrix that follows is a single index measure matrix [42].
( μ i j r q ) k × p = [ μ i j 11 μ i j 12 μ i j 1 p μ i j 21 μ i j 22 μ i j 2 p μ i j k 1 μ i j k 2 μ i j k p ] ,   i = 1 , 2 , , n ;   j = 1 , 2 , , m

4.1.2. The Distinction Weight of Single-Index Index

Using the concept of information entropy to define the peak of index I i j r .
V i j r = 1 + 1 lnp q = 1 p μ i j r q ln μ i j r q
p in Equation (4) represents the number of the evaluate ratings, μ i j r q is the measure of a single index, and the value of V i j r expresses the degree that I i j r is different from each evaluation class. The distinction weight is as follows:
ω i j r = V i j r r = 1 k V i j r ,   i = 1 , 2 , , n ;   j = 1 , 2 , , m ;   r = 1 , 2 , , k
r = 1 k ω i j r = 1 , 0 ω i j r 1 , ω i j r is the classification weights of I j r . ω i j = ( ω i j 1 , ω i j 2 , , ω i j k ) is the classification weight vector of second grade index [43].

4.2. The First Grade Index Measure

Set μ i q = μ ( x i c q ) to express the degree that sample x i belongs to c r , which is the r t h evaluation class (rating).
μ i q = j = 1 m ω i j μ i j q ;   i = 1 , 2 , , n ;   q = 1 , 2 , , p
Due to 0 μ i q 1 , and q = 1 p μ i q = q = 1 p j = 1 m ω i j μ i j q = j = 1 m ω i j q = 1 p μ i j q = j = 1 m ω i j = 1 , μ i q is the unascertained measure. Define ( μ i 1 , μ i 2 , , μ i p ) as the measure evaluation vector of x i ’s composite index. The matrix ( μ i q ) n × p = [ μ 11 μ 12 μ 1 p μ 21 μ 22 μ 2 p μ n 1 μ n 2 μ n p ] is the measure matrix of the comprehensive index [44].

4.3. The Determination of First Grade Index Weight by AHP

AHP is one of the best-known and most widely used multi-criteria analysis approaches [45]. Lacking quantitative ratings, AHP can help policy makers evaluate the importance of strategies for a specific issue [18,26]. The application process of AHP is comprised of four steps:
(1)
Set a hierarchy for the problem including targets, alternatives to reaching those targets and criteria to evaluate the alternatives.
(2)
Set the alternatives and criteria by pairwise comparison (weighing).
(3)
Carry out pair-wise comparison of alternatives on every criterion (scoring).
(4)
Obtain an overall relative score of every alternative [45].
Pairwise comparison is accomplished by adopting a matrix, consisting of Saaty’s basic scale of 1–9. This scale is adopted in matrices to determine the weights of relative criteria and to compare the alternatives linked to every criterion. Table 2 summarizes the basic ratio scale. All final weighted coefficients are shown in matrices. Alternatives and criteria can be ranked based on the overall aggregated weights in the matrices. The alternative with the highest overall weight would be the most preferable [18,26].
Based on this first index’s judgment matrix, the weights of every first grade index can be calculated by the geometric calculation method of mean.
ω ¯ i = j = 1 n a i j n   ( i = 1 , 2 , , n )
Then making the normalized processing, using the following formula:
ω i = ω ¯ i i = 1 n ω ¯ i
The weight vector of first index is obtained: ω = ( ω 1 , ω 2 , , ω n ) T .
The largest characteristic roots λ max can be calculated by the following formula:
λ max = 1 n i = 1 n ( A W ) i W i
However, due to the extreme complexity of objective things, the influencing factors of subjective understanding occasionally cannot entirely meet the requirement of consistency. Thus, checking the matrix for consistency is necessary, and the process is as follows.
The consistency ratio requirements: C . R = C . I R . I < 0.1 . C . I = λ max n n 1 , λ max = 1 n i = 1 n ( A W ) i W i . The mean random consistency index R . I of are showed in Table 3.

4.4. Identification

Because the evaluation space C is an ordered partition class, the recognition criterion of maximum membership degree is inapplicable. Therefore, credible degree criterion is introduced. Set:
k 0 = min k { k : l = 1 k μ i l λ , k = 1 , 2 , , p }
Usually, λ = 0.6 or 0.7, so the evaluation objects can be classified into c k 0 .

5. Case Study

The data of 11 prefecture-level cities in Shanxi Province come from Shanxi Statistical Yearbook, Statistics information network of Shanxi Province, the official website of Environmental Protection Bureau of Shanxi Province, and Statistical Communique of each prefecture-level city. The missing data are complemented using mathematical tools, and the panel data of 2008–2013 are obtained. According to the literature [32], the city achieving the highest value of a specific index is scored as 100, and other cities are scored by multiplying 100 by the ratio of the index value with respect to the reference city. Thus, the scores of each city based on each index are calculated as shown in Table 4.
By reference to the literature [18], sustainable development of resources-based cities is divided into five levels (growth, structural reform and update) depending on the development stage of either non-sustainable development, weakly sustainable development, moderately sustainable development, good sustainable development or excellent sustainable development, as shown in Table 5.
The membership function is established as follows according to the level of sustainable development:
μ ( x c 1 ) = { 1 x 60 70 x 70 60 60 < x 70 0 x > 70 } ,   μ ( x c 2 ) = { 80 x 80 70 70 < x 80 x 60 70 60 60 < x 70 0 others }
μ ( x c 5 ) = { 1 x > 95 x 90 95 90 90 < x 95 0 x 90 }
According to the scores in Table 4 and using the membership function, the measurement vector of a secondary index, taking Taiyuan City as an example, is calculated, as shown in Table 6.
Thus, according to the vector measures, the measurement matrix of the secondary index is established as follows:
I 1 : μ ¯ 1 = ( 0 0 0 0 1 0 0 0 0 1 0.8 0.2 0 0 0 1 0 0 0 0 ) ,   I 2 : μ ¯ 2 = ( 0 0 0 0 1 0 0 0 0 1 0 0 0 0 1 0 0 0 0 1 )
I 3 : μ ¯ 3 = ( 1 0 0 0 0 0.2 0.8 0 0 0 0 0 0 0 1 0 0 0 1 0 )

5.1. The Weight Calculation of Second Grade Index

The weights of the secondary indices are calculated using information entropy. Below is the calculation of weight of GDP per capita ( X 1 ):
Measurement matrix of a single secondary index under economic subsystem X 1 is:
I 1 : μ ¯ 1 = ( 0 0 0 0 1 0 0 0 0 1 0.8 0.2 0 0 0 1 0 0 0 0 )
Using the Equation (4): v 11 = 1 ; v 12 = 1 ; v 13 = 0.6390 ; and v 14 = 1 .
Using the Equation (5): ω 11 = 0.2748 ; ω 12 = 0.2748 ; ω 13 = 0.1756 ; and ω 14 = 0.2748 .
Thus, level indicators can be obtained under the X1 category weights: ω 1 ¯ = ( 0.2748 0.2748 0.1756 0.2748 ) ; ω 2 ¯ = ( 0.2500 0.2500 0.2500 0.2500 ) ; ω 3 ¯ = ( 0.2748 0.1756 0.2748 0.2748 ) .

5.2. The Measure Calculation of First Grade Index

Using the Equation (6), the measurement vector of the first index under economic subsystem X 1 is:
μ 1 = ω 1 ¯ × μ 1 ¯ = [ 0.2748 0.2748 0.1756 0.2748 ] T × [ 0 0 0 0 1 0 0 0 0 1 0.8 0.2 0 0 0 1 0 0 0 0 ] = ( 0.4153 0.0351 0 0 0.5496 )
The measurement vector of the first index under social subsystem ( X 2 ) is:
μ 2 = ω 2 ¯ × μ 2 ¯ = [ 0.2500 0.2500 0.2500 0.2500 ] T × [ 0 0 0 0 1 0 0 0 0 1 0 0 0 0 1 0 0 0 0 1 ] = ( 0 0 0 0 1 )
The measurement vector of the first index under resources and environmental subsystem ( X 3 ) is:
μ 3 = ω 3 ¯ × μ 3 ¯ = [ 0.2748 0.1756 0.2748 0.2748 ] T × [ 1 0 0 0 0 0.2 0.8 0 0 0 0 0 0 0 1 0 0 0 1 0 ] = ( 0.3099 0.1405 0 0.2748 0.2748 )
Thus the measurement matrix of the first index is:
μ ¯ = [ μ 1 μ 2 μ 3 ] = [ 0.4153 0.0351 0 0 0.5496 0 0 0 0 1 0.3099 0.1405 0 0.2748 0.2748 ]

5.3. Determining the Classification Weight of First Grade Index

The first index judgment matrix is established using Saaty’s 1–9 scale, and AHP is applied to calculate the weights of the first indices as follows (Table 7):
Thus the weights of each first index are calculated using the Equations (7) and (8) (Table 8):
First, A W 1 W 1 = ( 0.1634 0.5396 0.2970 ) × ( 1 1 / 3 1 / 2 ) T 0.1634 = 3.0096 is obtained.
Similarly, A W 2 W 2 = 3.0093 , and A W 3 W 3 = 3.0088 .
Thus the maximum Eigen value is: λ max = 3.0092 .
Since there are three factors, the R.I value of the matrix is set as 0.52. From C . R = C . I R . I < 0.1 it can be known that the consistency test has been satisfied.
Point multiplication of the first index weight and the first measurement matrix results in the judgment matrix:
B = ω i 0 × μ _ = [ 0.1599 0.0475 0 0.0816 0.7110 ]
Thus the score is calculated as:
S = B × A = [ 0.1599 0.0475 0 0.0816 0.7110 ] × [ 70 80 90 95 100 ] = 93.85
From the above, it can be known that Taiyuan has a good level of sustainable development.

5.4. Confidence Level Recognition

Confidence level recognition is performed using the formula and the calculated comprehensive measurement vector. Here, λ is set as 0.7:
When λ = 0.7 , k 0 = min l = 1 k μ i l 0.7 , k = 5 .

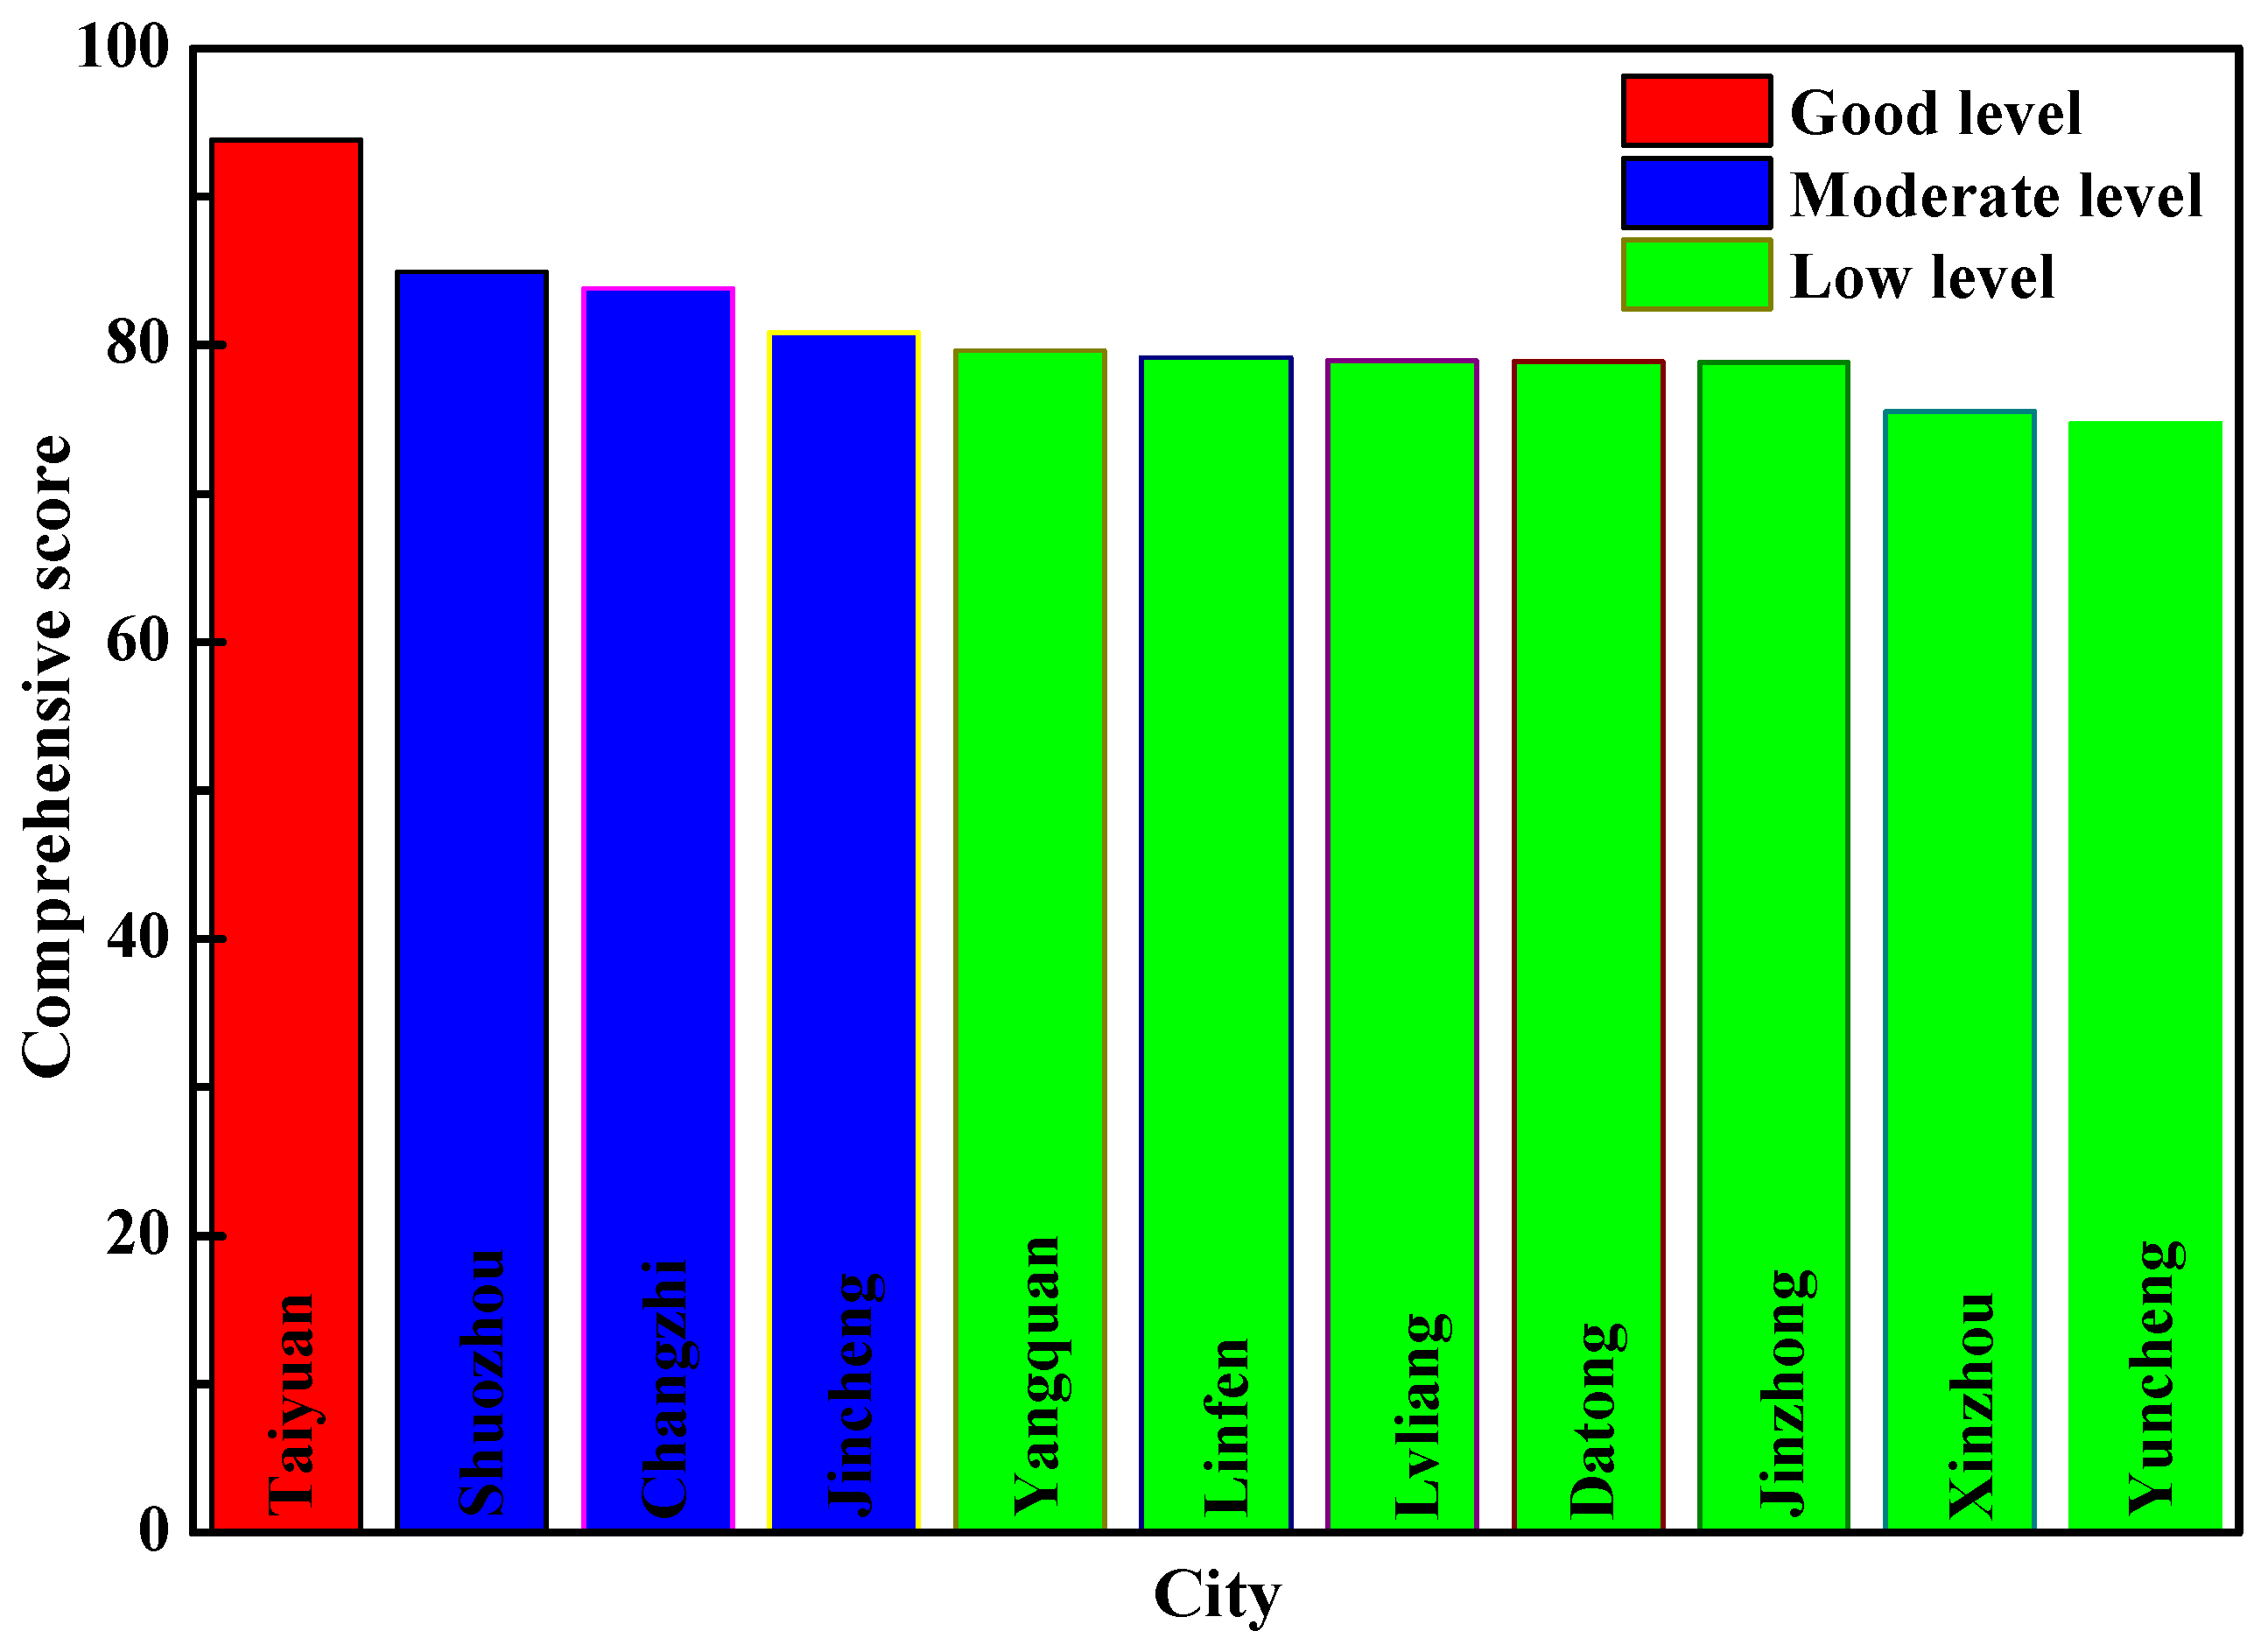
5.5. Scores of Sustainable Development of Resources-Based Cities in Shanxi Province

The scores of sustainable development of other cities are calculated by the same method. As shown in Figure 1, the scores of sustainable development of all 11 resources-based cities tested are above 70, indicating that some effort has been made toward achieving sustainable development. The average score is 80.84, and only four cities are above the average. This indicates large differences in the levels of sustainable development among the cities. Through combining levels of sustainable development in Table 6 with Figure 1, the various levels of sustainable development of the 11 cities can be determined and classified. Taiyuan performed the best in sustainable development in 2013 and achieves an integrated development of economy, society, and resources and environment. Shuozhou, Changzhi, and Jincheng have basically realized sustainable development. However, Yangquan, Linfen, Lvliang, Datong, Jinzhong, Xinzhou and Yuncheng have a low level of sustainable development, with social and economic progress being made at the expense of resources and environment.

6. Conclusions

(1)
This study comprehensively considers the many factors affecting sustainable development of resources-based cities. The index system is established from the three aspects of economic, social and resources and environment. The comprehensive evaluation is carried out using the unascertained measure model and AHP. It provides a reliable basis for developing rapid and accurate control measures and management solutions of sustainable development of resources-based cities compared with the literature [23].
(2)
The various evaluation factors do not all carry the same level of importance in the evaluation system of sustainable development of resources-based cities, so it is necessary to determine the weight of each factor. The modified AHP that simultaneously achieves qualitative and quantitative evaluation is used. The weights are assigned in a more scientific and rational manner and satisfy the requirement of consistency, thus fully reflecting the significance level of each evaluation index.
(3)
The problem of determining the level of sustainable development of resources-based cities is solved using the confidence recognition criteria. The judgment matrices are established based on the unascertained measure model, which fully represents the uncertainty in the evaluation.
(4)
Taiyuan City has achieved a good level of sustainable development and is currently progressing towards the goal of a comprehensive city. Taiyuan should adhere to the principle of integrated development of economy, society, and resources and environment without neglecting any aspects so as to achieve healthy economic development, increasing development of society, the efficient utilization of resources, and continuously improve the environment.
Shuozhou, Changzhi and Jincheng have realized a moderate level of sustainable development. However, these cities still need adjustments to the industrial structure and make great effort to cultivate new industries, especially modern service industries such as cultural tourism, new energy industry, equipment manufacturing, energy-saving and environmental protection industry and logistics. The current situation of coal being the pillar industry should be changed. Moreover, effective measures should be adopted to address the environmental problems such as goaf management and to reduce the adverse impacts of development on the environment.
Yangquan, Linfen, Lvliang, Datong, Jinzhong, Xinzhou and Yuncheng have been designated a low level of sustainable development, with less developed secondary and tertiary industries. The per capita revenue and consumption remains low, and new industries such as tourism and other modern service industries should be further developed while enhancing the competitiveness of secondary industries. These cities should discover their respective new growth points and foster advantageous industries. Over-dependence on secondary industry has resulted in resources exhaustion and environmental pollution, and the economic growth rate is still low. Economical and intensive utilization of resources should be encouraged so as to improve the rate and efficiency of resources utilization. Moreover, clean energies should be exploited and the obligations of environmental protection and ecological formation should be more clearly specified.
All 11 resources-based cities of Shanxi Province have achieved varying levels of sustainable development. Industrial structure adjustments and optimization are necessary according to the inherent features and development stage of each city. By optimizing resources allocation and reducing reliance on natural resources industries, the economic structure will become more diversified and the resources-based cities will gradually accomplish the transition into comprehensive cities.

Author Contributions

This paper presents collaborative research results written by the co-authors, Yong-Zhi Chang and Suo-Cheng Dong. Dong conceived and designed the study; Chang analyzed the industry and performed the data analysis. With cross discussions of the research results, the co-authors have contributed substantially to the work reported.

Conflicts of Interest

The authors declare no conflict of interest.

Appendix

According to the scores in Table 4 and using the membership function, the measurement vector of a secondary index is calculated as below, taking Yangquan City as an example.
Table A1. Measurement vectors of single secondary index in the evaluation index system.
Overall IndexFirst IndexSecondary IndexMeasurement Vector of Secondary Index
Influence factors of sustainable development X Economic X 1 GDP per capita (CNY) X 11 (0 0.5 0.5 0 0)
Proportion of added value of tertiary industry to GDP (%) X 12 (0 0.6 0.4 0 0)
Proportion of added value of secondary industry to GDP (%) X 13 (0 0 0.8 0.2 0)
Increment of income per capita (ten thousand CNY) X 14 (0 0.8 0.2 0 0)
Social X 2 Per capita disposable income of urban households (CNY) X 21 (0 0 0 0 1)
Annual per capita consumption (CNY) X 22 (0.8 0.2 0 0 0)
Newly increased urban employments (ten thousand people) X 23 (1 0 0 0 0)
Tourism revenue per capita /thousand CNY X 24 (0 0 0.4 0.6 0)
Resources and environment X 3 Area of afforestation (khm2) X 31 (1 0 0 0 0)
Proportion of days with standard-satisfying air quality (%) X 32 (0 0.6 0.4 0 0)
Centralized urban sewage treatment rate (%) X 33 (0 0 0.5 0.5 0)
Garbage treatment to safe rate (%) X 34 (0 0 0 0 1)
The membership function is established as follows according to the level of sustainable development:
μ ( x c 1 ) = { 1 x 60 70 x 70 60 60 < x 70 0 x > 70 } ,   μ ( x c 2 ) = { 80 x 80 70 70 < x 80 x 60 70 60 60 < x 70 0 others } ,
μ ( x c 3 ) = { 90 x 90 80 80 < x 90 x 70 80 70 70 < x 80 0 others } ,   μ ( x c 4 ) = { 95 x 95 90 90 < x 95 x 80 90 80 80 < x 90 0 others } ,
μ ( x c 5 ) = { 1 x > 95 x 90 95 90 90 < x 95 0 x 90 } .
The measurement vector of each secondary index is calculated using the membership function according to Table 4. The calculation of the measurement vector for the first index of economic ( X 1 ) is illustrated below by membership function. Because the secondary index of GDP per capita ( X 11 ) is 75 in Table 4, it is concluded that the calculation results as follows:
μ 111 ( x c 1 ) = μ 114 ( x c 4 ) = μ 115 ( x c 5 ) = 0 ,
μ 112 ( x c 2 ) = 80 - 75 80 - 70 = 0.5 ,   μ 113 ( x c 3 ) = 75 - 70 80 - 70 = 0.5 .
The measurement vector for the secondary index of GDP per capita ( X 11 ) is calculated as (0, 0.5, 0.5, 0, 0); the measurement vector for proportion of added value of tertiary industry to GDP ( X 12 ) as (0, 0.6, 0.4, 0, 0); the measurement vector for proportion of added value of secondary industry to GDP ( X 13 ) as (0, 0, 0.8, 0.2, 0); and the measurement vector for increment of income per capita ( X 14 ) as (0, 0.8,0.2,0, 0).
Thus, the measurement matrix for the first index of economic ( X 1 ) is established as follows:
I 1 : μ ¯ 1 = ( 0 0.5 0.5 0 0 0 0.6 0.4 0 0 0 0 0.8 0.2 0 0 0.8 0.2 0 0 ) .
Similarly, the measurement matrices for the primary indices of social ( X 2 ) and resources and environment ( X 3 ) are established as follows:
I 2 : μ ¯ 2 = ( 0 0 0 0 1 0.8 0.2 0 0 0 1 0 0 0 0 0 0 0.4 0.6 0 ) ,
I 3 : μ ¯ 3 = ( 1 0 0 0 0 0 0.6 0.4 0 0 0 0 0.5 0.5 0 0 0 0 0 1 ) .
Applying Equation (4) obtains the following:
v 11 = 1 + 1 ln 4 ( 0.5 × ln 0.5 + 0.5 × ln 0.5 ) = 0.5000 ,
v 12 = 1 + 1 ln 4 ( 0.6 × ln 0.6 + 0.4 × ln 0.4 ) = 0.5145 ,
v 13 = 1 + 1 ln 4 ( 0.8 × ln 0.8 + 0.2 × ln 0.2 ) = 0.6390 ,
v 14 = 1 + 1 ln 4 ( 0.8 × ln 0.8 + 0.2 × ln 0.2 ) = 0.6390 .
From Equation (5), the classification weight of evaluating index X 1 is obtained:
ω 11 = 0.5000 0.5000 + 0.5145 + 0.6390 + 0.6390 = 0.2181 ,
ω 12 = 0.5145 0.5000 + 0.5145 + 0.6390 + 0.6390 = 0.2244 ,
ω 13 = 0.6390 0.5000 + 0.5145 + 0.6390 + 0.6390 = 0.2787 ,
ω 14 = 0.6390 0.5000 + 0.5145 + 0.6390 + 0.6390 = 0.2787 ,
ω 1 ¯ = ( 0.2181 0.2244 0.2787 0.2787 ) .
In the same way, it can be concluded as follows:
ω 2 ¯ = ( 0.3171 0.2026 0.3171 0.1632 ) ,
ω 3 ¯ = ( 0.3317 0.1707 0.1659 0.3317 ) ,
Using Equation (6), the measurement vector for the first grade index of economic ( X 1 ) is:
μ 1 = ω 1 ¯ × μ 1 ¯ = [ 0.2181 0.2244 0.2787 0.2787 ] T × [ 0 0.5 0.5 0 0 0 0.6 0.4 0 0 0 0 0.8 0.2 0 0 0.8 0.2 0.9 0 ] = ( 0 0.4667 0.4775 0.3066 0 ) .
The measurement vector for the first index of social ( X 2 ) is:
μ 2 = ω 2 ¯ × μ 2 ¯ = [ 0.3171 0.2026 0.3171 0.1632 ] T × [ 0 0 0 0 1 0.8 0.2 0 0 0 1 0 0 0 0 0 0 0.4 0.6 0 ] = ( 0.4792 0.0405 0.0653 0.0979 0.3171 ) .
The measurement vector for the first index of resources and environment ( X 3 ) is:
μ 3 = ω 3 ¯ × μ 3 ¯ = [ 0.3317 0.1707 0.1659 0.3317 ] T × [ 1 0 0 0 0 0 0.6 0.4 0 0 0 0 0.5 0.5 0 0 0 0 0 1 ] = ( 0.3317 0.1024 0.1512 0.0830 0.3317 ) .
Thus the measurement matrix of the first index is:
μ ¯ = [ μ 1 μ 2 μ 3 ] = [ 0 04667 0.4775 0.3066 0 0.4792 0.0405 0.0653 0.0979 0.3171 0.3317 0.1024 0.1512 0.0830 0.3317 ] .
First index judgment matrix is established using Saaty’s 1–9 scale, and then AHP is applied to calculate the weights of first indices as follows:
Table A2. First index judgment matrix.
XX1X2X3
X111/3 1/2
X2312
X321/21
Table A3. The weights of first index.
X1X2X3
wi0.55031.81711
wi00.16340.53960.2970
Thus the weights of each first index are calculated using the formula:
First, A W 1 W 1 = ( 0.1634 0.5396 0.2970 ) × ( 1 1 / 3 1 / 2 ) T 0.1634 = 3.0096 is obtained.
Similarly, A W 2 W 2 = 3.0093 , and A W 3 W 3 = 3.0088 .
Thus, the maximum Eigen value is: λ max = 3.0092 .
Since there are three factors, the R.I value of the matrix is set as 0.52. From C . R = C . I R . I < 0.1 it can be known that the consistency test has been satisfied.
Point multiplication of the first index weight and the first measurement matrix results in judgment matrix are as follows:
B = ω i 0 × μ _ = [ 0.3571 0.1285 0.1582 0.1276 0.1801 ]
Thus the score is calculated as:
S = B × A = [ 0.3571 0.1285 0.1582 0.1276 0.1801 ] × [ 70 80 90 95 100 ] = 79.65
From the above, it can be known that Yangquan has a weakly sustainable development.
Confidence level recognition is performed using the formula and the calculated comprehensive measurement vector. Here, λ is set as 0.7:
When λ = 0.7 , k 0 = min l = 1 k μ i l 0.7 , k = 4 .

References

  1. Lin, Q.H. Sustainable city and environment. Urban Plan. Overseas 1997, 2–8. (In Chinese) [Google Scholar]
  2. Wang, Y.H.; Deng, X.M.; Marcucci, D.J.; Le, Y.E. Sustainable development planning of protected areas near cities: Case study in China. J. Urban Plan. Dev. 2013, 139, 133–143. [Google Scholar] [CrossRef]
  3. Ericson, J.A. A participatory approach to conservation in the Calakmul Biosphere Reserve, Campeche, Mexico. Landsc. Urban Plan. 2006, 74, 242–266. [Google Scholar] [CrossRef]
  4. Jansson, Å. Reaching for a sustainable, resilient urban future using the lens of ecosystem services. Ecol. Econ. 2013, 86, 285–291. [Google Scholar] [CrossRef]
  5. The State Council of the People’s Republic of China. About print and distribute the notice of national resources city sustainable development planning (2013–2020). Available online: http://www.gov.cn/zwgk/2013-12/03/content_2540070.htm (accessed on 3 December 2013). (In Chinese)
  6. Li, H.; Zhang, P.Y.; Cheng, Y.Q. Economic vulnerability of mining city—A case study of Fuxin City, Liaoning Province, China. Chin. Geogr. Sci. 2009, 19, 211–218. (In Chinese) [Google Scholar] [CrossRef]
  7. Hayter, R.; Barnes, T.J. Labor market segmentation, flexibility and recession: A British Colombian case study. Environ. Plan. 1992, 10, 333–353. [Google Scholar] [CrossRef]
  8. Randall, J.E.; Ironside, R.G. Communities on the edge: An economic geography of resource-dependent communities in Canada. Can. Geogr. 1996, 40, 17–35. [Google Scholar] [CrossRef]
  9. Hilson, G. Sustainable development policies in Canada mining sector: An overview of government and industry efforts. Environ. Sci. Policy 2000, 3, 201–211. [Google Scholar] [CrossRef]
  10. Jin, X.F.; Dong, S.C.; Liu, W.; Li, X. Study on relationship between industrial chain extension and evolution of resource-based city—A case study on Tongling city. Econ. Geogr. 2010, 30, 403–408. (In Chinese) [Google Scholar]
  11. Sun, W.; Dong, G.P. The efficiencies and their changes of China’s resources-based cities employing DEA and Malmquist Index Models. Geogr. Res. 2010, 29, 2155–2164. (In Chinese) [Google Scholar] [CrossRef]
  12. Han, J.; Song, Y.Q.; Yang, L. The evaluation of sustainable development of resource-based cities based on cluster analysis. Stat. Decis. 2011, 76–78. (In Chinese) [Google Scholar]
  13. Zhang, X.C.; Jin, Z.H.; Zhang, Y.X. Discussion on problems and counter measures of the sustainable development of the resource-based cities in Jinlin Province. J. Northeast. Norm. Univ. (Philos. Soc. Sci.) 2014, 40–45. (In Chinese) [Google Scholar]
  14. Wang, W.G.; Song, Y.X.; Pang, X.X. Study on sustainable development in forest resource-based cities. World Reg. Stud. 2010, 19, 121–127. (In Chinese) [Google Scholar]
  15. Ma, K.; Li, J.G. Practice and explore for the sustainable development of resource-based cities in our country—Economic transition experience and prospect domestic resource-exhausted city in ten years. Econ. Rev. 2012, 1–7. (In Chinese) [Google Scholar]
  16. Fu, J.J. Path choices for sustainable development of the rising oil-gas-dependent city. J. Yunnan Univ. Nat. (Soc. Sci.) 2013, 30, 118–123. (In Chinese) [Google Scholar]
  17. Dong, F.; Tan, Q.M.; Zhou, D.Q.; Long, R.Y.; Zhu, J.X. An evaluation of resource-based city’s sustainable development level: A case study on Daqing city in Heilongjiang Province. Resour. Sci. 2010, 32, 1584–1591. (In Chinese) [Google Scholar]
  18. Zhao, H.Y.; Li, Z.X.; Zhang, Y.C. Study on the sustainable development index and evaluating of sustainable development of the mining city. China Min. Mag. 2004, 13, 14–19. (In Chinese) [Google Scholar]
  19. Li, C.M.; Li, K.R.; Wang, Y.H. BP neural network based approach to synthetical evaluation model of sustainable development in mine cities. China Min. Mag. 2006, 15, 25–28. (In Chinese) [Google Scholar]
  20. Liu, C. Comprehensive evaluation of sustainable development in resources-exhausted cities: A case study on Huangshi city of Hubei Province. Resour. Ind. 2014, 16, 1–5. (In Chinese) [Google Scholar]
  21. Hao, C.B.; Dai, S.J. Evaluation of sustainable development of coal-based cities via entropy. Resour. Ind. 2008, 10, 1–5. (In Chinese) [Google Scholar]
  22. Yu, Y.; Sha, J.H.; Zhou, J.S. Sustainability of mining economic zones in Anhui Province. Resour. Ind. 2014, 16, 116–121. (In Chinese) [Google Scholar]
  23. Wang, L.; Li, J. A case study on Shanxi Province: Transformation efficiency evaluation of resources-based cities on DEA. Resour. Ind. 2014, 16, 7–12. (In Chinese) [Google Scholar]
  24. Zhang, Y.Z. Study of sustainable development research based on system dynamics in Hebi city. Econ. Res. Guide 2015, 173–174. (In Chinese) [Google Scholar]
  25. Zeng, L.J.; Sui, Y.H. Cluster empirical study on the level of circular economic development of Chinese resource-based cities. China Popul. Resour. Environ. 2011, 21, 143–149. (In Chinese) [Google Scholar]
  26. Javid, P.J.; Nejat, A.; Hayhoe, K. Selection of CO2 mitigation strategies for road transportation in the United States using a multi-criteria approach. Renew. Sustain. Energy Rev. 2014, 38, 960–972. [Google Scholar] [CrossRef]
  27. Quadros, S.G.R.; Nassi, C.D. An evaluation on the criteria to prioritize transportation infrastructure investments in Brazil. Transp. Policy 2015, 40, 8–16. [Google Scholar] [CrossRef]
  28. Macharis, C.; Bernardini, A. Reviewing the use of multi-criteria decision analysis for the evaluation of transport projects: Time for a multi-actor approach. Transp. Policy 2015, 37, 177–186. [Google Scholar] [CrossRef]
  29. Omitaomu, O.A.; Blevins, B.R.; Jochem, W.C.; Mays, G.T.; Belles, R.; Hadley, S.W.; Harrison, T.J.; Bhaduri, B.L.; Neish, B.S.; Rose, A.N. Adapting a GIS-based multicriteria decision analysis approach for evaluating new power generating sites. Appl. Energy 2012, 96, 292–301. [Google Scholar] [CrossRef]
  30. Tanguay, G.A.; Rajaonson, J.; Lefebvre, J.F.; Lanoie, P. Measuring the sustainability of cities: An analysis of the use of local indicators. Ecol. Indic. 2010, 10, 407–418. [Google Scholar] [CrossRef]
  31. National Development and Reform Commission of the People’s Republic of China, National Science and Technology Commission of the People’s Republic of China. The Administrative Center for China’s Agenda: 21; China Environmental Science Press: Beijing, China, 1994. (In Chinese)
  32. Zhao, D.D.; Gao, S.H. A case study on Shanxi Province: evaluation of sustainable development level of resources-based cities based on AHP. Resour. Ind. 2015, 17, 1–7. (In Chinese) [Google Scholar]
  33. Kolmogorov, A.H. Foundations of the Theory Probability, 2nd ed.; Chelsea Publishing Company: New York, NY, USA, 1956. [Google Scholar]
  34. Zaden, L.A. Fuzzy sets. Inf. Control 1965, 8, 338–353. [Google Scholar]
  35. Deng, J.L. The Grey System (Society Economic); National Defence Industry Press: Beijing, China, 1985. (In Chinese) [Google Scholar]
  36. Wang, G.Y. Unascertained information and its mathematical treatment. J. Harbin Archit. Civ. Eng. Inst. 1990, 12, 1–4. (In Chinese) [Google Scholar]
  37. Wang, Q.Y. Grey Mathematical Basis; HUST Press: Wuhan, Hubei, China, 1996. (In Chinese) [Google Scholar]
  38. Shafer, G. A Mathematical Theory of Evidence; PU Press: Princeton, NH, USA, 1976. [Google Scholar]
  39. Zadeh, L.A. Fuzzy Sets as a basis for theory of possibility. Fuzzy Sets Syst. 1978, 1, 3–28. [Google Scholar] [CrossRef]
  40. Liu, K.D.; Pang, Y.J.; Wu, H.Q.; Yao, L.G. Information and its mathematical expression. Syst. Eng. Theor. Pract. 1999, 91–93. (In Chinese) [Google Scholar]
  41. Wu, H.Q. The four fundanmenal operations of arithmetic of blind numbers. J. Hebei Inst. Archit. Sci. Technol. 1998, 15, 6–9. (In Chinese) [Google Scholar]
  42. Liu, K.D.; Pang, Y.J.; Yao, L.G.; Li, Y. The unascertained measure model of the synthetical evaluation on atmosphere environmental qualities. Chin. J. Environ. Sci. 2000, 21, 12–15. (In Chinese) [Google Scholar]
  43. Li, W.Q.; Zhang, L.N.; Meng, W.Q. Comprehensive evaluation on MIS based on information entropy and unascertained measure model. J. Hebei Inst. Archit. Sci. Technol. 2005, 22, 49–53. (In Chinese) [Google Scholar]
  44. Wu, F.D.; Hu, N.L.; Wang, C.L. Safety evaluation model of “six systems” in coal mine underground based on the unascertained measure theory. J. Chin. Coal. Soc. 2011, 36, 1731–1735. (In Chinese) [Google Scholar]
  45. Saaty, T.L. Multicriteria Decision Making: The Analytic Hierarchy Process: Planning, Priority Setting Resource Allocation; RWS Publications: Pittsburgh, PA, USA, 1990. [Google Scholar]
  46. Wang, J.J.; Jing, Y.Y.; Zhang, C.F.; Zhao, J.H. Review on multi-criteria decision analysis aid in sustainable energy decision-making. Renew. Sustain. Energy Rev. 2009, 13, 2263–2278. [Google Scholar] [CrossRef]
Figure 1. Scores of sustainable development of cites in Shanxi Province.
Sustainability 08 00585 g001
Table 1. Evaluation index system of sustainable development in resources-based cities.
Overall IndexFirst IndexSecondary Index
Evaluation of sustainable development of resources-based cities in Shanxi Province X Economic X 1 GDP per capita (CNY) X 11
Proportion of added value of tertiary industry to GDP (%) X 12
Proportion of added value of secondary industry to GDP (%) X 13
Increment of income per capita (ten thousand CNY) X 14
Social X 2 Per capita disposable income of urban households (CNY) X 21
Annual per capita consumption (CNY) X 22
Newly increased urban employments (per every ten thousand people) X 23
Tourism revenue per capita (thousand CNY) X 24
Resources and environment X 3 Area of afforestation (khm2) X 31
Proportion of days with standard-satisfying air quality (%) X 32
Centralized urban sewage treatment rate (%) X 33
Garbage treated to a standard of safe rate (%) X 34
Table 2. Saaty’s scale for AHP pairwise comparisons [46].
WeightDescription
1equal importance
3moderately more important
5strongly more important
7very strongly more important
9dominant importance
2, 4, 6, 8reciprocals
Table 3. The mean random consistency index.
Order234567891011121314
R . I 00.520.861.101.261.341.401.431.491.511.541.561.58
Table 4. The index scores of resources-based cities in Shanxi Province.
City X 11 X 12 X 13 X 14 X 21 X 22 X 23 X 24 X 31 X 32 X 33 X 34
Taiyuan95.84100.0061.8457.4699.95100.00100.00100.0046.4861.76100.0080.00
Yangquan75.0074.0981.8472.3896.7361.6923.3686.1416.4073.5385.0095.00
Datong48.7286.1366.8137.7889.2451.5652.6258.4247.3888.2489.2090.40
Changzhi66.9056.0292.2077.7894.9673.2246.7361.3944.2670.5995.00100.00
Jincheng76.1760.9588.5183.4996.8272.0139.5385.1511.9055.8887.0098.00
Jinzhong52.4769.5374.4746.3598.7555.5944.9590.1057.2851.4793.7075.30
Shuozhou100.0069.3479.43100.00100.0074.6037.3847.5232.4385.2998.50100.00
Yuncheng37.0970.2662.8426.3586.2846.4254.9540.5959.1767.6592.0095.00
Xinzhou35.7273.5470.9230.1684.6436.3035.0566.3485.1658.8290.0090.00
Linfen47.3660.2284.9648.8991.3546.3158.9743.5678.3166.1882.15100.00
Lvliang55.0544.16100.0070.4883.8941.4353.8337.62100.00100.0075.6051.30
Table 5. Levels of sustainable development.
LevelNon-Sustainable DevelopmentWeakly Sustainable DevelopmentModerately Sustainable DevelopmentGood Sustainable DevelopmentExcellent Sustainable Development
Score60–7070–8080–9090–95≥95
Table 6. Measurement vectors of single secondary index in the evaluation index system.
Overall IndexFirst IndexSecondary IndexMeasurement Vector of Secondary Index
Influence factors of sustainable development X Economic X 1 GDP per capita (CNY) X 11 (0 0 0 0 1)
Proportion of added value of tertiary industry to GDP (%) X 12 (0 0 0 0 1)
Proportion of added value of secondary industry to GDP (%) X 13 (0.8 0.2 0 0 0)
Increment of income per capita (ten thousand CNY) X 14 (1 0 0 0 0)
Social X 2 Per capita disposable income of urban households (CNY) X 21 (0 0 0 0 1)
Annual per capita consumption (CNY) X 22 (0 0 0 0 1)
Newly increased urban employments (ten thousand people) X 23 (0 0 0 0 1)
Tourism revenue per capita (thousand CNY) X 24 (0 0 0 0 1)
Resources and environment X 3 Area of afforestation (khm2) X 31 (1 0 0 0 0)
Proportion of days with standard-satisfying air quality (%) X 32 (0.2 0.8 0 0 0)
Centralized urban sewage treatment rate (%) X 33 (0 0 0 0 1)
Garbage treatment to safe rate (%) X 34 (0 0 0 1 0)
Table 7. First index judgment matrix.
XX1X2X3
X111/31/2
X2312
X321/21
Table 8. Weights of the first index.
X1X2X3
wi0.55031.81711
wi00.16340.53960.2970

