1. Introduction
The vigorous growth of the Chinese economy has increasingly connected China to the global economy. Meanwhile, China’s energy consumption has grown rapidly, making her the world’s leading emitter of greenhouse gases. The Chinese government has faced unprecedented pressure to reduce greenhouse gas emissions such as CO
2 emissions. China’s CO
2 emissions per capita exceed the world’s average. China’s CO
2 emissions per capita stands at seven tons of CO
2 equivalent, compared with the global average of 6.4 tons [
1]. Therefore, the Chinese government is prioritizing the development of sustainable green economy and energy conservation and ecological industry development.
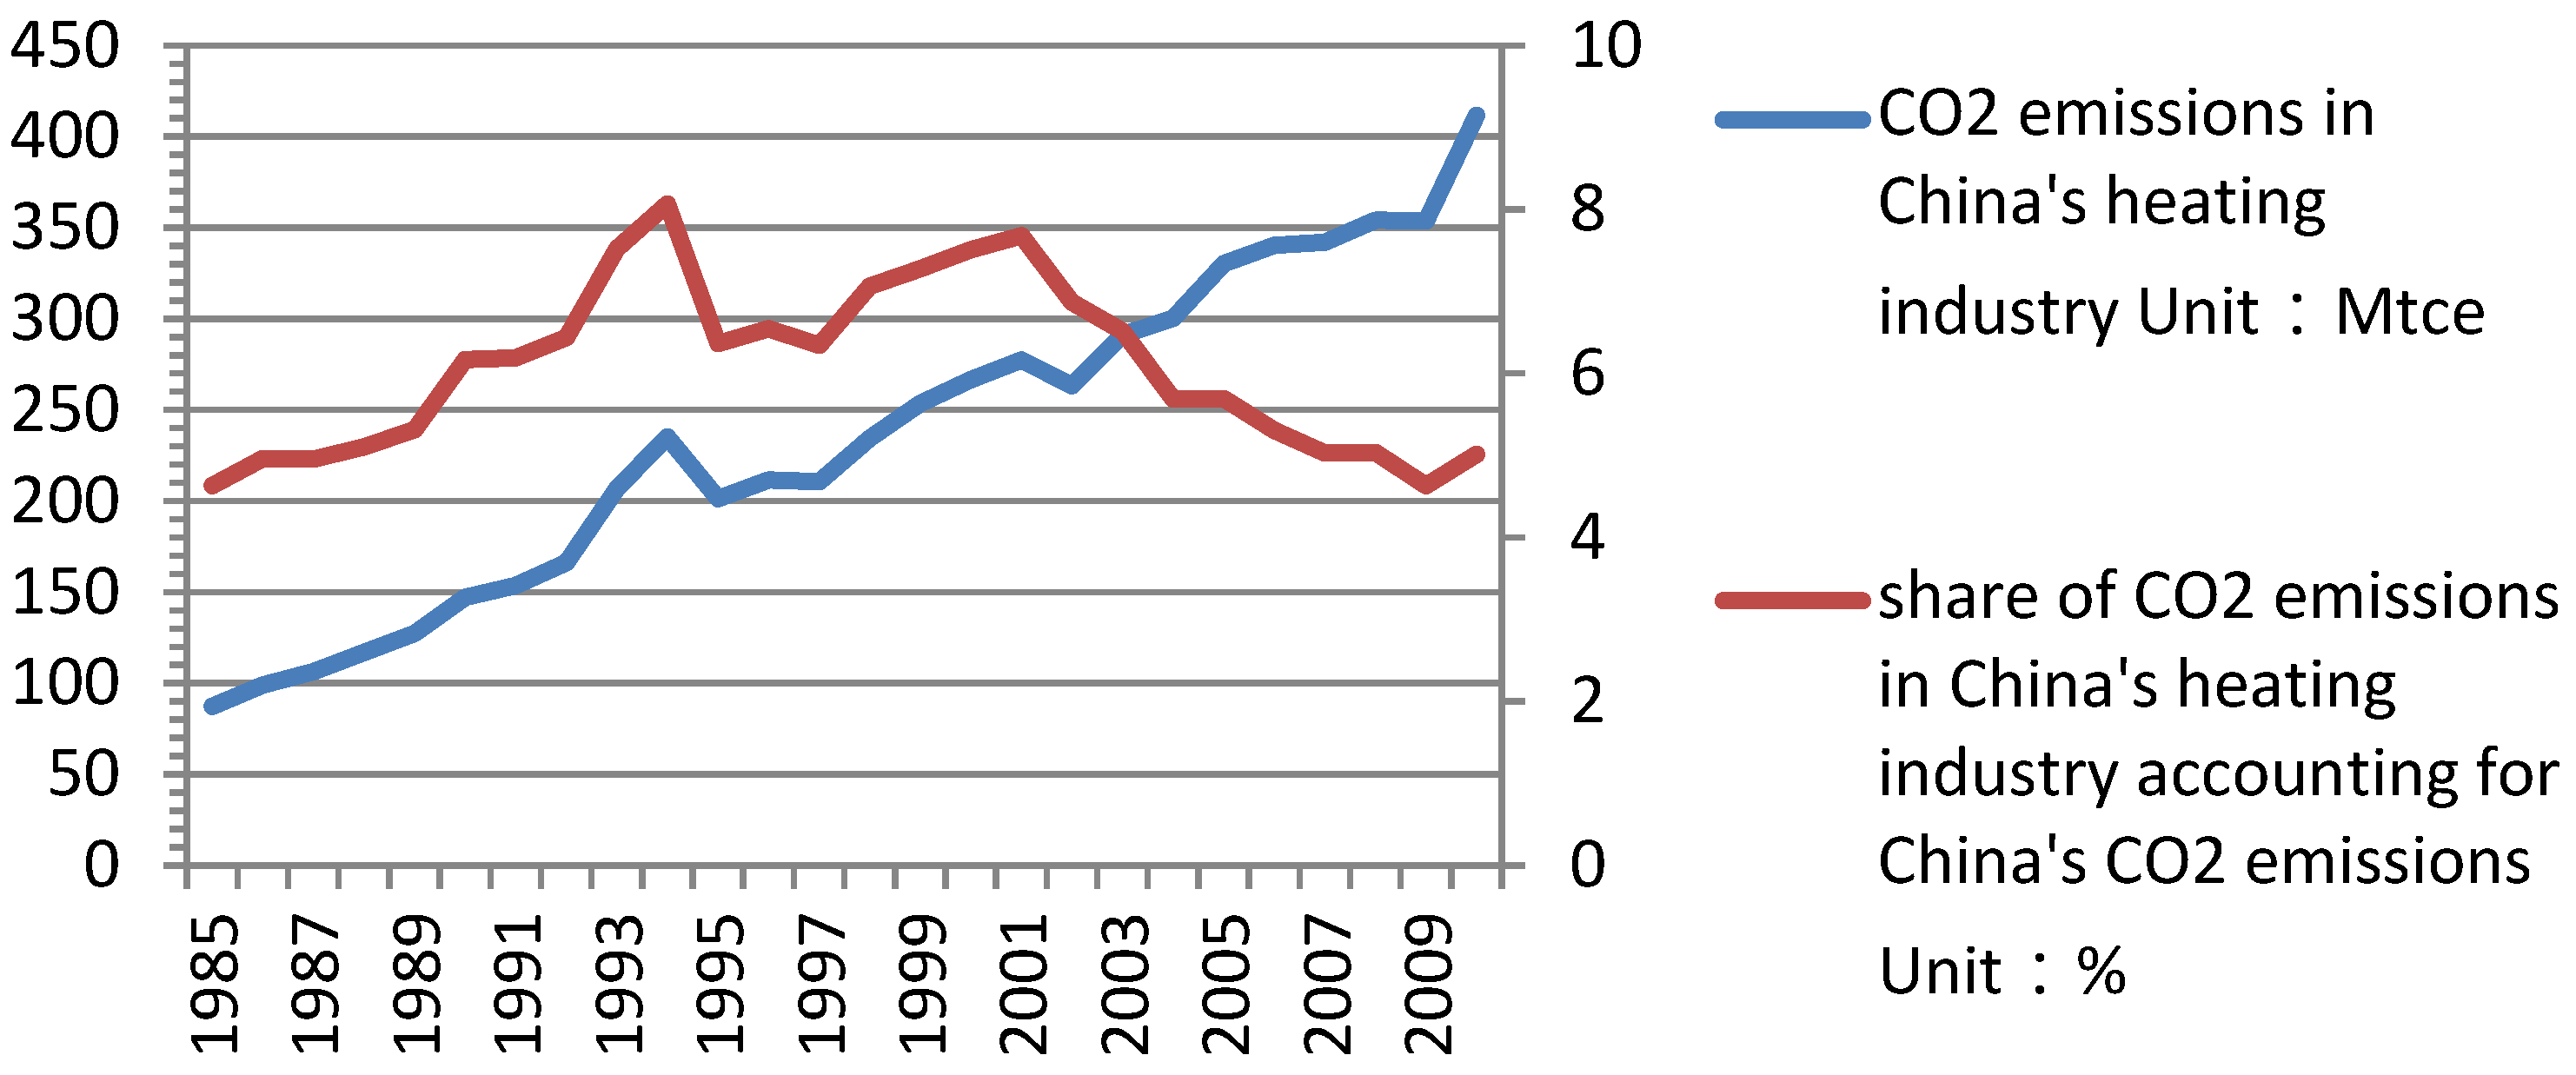
Why is China’s heating industry the focus of this research? Firstly, China’s heating industry has been preferentially developed by the government as a part of infrastructure construction. As a necessity for the promotion of life quality during winter, more residents of south China demand central heating. Secondly, we estimated that energy consumption of coal-related energy sources, on average, accounted for 89.4% of the total energy consumption in China’s heating industry during 1985–2010. In fact, the coal consumption of the heating industry kept an average annual growth rate of 8.86% over 1985–2010. In 1985, coal consumption in China’s heating industry amounted to 87.44 Mtce, and reached 411.72 Mtce in 2010. In addition, CO2 emissions of China’s heating industry grew at an average annual rate of 6.39% over 1985–2010. In 1985, CO2 emissions of the heating industry accounted for 4.64% of China’s CO2 emissions, while China’s CO2 emissions accounted for 9.29% of global CO2 emissions. In 2010, CO2 emissions in the heating industry accounted for 5.01% of China’s total CO2 emissions, while CO2 emissions in China was responsible for 24.85% of global CO2 emissions.
Figure 1 shows that CO
2 emissions in China’s heating industry grew rapidly, but its share in China’s CO
2 emissions fluctuated between 5% to 8.5% during 1985–2010.
Investigating the potential of CO2 emissions reduction in China’s heating industry is necessary. For the purpose of prediction, we select CO2 emissions (CE) of the heating industry as the major objective of this research, and then select four main influencing factors: energy intensity (EI), industrial scale (IS), labor productivity (LP), energy productivity (P). We specify four measurement indexes, corresponding to the four factors as independent variables. The co-integration analysis approach is utilized to ascertain the long equilibrium relationship among CO2 emissions and the four independent variables. For the purpose of evaluating carbon emissions and future CO2 emissions reduction potential, we design differentiated conditions in three scenarios. To certify the results of the prediction are reliable, we apply the Monte Carlo simulation to carry out risk analysis.
The remainder of this paper is structured as follows. A brief literature review on CO
2 emissions mitigation is provided in
Section 2.
Section 3 presents the research methodology applied in this paper. In
Section 4, we describe the independent variables and the relevant data. The results are discussed in
Section 5.
Section 6 provides policy suggestions and the conclusion of the paper.
2. Literature Review
From the literature review, we find that there have been many studies on CO
2 emissions reduction, whereas there are few studies on the potential of CO
2 emissions mitigation in China’s heating industry. Chen et al. [
2] analyzed energy conservation and CO
2 emissions reduction potential of different models for urban heating in China. Niu et al. [
3] analyzed energy consumption of rural household heating under comfortable temperature in the Loess Plateau of Gansu Province in China. Their results proposed improvement of rural household’s thermal comfort. Johannes et al. [
4] assessed and compared environmental impacts of existing new technologies for space heating in Germany. Mehdi et al. [
5] analyzed the socio-eco-environmental impact on simple and combined heat and power generation. Chang et al. [
6] found that building-integrated solar thermal systems is the dominant factor for disseminating solar water heating system in metropolitan areas. The study also find that fiscal policies are necessary to incent industrial heating saving energy. Ioan et al. [
7] estimated energy conservation potential of heating stations and provided a set of reasonable suggestions to minimize the environmental impact of heating stations. Barkenbus [
8] compared different income groups in America and found that the lower-income group set the thermostat higher in heating season than other income groups. It concluded that it is difficult to make Americans set their indoor temperature lower to realize energy conservation, so the use of programmable thermostats is not of much use for energy conservation. It is suggested that a social marketing strategy should be adopted to realize energy conservation. Graham [
9] examined the relationship between energy efficiency of space heating and greenhouse mitigation and peak demand. It was found that in the long term, energy savings from efficient measures will be contracted with the efficiency rebound.
Wang et al. [
10] decomposed CO
2 emissions of the residential and industrial energy consumption of China over 1996–2012. The results showed that the determinants influencing the CO
2 emissions is economic activity; and in order to reduce CO
2 emissions, energy intensity should be reduced, and the energy mix and industrial structure should be adjusted. Xue et al. [
11] employed the Granger causality test to explore the relationship among CO
2 emissions, energy consumption, and economic development in nine European countries over 1970–2008. Risk analysis was applied to evaluate the impacts of CO
2 emission reduction on local economic development. Nan et al. [
12] studied the feasibility of adjusting both energy mix and industrial structure to realize the CO
2 emissions reduction targets. Through comprehensive simulation, feasible measurements for better sustainable development by 2020 were proposed. Lin et al. [
13] estimated CO
2 emissions mitigation in China’s textile industry by evaluating the CO
2 intensity under different designed scenarios. Lin et al. [
14] assessed the potential of emissions reduction in construction industry through empirical study on the determinant factors influencing carbon emissions in buildings.
Scenario analysis was employed to investigate the influences of information communications technology on CO
2 emissions at the macroeconomic level [
15]. Victor [
16] discussed the impacts of scale and intensity on greenhouse gas emissions under several designed macroeconomic scenarios in Canada using low growth simulation model. Greiner et al. [
17] conducted simulations using scenarios representing combinations of climatic, market, institutional and technological assumptions to assist with industry planning across the whole of Northern Australia pastoral industry. Hao et al. [
18] adopted scenario analysis to analyze energy consumption and carbon emissions from passenger transport vehicles in China. Samuel et al. [
19] studied the uncertainty analysis of CO
2 storage capacity for different methods under three storage scenarios in China. Ajay et al. [
20] assessed the development of China’s future energy system by scenario analysis for China’s CO
2 emissions in 2050.
3. Methodology
3.1. Co-Integration
The co-integration method is a very important econometric research method, which is usually applied to probe into the long equilibrium relation among variables. Engle and Granger [
21] showed that if independent variable series which are integrated of the same order
d, denoted as I (
d), in addition, their residuals of the linear regression are integrated of the order
d-b, denoted as I (
d-b), in that way, these independent variable series can be considered to be co-integrated of the order
d, b, denoted as CI (
d, b). This method enhances the forecasting stability of the model. When using time series to find long-term co-integrated relationships, there is no need to transform the series.
Before co-integration analysis, it is required to test time series stationarity. The linear combination with the variables could be stationary, which means that the long equilibrium relation between variables exists. It is essential to ensure that the series are stationary before conducting the co-integration analysis. Therefore, the unit root test is required.
Unit-root test methods are commonly applied to conduct stationary test, including the ADF test (Said, 1984) [
22] or the PP test (Phillips et al., 1988) [
23].
The OLS regression method is the basis of the ADF test:
where
zt is the variable in the sample period
t;
is
;
denotes the independent and identically distributed disturbance term with mean 0 and variance 1;
is the linear time trend; and
is the optimal bandwidth.
The null hypothesis that the unit root in the test of (i.e., ~I (1)) equals the null hypothesis that α1 > 0 in Equation (1). If < 0 is significant, then the rejection of the null hypothesis of the unit root could be accepted.
The PP test model and the ADF test model are similar, but PP test model is less sensitive to the autocorrelation and heteroscedasticity of residuals.
Thus, both ADF test and PP test are adopted for unit root tests.
If each series is integrated of the same order, then it is suitable to investigate the long equilibrium relationship among variables. Engle-Granger two-step approach [
21], Johansen-Juselius approach [
24] and Johansen approach [
25] are the most frequently adopted approaches. Generally, the Johansen maximum likelihood test of co-integration is applied to where there is possibility of more than two co-integrating vectors. Hence, the Johansen-Juselius method is adopted.
3.2. Risk Analysis
In this paper, future values of the variables are estimated according to the historical values of the variables in the co-integration model; therefore, there is only one static prediction. Monte Carlo simulation can avoid the shortcomings of the static prediction process. Thus, we adopt the Monte Carlo simulation to conduct the risk analysis over the probabilities of prediction results.
Monte Carlo simulation was first developed by Metropolis and Ulam [
26], and numerical results were obtained by random sampling. The risk analysis addressed by Monte Carlo simulation includes two parts: the possible values of the annual growth rates of the variables in the prediction period and their corresponding probability.
Four specific steps are carried out in the Monte Carlo simulation:
- (i)
Ascertain the probability distribution of independent variables’ annual growth rates according to available data series.
- (ii)
Substitute the annual growth rates of independent variables with a set of random values.
- (iii)
Calculate independent variables’ possible values and their corresponding probability distribution in the prediction period.
- (iv)
Acquire independent variables’ probability distribution, then, describe their probability distribution histograms and cumulative probability curve.
In other words, to ensure the forecast is reliable, risk analysis via Monte Carlo simulation is adopted to testify the co-integration model and depict future variation trends in the annual growth rates of the independent variables from a probability theory perspective.
This paper uses MATLAB to carry out the Monte Carlo simulation and repeats the simulation process 100 thousand times.
4. Data
To carry out the research objective, we select CO2 emissions (CE), energy intensity (EI), industrial scale (IS), labor productivity (LP), and energy productivity (P) as the basic research variables. Since not all variables can be directly obtained, some of them need to be derived by calculation of relative variables. We apply time series of each variable during the period of 1985–2010 for the empirical analysis. Nominal data, such as GDP, are all converted to constant price (1985 = 100).
4.1. CO2 Emissions (CE)
Statistical data of CO
2 emissions in China’s heating industry are not directly available, so we estimated CO
2 emissions through multiplying energy consumption by emissions coefficients. Emissions coefficients of the CO
2 emissions of the varied types of energy sources are estimated according to the IPCC [
1] coefficients. There are a lot of factors that can influence the CO
2 emissions in China’s heating industry. We emphatically analyze energy intensity, industrial scale, labor productivity, and energy productivity. The four factors considered in this paper are labeled as EI, IS, LP, and P, respectively, for brevity.
4.2. Energy Intensity (EI)
Energy intensity (energy consumption/economic output) is one of the most important factor influencing CO
2 emissions. Lian [
27] found that the increase in energy intensity can increase carbon intensity. We suppose that energy intensity is positive to the CO
2 emissions of China’s heating industry. We use energy consumption per unit of industrial value added to represent EI. The data of industrial value added in China’s heating industry come from CEIC China Database. The data of energy consumption of China’s heating industry (unit: Mtce) come from the
China Energy Statistical Yearbook [
28].
4.3. Industrial Scale (IS)
Industrial scale can directly influence carbon emissions in China. Dong et al. [
29] concluded that the growth of energy-related consumption caused by industrial value added is the major reason for the rapid growth of greenhouse gas emissions, and the effect has offset the carbon emission reduction from change in energy structure. With decreasing primary energy demand for industrial sectors, the demand for secondary energy sources such as heat will increase. It is particularly critical to emphasize the importance of energy saving and CO
2 emissions mitigation in the heating industry.
Industrial scale is the direct cause of obvious increment in China’s carbon emissions. China’s heating industry has developed rapidly as a key part of China’s infrastructure construction. With its rapid development, the industry’s energy demand has increased. Increase in energy demand and economic activity can result in increase in carbon dioxide emissions. Industrial expansion could increase CO
2 emissions, and industrial scale is expected to influence CO
2 emissions positively. In this paper, the share of industrial value added of China’s heating industry to China’s GDP is selected to represent the variable industrial scale IS. The data come from
CEIC Database and
China Statistical Yearbook [
30].
4.4. Labor Productivity (LP)
Labor productivity can reflect the level of mechanization which can influence CO
2 emissions. According to ONS [
31], decline in labor productivity accompanied by a reduction in unemployment from over 8% to 5.6% led to decline in greenhouse gas emissions by almost 12% in Britain during 2008–2013. According to USIEA [
32] and Trading Economics [
33], there is also a simultaneous slowing of labor productivity and a reduction in unemployment and carbon emissions in the United States and Germany. Mazzanti et al. [
34] used CO
2 per unit of industrial value added to represent environmental efficiency. It was found that labor productivity and environmental efficiency were positive to most air emissions. Studying the Australian baking industry, Ferguson [
35] illustrated that productivity growth was not good for sustainability, and low labor productivity was good for employment and the environment. In summary, labor productivity improvement can result in unemployment and increase in carbon emissions to a certain extent. During the process of mechanization, labor productivity improvement could replace workers with machines. In other words, improvement in labor productivity can bring further mechanization, which will lead to higher energy consumption. Therefore, we suppose that labor productivity is positive to the CO
2 emissions of China’s heating industry. The industrial value added per capita is selected to represent LP. Considering that heating power supply serves as a necessity in people’s life, we choose population size within the heating supply areas as the index of labor input. Similarly, the data come from
CEIC China Database [
36], and
China Statistical Yearbook [
30].
4.5. Energy Prodctivity (P)
Energy productivity is an important factor influencing energy efficiency which is directly related to CO
2 emissions. Patterson [
37] found that energy productivity can be considered as a useful indicator for the energy efficiency of an industry. John [
38] explored the relationship between energy productivity improvement and energy consumption rebound effect, and found that the energy caused by the rebound effects might not counteract all the realized energy conservation progresses in carbon emissions in a short time, whereas, over a long time, increasing energy demand might offset completely realized energy saved in carbon emissions. Wang et al. [
39] found that technology had more stronger influence on energy productivity growth than energy efficiency in China. Fan et al. [
40] proved that the impact of technological advance in reducing energy intensity is limited due to the rebound effect. Zha et al. [
41] found that with energy efficiency improvement, energy efficiency rebound effect may occur. That means the expected benefits of energy conservation from energy efficiency improvement may partially be offset by the new increase in energy demand. Zha et al. [
42] found that the improvement of energy efficiency in electricity can achieve better carbon emissions reduction. However, because of the rebound effect, the reduction of carbon emissions from energy efficiency improvement could be partly offset. The carbon emissions would not decrease proportionally.
Increase in energy productivity improves energy efficiency. Energy productivity improvement will encourage industrial production. If energy price remains the same and energy demand increases, even though energy efficiency improves, energy consumption will still increase. The extra energy consumption promoted by economic activity will offset or even exceed the energy saved from the improvement of energy efficiency; that is, energy consumption will rebound. According to the above analysis, we assume that as the energy productivity of China’s heating industry improve, the carbon dioxide emissions would increase. Because the relevant data are unavailable in China, we have to select an index for energy productivity of China’s heating industry. Since central heating supply is the main heating supply method in China, energy efficiency of central heating supply could be chosen as index for energy productivity. Considering service properties of the central heating supply, we choose per capita area of central heating supply as the index. That is, we divide the area of central heating supply by the population density of the area of central heating supply. In other words, we choose per capita area of central heating supply as index for energy productivity of China’s heating industry. The data are obtained from
China Statistical Yearbook [
30].
4.6. Other Factors
In addition, other factors such as energy price may also have an impact on the carbon emissions. Nevertheless, energy price is highly regulated and kept relatively low by the government in China. In this case, consumers are not sensitive to the price, so we do not take per capita income into consideration. We therefore ignored these two factors in our paper.
Energy substitution is another important factor influencing CO2 emission. However, historical data on clean energy consumption of the heating industry are currently unavailable. Therefore, we are unable to take this factor into consideration in this paper.
5. Results and Discussion
5.1. Results of Co-Integration Analysis
5.1.1. Results of the Unit-Root Tests
Both the ADF and the PP test are adopted to examine the stationary of all the variables. The tests show that the test for the five variables are in levels and first differences (in
Table 1).
As shown in
Table 1, both the ADF test and the PP test verify that the five variables are first-difference stationary. As a result, we further test whether the long equilibrium relationship exists.
First, the Johansen co-integration rank test is carried out, which indicates the number of the linearly independent co-integration vectors. The consequence of rank test is listed in
Table 2.
5.1.2. Johansen–Juselius Co-Integration Rank Test
In
Table 2, trace tests verify that four linearly independent co-integration vectors exist at the 5% level. In
Table 3, maximum eigenvalue tests suggest that three linearly independent co-integration vectors exist at the 5% level.
5.1.3. Selection of Lag Intervals for VAR Model
To proceed with the co-integration analysis, the vector auto regression model (VAR) consisting of LnCE, LnEI, LnIS, LnLP and LnP is built. After that, it is required to determine lag intervals of the VAR model. According to the Sequential modified LR test statistic (LR), Final prediction error criteria (FPE), Akaike information criterion (AIC), Schwarz information criterion (SC), and Hannan–Quinn information criterion (HQ), the optimal lag order is chosen. The results indicate that a lag of 1 should be selected (in
Table 4).
Based on the analysis above, the co-integration equation can be obtained. In order to better explain CE, we select and normalized the co-integrating vector, which is consistent with our expectations and meets the economic reality. The normalized co-integration equation is obtained as follows:
The standard errors are listed in parentheses.
From the standardized Equation (2), several conclusions can be obtained as below:
Firstly, a long equilibrium relationship exists among CO2 emissions and the influencing factors, which include energy intensity, industrial scale, labor productivity, and energy productivity during the period of 1985–2010.
Secondly, the positive coefficients of the variables demonstrate that an increase in energy intensity, industrial scale, labor productivity, and energy productivity increase the CO2 emissions in the long term, which is consistent with our expectation and the social economic reality in China. Furthermore, the elasticity coefficients indicate that a 1% rise in energy intensity, industrial scale, labor productivity, and energy productivity can result in a 0.170%, 0.274%, 0.448%, and 0.628% increase in CO2 emissions, respectively.
Thirdly, both energy productivity and labor productivity improvements have the strongest impact on CO2 emissions. Industrial scale is closely associated with CO2 emissions. The elasticity coefficient of energy intensity is lower than the elasticity coefficient of the other three variables. In China, rapid economic development facilitates urbanization and industrialization. With GDP growth, industrial scale expands. Rapid development of industrialization results in energy consumption expansion. Mechanization is the inevitable result of rapid industrialization. Mechanization can result in more machines and less labor input, and can improve labor productivity. Improvement in labor productivity could lead to machines taking the place of workers. While energy productivity improves and energy price remains the same, more energy can be consumed than before. Improvements in energy productivity and labor productivity accelerate mechanization and industrialization, leading to more energy consumption. Meanwhile, energy price has been relatively low in China as it is regulated by the government. As a result, the underestimated energy price is unable to contribute to energy conservation. Heating fees is also controlled to low levels by the government, which limits the impact of heat price on carbon dioxide emission reduction.
In summary, we regard this model as reasonable, because it is consistent with our expectations and it adequately explains China’s current economic reality. Subsequently, we conduct the stability test for the co-integration model.
5.2. Stability Test
The results of the stability test presented (in
Table 5) show that all the eigenvalues of adjoined matrix lying inside the unit circle. Thus, the VAR model is stable and reliable.
5.3. Model Fitting Accuracy
We firstly verify the accuracy of the co-integration equation. As
Figure 2 displays, the estimated values of the model equation fit the actual values well. Next, we conduct verification on the forecast function of the model.
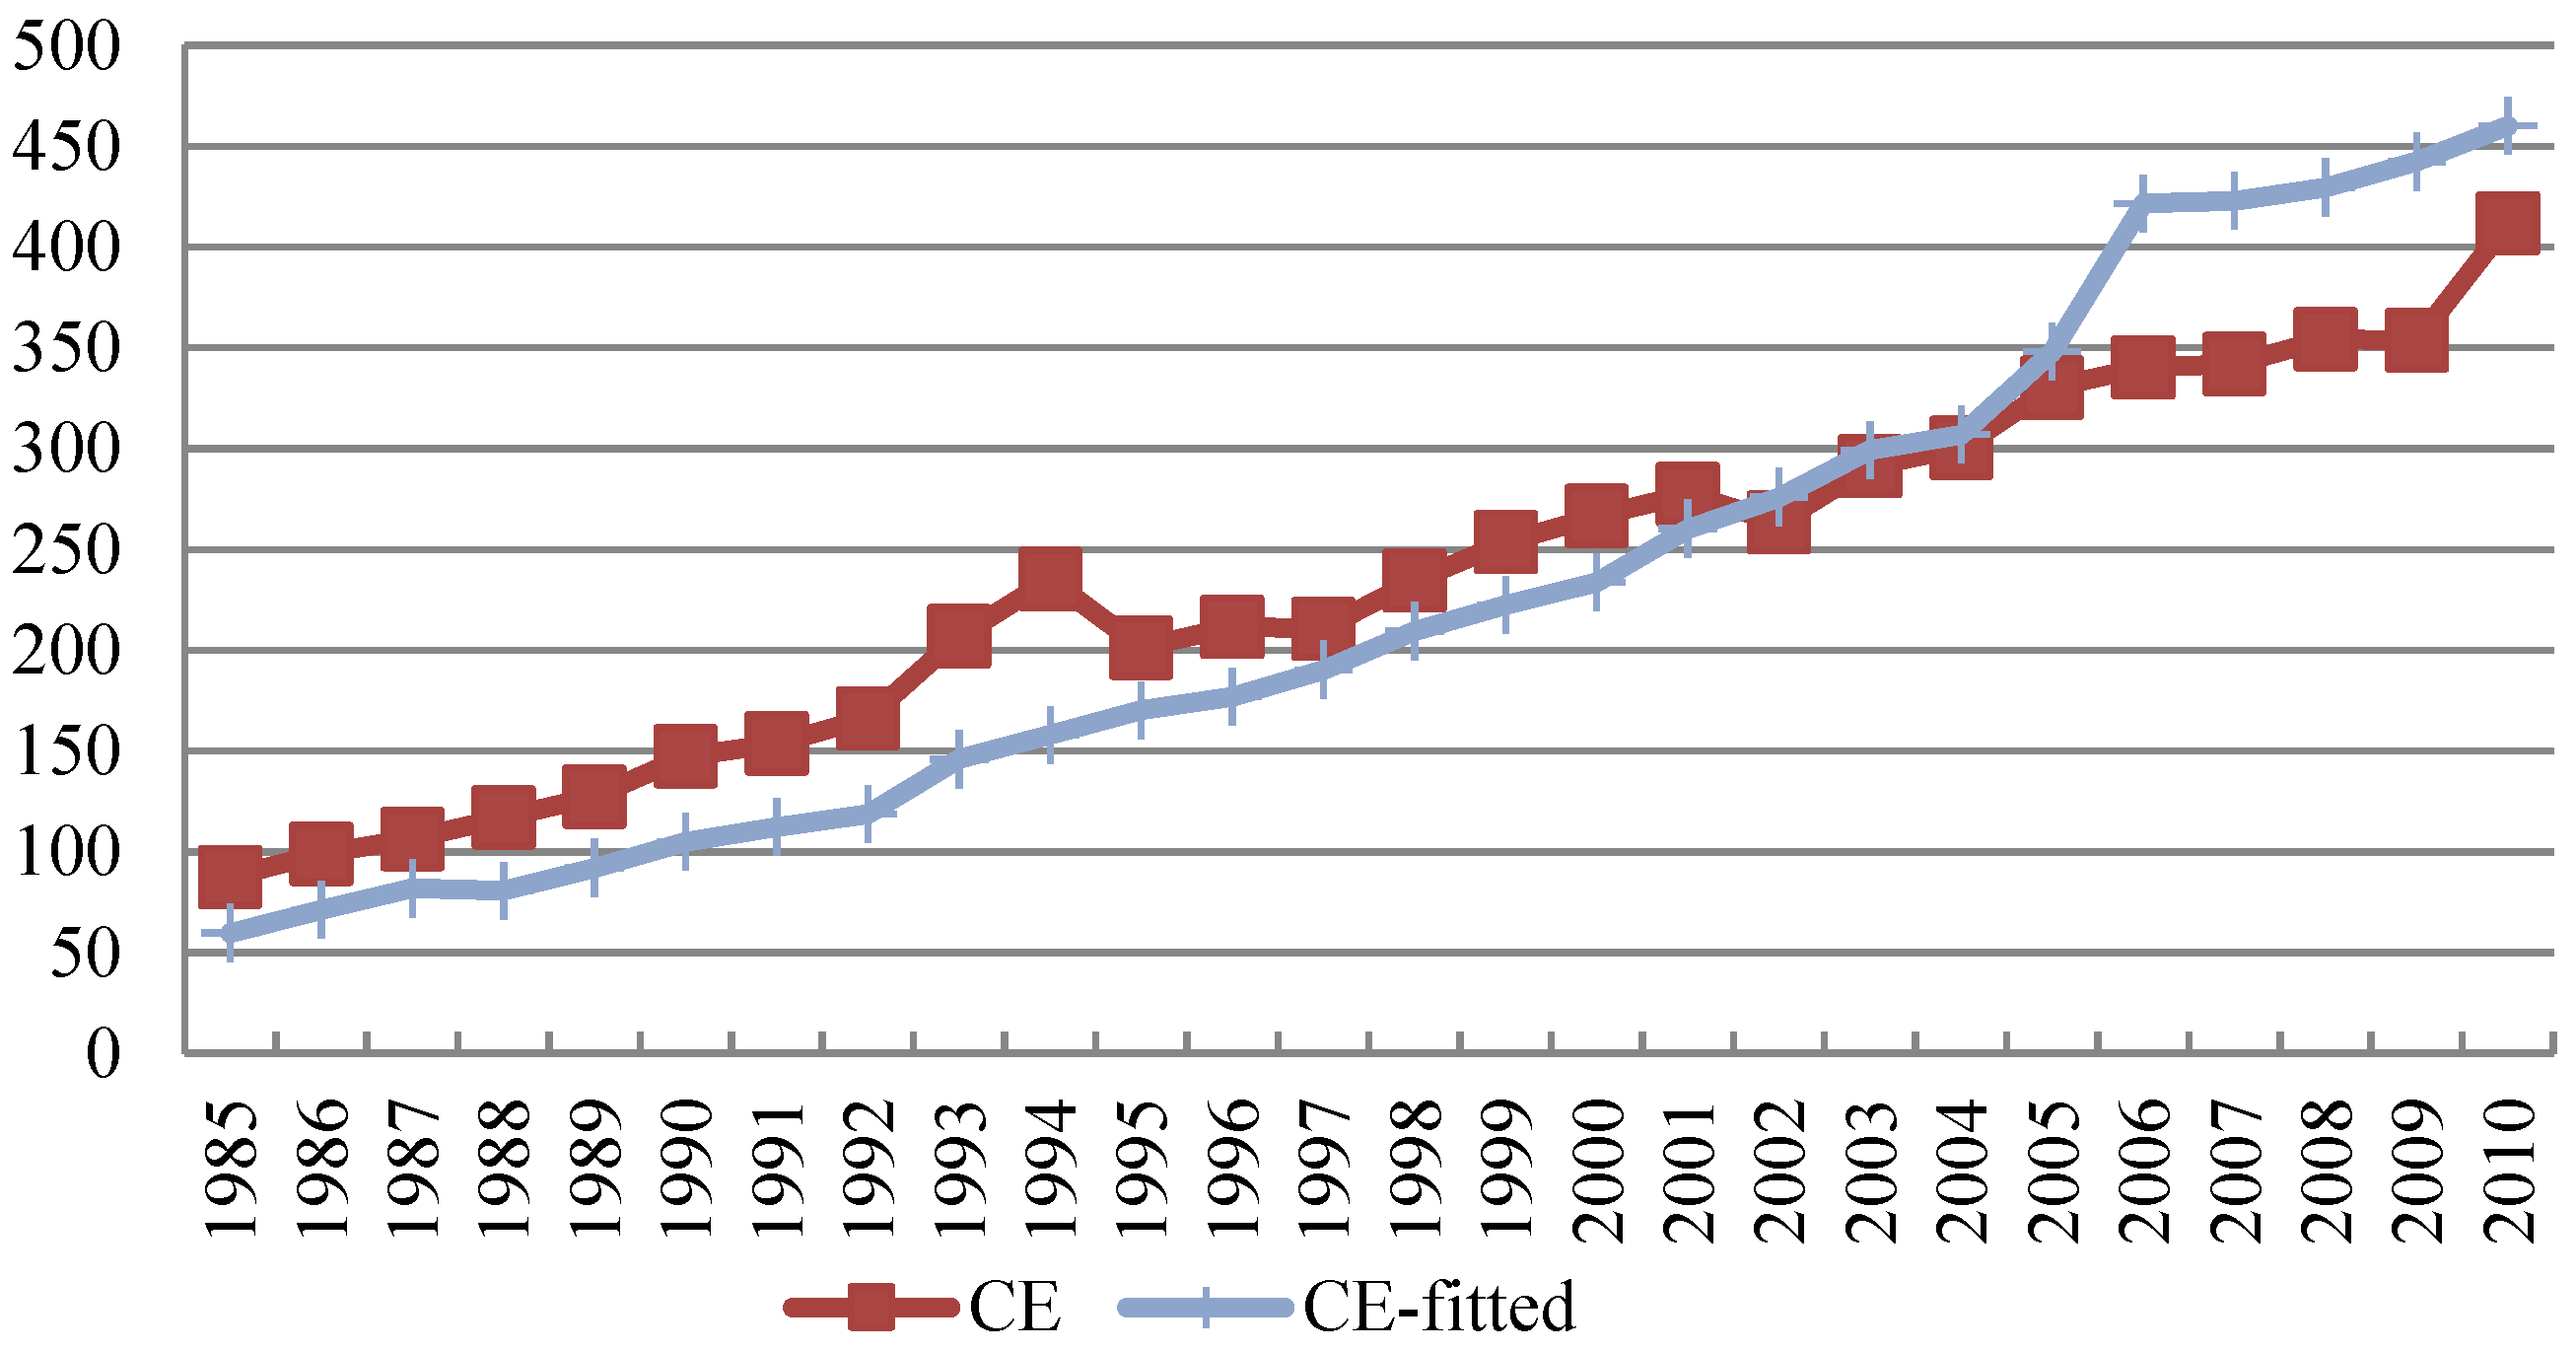
To ensure the forecast is reliable, energy intensity, industrial scale, labor productivity and energy productivity data during the period 1985–2010 are substituted into Equation (2) and the estimates of CO
2 emissions of the heating industry during the past 26 years are obtained (
Figure 3). It is found that the curve of the fitted values fits the curve of actual values. Hence, we can proceed to forecast CO
2 emissions in China’s heating industry.
Future CO2 emissions in China’s heating industry are able to be predicted by the co-integration equation. Before prediction, we have to confirm the tendency of independent variables.
Figure 4 shows the changing trends of carbon dioxide emissions (CE) and energy intensity (EI), industrial scale (IS), labor productivity (LP) and energy productivity (P). Based on the trend, we suppose the average annual growth rates of these variables during 1985–2010 as the baseline scenario (hereinafter referred to as BAU). Specifically, under the BAU condition, all the variables are assumed to maintain their historical average growth rate. This makes it possible to predict the future CO
2 emission in China’s heating industry. That is, under the BAU condition, average annual growth rates of EI, IS, LP and P are −8.51%, 4.3%, −18.3% and 26.5%, respectively.
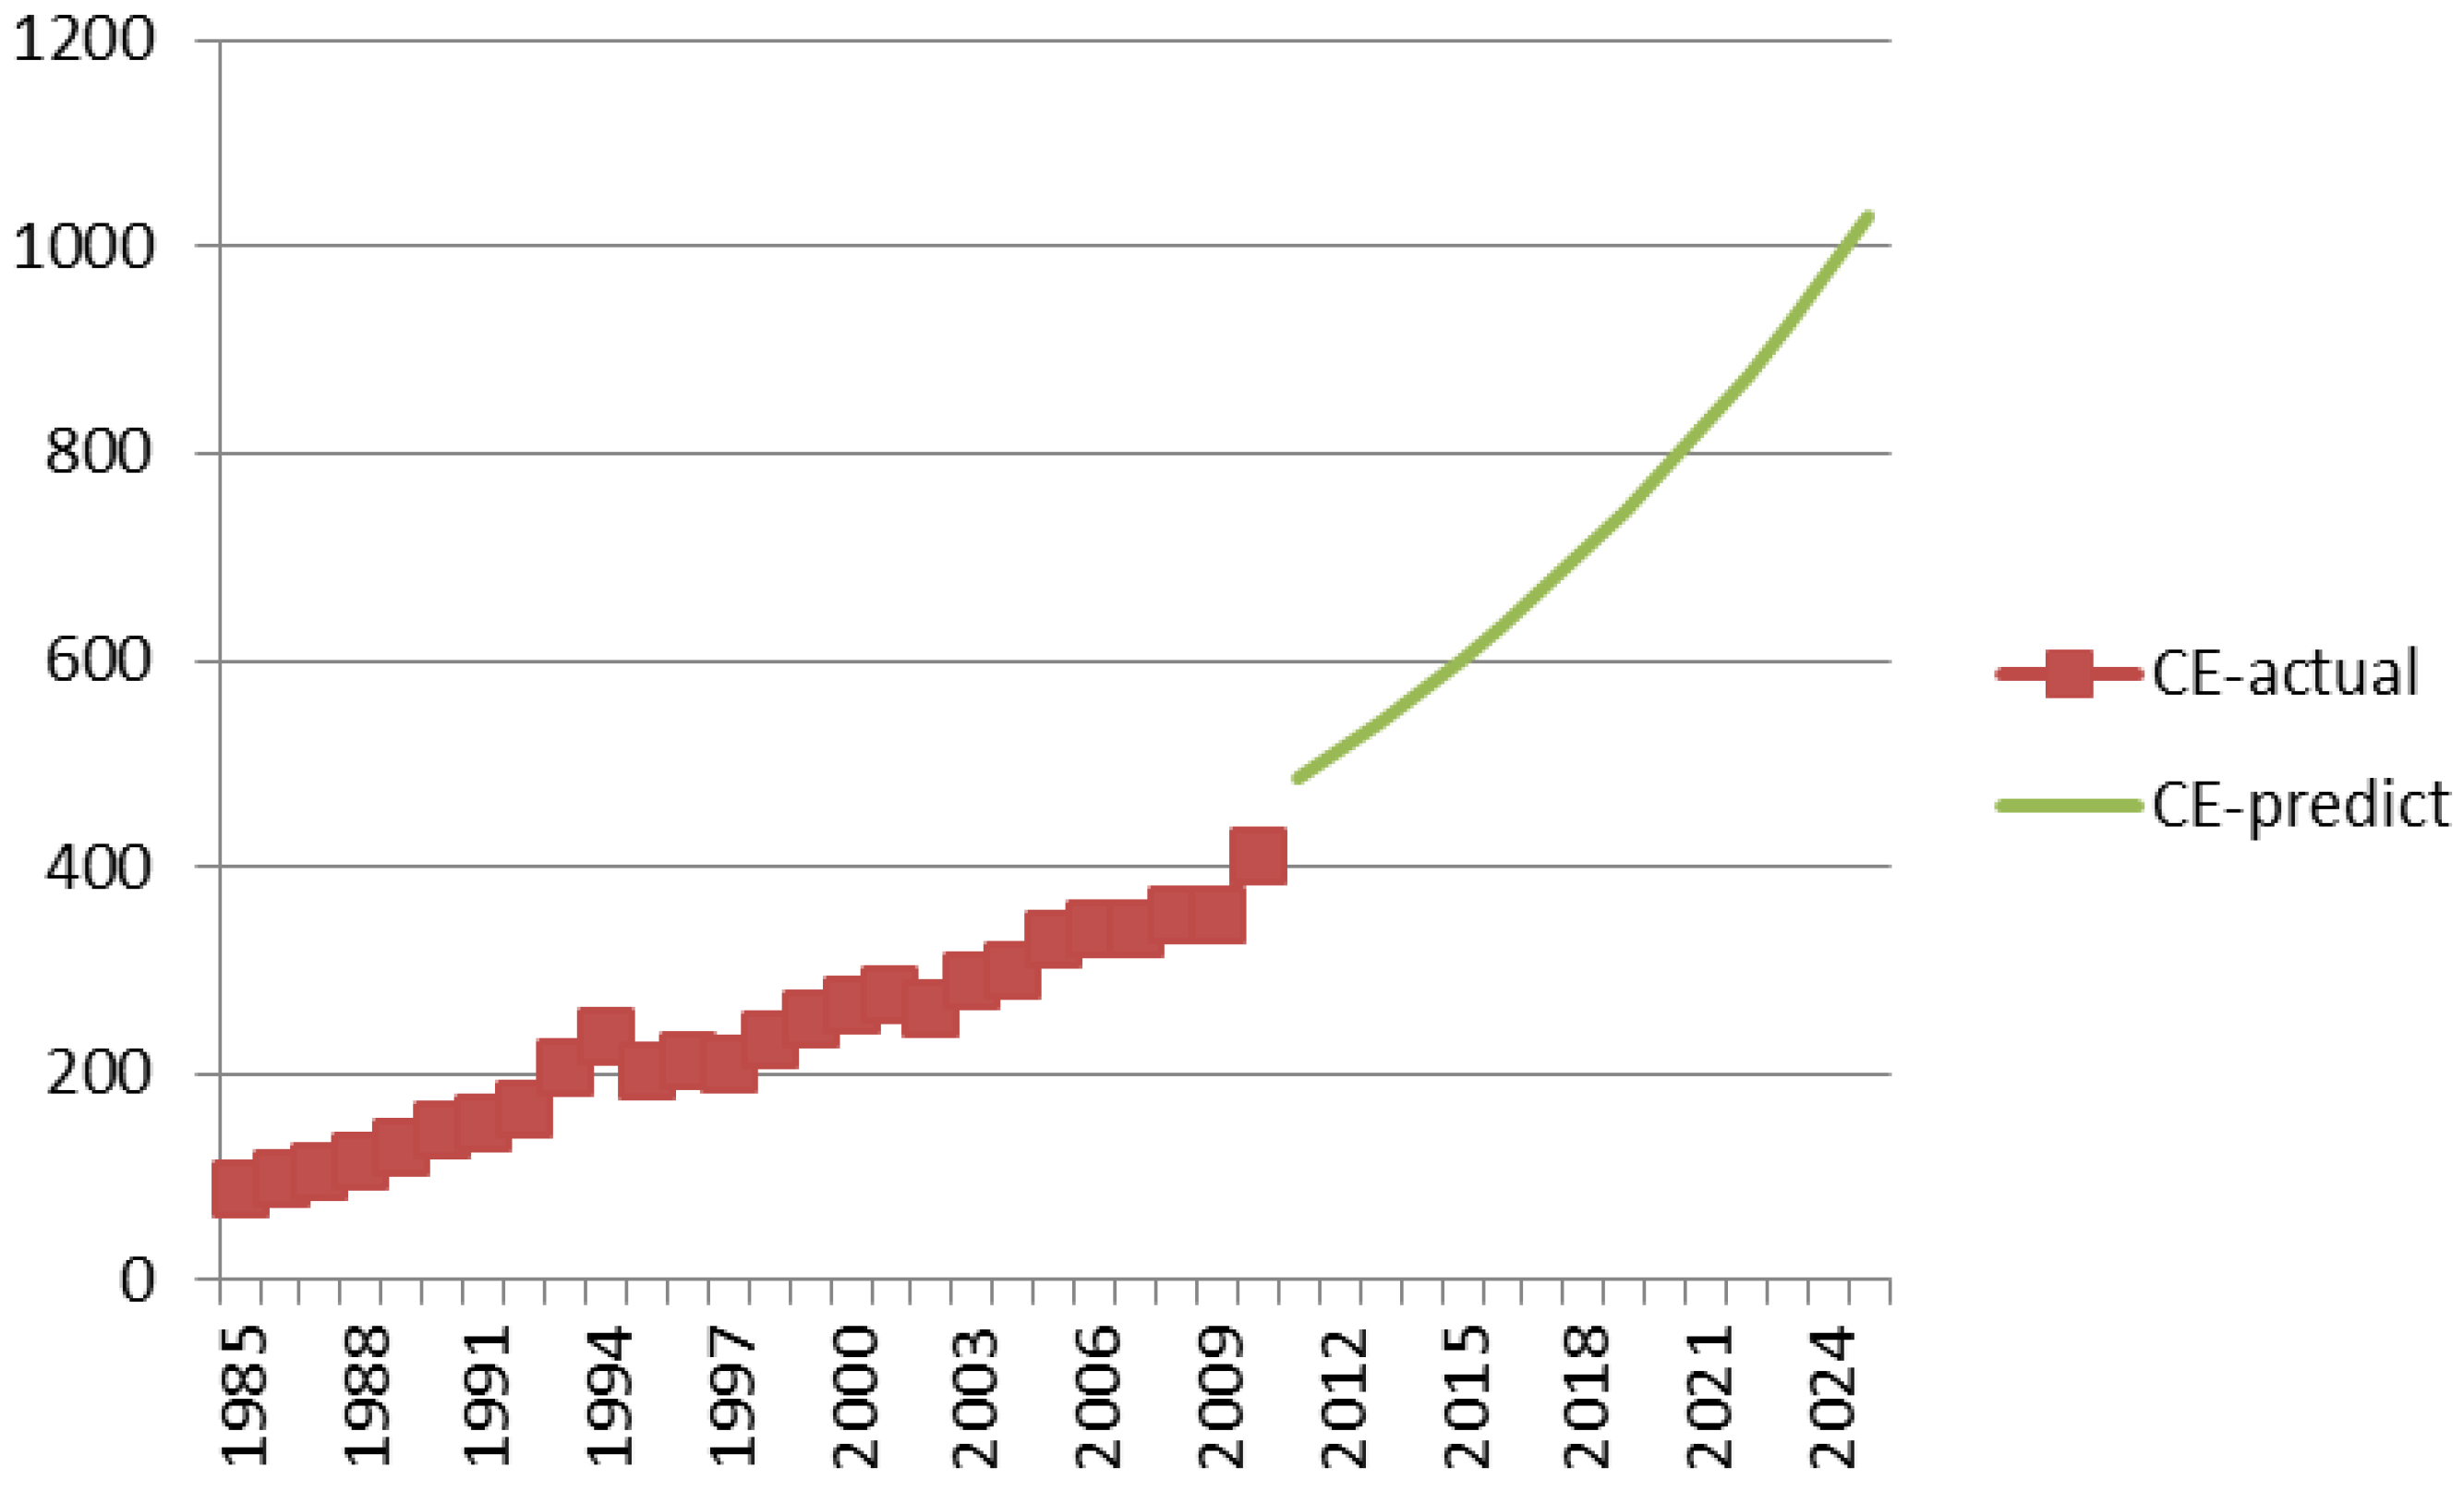
Our forecast period is from 2011 to 2025 (12th Five-Year Plan, 13thFive-Year Plan, and 14th Five-Year Plan), because this period is critical for China’s transition to sustainable development, and the prediction of CO2 emissions during this period can provide references for policies on reducing energy consumption and carbon emissions in China’s heating industry.
Upon the historical growth rates of all the independent variables mentioned above and the co-integration equation (Equation (2)), the CO
2 emissions in China’s heating industry in 2020 and 2025 are predicted as 786.85 Mtce and 1028.98 Mtce, respectively (in
Figure 5).
5.4. Mitigation Potential of CO2 Emissions in Different Scenarios
5.4.1. Scenario Design
In addition to BAU, we set two more carbon dioxide emissions reduction scenarios: the moderate scenario and the advanced scenario. The three scenarios are set as follows: (i) The BAU scenario is set on the basis of the historical growth rates of the variables during 1985–2010. The BAU scenario reflects a possible trend of the growth of carbon dioxide emission if the industry develops in its current way. The BAU scenario is the base for setting the other two scenarios. (ii) The moderate scenario is an intermediate situation that the government implement a set of mild policies to guide the industry to reduce CO
2 emissions, and it is between the BAU and the advanced scenario. (iii) The advanced scenario is a strict circumstance, in which the government implements a set of strict policies to force the industry to reduce the largest amount of CO
2 emissions within the economic reality. As previously mentioned, the other two scenarios are based on the BAU scenario. Considering that a set of carbon emission reduction policies may lower the development of the industry, we set the growth rates of the variables a bit lower than the historical growth rate. According to the 13th Five-Year Plan, GDP growth is expected to be 6.5%–7%, which floats within the range of 0.5%. Considering the heating industry is closely related to people’s daily life, it is necessary to maintain a smooth and stable development of the industry. Therefore, we set the change of the growth rates of the variables within 0.5% under the designed scenarios. The advantage of the scenario analysis is that we can have a relatively comprehensive analysis on the possible results of CO
2 emissions, so that different policies on energy utilization and carbon dioxide emissions can be compared. The purpose of setting these three scenarios are not to provide precise estimates of the specific economic conditions but to make references for the major factors that contribute to the future CO
2 emissions reduction. All of the hypothetical variables are shown in
Table 6.
5.4.2. Risk Analysis
The above estimation is made on the historical trends of all the independent variables during the sample period. However, the average annual growth rates of independent variables in the future is not yet known. Reasonable predictions should consider multiple probabilities and their corresponding consequences. Therefore, we adopt risk analysis, and focus on the most possible carbon dioxide emissions of the heating industry and its corresponding probability in 2025.
We use the Monte Carlo simulation to generate random numbers in accordance with the distributions of the annual growth rates of independent variables. The estimates of the dependent variable (CO
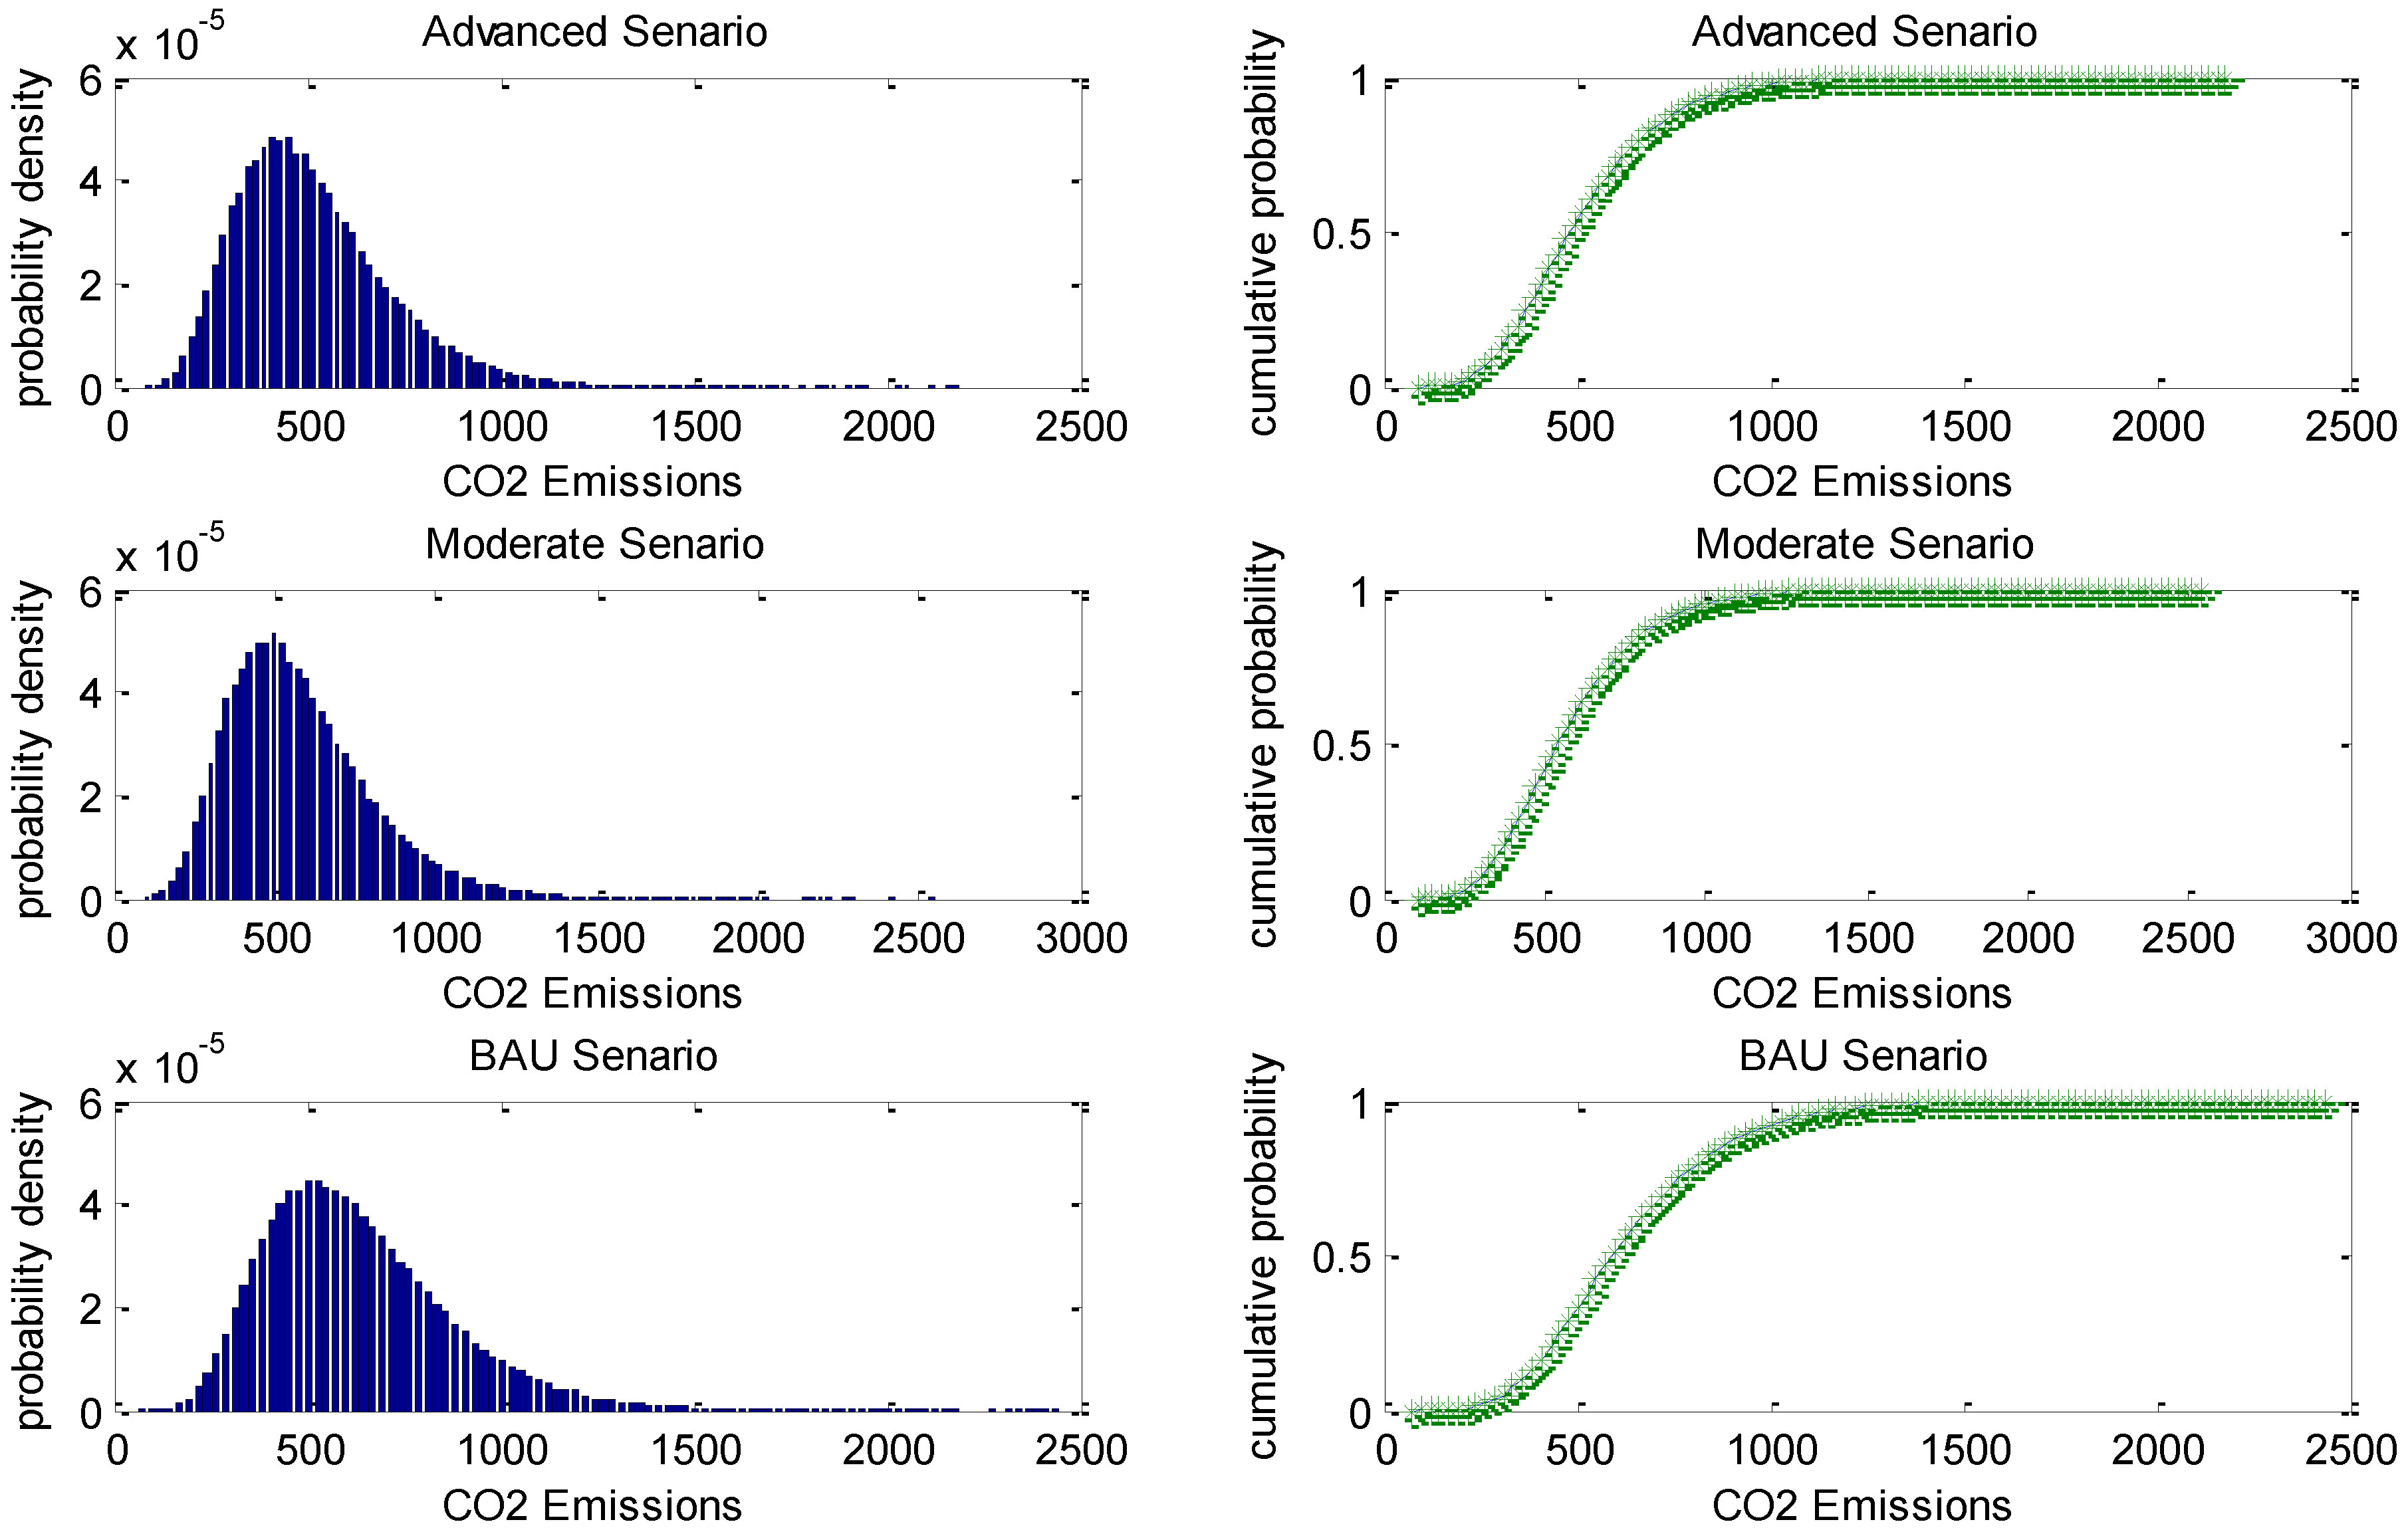
2 emissions of China’s heating industry) in 2025 can be generated upon these random numbers. Conducting the simulations 100 thousand times, 100 thousand groups of random numbers are generated, and accordingly 100 thousand possible values of carbon dioxide emissions in 2025 and their corresponding probability distributions are calculated. From the Monte Carlo simulated analysis, the distribution histogram and cumulative probability curves of CO
2 emissions of China’s heating industry in 2025 are presented in
Figure 6.
Figure 6 shows that under the BAU scenario, [155, 1120] Mtce is the probability distributions for carbon emissions in 2025 with the significance level of 5%, and the probability of carbon emissions in 2025 reaching 1120 Mtce is approximately 100%. Under the moderate scenario, [141, 1025] Mtce is the probability distributions for carbon emissions in 2025 with the significance level of 5%, and the probability of carbon emissions in 2025 reaching 1025 Mtce is approximately 100%. Under the advanced scenario, [122, 919] Mtce is the probability distributions for carbon emissions in 2025 with the significance level of 5%, and the probability of carbon emissions in 2025 reaching 919 Mtce is approximately 100%. The predicted values of the carbon emissions are 1028.98 Mtce, 978.354 Mtce and 906.881 Mtce in 2025 under the BAU scenario, moderate scenario and advanced scenario, respectively. Compared with the probability distributions, we find that the predicted values of carbon emissions in 2025 under the three scenarios lie in the maximum probability distribution.
The Monte Carlo simulated analysis results satisfy our initial prediction.
5.4.3. Reduction Potential of CO2 Emissions
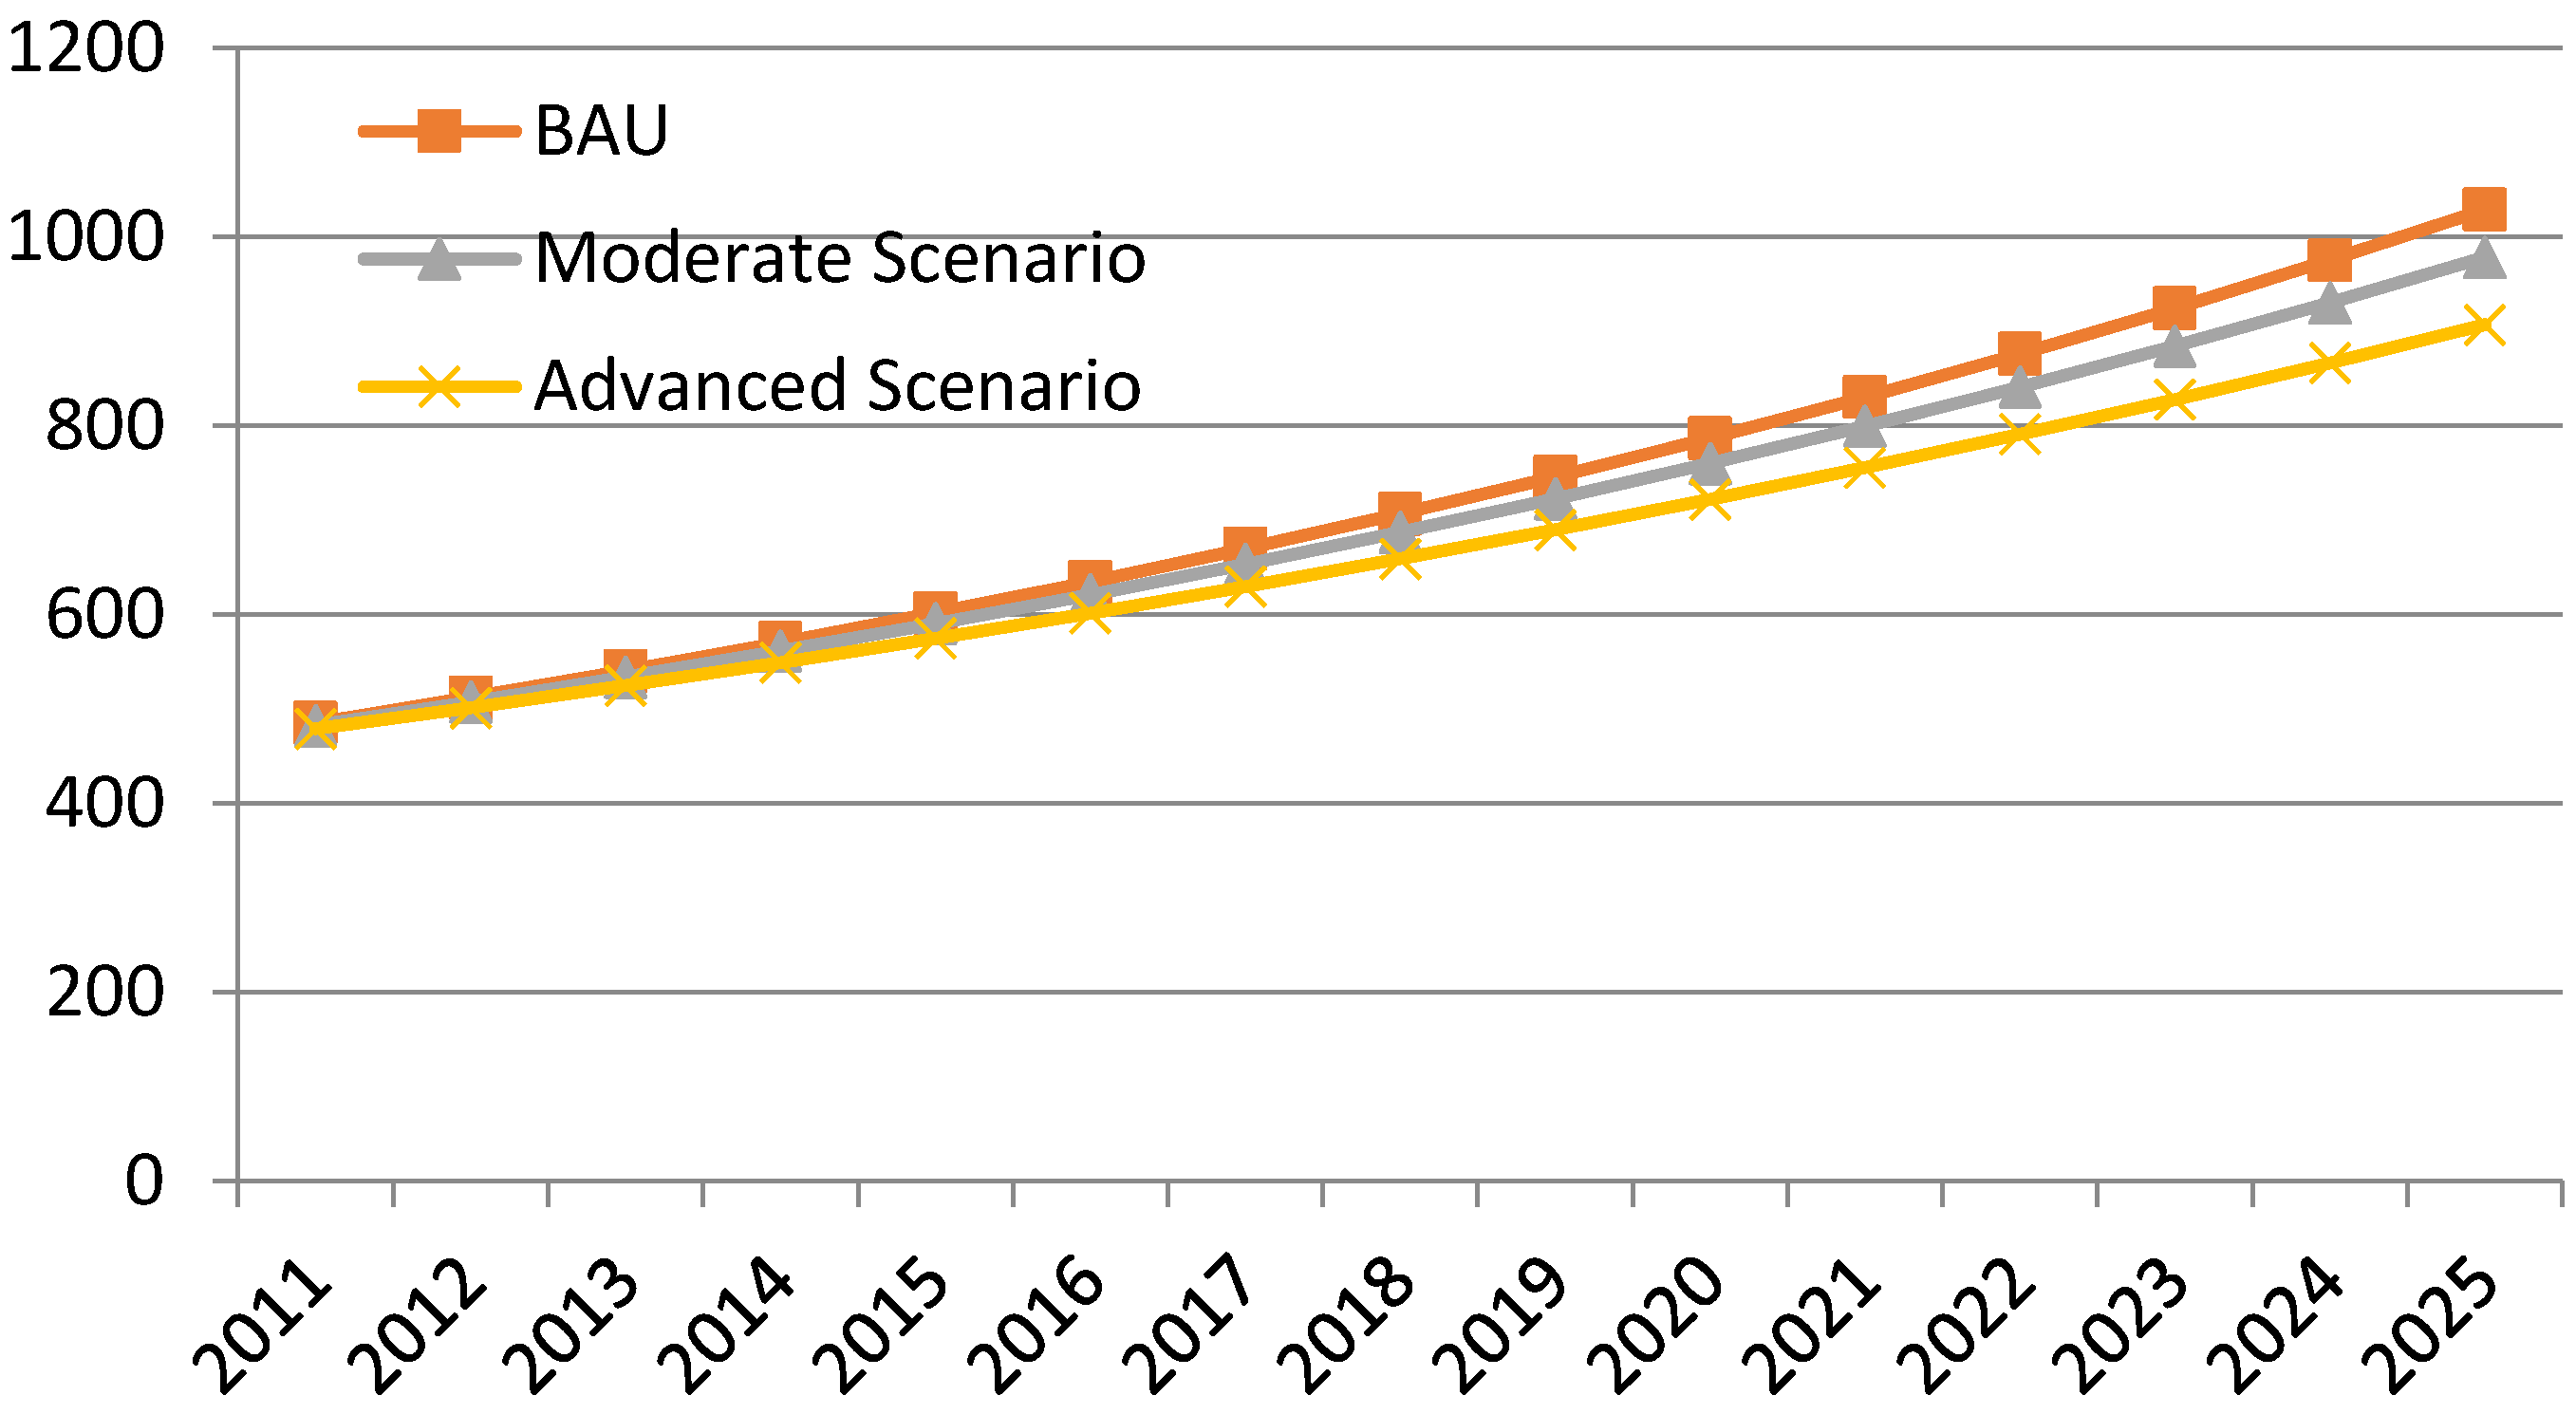
Using the co-integration equation (Equation (2)), the growth trends of the independent variables under the differentiated scenarios mentioned above can be obtained, and we can thus predict future values of CO
2 emissions in China’s heating industry under the differentiated scenarios.
Figure 7 and
Table 7 present the prediction results.
Table 7 shows the prediction results. CO
2 emissions in China’s heating industry in 2020 will be 760.155 Mtce under the moderate scenario, and 722.037 Mtce under the advanced scenario, decreasing by 3.39% and 8.24%, respectively, compared with the BAU scenario. CO
2 emissions in China’s heating industry in 2025 will reach 978.354 Mtce under the moderate scenario and 906.881 Mtce under the advanced scenario, decreasing by 4.92% and 11.87%, respectively, compared with the BAU scenario.
After the estimates of potential of CO2 emissions reduction in China’s heating industry, estimating the amount of CO2 emissions reduction and its impact on China’s CO2 emissions is possible. In the moderate emission scenario, CO2 emissions in China’s heating industry transit from the BAU to the moderate situation. In the same way, in the advanced emissions reduction scenario, CO2 emissions in China’s heating industry transits from the BAU to the advanced stage.
Based on the estimates of CO
2 emissions in China’s heating industry under the designed scenarios listed in
Table 7, the amount of CO
2 emissions reduction and its impact on China’s CO
2 emissions under different scenarios are obtained (presented in
Table 8).
From
Table 8, we can see that there is considerable potential of CO
2 emissions reduction in China’s heating industry in 2020 and 2025. From the BAU to the moderate situation, 26.694 Mtce CO
2 emissions can be reduced in 2020, accounting for 0.181% of China’s carbon dioxide emissions and 3.392% of the industry’s carbon dioxide emissions. In addition, 64.812 Mtce CO
2 emissions can be reduced in 2025, accounting for 0.327% of China’s total CO
2 emissions and 8.237% of the industry’s CO
2 emissions. From the BAU to the advanced scenario, 50.626 Mtce CO
2 emissions can be reduced in 2020, accounting for 0.342% of China’s CO
2 emissions and 4.920% of the industry’s carbon dioxide emissions. In addition, 122.099 Mtce CO
2 emissions can be reduced in 2025, accounting for 0.615% of China’s CO
2 emissions and 11.866% of the industry’s CO
2 emissions. The results indicate that there is a considerable CO
2 emissions mitigation potential in China’s heating industry. Therefore, the realization of CO
2 reduction in China’s heating industry is achievable, which contributes to China’s carbon dioxide emissions reduction strategy.
6. Conclusions
This paper focuses on the estimation of potential of carbon emissions reduction in China’s heating industry. We adopt the co-integration method to investigate the relationship between CO2 emissions and factors including energy intensity, industrial scale, labor productivity and energy productivity. The results indicate that a 1% growth in energy intensity, industrial scale, labor productivity, and energy productivity lead to a 0.170%, 0.274%, 0.448%, and 0.628% increase in the industry’s CO2 emissions, respectively. China’s heating industry has great potential for carbon emission reduction.
Policy implications of this paper can be provided for China’s heating industry as follows.
Firstly, there is need to lower the energy intensity of China’s heating industry. Efforts should be made to enhance technical transformation and eliminate obsolete equipment with serious pollution and intensive energy consumption to achieve improvement of energy efficiency in the heating industry. The low-carbon concept should also be promoted in the heating industry. Meanwhile, energy conservation and carbon dioxide emissions reduction policies should be promoted.
Secondly, as an energy intensive consumption industry, China should not irrationally expand its heating industry but should ensure appropriate development by optimizing the resource allocation, upgrading the industry and developing heat recovery technologies. Highly-efficient heating systems and a variety of clean energy-source heating systems such as absorption heat pumps, geothermal heat pump systems, air source heat pump systems, and drain-water heat pump systems should be encouraged.
Thirdly, there is need to adjust the energy mix of China’s heating industry and change the situation of heavy reliance on a single source of energy. China’s heating industry should make carbon dioxide emissions reduction practically feasible and gradually reduce the consumption of coal-related energy sources by substituting coal with other low pollution energy resources or clean energy, such as natural gas, solar power, biomass energy, ground-source, water-source, air-source and nuclear power.
Fourthly, the improvement of labor productivity in China’s heating industry mainly comes from the rapid development of industrialization and mechanization. It is necessary to put great efforts into technology innovation. This should include the importation of advanced technologies, development of new products, and enhancement of technical skills, especially the training of skilled high-tech labors.
Fifthly, in order to mitigate energy consumption rebound, it is required to realize energy conservation while improving energy efficiency of China’s heating industry. The government should implement a set of policies combing tax preference with pricing mechanism to guide the heating industry to switch to less carbon-intensive energy, such as natural gas or coal bed gas.
Lastly, although energy price is controlled to low levels by the government, its impact on CO2 emissions cannot be ignored. In the future, market-oriented energy pricing reform is necessary. Consequently, considerable reductions in CO2 emissions in China’s heating industry could be realized, which would significantly contribute to China’s carbon dioxide emissions reduction.


