Article

Exploring Spatial-Temporal Patterns of Urban Human Mobility Hotspots

State Key Laboratory of Information Engineering in Surveying, Mapping, Remote and Sensing, Wuhan University, Wuhan 430079, China
*
Author to whom correspondence should be addressed.
Sustainability 2016, 8(7), 674; https://0-doi-org.brum.beds.ac.uk/10.3390/su8070674
Submission received: 8 May 2016 / Revised: 26 June 2016 / Accepted: 5 July 2016 / Published: 16 July 2016

Abstract

:
Understanding human mobility patterns provides us with knowledge about human mobility in an urban context, which plays a critical role in urban planning, traffic management and the spread of disease. Recently, the availability of large-scale human-sensing datasets enables us to analyze human mobility patterns and the relationships between humans and their living environments on an unprecedented spatial and temporal scale to improve decision-making regarding the quality of life of citizens. This study aims to characterize the urban spatial-temporal dynamic from the perspective of human mobility hotspots by using mobile phone location data. We propose a workflow to identify human convergent and dispersive hotspots that represent the status of human mobility in local areas and group these hotspots into different classes according to clustering their temporal signatures. To illustrate our proposed approach, a case study of Shenzhen, China, has been conducted. Six typical spatial-temporal patterns in the city are identified and discussed by combining the spatial distribution of these identified patterns with urban functional areas. The findings enable us to understand the human dynamics in a different area of the city, which can serve as a reference for urban planning and traffic management.

1. Introduction

Rapid urbanization motivates a large number of people to immigrate to cities from the countryside within a short period of time, which can cause urban problems: traffic congestion, the shortage of resources and environmental degradation [1,2]. The emergence of these problems is closely related to human mobility in a city. The mismatch between human activities in the city and urban infrastructures may be the main reason for these problems. For example, an imbalance of work-home in urban local areas would lead to traffic congestion, which can cause air pollution due to automobile exhaust emissions Therefore, an understanding of human mobility patterns plays an important role in solving these urban problems. It can help urban agencies understand the underlying driving forces of people in cities and to develop a better city for urban humanity by planning efficient urban transportation systems, optimizing environmentally-friendly function areas and allocating resources.
A conventional approach to investigate human mobility utilizes datasets that are derived from questionnaires or travel dairies. These datasets include detailed information about human activities that can be used to analyze human activity patterns. However, the sample sizes of the datasets are very small, their use costly, and the datasets are not easily updated in real time. These limitations may cause the datasets to lack the ability to provide comprehensive and real-time evidence for the study of human mobility patterns in a city [3]. Due to the rapid development and widespread use of location-aware devices, the collection of large-scale human sensor datasets, such as mobile phone data, taxi trajectories, smart card data and social media check-in data, has been improved [4,5,6]. These datasets can track long-term human movements, encompass a large number of people and sense the real-time dynamics of urban citizens. Therefore, the study of human mobility is flourishing and has attracted substantial attention in different research communities, including physics [7], geographical information science [8], transportation research [9,10], urban geography [11,12], urban planning [13] and epidemiology [14].
People moving with different purposes (for work, sleeping or recreation) and the spatial distribution of urban functional areas cause the occurrence of human convergence and dispersion and the appearance of human mobility hotspots in different areas. A human mobility hotspot refers to a location with relatively higher mobility activity than its neighbor locations; it summarizes the status of the human mobility of the local area [15]. For example, the hotspots could highlight some areas with high travel demand (high inflow or outflow). Therefore, the identification of these hotspots and their dynamic (changing over space and time) can provide a general insight into human mobility in the city. In this study, we focus on analyzing spatial-temporal patterns of human mobility hotspots using massive mobile phone location data from Shenzhen, China. Our contributions can be summarized as follows:
(1)
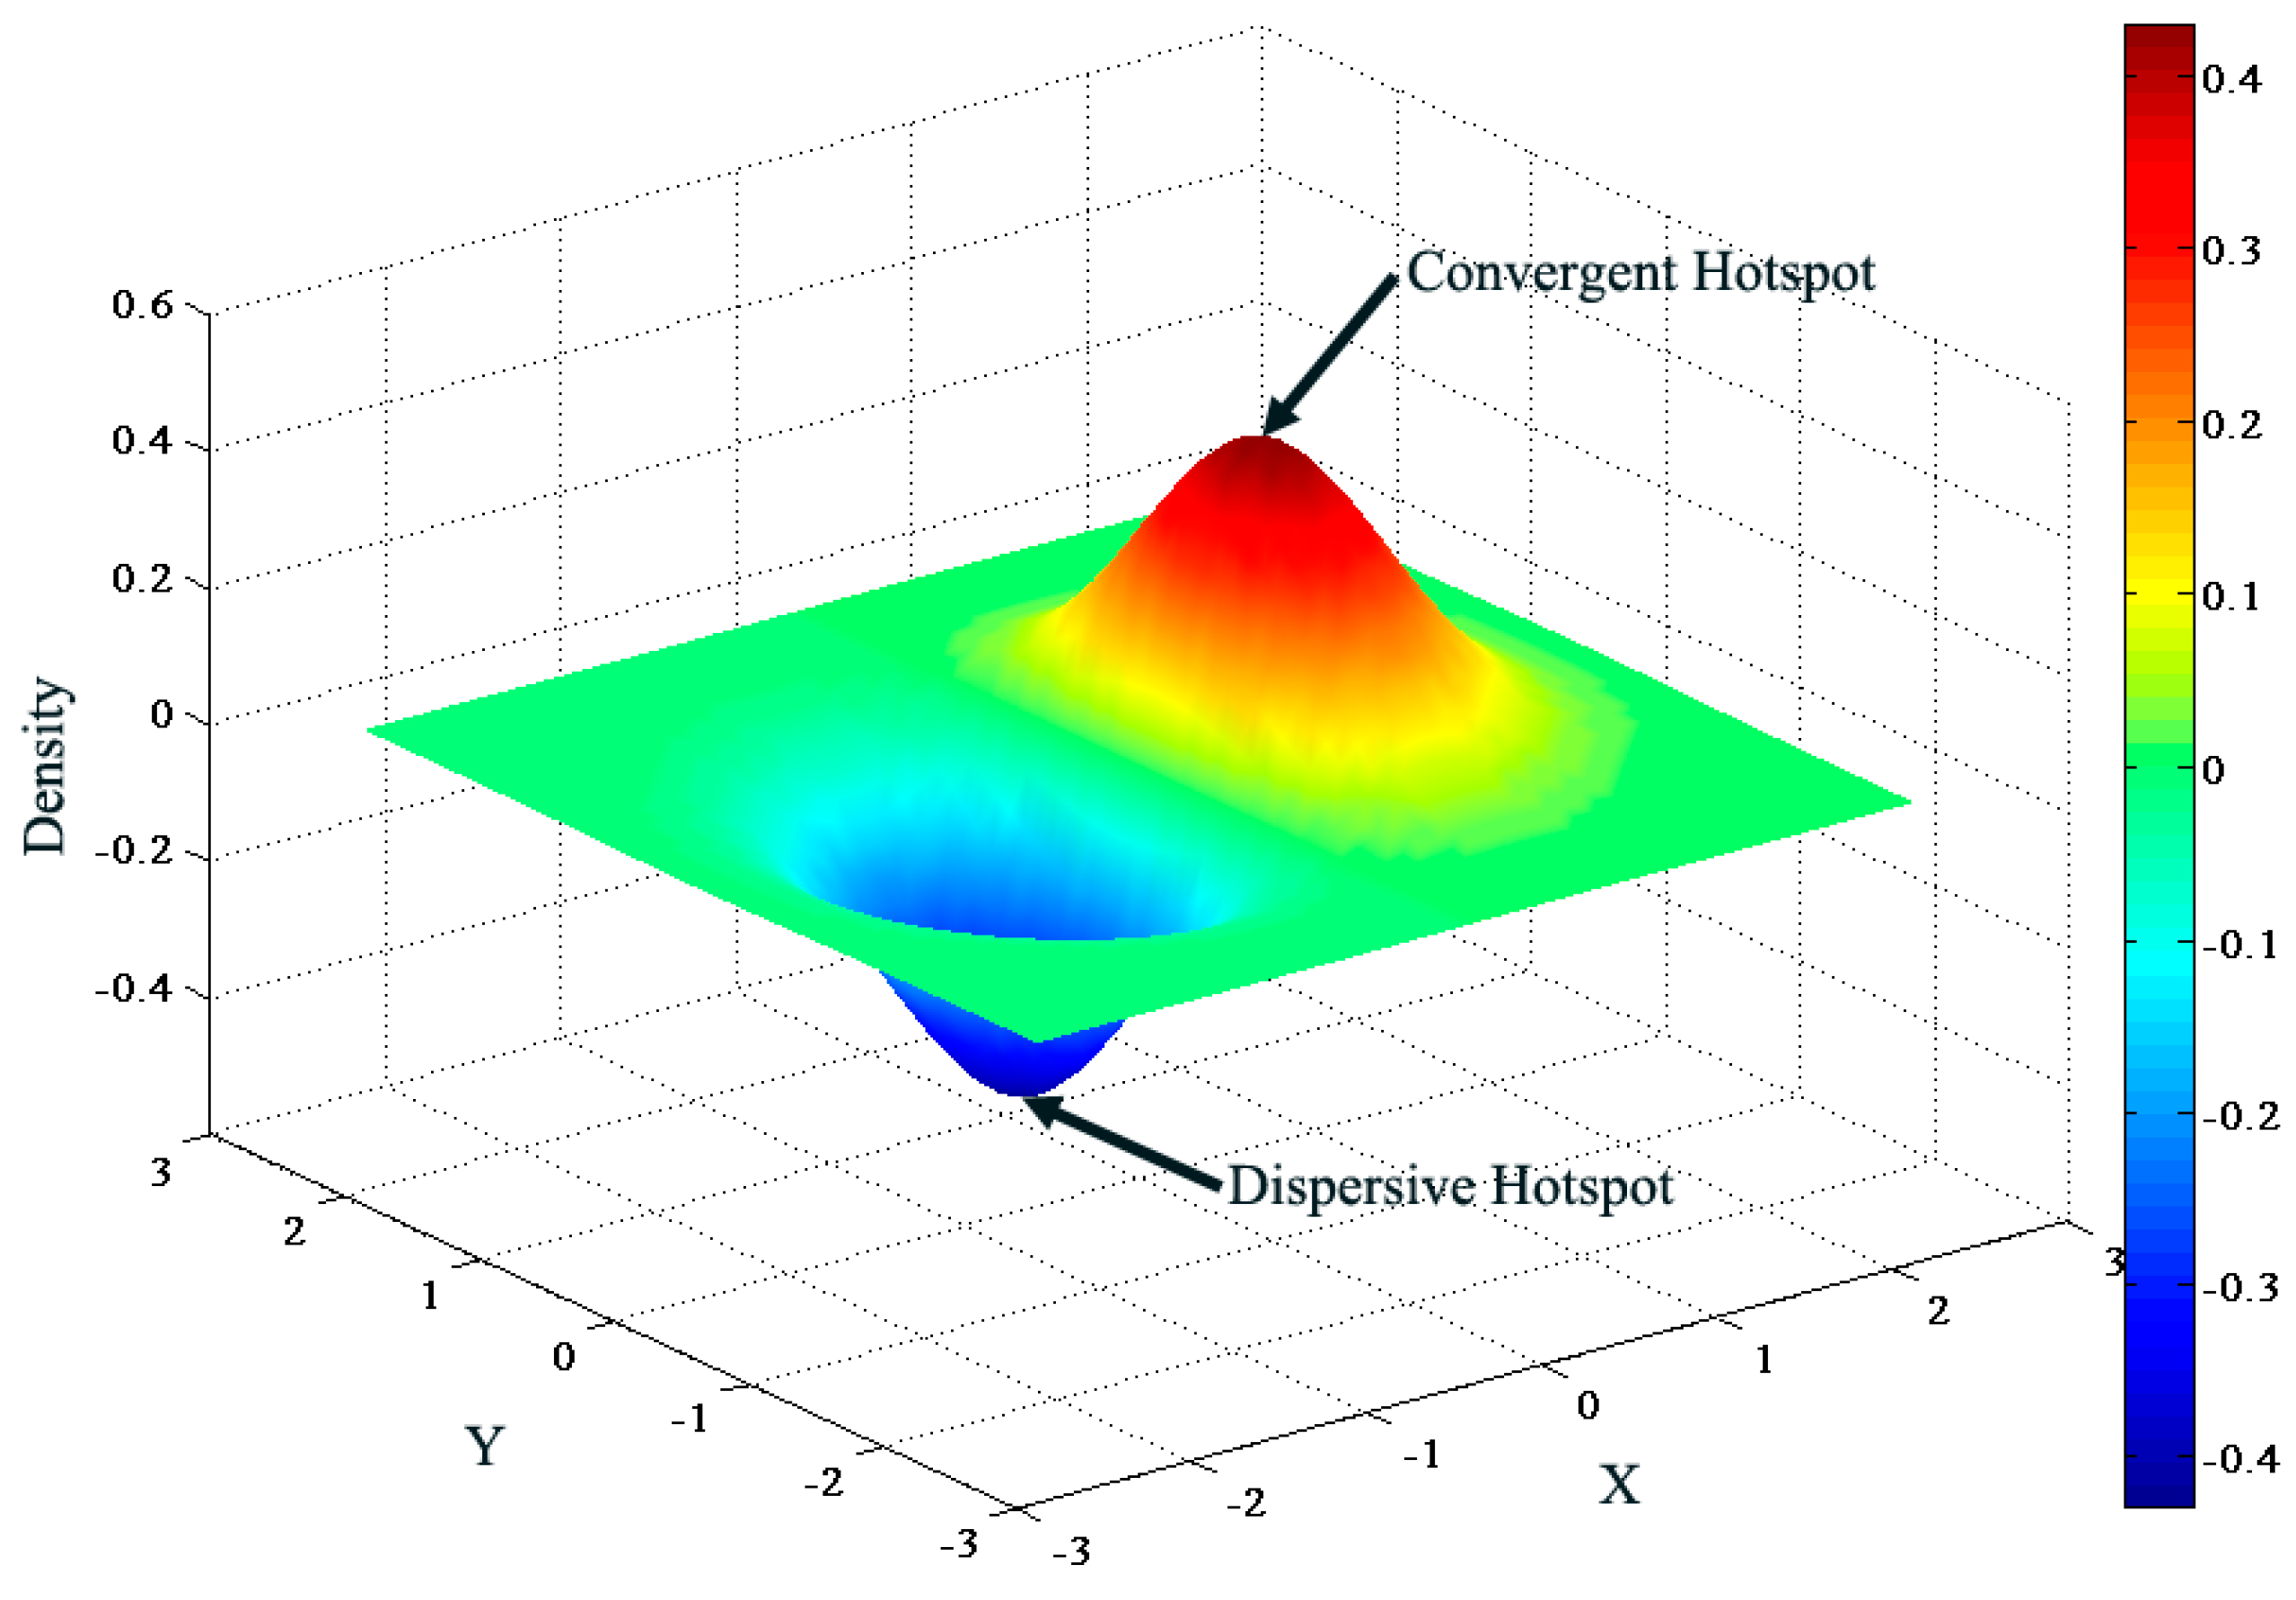
We develop a methodological workflow to identify human mobility hotspots, including convergent and dispersive hotspots. These hotspots can give insight into where, when and to what extent human convergence or dispersion occurs in urban areas, which allows us to observe the city from a dynamic perspective.
(2)
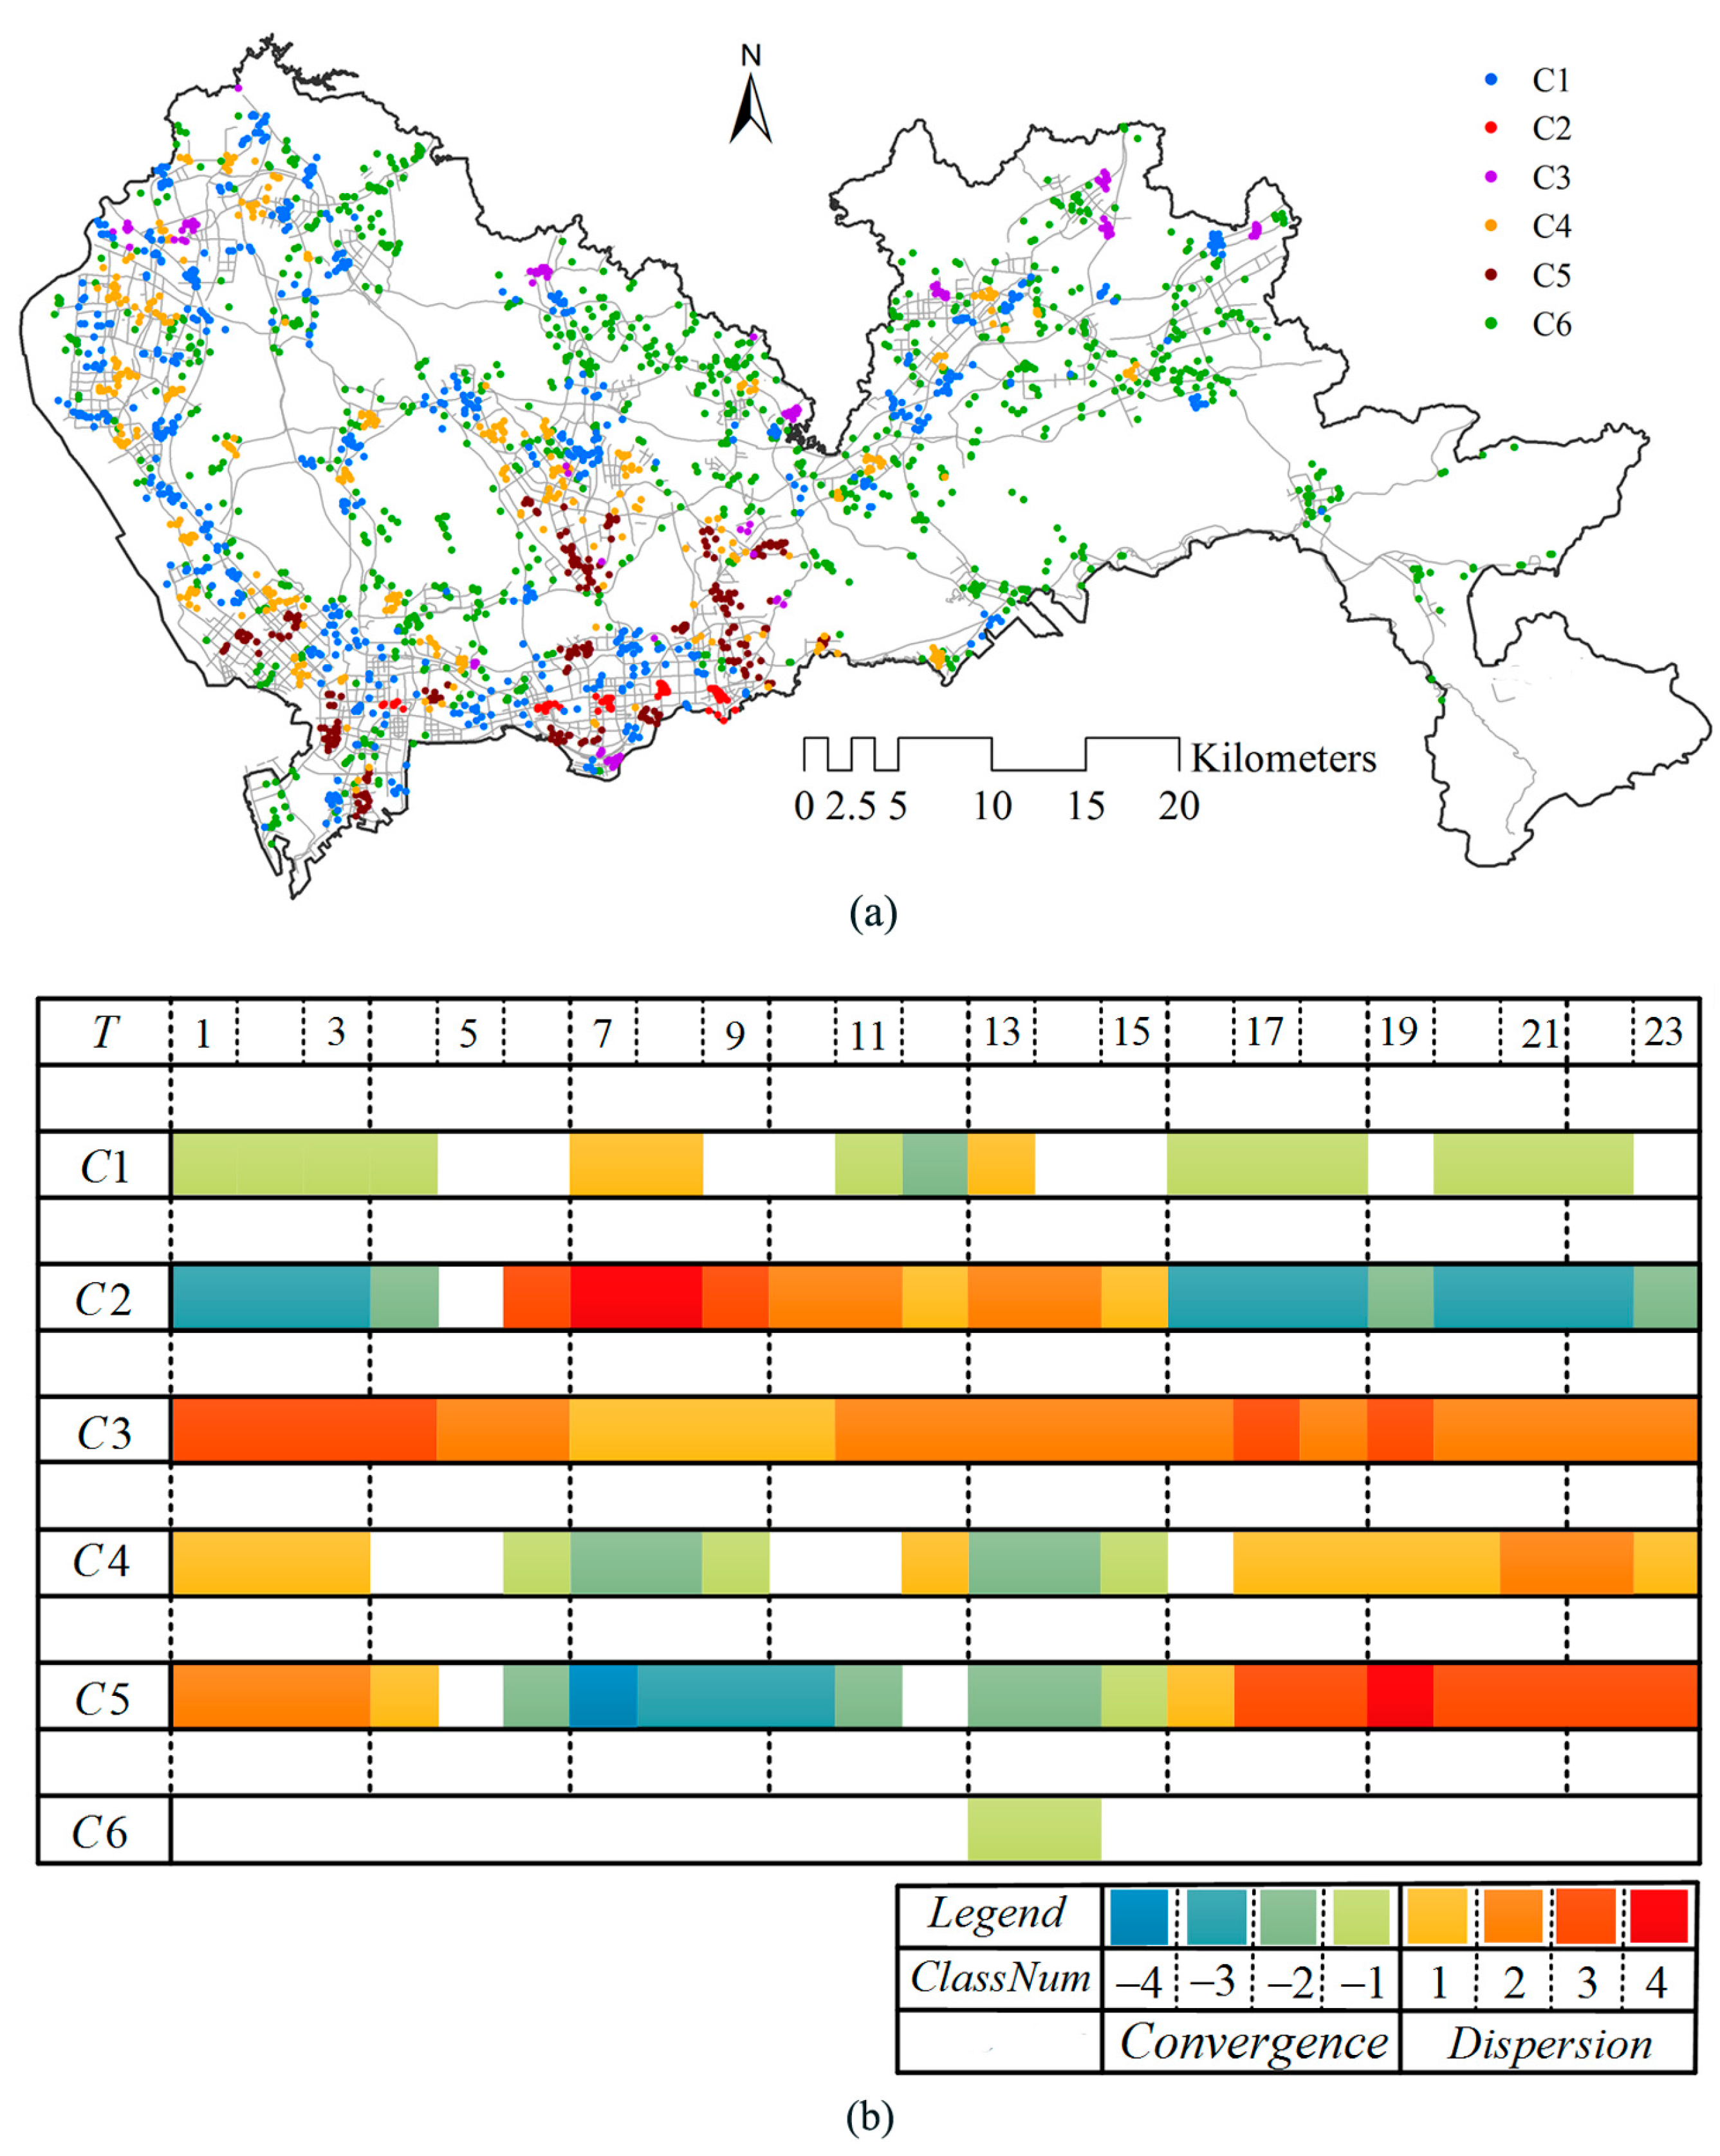
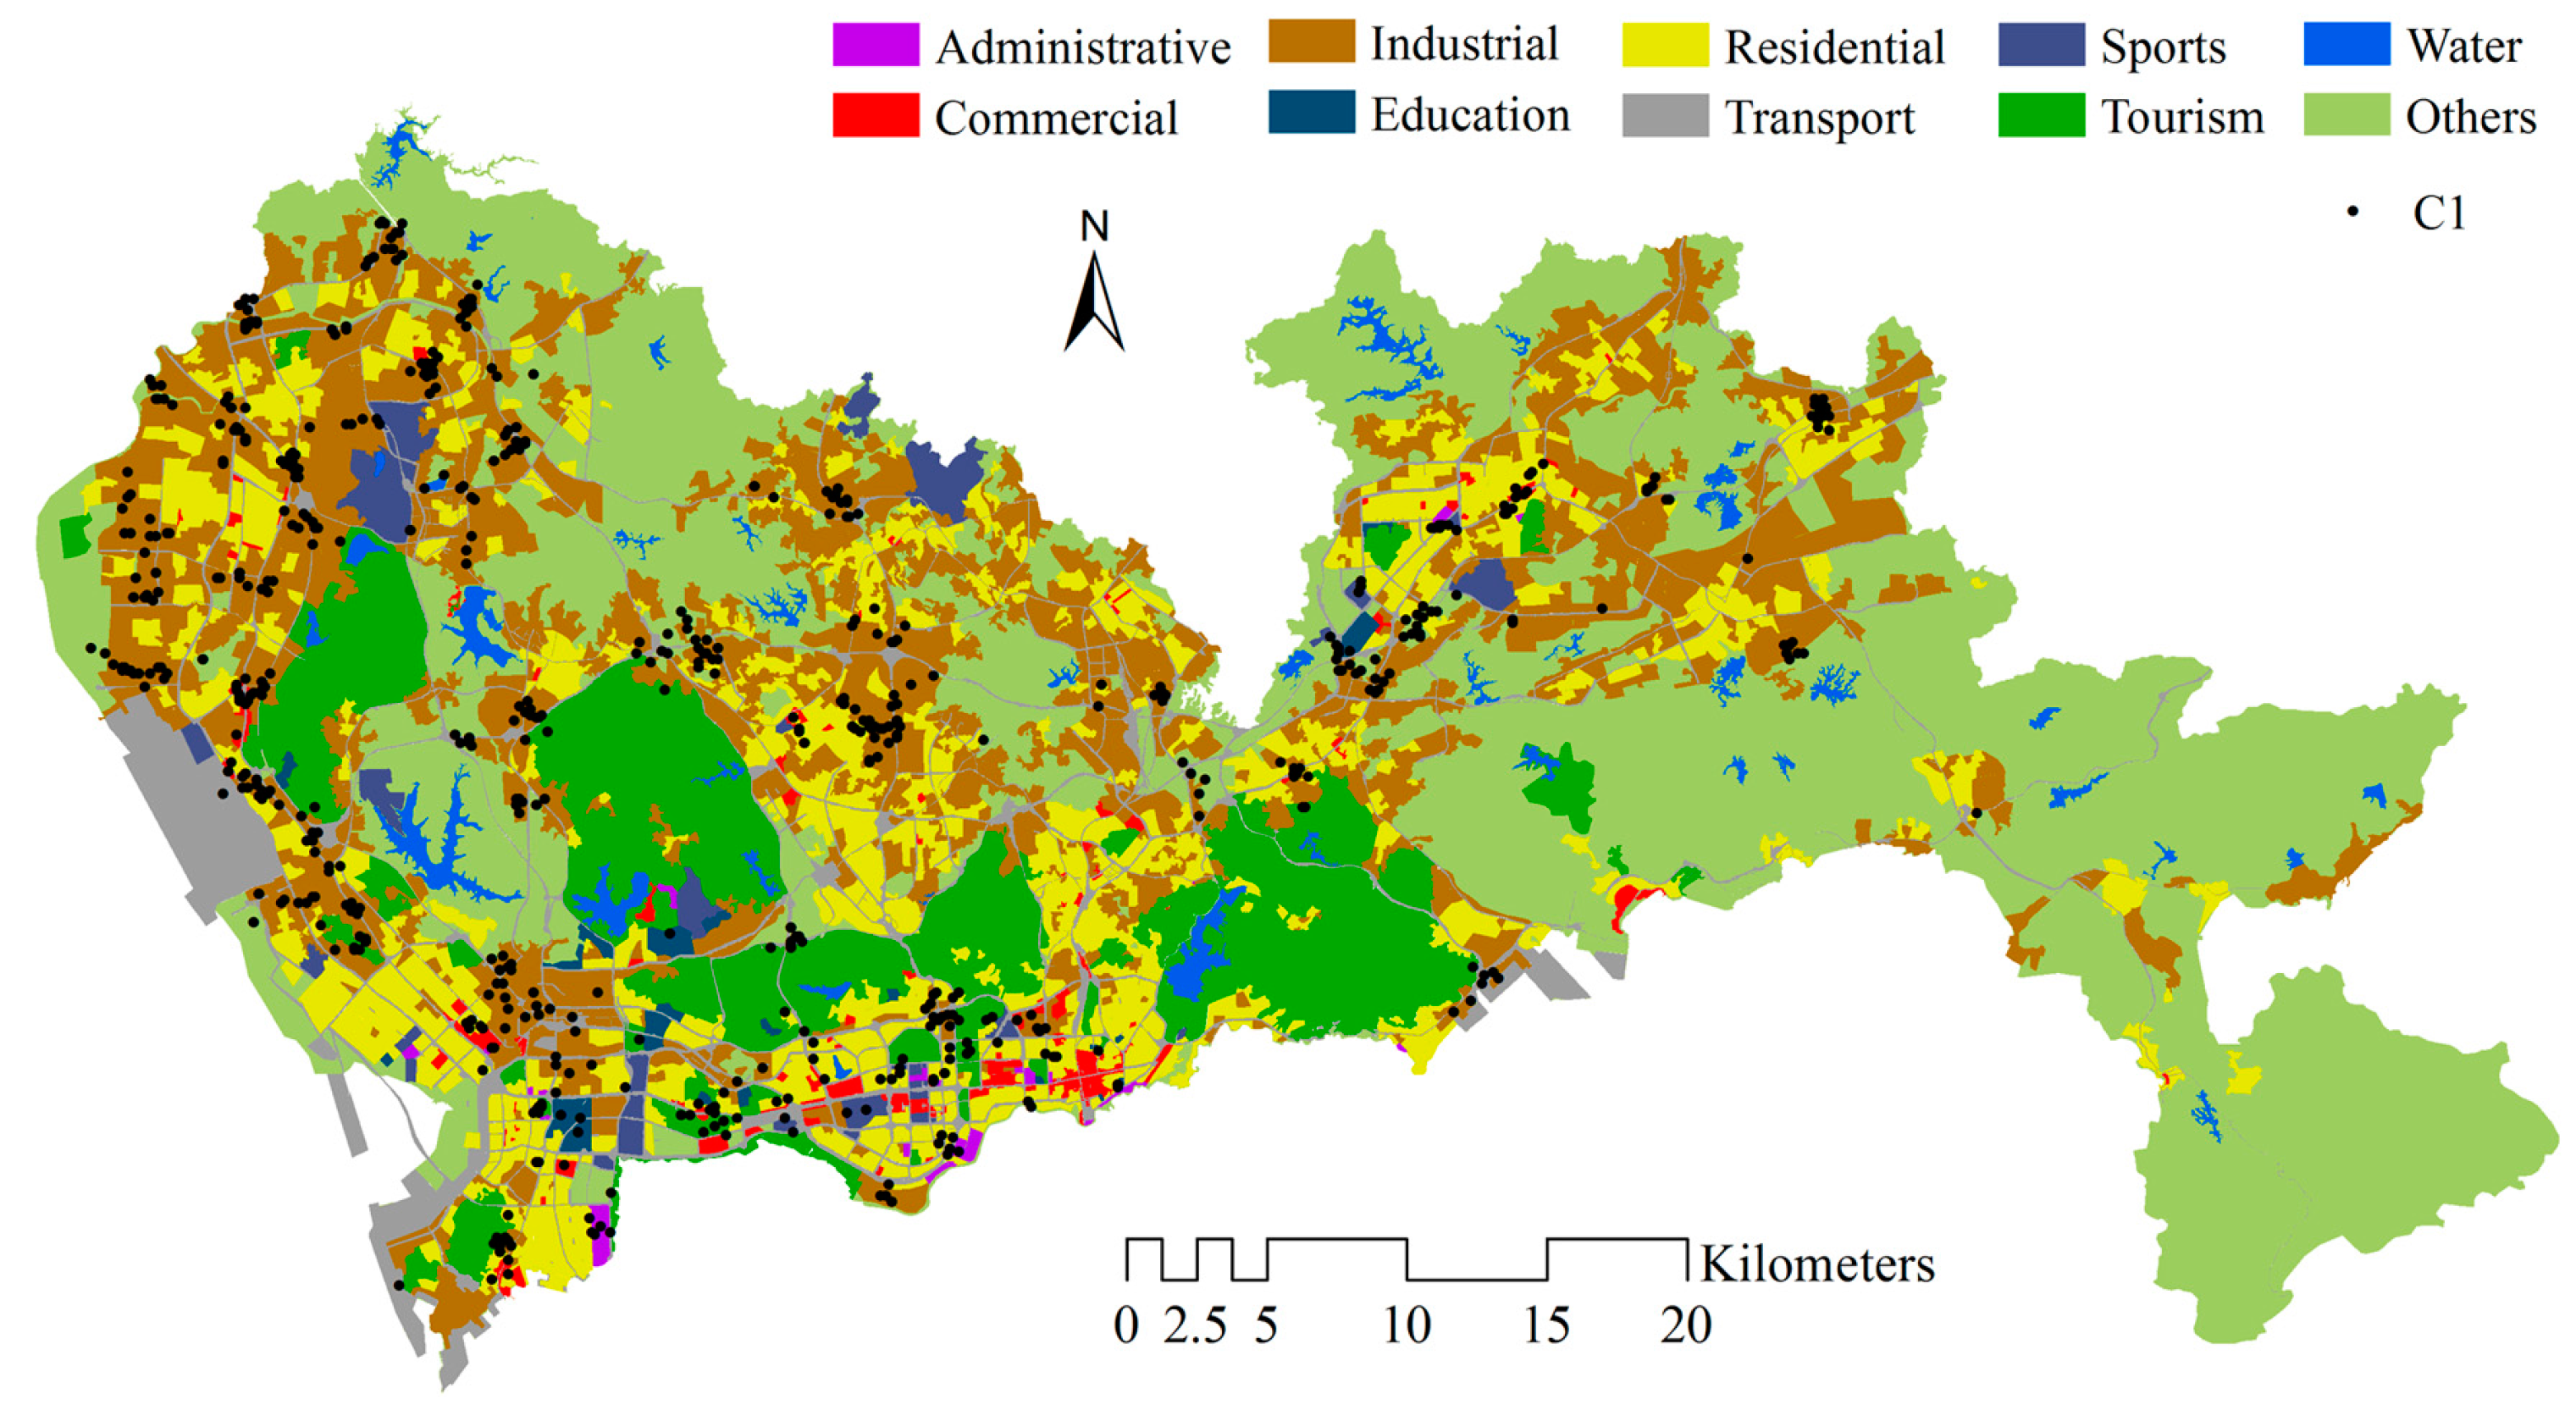
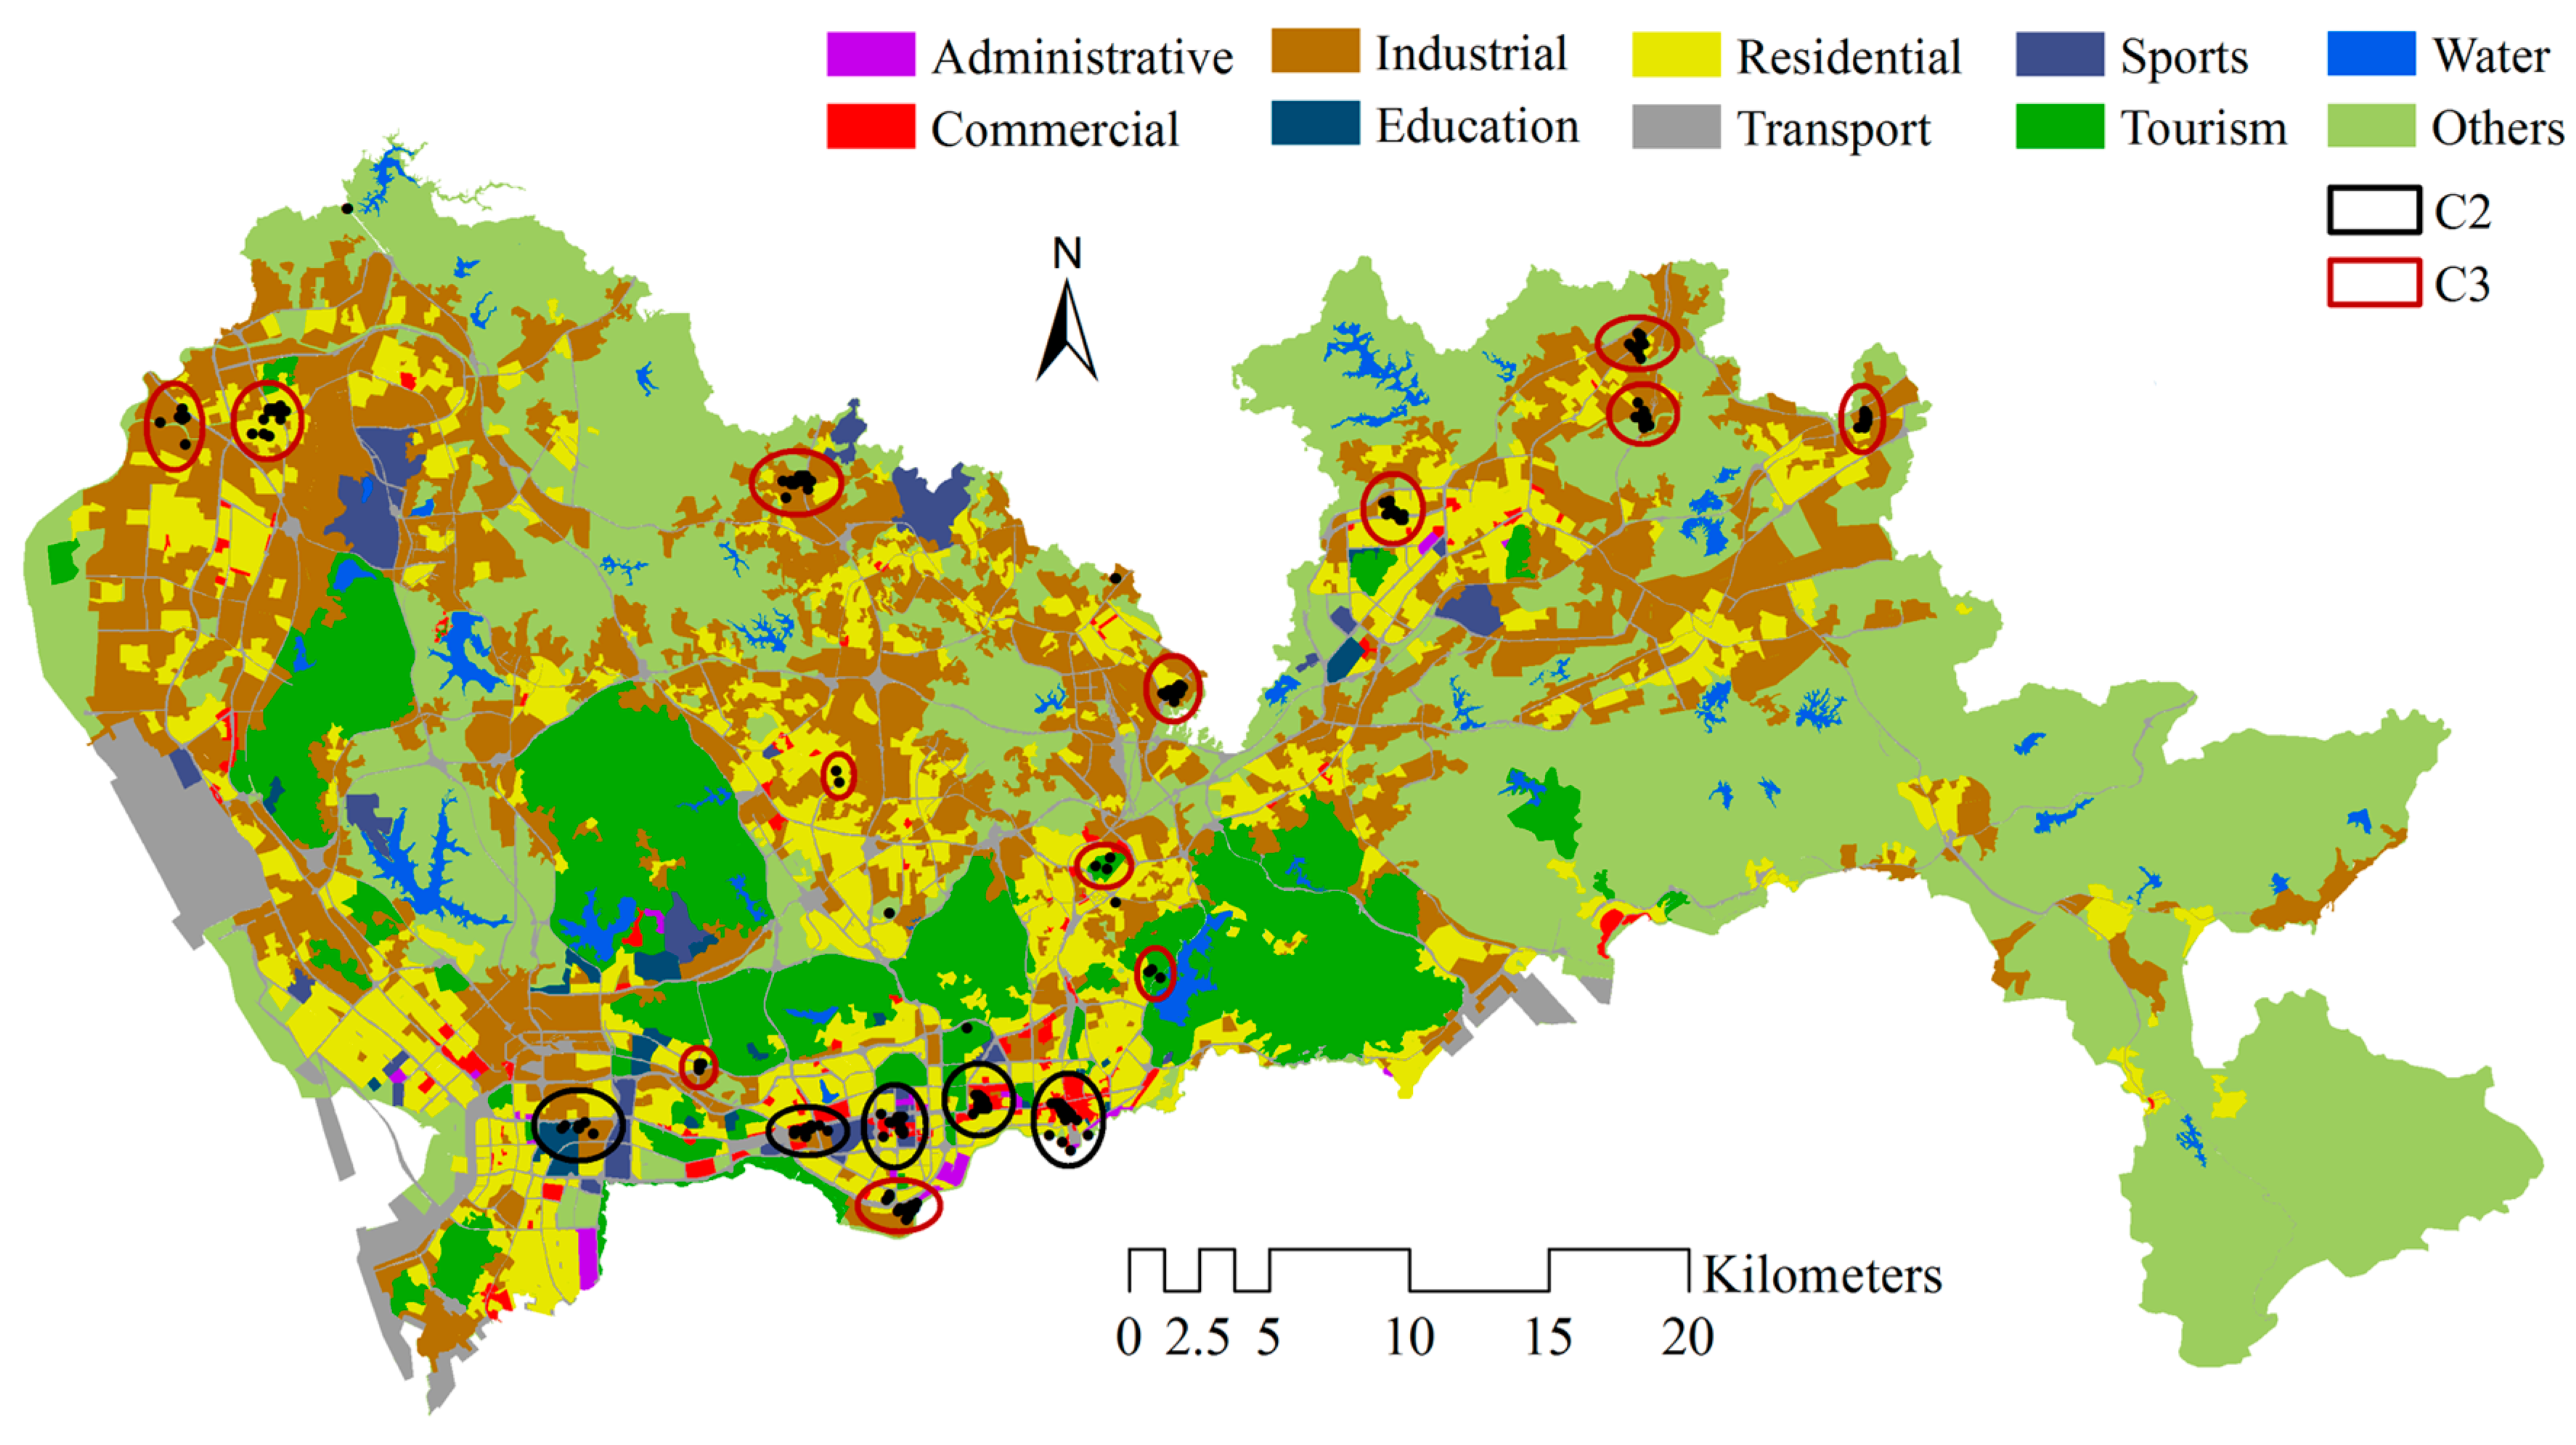
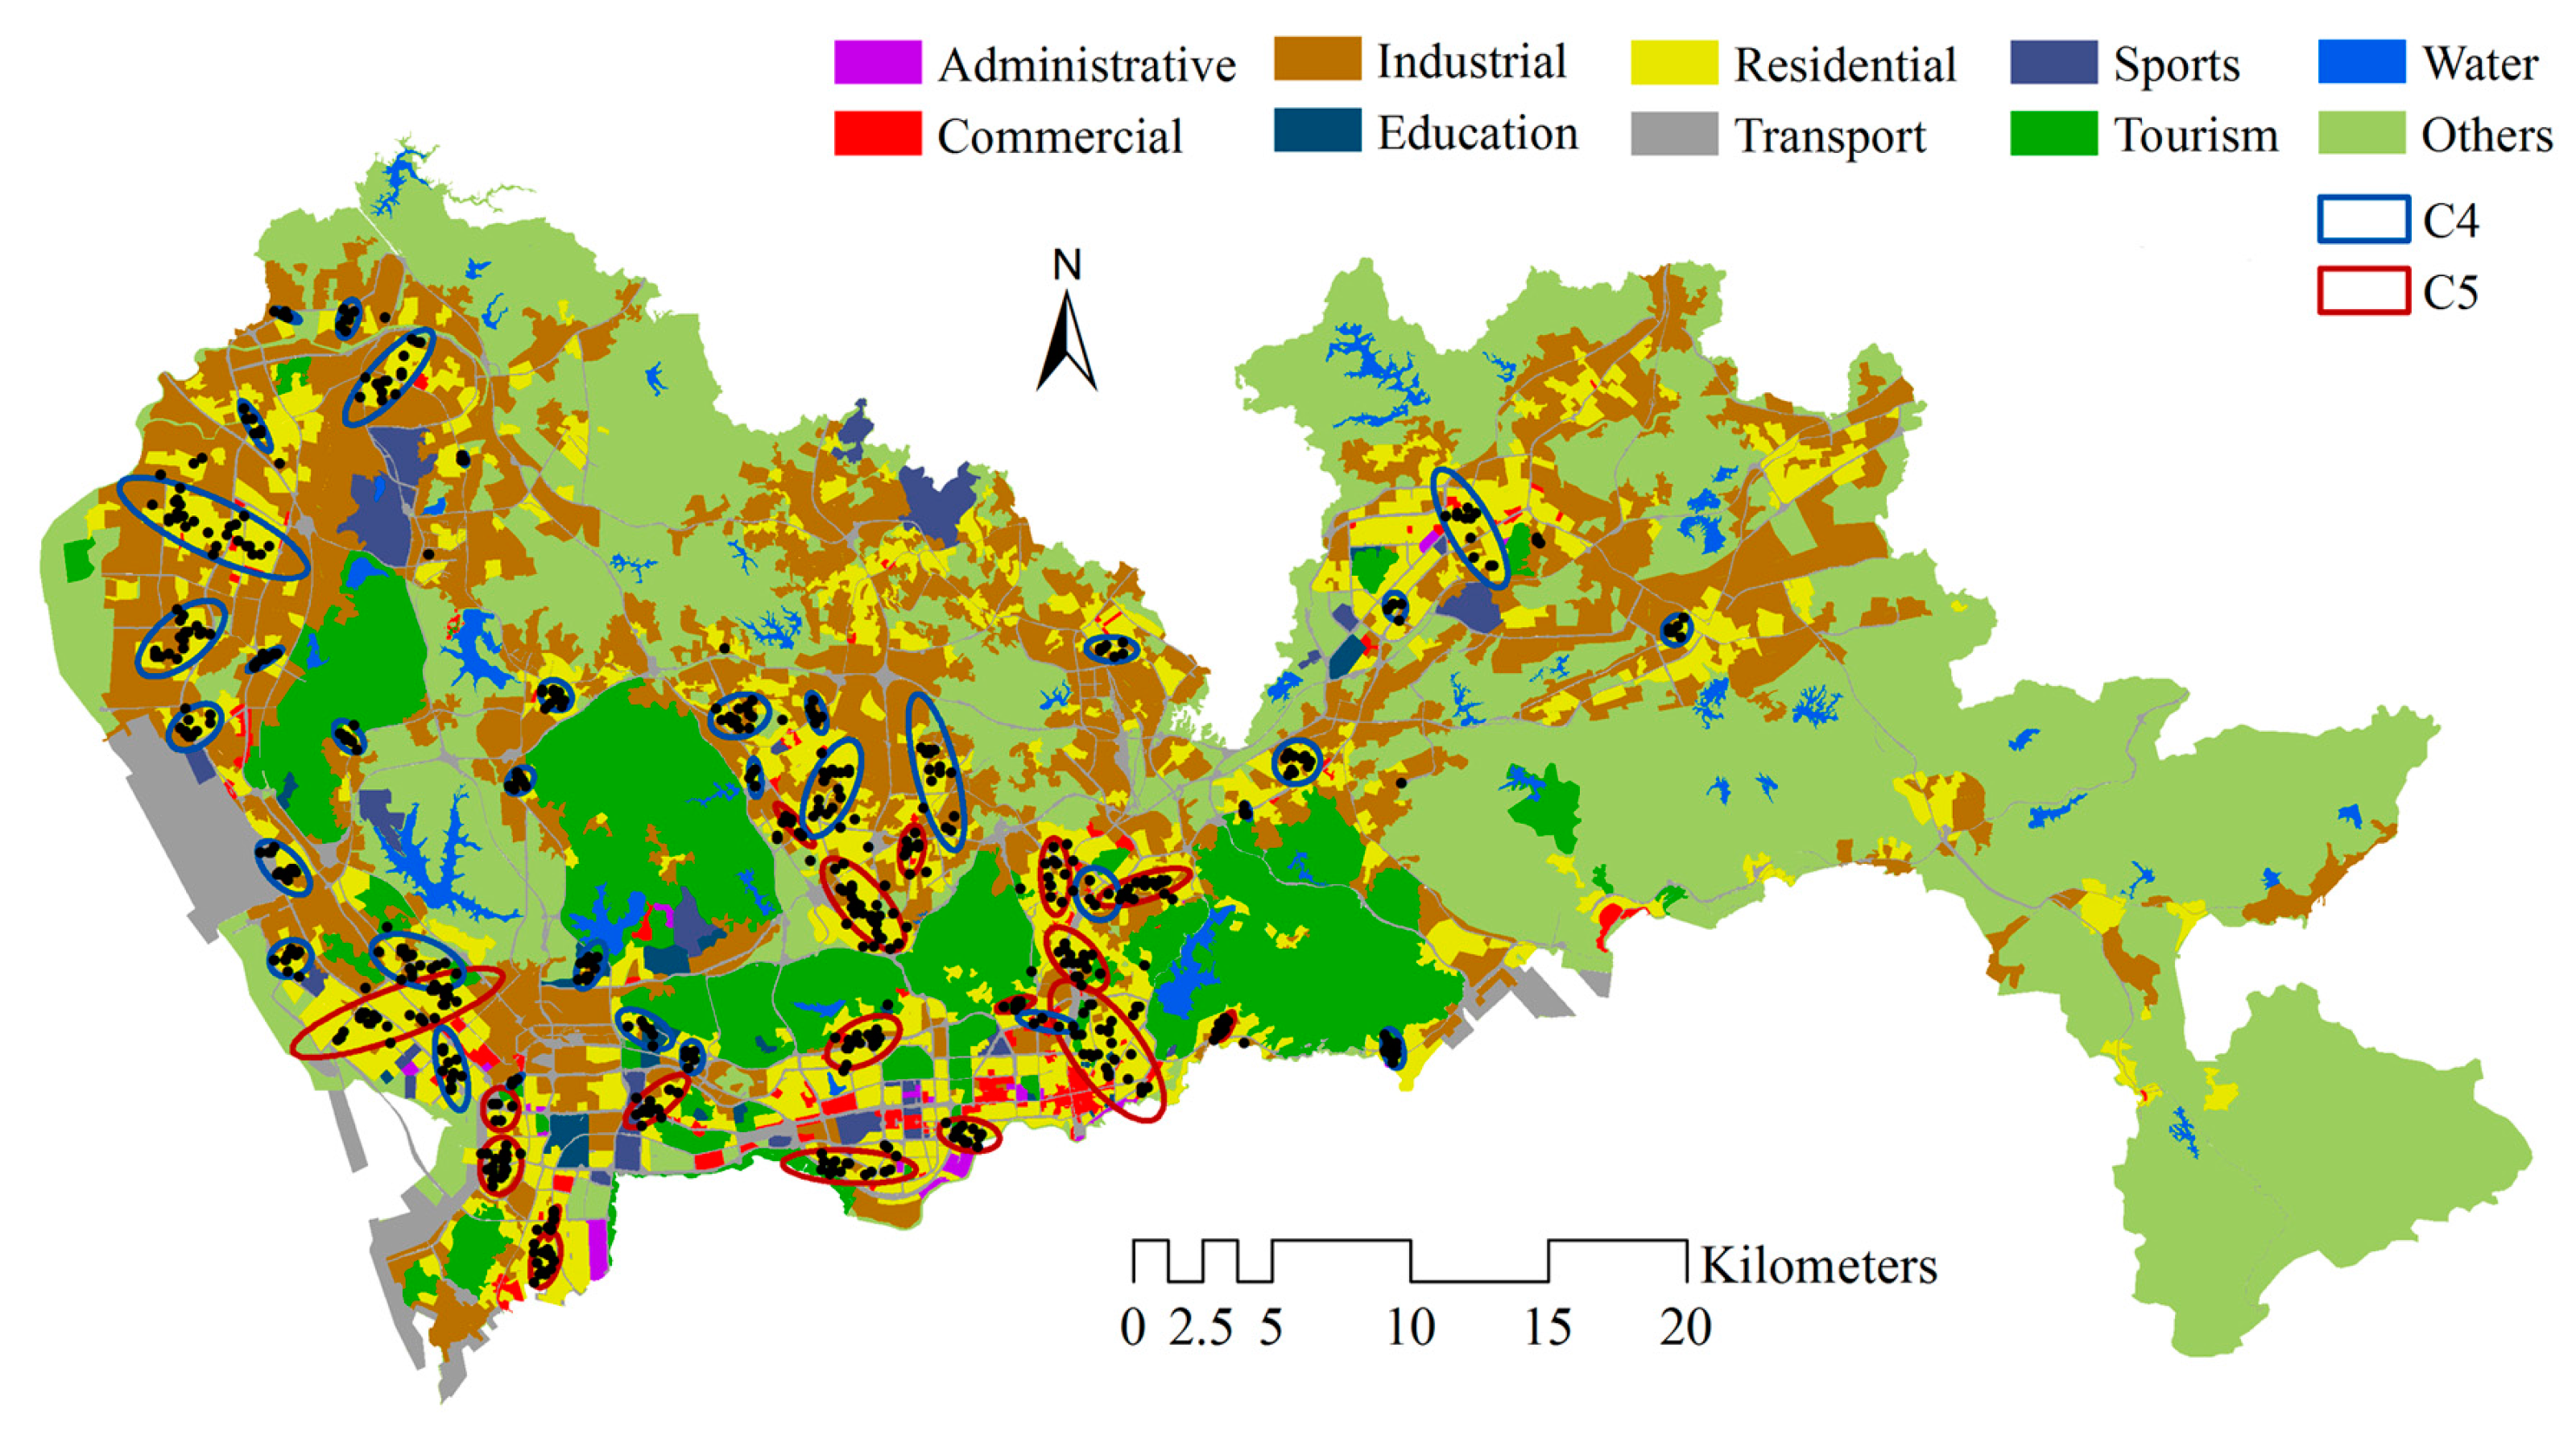
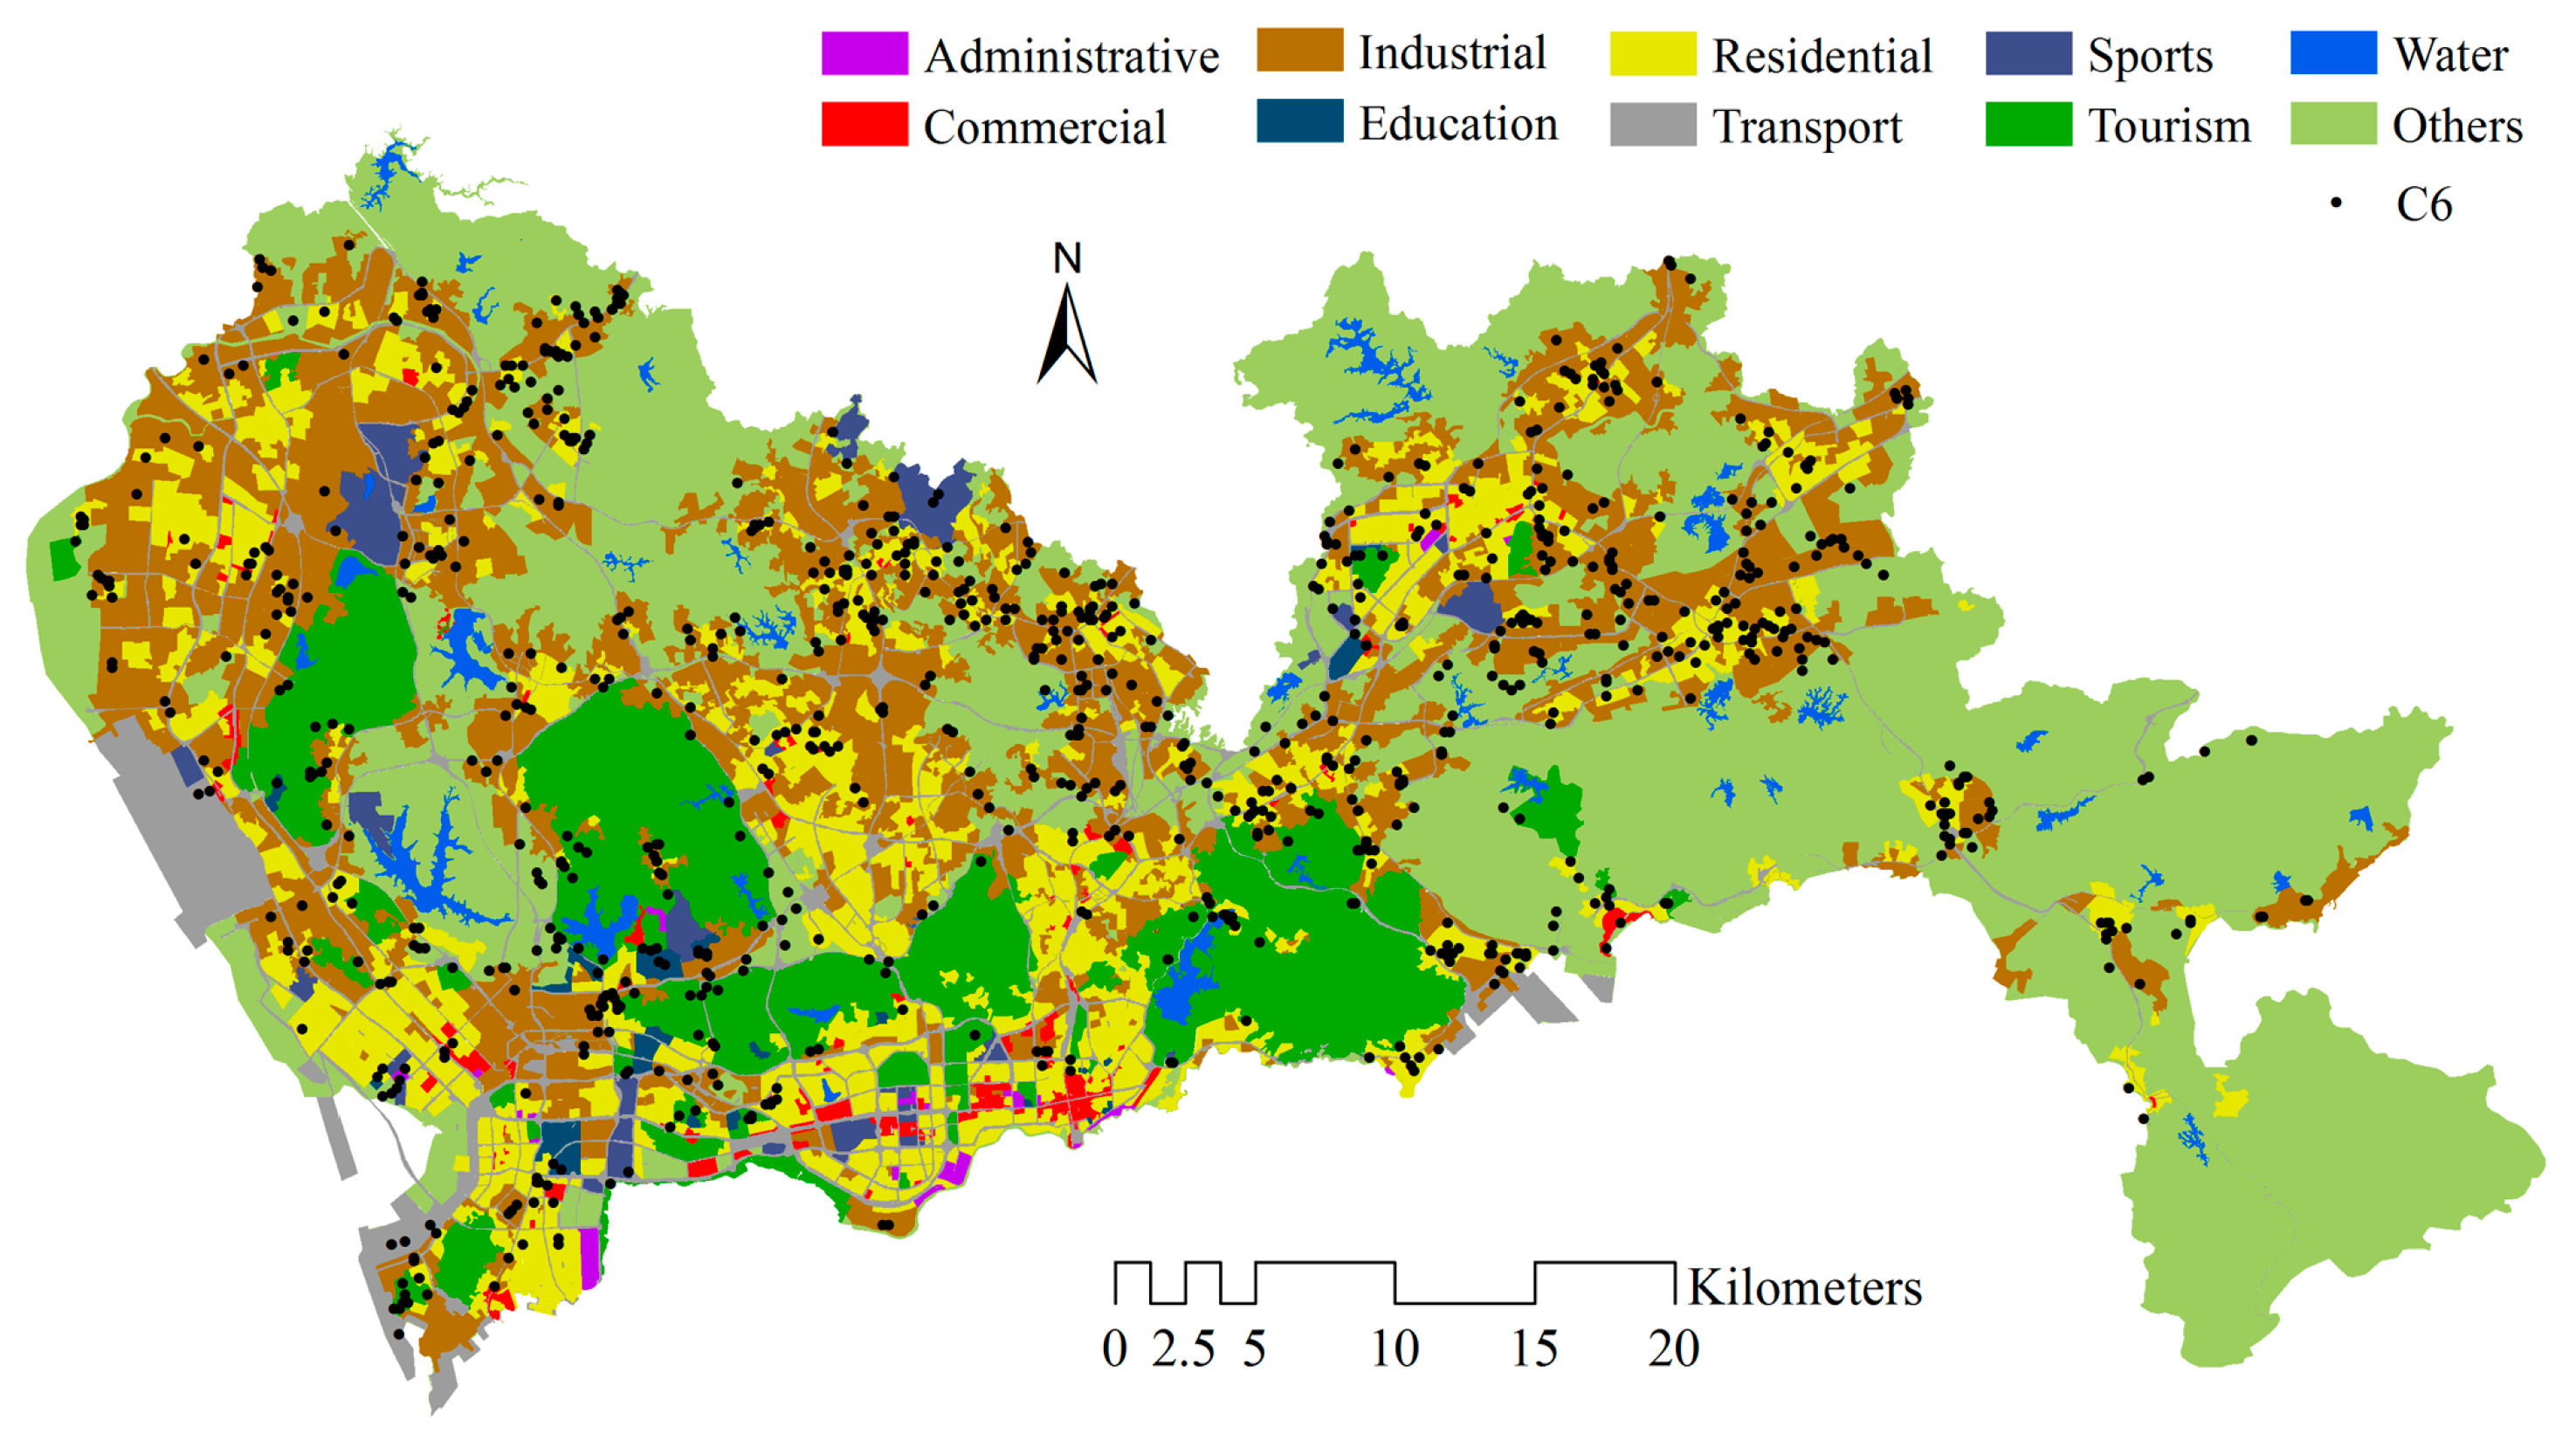
Based on mobile phone location data from Shenzhen, China, we extract six spatial-temporal patterns of human convergent and dispersive hotspots and discuss the relationship between these patterns and urban function areas. The contribution could deepen our understanding about human mobility patterns in Shenzhen, which can serve as references for administrative departments to implement the corresponding policy to satisfy the movements of citizens.

2. Literature Review

In this section, we provide a brief review of some relevant research about understanding human mobility using emerging mobile phone data and hotspot detection analysis.

2.1. Understanding Human Mobility Patterns

Mobile phone use data may be considered a proxy for the mobility of an individual, so it can provide useful insights into identifying human mobility patterns. Therefore, in recent years, mobile phone data have become an abundant research resource that is extensively applied to study human mobility patterns from various aspects due to the advantage of the long-term tracking of a large volume of urban citizens with a low cost [5,16]. Some studies from a physical domain have revealed fundamental statistical laws of human mobility and constructed human mobility models. For example, González, et al. [7] and Song, et al. [17] measured the degree of temporal and spatial regularity of the trajectory of more than ten thousand anonymized mobile phone users and found that human movements follow simple reproducible patterns and have high potential predictability, which is in contrast to Lévy flight and random walk models assuming that human movements follow a degree of scale-free randomness [18]. In addition, 17 unique movement patterns (motifs) were extracted to model daily human trips [19]. These theoretic studies provide useful insights into understanding human mobility patterns and make it possible to reproduce and simulate human mobility in the city. However, because these regular mobility patterns facilitate the re-identification of people’s activity locations, some studies focus on the privacy protection of human mobility using mobile phone data [20,21].
There are some application studies derived from mobile phone data that aim to understand the underlying patterns of human mobility. For transportation analysis, by identifying home and work places from mobile phone data, origin destination matrices can be developed to study commuting distances and patterns [22,23,24]. From the perspective of geographical and urban planning studies, the data have been utilized to monitor urban dynamics in terms of the intensity of human activities and their evolution through space and time [25,26]. Mobile phone data also provide a new way to estimate population distribution by combining travel survey data [27,28]. Some empirical studies have focused on estimating detailed moving trajectories from mobile phone record points [29], measuring the similarity of mobile phone users’ trajectories [30,31]. It is well known that there is a strong relationship between human activities and urban land use, so land use information can be inferred from mobile phone data by using machine learning or an unsupervised clustering method [32,33]. In addition, human flows between different cell phone towers can indicate the strength of interaction between different areas of a city; spatial interaction communities can be identified based on the network of human flow to find local high connection areas [34,35]. It is also easy to compare the differences among human activities in different cities throughout the world using mobile phone data [36,37].
These studies not only validate that mobile phone data have a powerful potential in mining human mobility patterns, but also provide novel insight and comprehensive evidence for better understanding the interactions between an urban environment and its citizens. In this study, we focus on this line of work and investigate the spatial-temporal patterns of human mobility hotspots from the perspective of convergence and dispersion.

2.2. Hotspots Detection

In the field of spatial analysis, a hotspot represents a place or location with an attribute that is relatively higher than its neighboring locations. The definition has been extensively applied to multiple research fields, including criminology [38,39], transportation [40] and epidemiology [41]. By extracting the locations or areas with a high incidence of crime, accidents, congestion and disease, appropriate and targeted measures can be implemented to improve safety, such as controlling crime rates, alleviating traffic jams and accidents and preventing the spread of disease. There are two popular methods for detecting hotspots.
The first method relies on statistical analysis to identify hotspots. For example, one classical method involves the employment of spatial autocorrelation indicators (Moran’s I and Getis-Ord Gi*) to detect hotspot areas at the global or local level [42,43]. The global or local indicator compares attribute values for a given observation with the attribute values for an entire study area or local area; hotspot areas can be delineated by applying a global threshold or significance level [44]. In addition, a Poisson distribution can be used to identify human activity areas with an extremely large number of activity instances [45].
The second method for hotspot detection is a spatial searching method that is based on a kernel density estimation (KDE) surface [15]. Several characteristics render KDE suitable for hotspot detection [46]. First, it has the ability to convert point events into a density surface to visualize the distribution of events [44]. In addition, the spatial unit of analysis can be flexible, and arbitrary spatial regions can be determined on the surface [47]. Therefore, KDE has been applied to model human location data, such as estimating the spatial distribution of popular places [48,49]. For example, using GPS-enabled taxi data, functionally-critical road network locations and critical points of human mobility can be extracted based on a KDE surface [46,50]. In this study, a hotspot refers to a location with higher human mobility activity than its neighboring locations. We tend toward the second method and design a traversal searching algorithm based on a KDE surface to identify the locations of human mobility hotspots.

3. Methodology

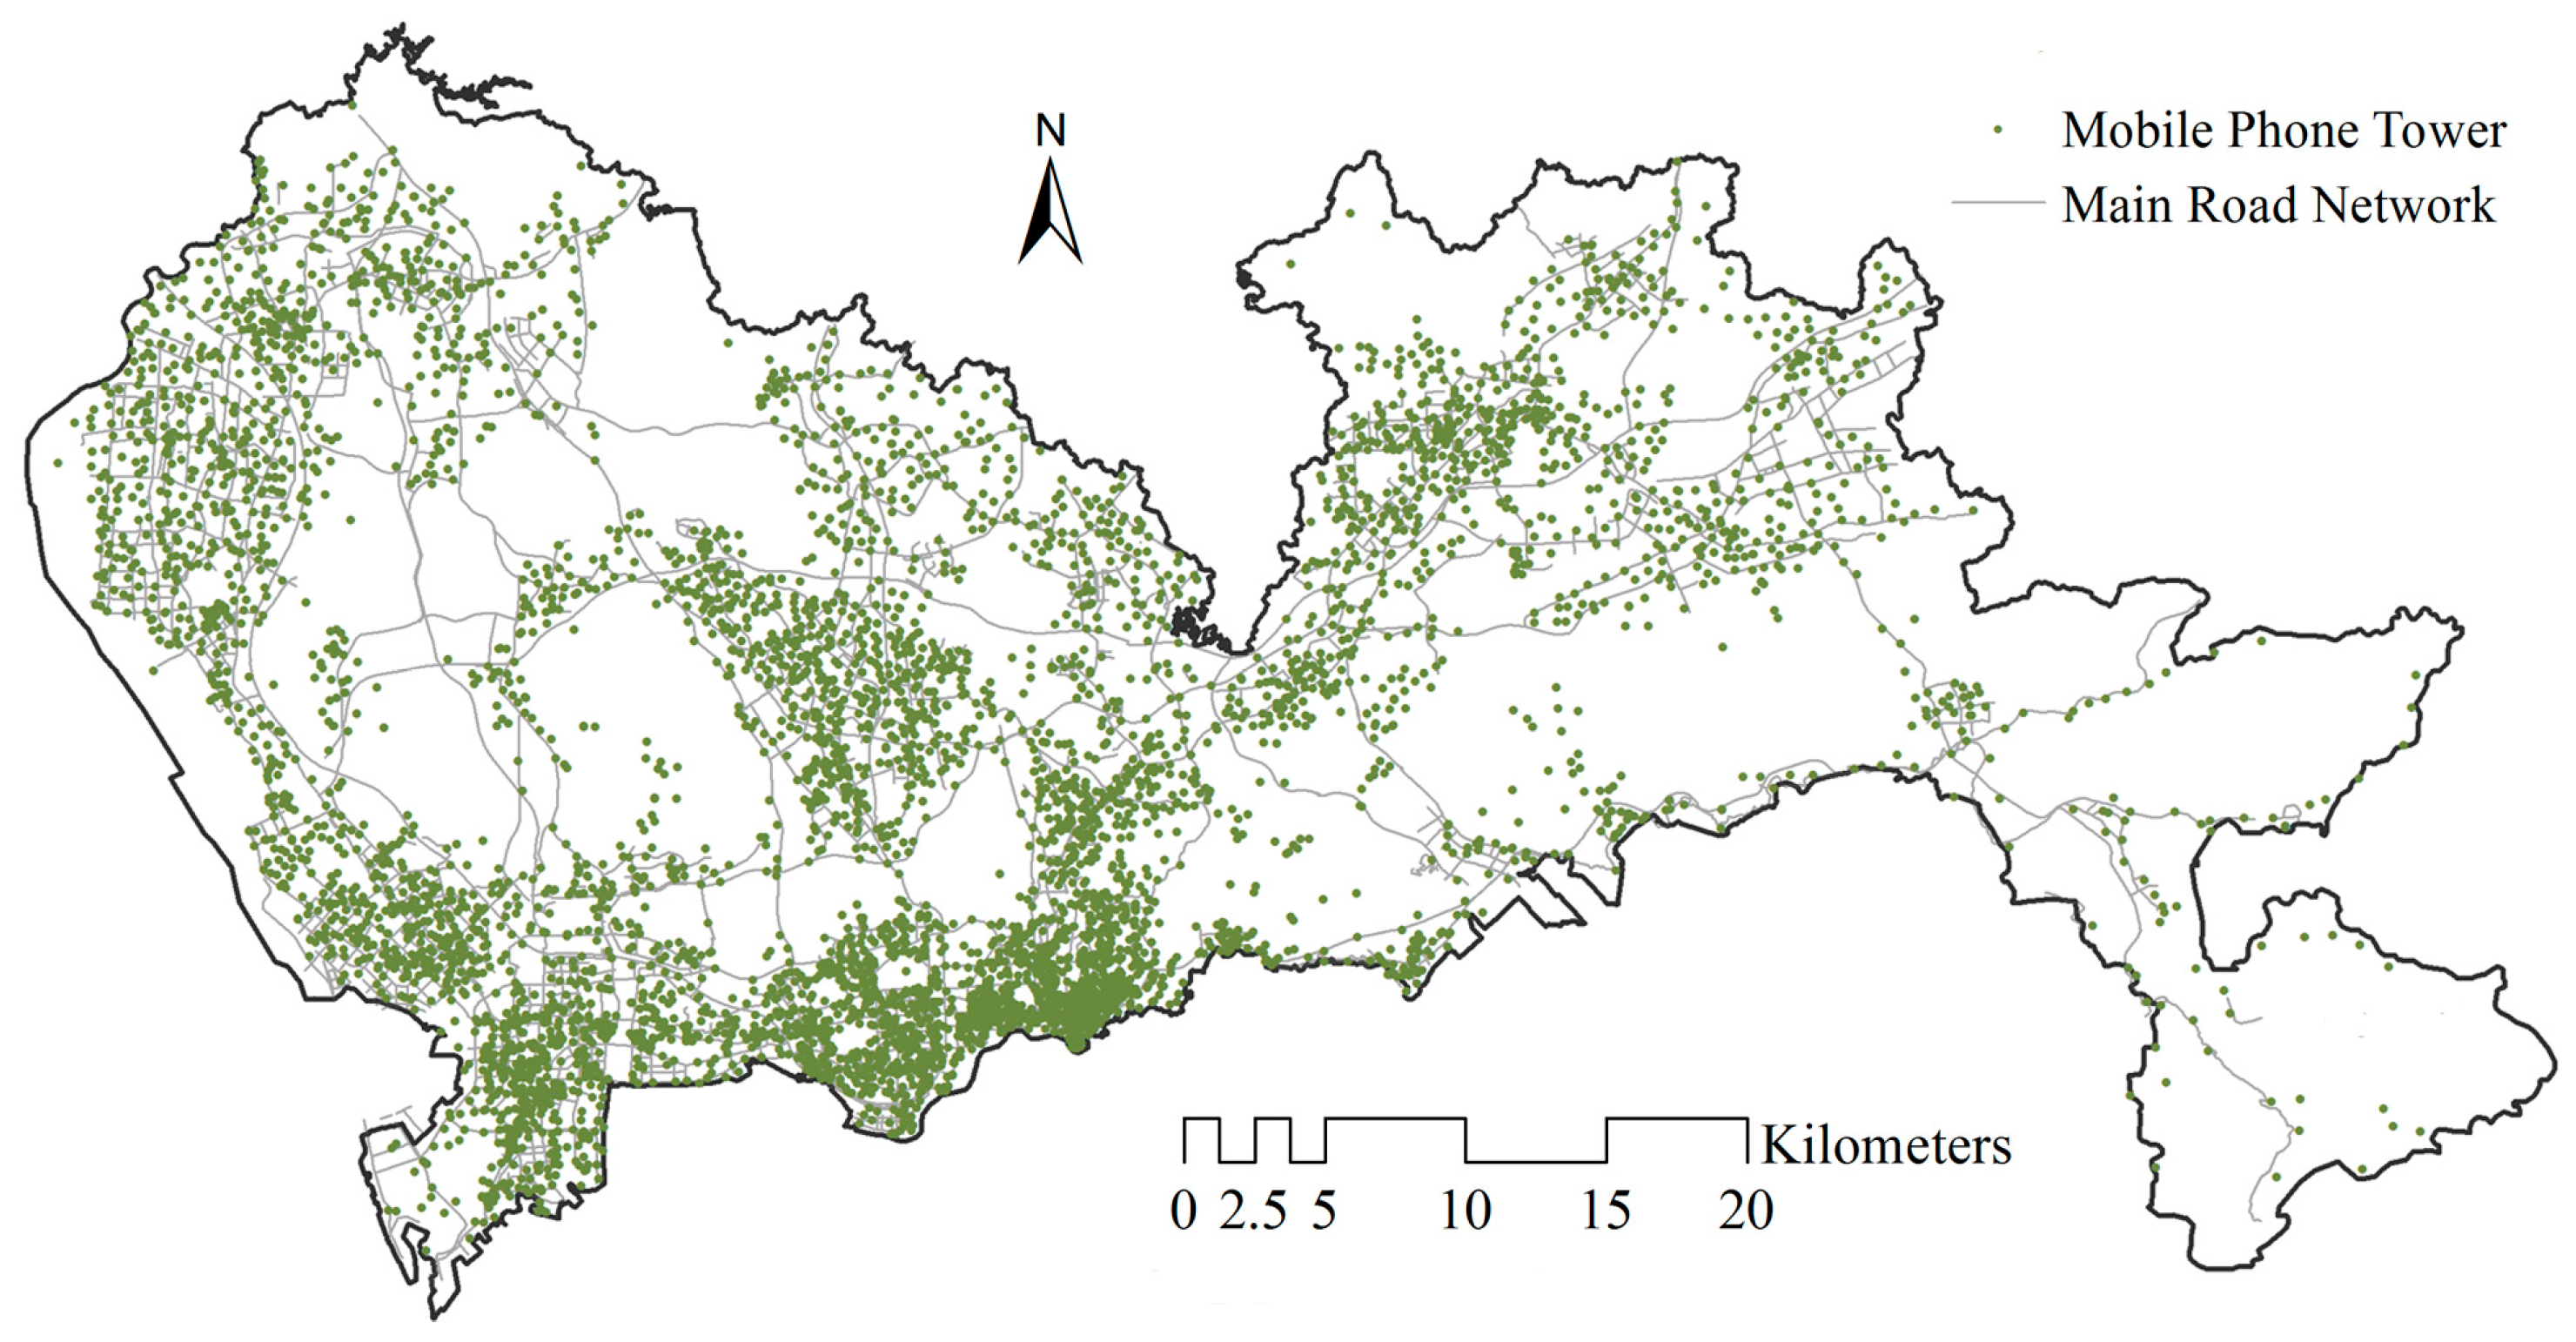
3.1. Dataset and Study Area

The study area is Shenzhen, which is located in southern China and has a total area of approximately 1996.85 km2. Shenzhen was the first special economic zone since China’s Reform and Open Policy; it has experienced rapid development for the past thirty years. Currently, Shenzhen, with a population density of 5282 per km2, has the highest population density among Chinese cities [51]. The mobile phone location dataset used in this study involves the traces of 16 million mobile phone users during a typical workday in 2012 from the China Mobile Limited Company, which is one of the three major mobile operators in the study area and captures approximately 60% of the entire mobile user market. In addition, this type of mobile phone location data was originally collected for trouble shooting by the mobile operator, and the mobile operator actively recorded every mobile phone’s location for a one-hour interval. Each record contains the user ID, recording time and the longitude and latitude information of the corresponding mobile phone tower to which the phone was connected. In particular, the user ID was encrypted for privacy protection before we touched the dataset. A total of 5940 mobile phone towers were extracted from our mobile phone location dataset, and each tower was labeled with a unique TowerID number. Figure 1 shows the spatial distribution of the mobile phone towers.
Another dataset that is employed in this study is urban functional area data, which is produced based on land use data. Referring to the “The Comprehensive Plan of Shenzhen City (2010–2020)”, we group the land use of the city into ten functional areas: administrative, commercial, industrial, residential, education, transport, tourism, sports, water and others. The urban functional areas will be employed to discuss and explain the human mobility patterns in Section 4.2.

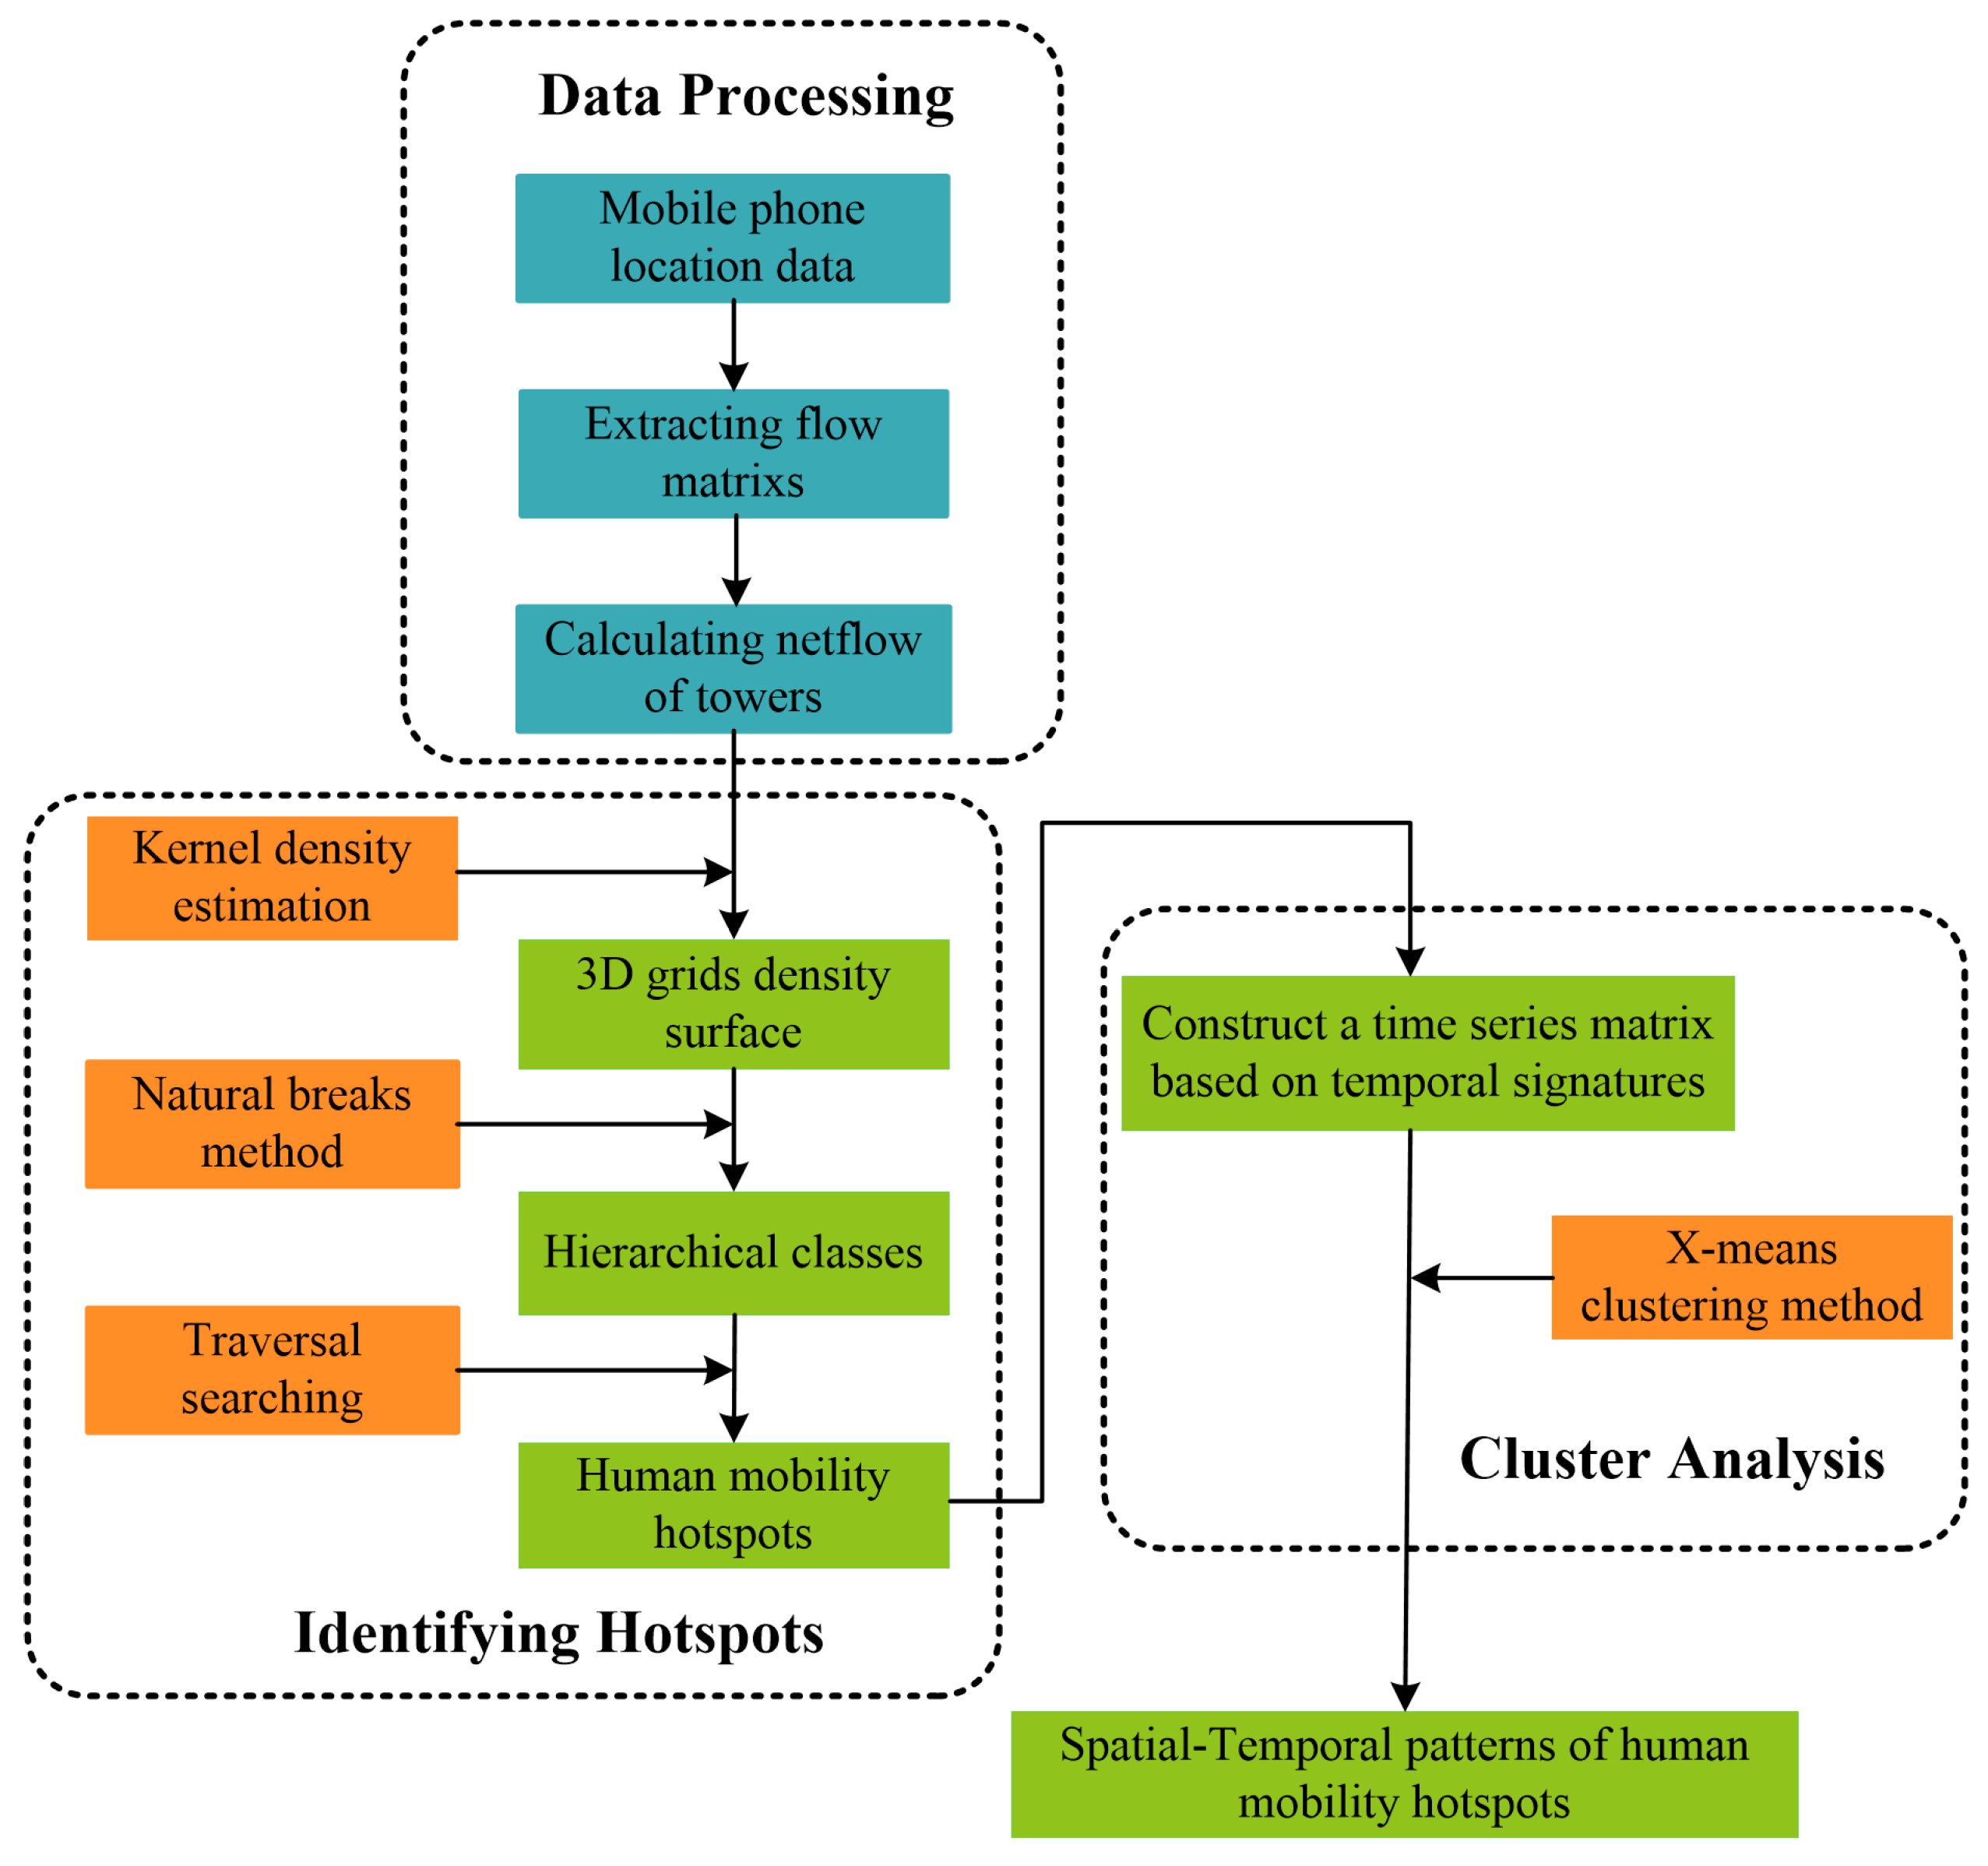
3.2. Extracting the Spatial-Temporal Patterns of Human Mobility Hotspots

In this study, we defined two types of hotspots to represent the status of the human mobility of a local area: the convergent hotspot and the dispersive hotspot. Assume that we use netflow (inflow minus outflow) to signify the difference between the inflow and the outflow of people in a place during a certain time slot. A positive netflow indicates that the number of people in the place increases during this time slot; we considered this status to be a convergent status. Similarly, a negative netflow indicates that the number of people in a place decreases; we considered this status to be a dispersive status. The convergent hotspot represents a location for which the netflow is relatively higher than its local neighboring locations. Conversely, a dispersive hotspot represents a location in which the netflow is relatively lower than its local neighboring locations. As shown in Figure 2, a Gaussian 3D density surface is introduced to demonstrate the definition of hotspots, where a positive density and a negative density indicate human convergence and dispersion, respectively. Thus, the location of a convergent hotspot and the location of a dispersive hotspot represent the peak of a small hill and the pit of a valley.
Based on the previous definition, this study proposes a methodological workflow to extract spatial-temporal patterns of human mobility hotspots. The workflow includes three sections: data processing, identifying human mobility hotspots and clustering analysis of their temporal characteristics. In data processing, we extract the netflow of mobile phone towers for each time slot from the dataset. First, to identify hotspots, KDE is employed to generate a spatially-continuous 3D grid density surface based on the netflow of towers. Second, we employ the natural breaks method to classify the density surface into several classes according to the statistical characteristics of the density value. Third, a traversal search algorithm is designed to extract the local convergent and dispersive hotspots from the classified surface. Finally, we execute a cluster analysis by an X-means clustering algorithm to extract the spatial-temporal patterns of human convergent and dispersive hotspots. Figure 3 provides a flow chart of the proposed framework. We will explain the method according to the procedure of the flow chart in the following section.

3.2.1. Data Preprocessing

For a phone user, we can construct an individual’s trajectory by ordering the record points in the time sequence T = { ( x 1 , y 1 , t 1 , I d 1 ) , , ( x L , y L , t L , I d L ) } , where x i , y i , I d i are the longitude, latitude and TowerID of a mobile phone tower, respectively, and t i represents the time when the space-time points are updated. For two adjacent record points [ ( x i , y i , t i , I d i ) , ( x i + 1 , y i + 1 , t i + 1 , I d i + 1 ) ] of the trajectory, if I d i I d i + 1 , we can identify a movement from mobile phone tower I d i to mobile phone tower I d i + 1 during t i and t i + 1 . The movement can be extracted from the trajectory within every two adjacent hours; for example, the first record occurs during 00:00–01:00, and the second record occurs during 01:00–02:00; we can extract one movement during 00:00–02:00. The two adjacent hours are considered to be the time slot denoted T 1 . Thus, we can extract 23 flow matrices (time slots) for one day; we use T j to denote the movement from ( j 1 ) : 00 ( j + 1 ) : 00 . For each time slot T j , we calculate the inflow and outflow of each mobile phone tower p , where i n f l o w p = q f q p , o u t f l o w p = q f p q , and f p q represents the number of people who move from mobile phone tower p to mobile phone tower q during this time slot. We define the netflow of the mobile phone tower as the difference between the inflow and outflow (inflow minus outflow). The netflow could provide evidence about the visits’ difference between two adjacent time periods. The variation of netflow during a day can reveal the potential function of the grid cell [13]. The netflow of the mobile phone towers can be used in the following section to identify convergent and dispersive hotspots.

3.2.2. Identifying Human Convergent and Dispersive Hotspots

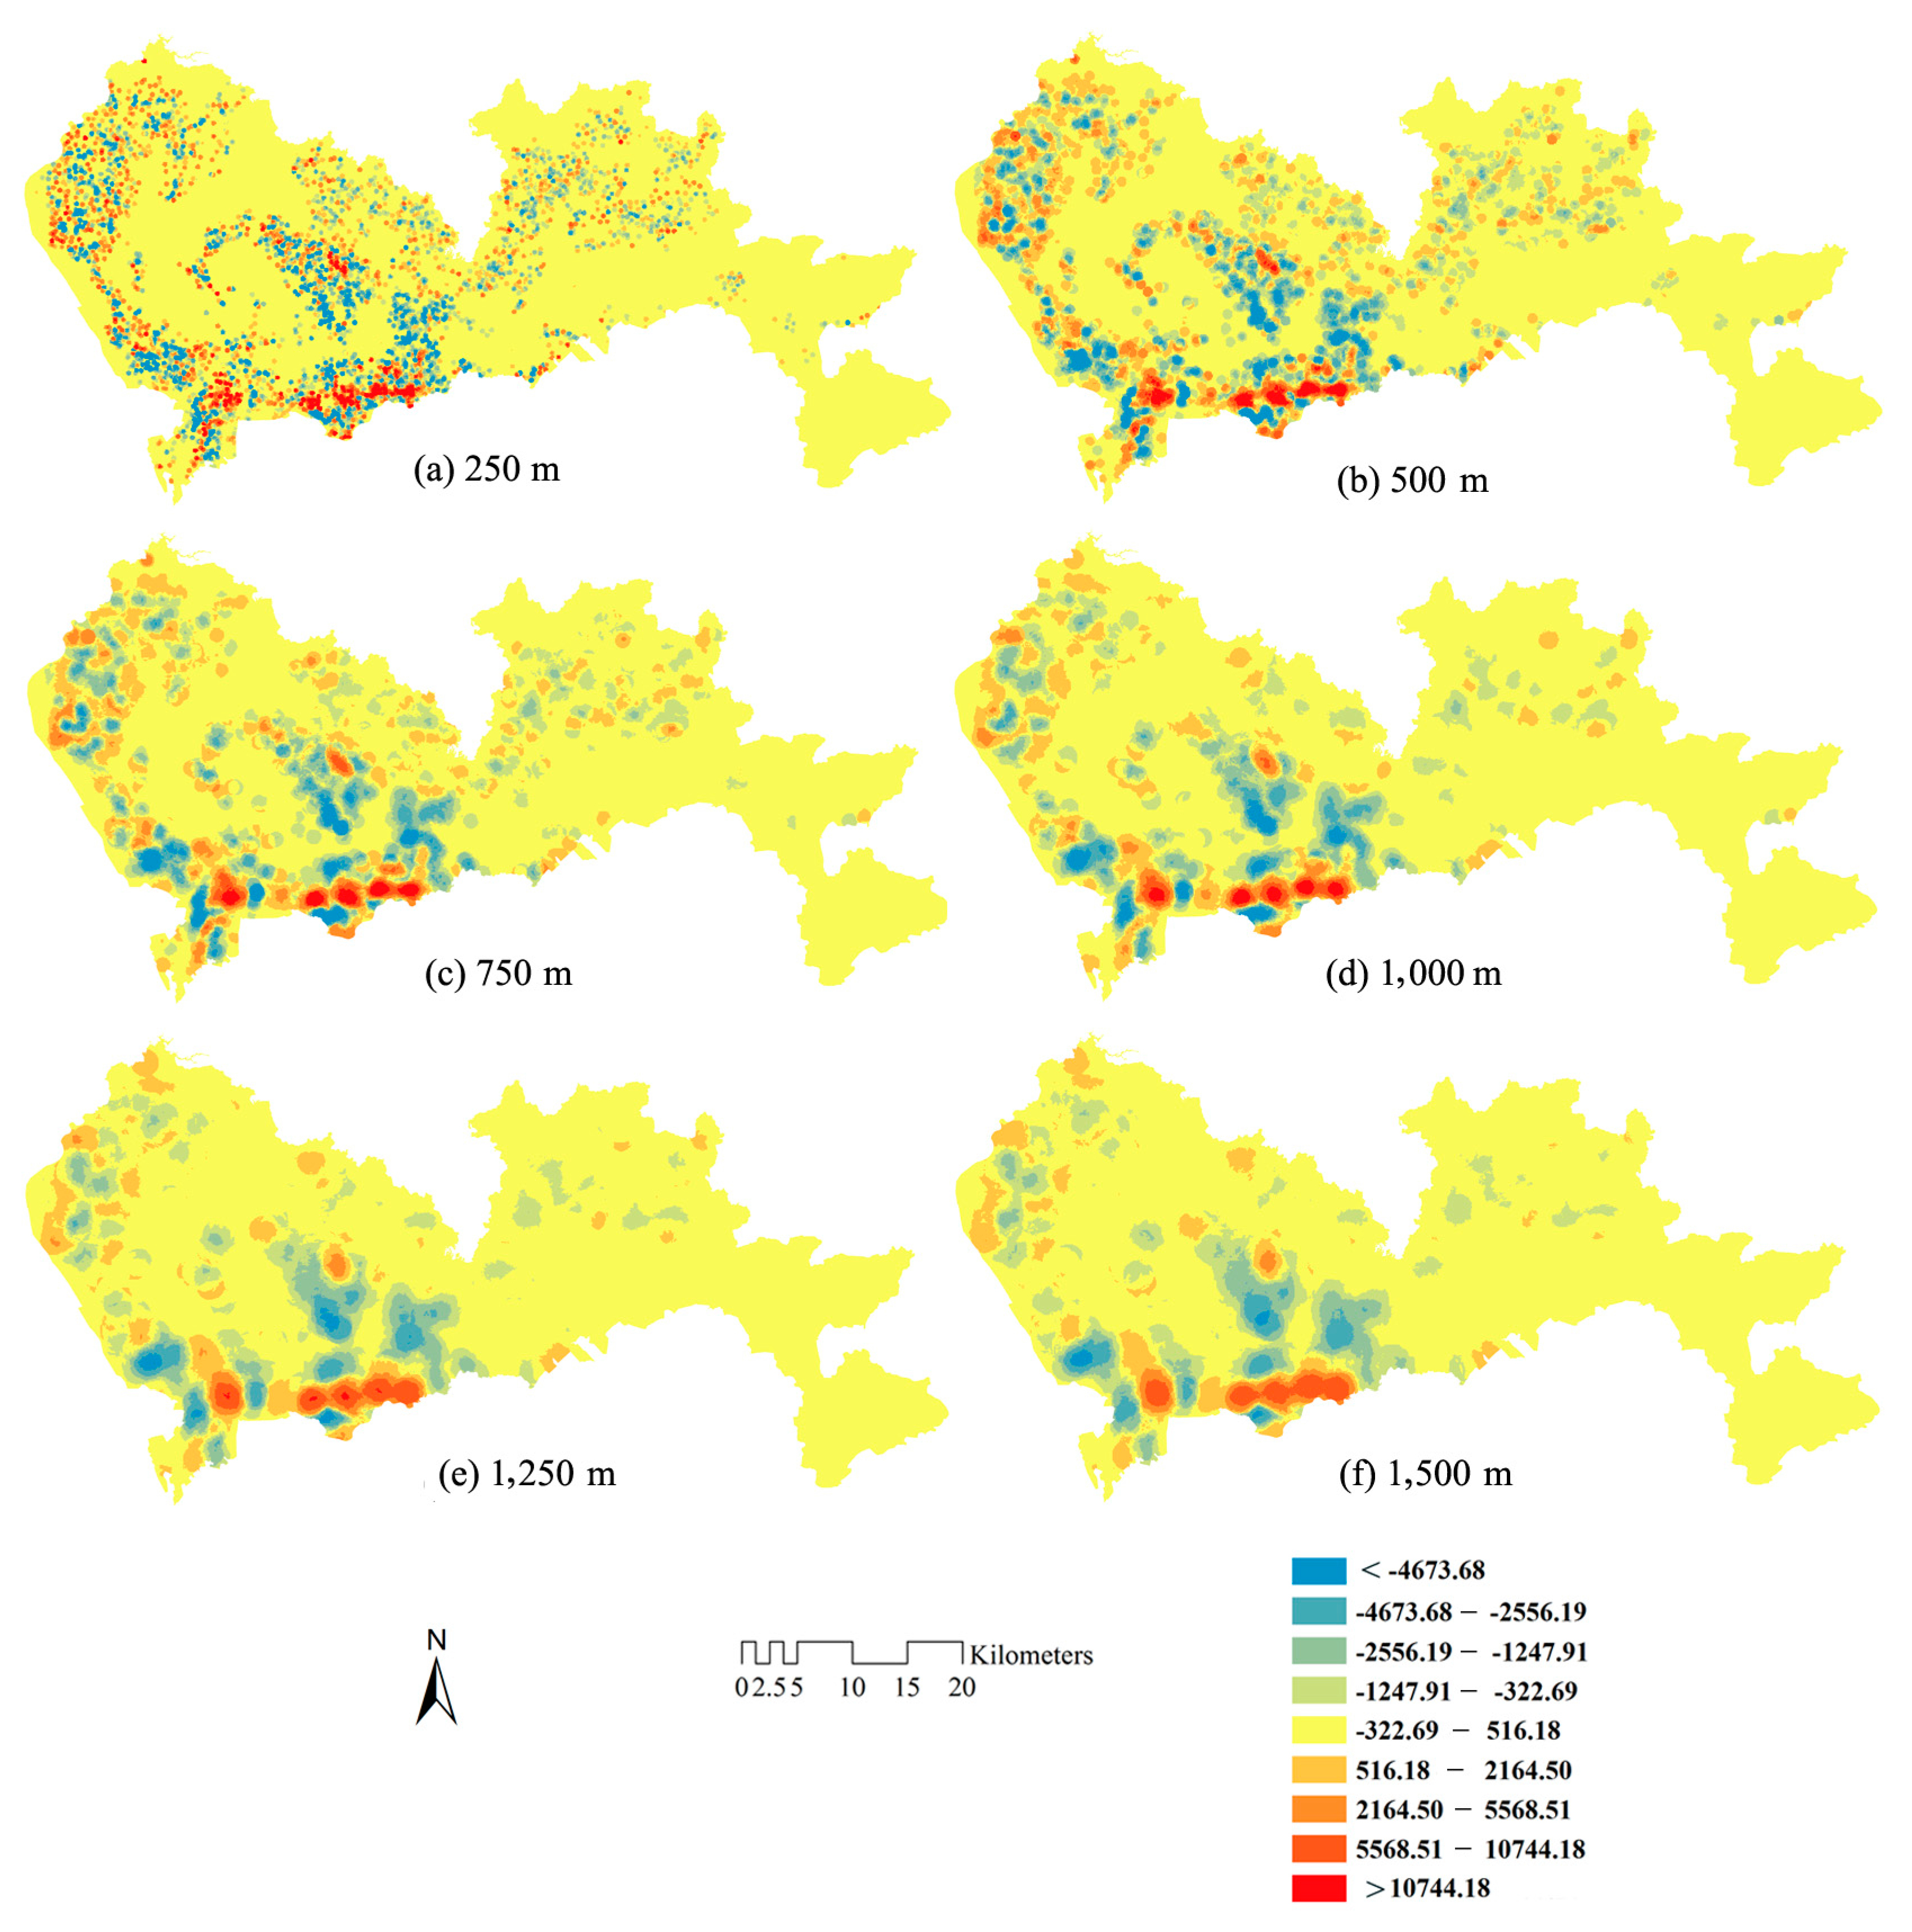
Kernel Density Estimation
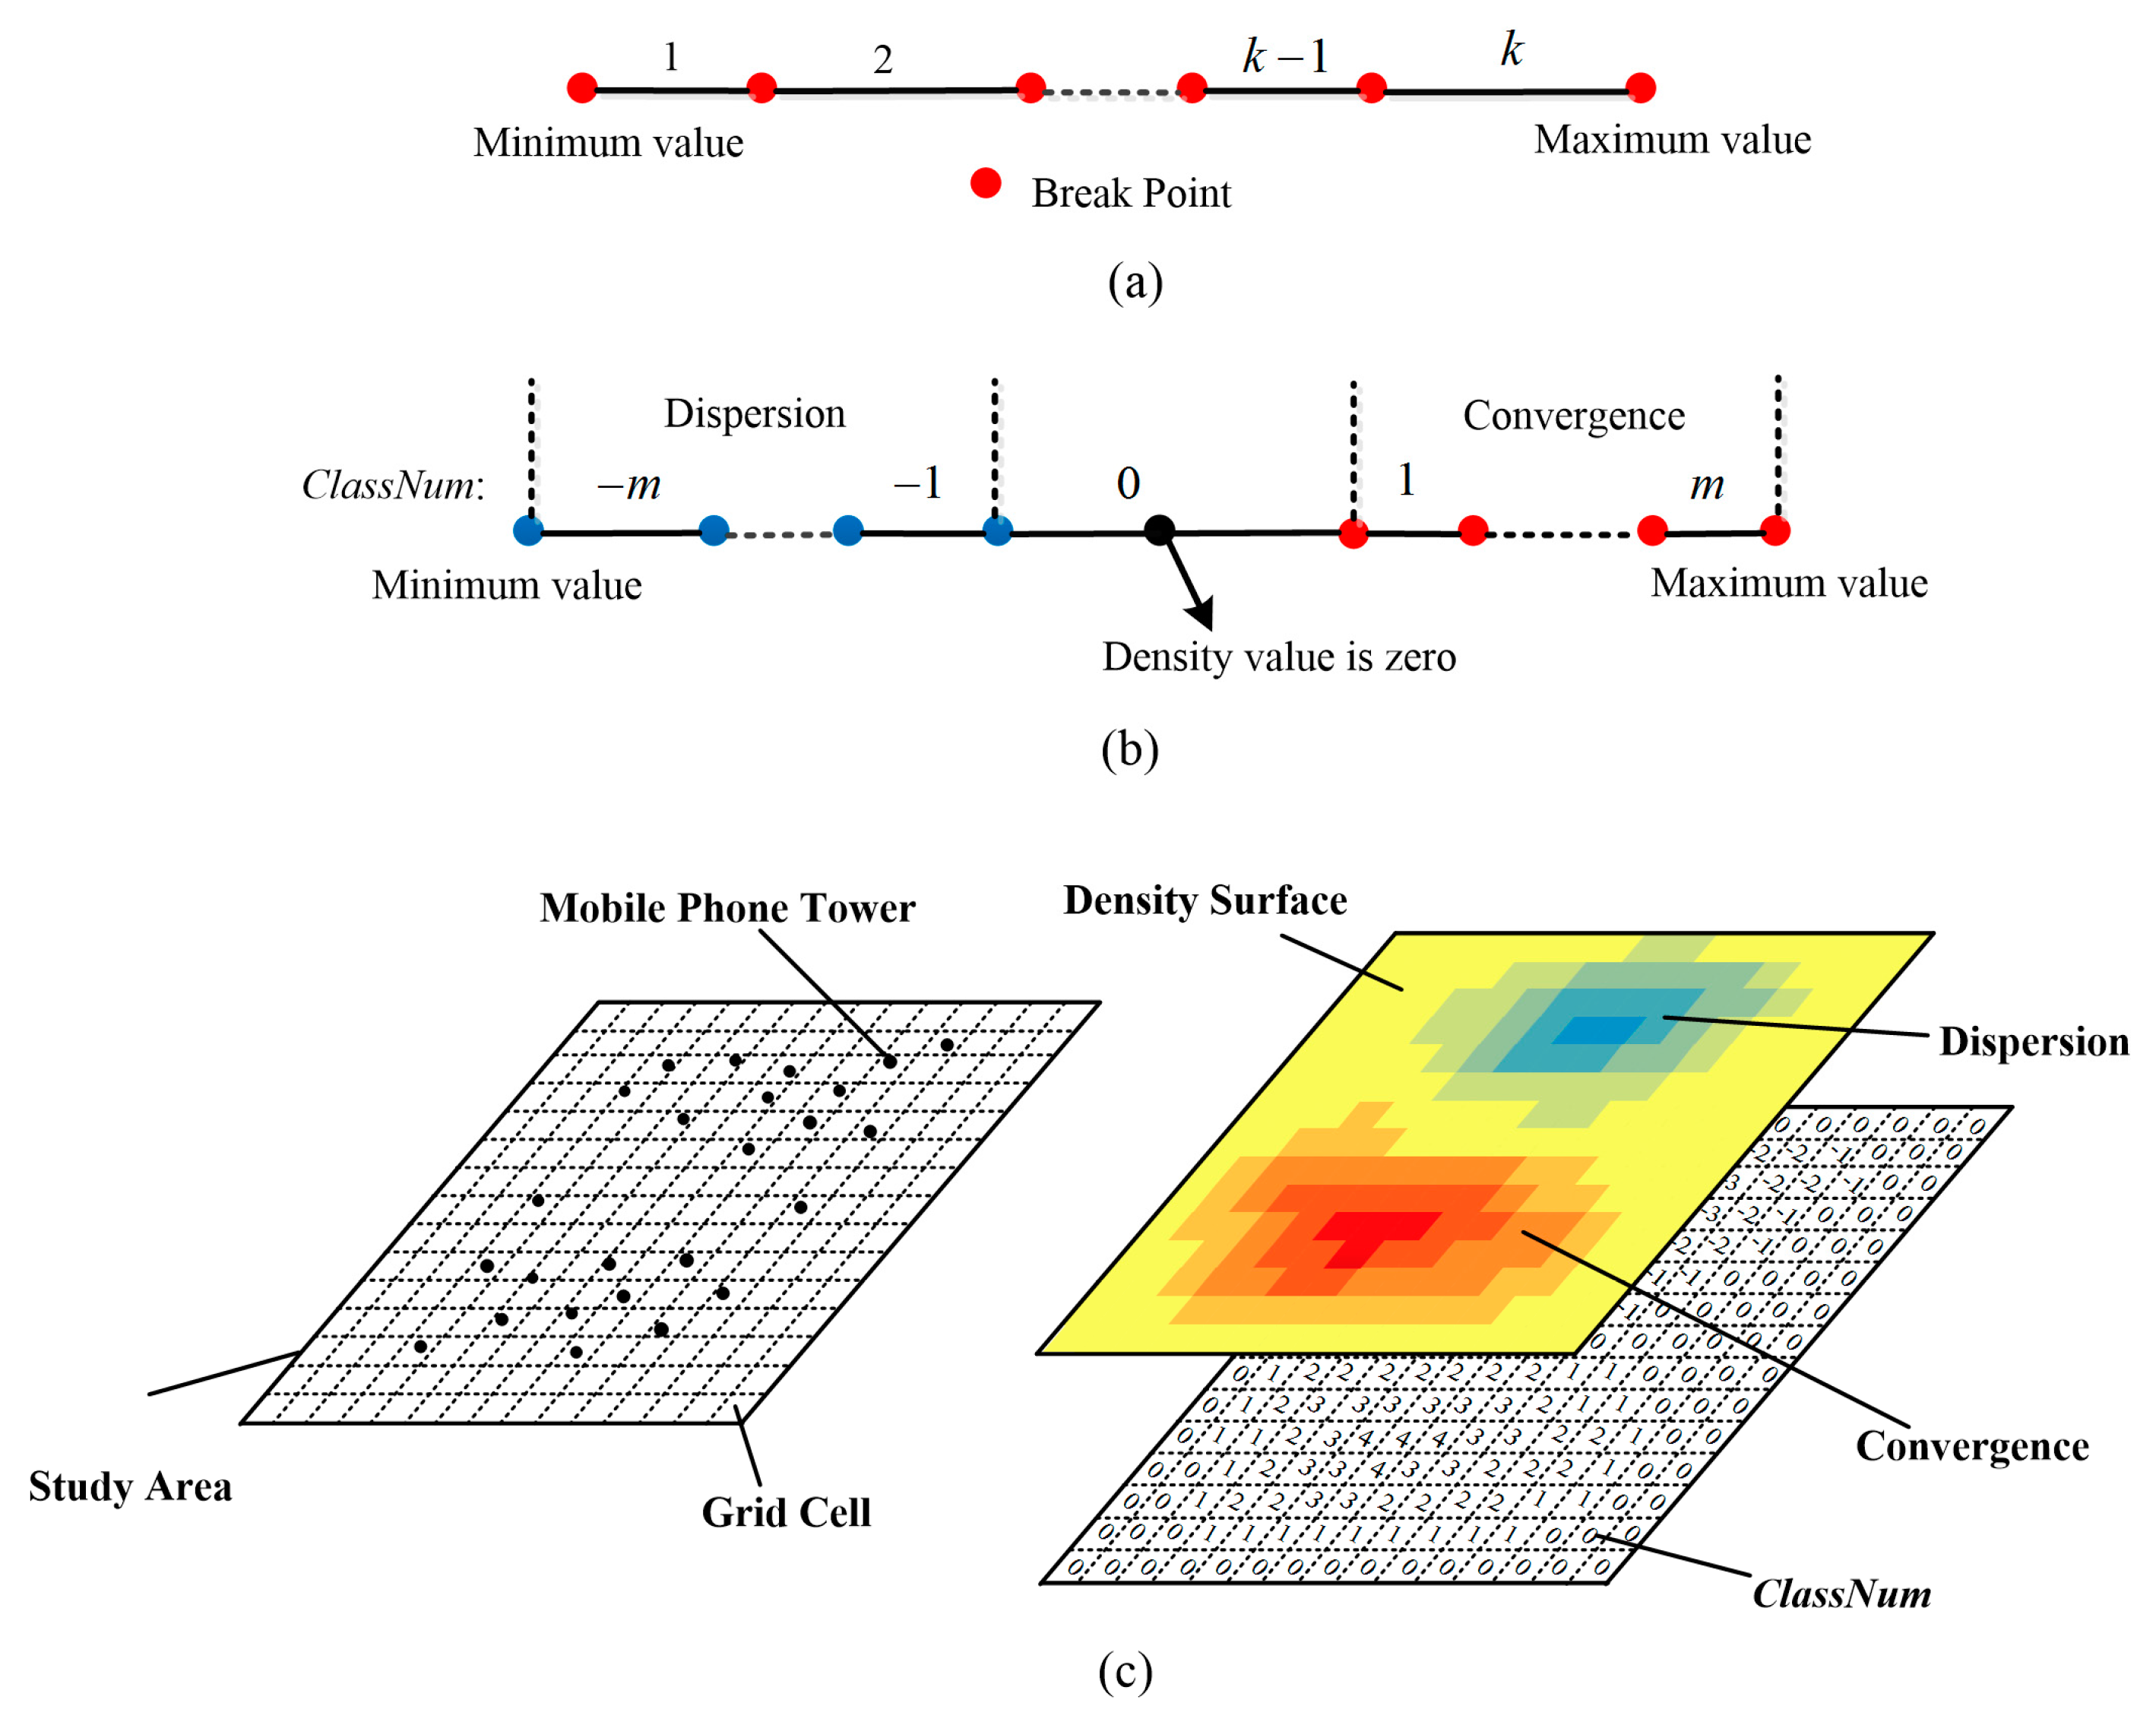
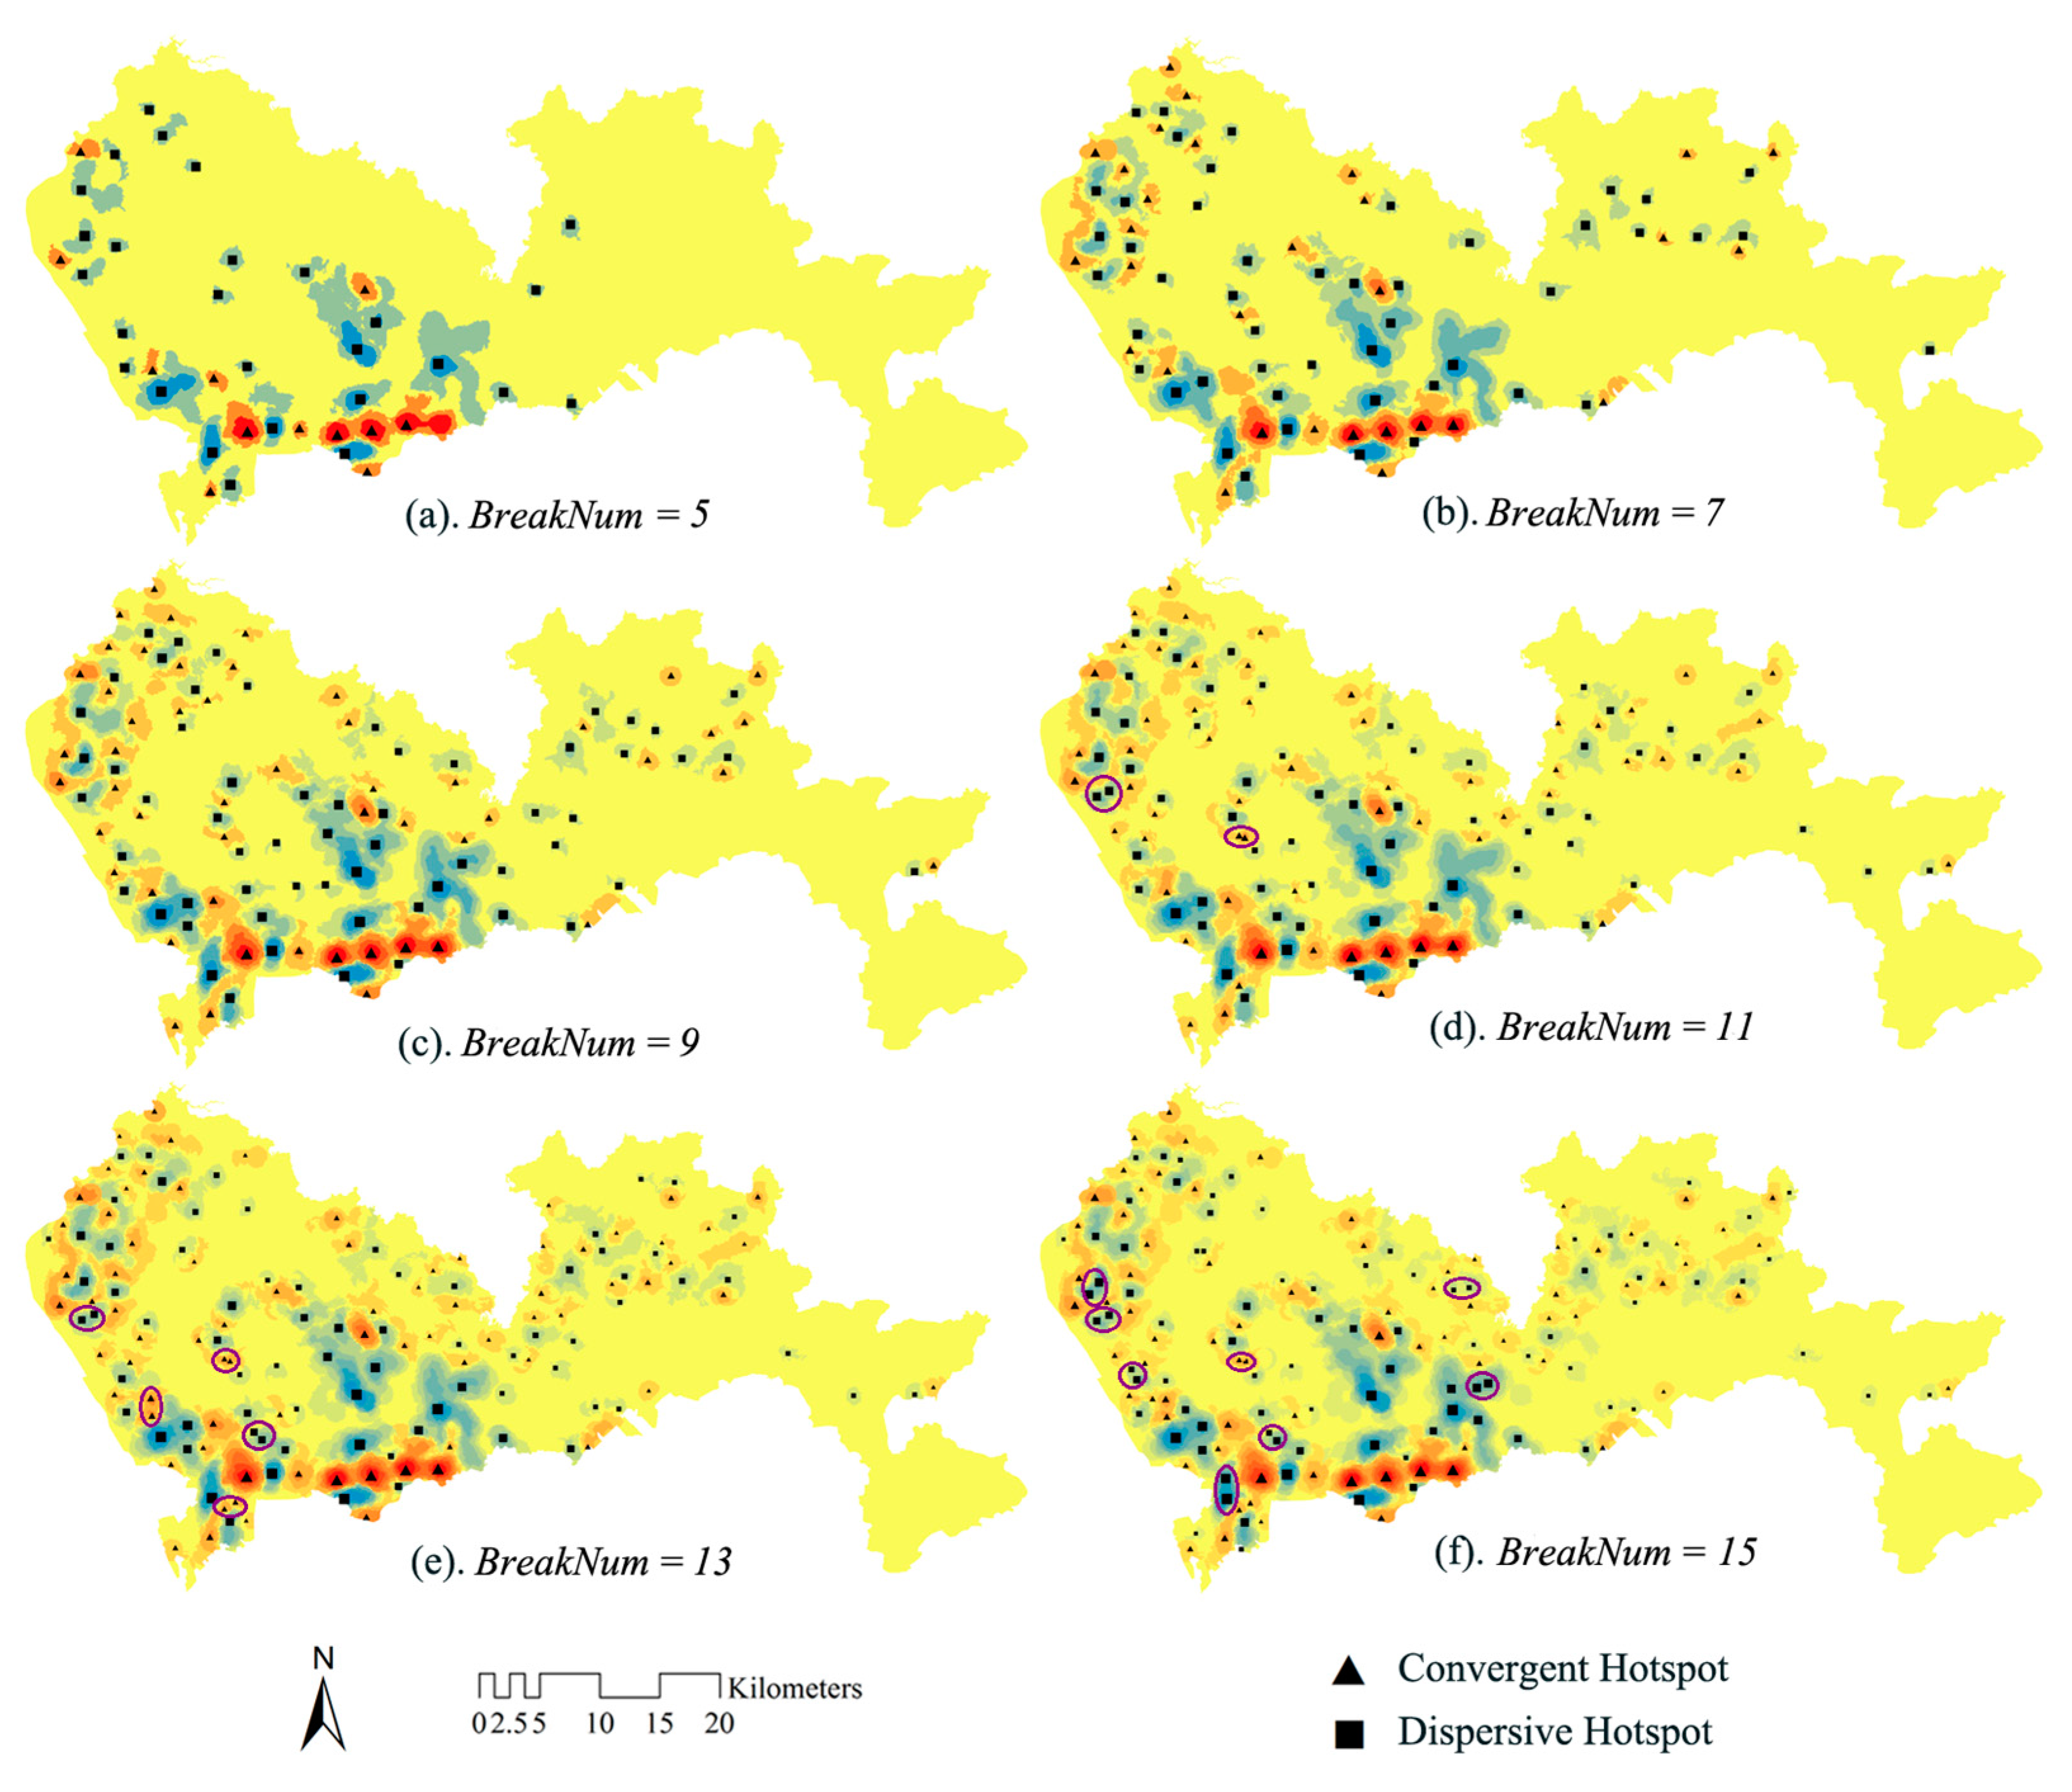
KDE is a suitable method for summarizing and visualizing the underlying property of point patterns. It can be used to estimate the density of any location in the study area and to transform the spatial points into a continuous 3D surface by dividing the study area into regular grid cells and estimating a density value for each grid cell according to the attribute of spatial points. It has been applied to model the spatial distribution of human activities [48,49]. In addition, the quantitative analysis can be operated based on these grid cells. The density value can be estimated by the formula:
f ( x ) = 1 n h 2 i = 1 n K ( x x i h )
where n is the number of mobile phone towers in this paper, h is the search bandwidth, K ( ) is the kernel function, x is the location of the grid cell for which the density will be estimated and x i is the location of the mobile phone tower i . Although previous studies have proven that different kernel functions do not have a significant effect on density estimation, the choice of bandwidth is a critical parameter in the method [46,52]. An excessive bandwidth will overly smooth point patterns and miss some local features, whereas a small bandwidth can cause many local peaks and valleys. Therefore, the choice of bandwidth remains closely related to the spatial distribution of data points and the context of the study area, as well as the purpose of the study.

Natural Breaks

Although KDE can generate a continuous surface, Takahashi, et al. [53] claim that the KDE surface is not an ideal surface for feature extraction; thus, additional processing is required to deal with the density surface before hotspots are extracted, e.g., converting the density surface into a triangulated irregular network (TIN) and extracting critical features [46]. In this study, we apply the classical natural breaks method to preprocess the grid cells with the density value to group these grid cells into different groups and label ClassNum for each grid cell. For this, we can generate another surface based on ClassNum, which lays a foundation for later traversal searching process.
In this study, we use the natural breaks method to process the KDE surface before identifying hotspots. Natural breaks are designed to determine the best arrangement of values into different classes according to their statistical characteristics; it requires an iterative process that seeks to minimize the variance within classes and maximize the variance between classes [54]. The method is extensively applied to classify and visualize geographic data. We chose this method to classify the grid cells of a density surface into different classes and label each grid cell using the corresponding ClassNum to indicate the strength of human mobility of the grid cell. Thus, the process includes breaking classes and labeling. Given that we want to break these grid cells into k classes (denoted as BreakNum in the following analysis) according to the statistical characteristics of their density values, the method will return k + 1 break points with a density value. The density value of the first break point is the minimum value of all grid cells, whereas the density value of the last break point is the maximum value (Figure 4a). For each class, the density value is dependent on two break points (left break point and right break point) to select grid cells for which the density value is larger than the density of the left break point and less than the density of the right break point.
In the step of labeling, due to the density including both positive and negative values, we introduce ClassNum to designate each class to distinguish positive classes and negative classes. As shown in Figure 4b, for one class, if the densities of the grid cells in the class vary from negative to positive, this indicates that the netflow of this class is insignificant, and the ClassNum of this class is denoted by 0. If all densities of the grid cells in the class are all negative or all positive and the ClassNum of this class is positive or negative, this indicates that the status of human mobility is convergent or dispersive. The greater the strength of the human convergence or dispersion is, the larger the absolute value of ClassNum is. After labeling ClassNum, we obtain another surface based on ClassNum (Figure 4c). Thus, each grid cell has two attributes: density value (termed Density) and ClassNum, which are used to design the rule of traversal searching in the next section.

Traversal Searching

The grid cells that have been assigned the previously mentioned attributes can be considered to be an analogue of the pixels of a remote sensing image. Some methods that have been developed in a remote sensing application can be employed to address social sensing data, such as check-in data, mobile phone data and smart card records [55]. Inspired by the principle of the region growing algorithm in the field of image segmentation, we design a similar traversal searching algorithm to identify local convergent hotspots (peaks) and dispersive hotspots (pits) for each time slot. The detailed searching algorithm is described as follows:
Input: G = { g i | 1 i N } , a set of all grid cells with two attributes: Density and ClassNum.
Output: A set of grid cells that represent local critical peaks and pits H = { h l | 1 l < < N } .
Step 1.
Initializing two temporary empty sets A = and B = , which will be used to store grid cells during the traversal searching process.
Step 2.
Selecting the grid cell g i , for which both |Density| and |ClassNum| are maximum from G , where | | represents the absolute value. The grid cell can be regarded as a local extreme point (peak or pit); we add g i to H and remove it from G .
Step 3.
Let g i be the expansion origin. We search its 8 neighboring grid cells from G . If the ClassNum of the neighboring grid cell has the same sign as g i and the |ClassNum| of the neighboring grid cell is less than or equal to g i , then add the grid cell to A and remove it from G .
Step 4.
For each grid cell in A , search its 8 neighboring grid cells in the set G according to the rule of Step 3, add the grid cells that satisfy the rule to B , and remove them from G . Clear set A , and transfer all grid cells from set B to set A . If set A is empty, go to Step 1. Otherwise, repeat Step 4.
Step 5.
Repeat these steps until set G is empty.
Using the previous searching process, we can extract local extreme peaks and pits. For each grid cell in H , the ClassNum of the grid cell is either positive or negative, which indicates that it is a convergent hotspot or dispersive hotspot. In addition, the |ClassNum| of the grid cell indicates the strength of the human convergence or dispersion in this time slot.

3.2.3. Clustering of Hotspots Based on Their Temporal Signatures

For each time slot, we can extract human convergent and dispersive hotspots using these procedures. We extract hotspots for 23 time slots and store these grid cells in the hotspot set H . These grid cells can represent the status and strength of the human mobility in the local area for different time slots. As the previous description, the ClassNum of the grid cells not only can represent human convergence or dispersion through a positive or a negative sign, but also can indicate the strength of human mobility by the absolute value of ClassNum. For each grid cell in set H , the variation of its ClassNum during a day can reflect the human dynamics of the grid cell. Therefore, analyzing the temporal variation in the ClassNum of these hotspots can provide dynamic insight about the spatial-temporal patterns of human convergence and dispersion in an urban context. In this section, we apply a clustering method to time series of ClassNum of these hotspots to group hotspots with similar temporal patterns into different classes. For this, we can identify the areas with similar human dynamics in the city. Assume that the hotspot set contains M unique grid cells. For each grid cell, we arrange its ClassNum in chronological order. In this manner, we can construct a time series matrix that includes M rows and 23 columns (Table 1).
Cluster analysis, which is an important tool for identifying groups with similar characteristics, has been extensively applied to geographical knowledge discovery. Many different types of clustering algorithms exist; the selection of the algorithm is dependent on the purpose of the analysis and the characteristics of the data. The K-means algorithm has the ability to address multidimensional variables and is suitable for clustering the time series matrix; however, a major challenge of the K-means algorithm is the determination of the number of clusters. An improved X-means algorithm is proposed based on K-means to overcome its shortcoming. This algorithm can automatically determine the number of clusters using the Bayesian information criterion (BIC) principles; thus, it is an unsupervised cluster method that prevents the difficulty of choosing the number of clusters. Therefore, we utilize the X-means algorithm to cluster the time series matrix, and the well-known data mining tool WEKA is employed to execute this algorithm [56].

4. Experiment and Discussion

4.1. Identifying Local Human Mobility Hotspots

We program the method described in Section 3.2 using C# and ArcObjects components to extract human mobility hotspots from mobile phone location data. We use a regular grid of 100 m × 100 m to divide the entire city; it provides a sufficient amount of micromeshes for us to study the human mobility of the city. The proposed method includes two parameters: the bandwidth for KDE and BreakNum for natural breaks; we will discuss these parameters in this section. We select T 8 to perform experiments to determine the two parameters. This time slot represents the human mobility from 7:00 a.m. to 9:00 a.m., which is the morning commute time period during which the majority of urban residents commute from their residences to their work places in the city.
As previously mentioned, the bandwidth is closely related to the spatial characteristics of the data points and the purpose of the analysis, as well as the context of the study area. Referring to the method in the literature [46], in this paper, we also determine the bandwidth by trial and error to produce a surface that is suitable for the study area by balancing between smoothing and locality. We experimented with different bandwidth values beginning with 250, 500, 750, 1000, 1250 and 1500 m to estimate the density. We selected 250 m because the average nearest neighbor distance to the mobile phone towers is 246.7 m, which is near 250 m, and apply a unified classification criteria to compare the effect of different bandwidths. Figure 5 shows the results of KDE for the different bandwidth values. It can be seen that the surface gradually smooths with the bandwidth increasing. The bandwidth of less than or equal to 750 m generates a more detailed and overly-local surface, which could reflect the spatial distribution of cell phone towers, whereas the bandwidth equal to or greater than 1250 m generates an overly-smooth surface, which would overlook some local areas, especially in the northern part of the city. A bandwidth of 1000 m can produce an appropriate surface by considering the balance between locality and generality. We apply the bandwidth of 1000 m to extract the human mobility hotspots in the remaining analysis.
After determining the search bandwidth of KDE, we extracted human mobility hotspots with different BreakNum values of 5, 7, 9, 11, 13 and 15. The choice of BreakNum is odd because the density value of the surface in this study includes both positive and negative values; as a result, we attempt to classify the surface into symmetrical classes. Table 2 lists the number of convergent hotspots and dispersive hotspots for different values of BreakNum. We can see that the number of hotspots increases with BreakNum increasing. This may be caused by two reasons: some hotspots gradually emerge in human mobility insignificant areas with an increase in BreakNum, especially in the northern part of the city (Figure 6); another reason may be that some hotspots begin to break down into two very close local hotspots when BreakNum gradually increases (highlighted by purple ellipses in Figure 6d–f). We selected BreakNum = 9 to identify human convergent and dispersive hotspots in the subsequent analysis, which is sufficiently exhaustive to explore human mobility in the city because a higher classification number may produce very close local and insignificant hotspots.
Based on the above discussion, it can be seen that the proposed workflow can successfully identify local peaks of small hills and pits of valleys from the density surface, which are signified as convergent hotspots and dispersive hotspots in this study. The method also enables us to analyze urban human mobility from macro to micro by gradually increasing BreakNum. In addition, it has the capability of revealing the strength of the human convergence and dispersion in different areas of the city, which can be illustrated by |ClassNum|. This knowledge indicates where, when and to what extent human mobility hotspots appear in the city, which provides a general understanding of the human dynamics in an urban context. The workflow can be applied to other human activities datasets such as social media check-in data, taxi pick-up and drop-off data to identify urban human activity hotspots and locations of high travel demand. Moreover, it can be introduced to other fields, such as criminology and epidemiology, and help with identifying locations with high crime rates and morbidity.

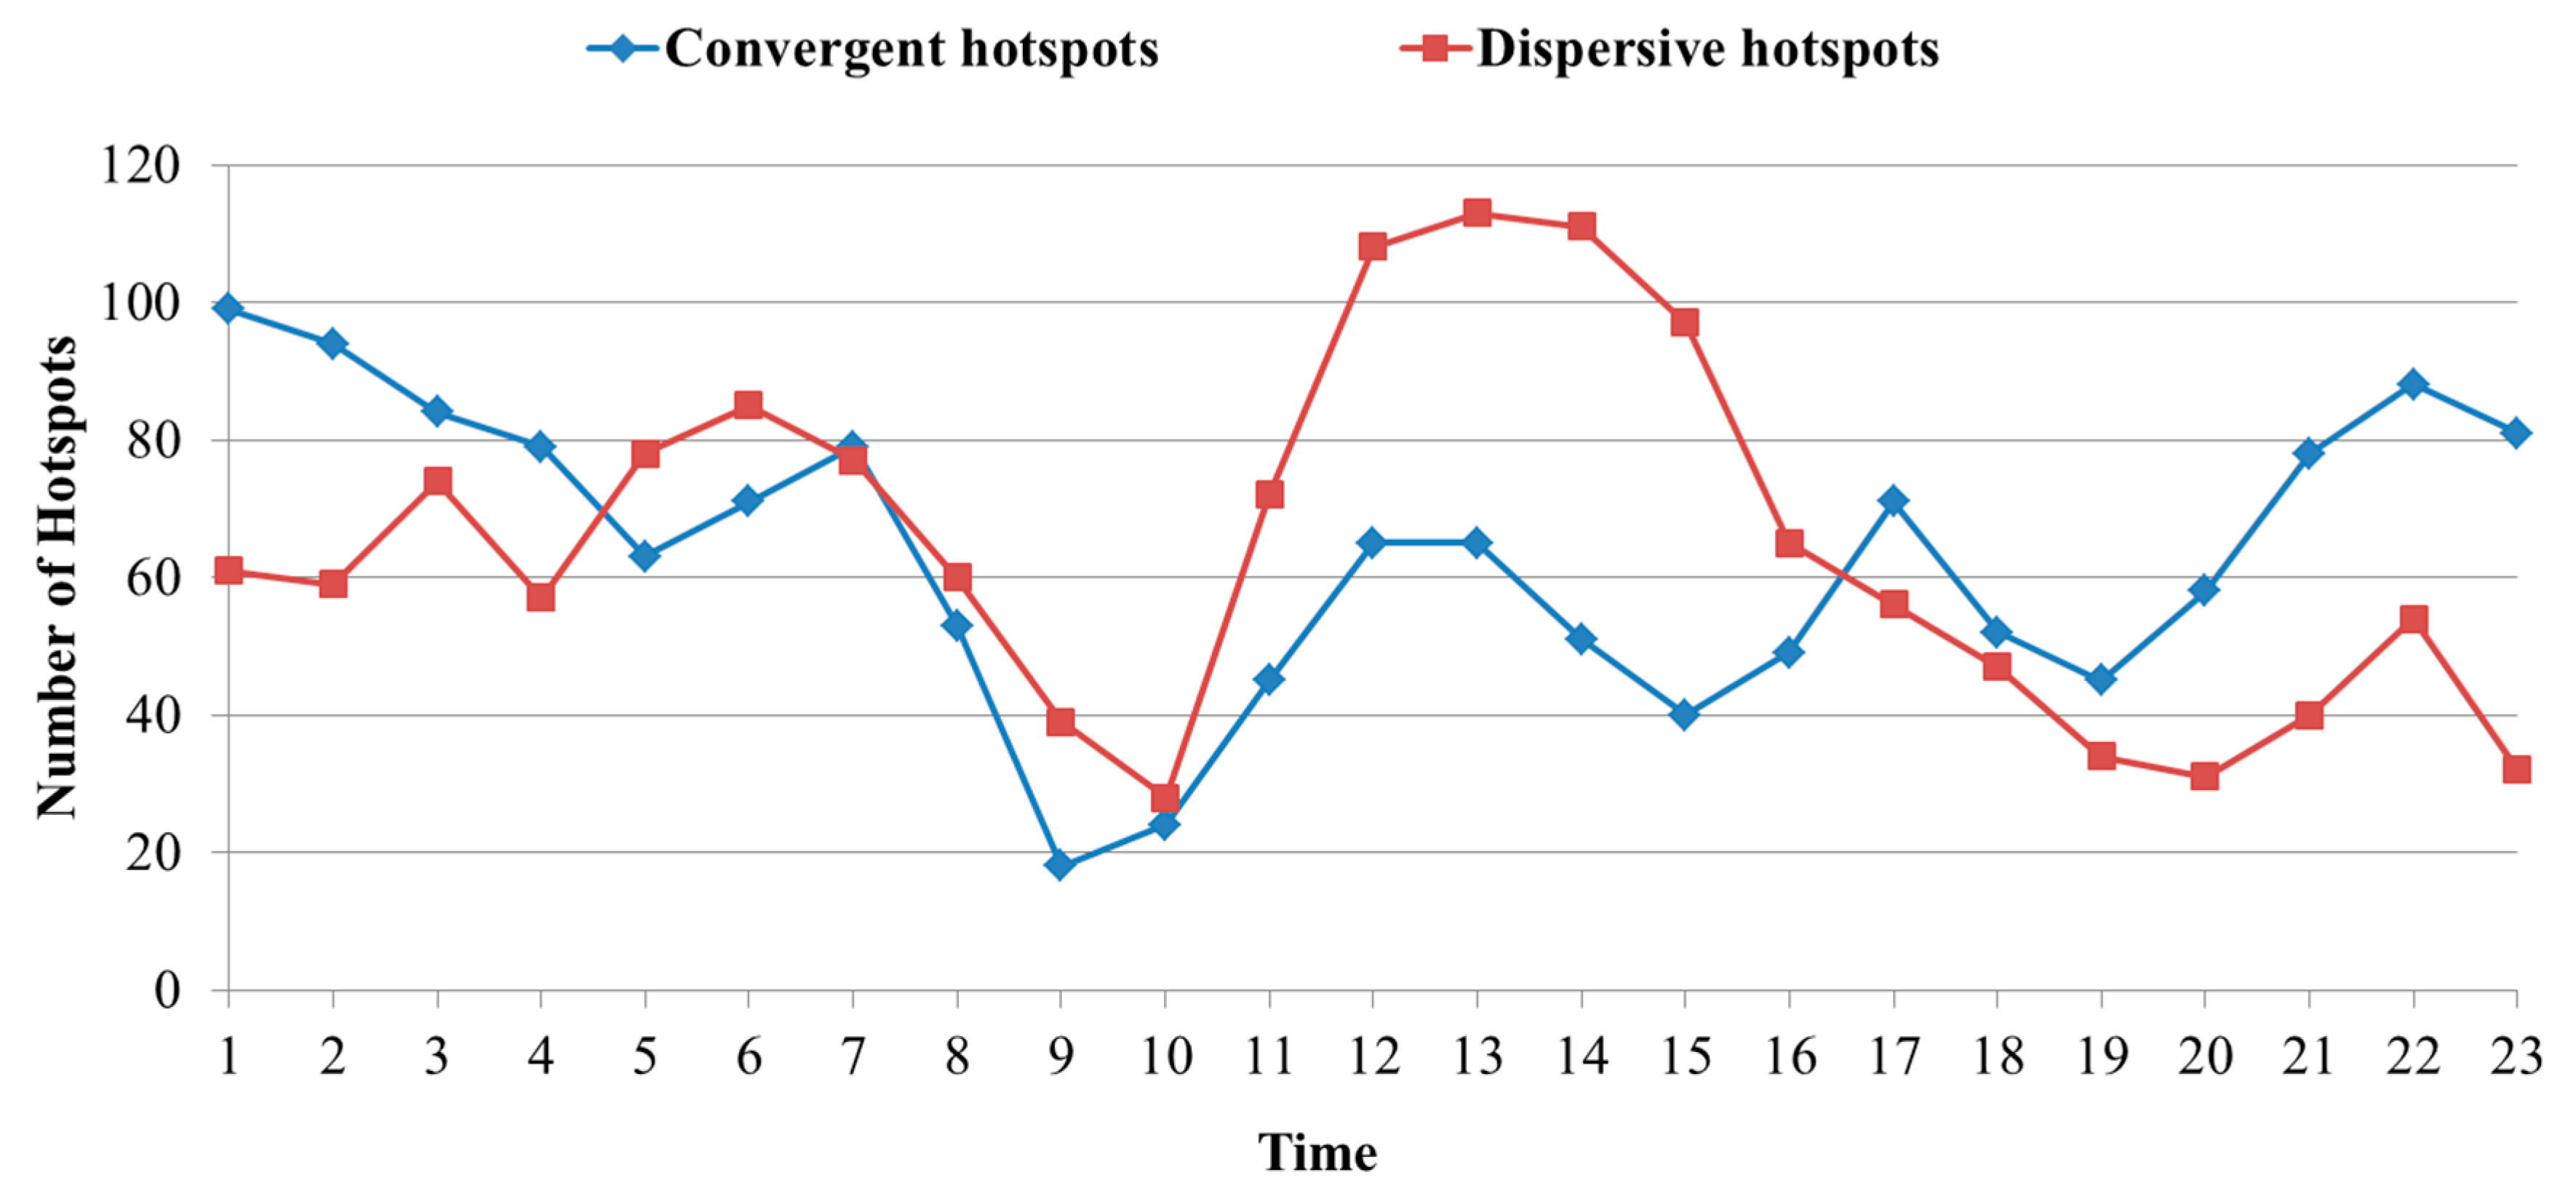
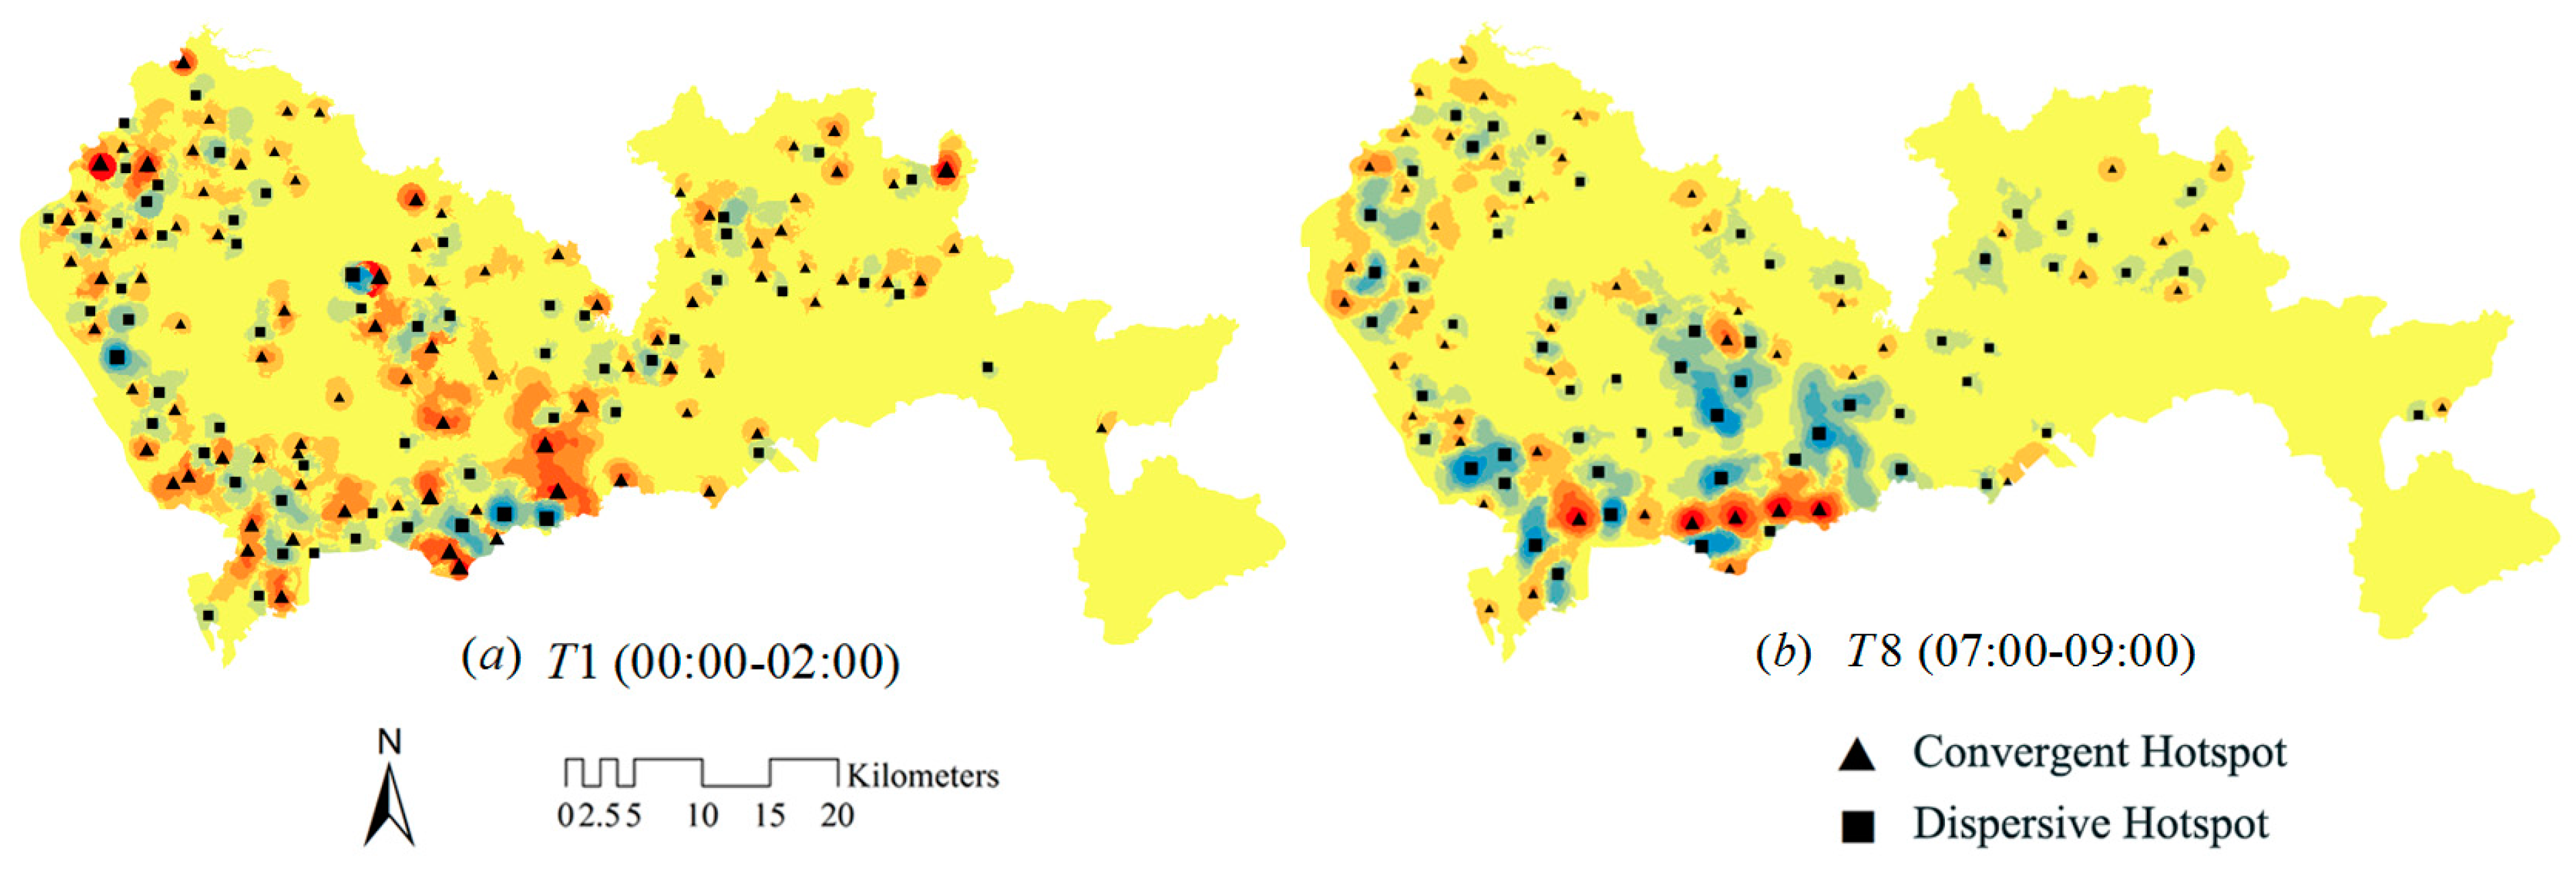
4.2. Spatial-Temporal Convergent and Dispersive Patterns in the Urban Area

We employ the developed workflow to identify human convergent and dispersive hotspots for all 23 time slots. Figure 7 illustrates the variation in the number of hotspots during the day (BreakNum = 9). It is counter-intuitive that most movements occur in commuting periods, whereas the number of convergent and dispersive hotspots during the commuting period is less than other time periods, especially during the morning commute period, and there is high number of hotspots close to midnight. Figure 8 shows the human mobility hotspots in T 1 and T 8 . Compared to T 8 , there are many local and close hotspots appearing in T 1 , which leads to a high number of hotspots. The reason may be that people have a degree of freedom during this time period, and they can do things with different purposes (such as engaging in different recreational activities), so the hotspots scatter in some recreation-concentrated places. Another reason may be that some industries (especially in the northern part of Shenzhen) adopt three-shift working systems (00:00–08:00, 08:00–16:00 and 16:00–24:00), which may lead to a high number of hotspots in the shift period ( T 1 ). However, in the commuting period, the majority of the people in the city travel with the purpose of going to work or returning home, the hotspots are primarily distributed in some work- or home-concentrated places of the city, which may lead to the least number of hotspots. Similarly, we can see that the number of dispersive hotspots is substantially larger than the number of convergent hotspots from 12:00–14:00. The reason for this result may be attributed to the notion that people at home and work choose to go out for lunch; thus, both residential and industrial areas contain dispersive hotspots, whereas some places with restaurants contain convergent hotspots.
Figure 9a illustrates the spatial distribution of the hotspots using the X-means algorithm; the points represent the center points of the corresponding grid cells. Six typical clusters are detected based on the temporal patterns of the hotspots; we denote the clusters as C 1 , C 2 , C 3 , C 4 , C 5 and C 6 . Spatial proximity can be fully reflected for each cluster in the figure, which is reasonable because the closer the hotspots are in space, the greater is the similarity among their temporal patterns. Figure 9b illustrates the mean temporal pattern of each cluster; the blank indicates that the ClassNum is zero. In the following section, we combine the spatial distribution of these clusters with urban functional areas to discuss and explain the human convergence and dispersion pattern of each cluster.
A characteristic of C 1 is that the majority of hotspots exhibit convergence from 06:00–09:00 and weak dispersion after 16:00 (Figure 9b). In addition, dispersion occurred first, and convergence subsequently occurred from 12:00–14:00. As shown in Figure 10, these hotspots are primarily located in some industrial, administrative and education functional areas, especially in the northern part of the city, which includes many industrial parks. The convergence and dispersion patterns may be caused by people’s daily commuting patterns, and the movements that occur at noon may be caused by some work break activities, such as going to lunch or going shopping.
These hotspots in C 2 are primarily located in the downtown commercial areas (Figure 11). These areas are urban central business districts (CBDs), including a great number of shopping malls, governmental agencies, financial services institution and office buildings. Therefore, these areas attract numerous people for work, shopping or other activities during the daytime; this can be validated by Figure 9b, in which convergence occurs from 06:00–15:00 and dispersion occurs during other times. Moreover, the human mobility in these areas is high-intensity no matter if it is gathering or dispersing.
These hotspots of C 3 are primarily distributed at the edge of the city (Figure 11). These places exhibited a convergence pattern throughout the majority of the day (Figure 9b). We examined the characteristics of these places and discovered that several important traffic junctions connect with other places outside this city, i.e., high-speed intersections and Futain Port (connecting to Hong Kong). This strange phenomenon may be attributed to the fact that our dataset does not include movements outside the city. Due to this limitation, people leaving via these places cannot be traced. Therefore, these places only exhibit convergences during the day.
Figure 12 illustrates the spatial distribution of hotspots in C 4 and C 5 . In contrast to the phenomenon in C 1 , the temporal patterns of C 4 show dispersion from 06:00–09:00 and convergence after 17:00 (Figure 9b). As shown in Figure 12, the hotspots are primarily located in residential functional areas and in the northern part of the city. Thus, the convergence and dispersion pattern of C 4 can be explained by people who reside in these places and commute to work in the morning and return home after work. In addition, convergence and dispersion occur from 12:00–14:00, which may comprise people partaking in some activities near their home, such as going home for lunch or taking a break.
The temporal patterns of C 5 are the opposite of the temporal patterns of C 2 , which show dispersion from 06:00–15:00 and convergence during other time periods (Figure 9b). Similar to C 4 , the hotspots of this cluster are also distributed in residential function areas of the city; however, the difference is that the hotspots in C 5 are distributed in the southern part, which are close to the central business districts (CBDs) of the city. Thus, these areas have high-density residential functions. We conjecture that the majority of the people who live in these places work in urban downtown districts, which may explain the complementary temporal patterns between C 2 and C 5 .
As shown in Figure 9b, the human mobility of C 6 is insignificant during the majority of the day. These hotspots are primarily distributed in industrial and residential functional areas of the northern part of the city (Figure 13). With our knowledge of Shenzhen, these areas include numerous small-scale factories and attract a large number of migrant workers. Many factories provide these workers with living places near or within their workplace. Therefore, people in these areas have relatively small activity spaces [12], and the strength of human convergence and dispersion is weak, even during the commute period.
According to the above analysis, it enriches our knowledge about Shenzhen, which cannot be derived from traditional survey datasets. We extracted six typical spatial-temporal patterns of human convergence and dispersion in Shenzhen, which is similar to the findings based on GPS-enabled taxi data in Shanghai [13]. In addition, spatially-adjacent and complementary patterns are observed between C 1 and C 4 and between C 2 and C 5 . With respect to spatial distribution, C 1 and C 4 are located in the northern part of Shenzhen, whereas C 2 and C 5 are located in the southern part of Shenzhen. The geographical difference among human convergent and dispersive patterns is consistent with the urban planning and socio-economic division of Shenzhen. In the long-term planning of the city, the southern part of this city is oriented as urban areas with urban financial, business, education and high-tech centers; thus, the economy in the southern part is more developed than the economy in the northern part, which includes manufacturing industries. Therefore, different socio-economic areas have different human convergence and dispersion patterns. The analysis results of this study provide some initial insights into the human mobility patterns in the urban functional area and the influence of the division of socio-economics on human mobility in Shenzhen.

5. Conclusions

The availability of large-scale people tracking datasets (e.g., mobile phone, check-in and credit data) provides the opportunity and challenge to study urban human mobility patterns to better understand the interactions between human mobility and urban environments. In this paper, we explore the human dynamics by investigating the spatial-temporal patterns of human mobility hotspots. A brief workflow is proposed to identify and extract spatial-temporal patterns of human convergent and dispersive hotspots based on mobile phone location data. A case study of Shenzhen, China, is employed to test the proposed method; six typical spatial-temporal convergent and dispersive patterns are identified in the city. We discuss the spatial distribution of these patterns in different urban functional areas to obtain better knowledge of human mobility activity.
This study presents knowledge of daily human convergence and dispersion patterns in different urban functional areas in Shenzhen. The findings derived from this study provide insight about the location, time and intensity of the convergence and dispersion of people in Shenzhen, which is helpful for improving urban local planning for human mobility. The identified patterns can help urban taxi companies make targeted adjustments to allocate taxis to locations with high human mobility activity to improve service efficiency. In addition, the findings can be used as a reference for understanding human mobility in other cities in China. For example, if we only know the spatial distribution of the function areas of one city, it is possible to have a general understanding of daily human convergence and dispersion in other cities according to the discussion in Section 4.2.
In the future, we will utilize origin-destination trip information to analyze land use information about the origin and destination of each trip and to determine the spatial interactions among different areas of the city and explore the human mobility patterns among different land uses, which can provide in-depth knowledge of the interactions between citizens and their living environments.

Acknowledgments

This study was jointly supported by National Natural Science Foundation of China (Grant No. 41231171) and the Fundamental Research Funds for the Central Universities (Grant No. 2015305020201). The authors are grateful for the valuable comments and suggestions from the anonymous reviewers.

Author Contributions

Xiping Yang and Zhiyuan Zhao conceived of and designed this study. Xiping Yang analyzed and drafted the manuscript. Shiwei Lu gave many valuable suggestions and help editing the language of the manuscript.

Conflicts of Interest

The authors declare no conflict of interest.

References

  1. Armah, F.A.; Yawson, D.O.; Pappoe, A.A. A systems dynamics approach to explore traffic congestion and air pollution link in the city of Accra, Ghana. Sustainability 2010, 2, 252–265. [Google Scholar] [CrossRef]
  2. Li, S.; Ma, Y. Urbanization, economic development and environmental change. Sustainability 2014, 6, 5143–5161. [Google Scholar] [CrossRef]
  3. Yuan, Y.; Raubal, M. Extracting dynamic urban mobility patterns from mobile phone data. In Geographic Information Science; Springer: Berlin, Germany, 2012; pp. 354–367. [Google Scholar]
  4. Fang, Z.; Tu, W.; Li, Q.; Li, Q. A multi-objective approach to scheduling joint participation with variable space and time preferences and opportunities. J. Transp. Geogr. 2011, 19, 623–634. [Google Scholar] [CrossRef]
  5. Yue, Y.; Lan, T.; Yeh, A.G.; Li, Q.-Q. Zooming into individuals to understand the collective: A review of trajectory-based travel behaviour studies. Travel Behav. Soc. 2014, 1, 69–78. [Google Scholar] [CrossRef]
  6. Gao, S. Spatio-temporal analytics for exploring human mobility patterns and urban dynamics in the mobile age. Spat. Cogn. Comput. 2015, 15, 86–114. [Google Scholar] [CrossRef]
  7. Gonzalez, M.C.; Hidalgo, C.A.; Barabasi, A.-L. Understanding individual human mobility patterns. Nature 2008, 453, 779–782. [Google Scholar] [CrossRef] [PubMed]
  8. Shaw, S.-L.; Yu, H. A gis-based time-geographic approach of studying individual activities and interactions in a hybrid physical-virtual space. J. Transp. Geogr. 2009, 17, 141–149. [Google Scholar] [CrossRef]
  9. Calabrese, F.; di Lorenzo, G.; Liu, L.; Ratti, C. Estimating origin-destination flows using mobile phone location data. IEEE Pervasive Comput. 2011, 10, 36–44. [Google Scholar] [CrossRef]
  10. Hasan, S.; Schneider, C.M.; Ukkusuri, S.V.; González, M.C. Spatiotemporal patterns of urban human mobility. J. Stat. Phys. 2013, 151, 304–318. [Google Scholar] [CrossRef]
  11. Kang, C.; Ma, X.; Tong, D.; Liu, Y. Intra-urban human mobility patterns: An urban morphology perspective. Phys. A Stat. Mech. Appl. 2012, 391, 1702–1717. [Google Scholar] [CrossRef]
  12. Xu, Y.; Shaw, S.-L.; Zhao, Z.; Yin, L.; Fang, Z.; Li, Q. Understanding aggregate human mobility patterns using passive mobile phone location data: A home-based approach. Transportation 2015, 42, 625–646. [Google Scholar] [CrossRef]
  13. Liu, Y.; Wang, F.; Xiao, Y.; Gao, S. Urban land uses and traffic ‘source-sink areas’: Evidence from GPS-enabled taxi data in shanghai. Landsc. Urban Plan. 2012, 106, 73–87. [Google Scholar] [CrossRef]
  14. Bengtsson, L.; Gaudart, J.; Lu, X.; Moore, S.; Wetter, E.; Sallah, K.; Rebaudet, S.; Piarroux, R. Using mobile phone data to predict the spatial spread of cholera. Sci. Rep. 2015. [Google Scholar] [CrossRef] [PubMed] [Green Version]
  15. Brimicombe, A.J. Cluster detection in point event data having tendency towards spatially repetitive events. In Proceedings of the 8th International Conference on GeoComputation, Ann Arbor, MI, USA, 1–3 August 2005.
  16. Steenbruggen, J.; Tranos, E.; Nijkamp, P. Data from mobile phone operators: A tool for smarter cities? Telecommun. Policy 2015, 39, 335–346. [Google Scholar] [CrossRef]
  17. Song, C.; Qu, Z.; Blumm, N.; Barabási, A.-L. Limits of predictability in human mobility. Science 2010, 327, 1018–1021. [Google Scholar] [CrossRef] [PubMed]
  18. Brockmann, D.; Hufnagel, L.; Geisel, T. The scaling laws of human travel. Nature 2006, 439, 462–465. [Google Scholar] [CrossRef] [PubMed]
  19. Schneider, C.M.; Belik, V.; Couronné, T.; Smoreda, Z.; González, M.C. Unravelling daily human mobility motifs. J. R. Soc. Interface 2013. [Google Scholar] [CrossRef] [PubMed]
  20. De Montjoye, Y.-A.; Hidalgo, C.A.; Verleysen, M.; Blondel, V.D. Unique in the crowd: The privacy bounds of human mobility. Sci. Rep. 2013. [Google Scholar] [CrossRef] [PubMed]
  21. Yin, L.; Wang, Q.; Shaw, S.-L.; Fang, Z.; Hu, J.; Tao, Y.; Wang, W. Re-identification risk versus data utility for aggregated mobility research using mobile phone location data. PLoS ONE 2015, 10, e0140589. [Google Scholar] [CrossRef] [PubMed]
  22. Ahas, R.; Silm, S.; Järv, O.; Saluveer, E.; Tiru, M. Using mobile positioning data to model locations meaningful to users of mobile phones. J. Urban Technol. 2010, 17, 3–27. [Google Scholar] [CrossRef]
  23. Kung, K.S.; Greco, K.; Sobolevsky, S.; Ratti, C. Exploring universal patterns in human home-work commuting from mobile phone data. PLoS ONE 2014, 9, e96180. [Google Scholar] [CrossRef] [PubMed]
  24. Alexander, L.; Jiang, S.; Murga, M.; González, M.C. Origin-destination trips by purpose and time of day inferred from mobile phone data. Transp. Res. Part C Emerg. Technol. 2015, 58, 240–250. [Google Scholar] [CrossRef]
  25. Ratti, C.; Frenchman, D.; Pulselli, R.M.; Williams, S. Mobile landscapes: Using location data from cell phones for urban analysis. Environ. Plan. B Plan. Des. 2006, 33, 727–748. [Google Scholar] [CrossRef]
  26. Calabrese, F.; Colonna, M.; Lovisolo, P.; Parata, D.; Ratti, C. Real-time urban monitoring using cell phones: A case study in rome. IEEE Trans. Intell. Transp. Syst. 2011, 12, 141–151. [Google Scholar] [CrossRef]
  27. Kang, C.; Liu, Y.; Ma, X.; Wu, L. Towards estimating urban population distributions from mobile call data. J. Urban Technol. 2012, 19, 3–21. [Google Scholar] [CrossRef]
  28. Deville, P.; Linard, C.; Martin, S.; Gilbert, M.; Stevens, F.R.; Gaughan, A.E.; Blondel, V.D.; Tatem, A.J. Dynamic population mapping using mobile phone data. Proc. Natl. Acad. Sci. USA 2014, 111, 15888–15893. [Google Scholar] [CrossRef] [PubMed]
  29. Hoteit, S.; Secci, S.; Sobolevsky, S.; Ratti, C.; Pujolle, G. Estimating human trajectories and hotspots through mobile phone data. Compu. Netw. 2014, 64, 296–307. [Google Scholar] [CrossRef]
  30. Yuan, Y.; Raubal, M. Measuring similarity of mobile phone user trajectories—A spatio-temporal edit distance method. Int. J. Geogr. Inf. Sci. 2014, 28, 496–520. [Google Scholar] [CrossRef]
  31. Sagl, G.; Delmelle, E.; Delmelle, E. Mapping collective human activity in an urban environment based on mobile phone data. Cartogr. Geogr. Inf. Sci. 2014, 41, 272–285. [Google Scholar] [CrossRef]
  32. Toole, J.L.; Ulm, M.; González, M.C.; Bauer, D. Inferring land use from mobile phone activity. In Proceedings of the ACM SIGKDD International Workshop on Urban Computing, Beijing, China, 12 August 2012; ACM: New York, NY, USA; pp. 1–8.
  33. Pei, T.; Sobolevsky, S.; Ratti, C.; Shaw, S.-L.; Li, T.; Zhou, C. A new insight into land use classification based on aggregated mobile phone data. Int. J. Geogr. Inf. Sci. 2014, 28, 1988–2007. [Google Scholar] [CrossRef]
  34. Ratti, C.; Sobolevsky, S.; Calabrese, F.; Andris, C.; Reades, J.; Martino, M.; Claxton, R.; Strogatz, S.H. Redrawing the map of great britain from a network of human interactions. PLoS ONE 2010, 5, e14248. [Google Scholar] [CrossRef] [PubMed] [Green Version]
  35. Gao, S.; Liu, Y.; Wang, Y.; Ma, X. Discovering spatial interaction communities from mobile phone data. Trans. GIS 2013, 17, 463–481. [Google Scholar] [CrossRef]
  36. Grauwin, S.; Sobolevsky, S.; Moritz, S.; Gódor, I.; Ratti, C. Towards a comparative science of cities: Using mobile traffic records in New York, London, and Hong Kong. In Computational Approaches for Urban Environments; Springer: Berlin, Germany, 2015; pp. 363–387. [Google Scholar]
  37. Ahas, R.; Aasa, A.; Yuan, Y.; Raubal, M.; Smoreda, Z.; Liu, Y.; Ziemlicki, C.; Tiru, M.; Zook, M. Everyday space-time geographies: Using mobile phone-based sensor data to monitor urban activity in Harbin, Paris, and Tallinn. Int. J. Geogr. Inf. Sci. 2015, 29, 2017–2039. [Google Scholar] [CrossRef]
  38. Sherman, L.W.; Gartin, P.R.; Buerger, M.E. Hot spots of predatory crime: Routine activities and the criminology of place. Criminology 1989, 27, 27–56. [Google Scholar] [CrossRef]
  39. Nie, K.; Wang, Z.; Du, Q.; Ren, F.; Tian, Q. A network-constrained integrated method for detecting spatial cluster and risk location of traffic crash: A case study from Wuhan, China. Sustainability 2015, 7, 2662–2677. [Google Scholar] [CrossRef]
  40. Yamada, I.; Thill, J.-C. Comparison of planar and network k-functions in traffic accident analysis. J. Transp. Geogr. 2004, 12, 149–158. [Google Scholar] [CrossRef]
  41. Tiwari, N.; Adhikari, C.; Tewari, A.; Kandpal, V. Investigation of geo-spatial hotspots for the occurrence of tuberculosis in almora district, India, using GIS and spatial scan statistic. Int. J. Health Geogr. 2006. [Google Scholar] [CrossRef] [PubMed]
  42. Getis, A.; Ord, J.K. The analysis of spatial association by use of distance statistics. Geogr. Anal. 1992, 24, 189–206. [Google Scholar] [CrossRef]
  43. Anselin, L. Local indicators of spatial association—Lisa. Geogr. Anal. 1995, 27, 93–115. [Google Scholar] [CrossRef]
  44. Nelson, T.A.; Boots, B. Detecting spatial hot spots in landscape ecology. Ecography 2008, 31, 556–566. [Google Scholar] [CrossRef]
  45. Scholz, R.W.; Lu, Y. Detection of dynamic activity patterns at a collective level from large-volume trajectory data. Int. J. Geogr. Inf. Sci. 2014, 28, 1–18. [Google Scholar] [CrossRef]
  46. Hu, Y.; Miller, H.J.; Li, X. Detecting and analyzing mobility hotspots using surface networks. Trans. GIS 2014, 18, 911–935. [Google Scholar] [CrossRef]
  47. Chainey, S.; Ratcliffe, J. Gis and Crime Mapping; John Wiley & Sons: Hoboken, NJ, USA, 2013. [Google Scholar]
  48. Hasan, S.; Zhan, X.; Ukkusuri, S.V. Understanding urban human activity and mobility patterns using large-scale location-based data from online social media. In Proceedings of the 2nd ACM SIGKDD International Workshop on Urban Computing, Chicago, IL, USA, 11–14 August 2013; ACM: New York, NY, USA, 2013; p. 6. [Google Scholar]
  49. Lichman, M.; Smyth, P. Modeling human location data with mixtures of kernel densities. In Proceedings of the 20th ACM SIGKDD International Conference on Knowledge Discovery and Data Mining, New York, NY, USA, 24–27 August 2014; ACM: New York, NY, USA, 2014; pp. 35–44. [Google Scholar]
  50. Zhou, Y.; Fang, Z.; Thill, J.-C.; Li, Q.; Li, Y. Functionally critical locations in an urban transportation network: Identification and space-time analysis using taxi trajectories. Comput. Environ. Urban Syst. 2015, 52, 34–47. [Google Scholar] [CrossRef]
  51. Shenzhen Statistical Yearbook 2013. Available online: http://www.sztj.gov.cn/nj2014/indexeh.htm (accessed on 25 April 2016).
  52. Silverman, B.W. Density Estimation for Statistics and Data Analysis; CRC Press: Boca Raton, FL, USA, 1986. [Google Scholar]
  53. Takahashi, S.; Ikeda, T.; Shinagawa, Y.; Kunii, T.L.; Ueda, M. Algorithms for extracting correct critical points and constructing topological graphs from discrete geographical elevation data. Comput. Graph. Forum 1995. [Google Scholar] [CrossRef]
  54. Jenks, G.F. The data model concept in statistical mapping. Int. Yearb. Cartogr. 1967, 7, 186–190. [Google Scholar]
  55. Liu, Y.; Liu, X.; Gao, S.; Gong, L.; Kang, C.; Zhi, Y.; Chi, G.; Shi, L. Social sensing: A new approach to understanding our socioeconomic environments. Ann. Assoc. Am. Geogr. 2015, 105, 512–530. [Google Scholar] [CrossRef]
  56. Hall, M.; Frank, E.; Holmes, G.; Pfahringer, B.; Reutemann, P.; Witten, I.H. The weka data mining software: An update. ACM SIGKDD Explor. Newsl. 2009, 11, 10–18. [Google Scholar] [CrossRef]
Figure 1. Spatial distribution of mobile phone towers.
Sustainability 08 00674 g001
Figure 2. Convergent hotspot and dispersive hotspot of a 3D density surface.
Sustainability 08 00674 g002
Figure 3. Workflow to extract the spatial-temporal patterns of human mobility hotspots.
Sustainability 08 00674 g003
Figure 4. Description of the natural breaks method. (a) Break points of Natural break method; (b) Label the ClassNum for each class according to the density value; (c) Density and ClassNum surface.
Sustainability 08 00674 g004
Figure 5. Kernel density estimation (KDE) of different bandwidth values.
Sustainability 08 00674 g005
Figure 6. Spatial distribution of human mobility hotspots for applying different values of BreakNum for time slot T 8 . The triangles and squares represent convergent hotspots and dispersive hotspots, respectively, and the larger the hotspot is, the more intense is the convergence or dispersion.
Sustainability 08 00674 g006
Figure 7. Variation in the number of hotspots during the day (BreakNum = 9).
Sustainability 08 00674 g007
Figure 8. Human mobility hotspots in T 1 (a) and T 8 (b).
Sustainability 08 00674 g008
Figure 9. (a) Spatial distribution of different clusters; (b) temporal characteristics of each cluster.
Sustainability 08 00674 g009
Figure 10. Spatial distribution of hotspots in C 1 .
Sustainability 08 00674 g010
Figure 11. Spatial distribution of hotspots in C 2 and C 3 .
Sustainability 08 00674 g011
Figure 12. Spatial distribution of hotspots in C 4 .
Sustainability 08 00674 g012
Figure 13. Spatial distribution of hotspots in C 6 .
Sustainability 08 00674 g013
Table 1. Time series matrix of hotspots.
GridID1234567891011121314151617181920212223
2169000−1−1−2−m−m−101−1000122mm−1100
60540000012m − 110000000−2−m−m + 1−1−1−10
……
16254−1−100001210000000−1−1−1−1−100
Table 2. Number of human mobility hotspots for different values of BreakNum.
BreakNum579111315
Convergent hotspots123053597978
Dispersive hotspots274860657588

