
Economic Impacts of Power Shortage

1
Electric Power Research Institute of China Southern Power Grid, Guangzhou 510060, China
2
China Center for Energy Economics Research, School of Economics, Xiamen University, Xiamen 361005, China
3
Collaborative Innovation Center for Energy Economics and Energy Policy, Xiamen University, Xiamen 361005, China
*
Author to whom correspondence should be addressed.
Sustainability 2016, 8(7), 687; https://0-doi-org.brum.beds.ac.uk/10.3390/su8070687
Submission received: 13 March 2016
/
Revised: 11 July 2016
/
Accepted: 13 July 2016
/
Published: 21 July 2016
(This article belongs to the Special Issue Selected Papers from 6th Annual Conference of Energy Economics and Management)
Abstract
:The electricity industry is a basic industry of the national economy. It has experienced several large-scale power shortages, hard power shortage and soft power shortage, which have brought a great threat to China’s sustainable economic development. To solve this problem better, it is necessary to make a quantitative assessment of the economic impacts of power shortage. The CGE model is commonly used for simulating economic shocks and policy effects. It describes supply, demand and equilibrium in different markets by simulating the economic mechanism through a set of equations. Once changed, the exogenous variables will affect a certain part of the system and then the whole system, leading to changes in quantities and prices. The equilibrium state will also change from one to another. A static CGE model is built in this paper, and the Social Accounting Matrix (SAM) of eight sectors of China in 2007 is compiled, in order to simulate the economic impacts of hard power shortage and soft power shortage. Simulation results show that the negative effects of power shortage on economic development are very significant, and the effects vary in different sectors. Especially, under the background of hard power shortage, the industrial sector suffers most. The economic cost of power shortage is considerable, and the main reason for it is the specific administrative pricing system in China. The low electricity price in the long term will lead to insufficient construction and hard power shortage; moreover, that in the short run would result in soft power shortage. In order to solve the problem of power shortage completely, power system reform is inevitable.
1. Introduction
The electricity industry is a basic and significant industry of the national economy, which is closely related to economic development. On the one hand, electricity is a driving force of economic development. The shortage of power supply will seriously affect the healthy development of the economy and can cause large economic losses [1,2]. On the other hand, the level and speed of macroeconomic development play a decisive role in determining electricity demand [3]. The process of electric power construction normally, from planning to completion and commission, will take three or even five years. The fluctuation of the economic situation, as well as the delay of electric power investment will unavoidably lead to an unbalance between electricity supply and demand. Therefore, advance planning for electric power investment to match the economic demand becomes a vital issue in electric power development. In economics, shortage means that the effective demand of the product is greater than the actual supply. In an effective market, the equilibrium price will automatically smooth out the imbalance between demand and supply, and there should be no power shortage in an equilibrium status.
China has been experiencing massive electricity shortages and power surplus repeatedly. In spite of the rapid expansion of electricity infrastructure, electricity shortage remains as a very common problem in China [4]. In the 1950s, China’s power supply and demand were in balance overall. Since the 1960s, China has experienced a long-term power shortage. In 1996, the shortage even exceeded 20% of the total energy output. After the Asian financial crisis in 1997, China’s economy development slowed down; so did the growth rate of electricity demand, which reached the minimum in 1998. Then, the electricity supply changed from shortage to surplus. In 1999, China had surplus power of about 10%. Since 2000, power demand has bottomed out. With high-speed economic growth, power demand increased quickly, and the unbalance between power supply and demand appeared again. In 2002, 12 provinces in China suffered slight electricity shortages. What was worse, in 2003, 21 provinces experienced power shortages, and in 2004, the number of provinces reached 24. The electricity shortage nationwide reached 31 million kilowatts. In the first half of 2005, about 26 provinces faced power shortages. In 2006, the dilemma between power demand and supply eased, but in 2007, 16 provinces still underwent power shortages or power rationing. In 2011, China’s power shortage showed new characteristic, namely widespread power shortage in the case of sufficient capacity, where the growth of capacity supply exceeds the power demand. The reason for the electricity shortage before is insufficient capacity, resulting from an imbalance between electricity demand and electric power construction. However, in 2011, the new characteristic was large-scale power shortage coupled with sufficient electricity capacity, known as “soft electricity shortage”. The electricity shortages can be divided into two cases: hard electricity shortage and soft electricity shortage. Hard electricity shortage refers to insufficient capacity. The market demand for electricity cannot be met even with high utilization hours of power generating units. Soft electricity shortage is the result of low utilization hours of power generating units with sufficient capacity, since the existing installed capacity is underutilized [5,6].
The general reasons for hard electricity shortage and soft hard electricity shortage are different, but the profound reason for both lies in the monopoly of the power industry and its administrative pricing. The Chinese electricity industry has evolved since the early 1990s into a “dual system”, with dominant state planning at the core and a decentralized generation system, owned by private enterprises and government organizations at different levels [7]. In 2002, the electrical power industry in China had experienced a profound electricity reform. China has introduced limited competition in generation, though the rest of the electricity chain has been regulated heavily [8]. In China, the electricity price is controlled by the state, and the coal price has been de-regulated by the government. The generation plants are paid by the on-grid power price, calculated as the costs plus the product of the allowed rate of return and the audited asset of power plants, by transmission/distribution companies rather than end-users [9]. In China, the electricity price is relatively low compared to other countries, and it cannot effectively reflect the generating cost [10]. The reasons for hard power shortage are mainly as follows. The first reason is the fast growth of electricity demand as the Chinese economy grew quickly in these years. Moreover, insufficient capacity is the major cause. In light of the special electricity system in China, the benefits of power generation plants are decided by administrative measures instead of the market. The market mechanism is distorted in the Chinese power industry. The long-term low electricity price and the single property rights hinder the free flow of capital, which cause insufficient construction and hard power shortage. As for soft power shortage, the conflict between market coal price and planned electricity price plays an important role. In China, coal is taken as the primary energy. The generation of coal-fired units accounts for about 70% of the total generation, and the installed capacity of coal-fired power plants accounts for approximately 75% of the total installed capacity in China, meaning that the power generating market is affected significantly by coal price and output [6]. Since the price of coal rises much more than the magnitude of electricity price adjustments, the more electricity power plants generate, the more the losses. Even with sufficient capacity, the power plants are unwilling to produce more electricity due to the high generation costs and low electricity price, which causes the widespread soft power shortages. To sum up, the underlying cause for power shortage is low electricity price, while the difference lies in that hard power shortage is caused by low price in the long term, and soft power shortage comes from that in the short run. The power shortage reflects discordance between China’s electricity industry and overall economic development, which is not conducive to the healthy development of the electricity industry and the national economy.
Studies on the economic impact of power shortage are of practical significance. On the one hand, analysis of the relationship between economic output and power demand is conductive to making decisions on electric power construction and investment. From another perspective, the study of the economic cost of electricity shortage provides a reference for current power policies and future electricity system reform. However, there is little research on this, in particular the application of the CGE model to calculate the economic impact of power shortage, so this is the objective of our research.
2. Literature Review
Power shortage, an important problem in China, has attracted much attention. Lin [11] studied the impacts of power shortages, the short-run responses and long-term strategies of the government to solve this problem. He proposed that it was necessary to build an early warning system and to make a national systematization plan. Zhang et al. [5] analyzed the mechanism of power shortages in China with the annual data of thirty provinces from the years 2006 to 2010. They found that the capacity shortage and capacity under-utilization are the main causes for power shortages in China and that capacity shortage can be solved by a “free-investment” policy, and capacity under-utilization can only be solved by a “coal-price-inflation-internalizing” policy. Ming et al. [6] studied China’s large-scale power shortages of 2004 and 2011 and their differences. Cheng [12] analyzed the impacts of the electricity power shortage on China’s GDP based on an econometric analysis with the data from 1953 to 2010. They found that the growth of electricity generation would encourage GDP growth, but not vice versa. Ma et al. [13], Fisher [14], Thomson [15], Yuan [16], and so on, have also investigated recent nationwide shortages. However, the problem of power shortages in China is mostly cyclical, and the relationship between electric power and economic development is complex [17]. Many sectors would be affected, and the degree of influence varies. From one aspect, any change in the economic system will directly or indirectly affect the power industry; what is more, any change in the electricity industry itself will firstly influence a certain sector and then affect other sectors, even the whole economic system [18]. Few of the previous studies have measured the economic impacts of power shortage quantitatively and comprehensively. In order to analyze the relationship between electricity and economic development, it is necessary to establish a mathematic model that contains all of the sectors in the economic system and that can reflect the connection among these sectors. Based on the general equilibrium theory, the computable general equilibrium (CGE) model, which can effectively reflect linkages among different sectors in the economic system, presents the particular impact of a certain change on each sector and the whole system. Obviously, the CGE model can address those two problems, to a certain extent, and can also satisfy the need for research on the relationship between electricity and economic development.
Since Johansen [19] built the first CGE model in 1960, it has gradually become an important tool for economic policy simulation. The CGE model can be understood as an input-output model in which the price feedback mechanism is introduced. The CGE model is generally used for international trade, tax policy, environmental protection, economic reform and economic development policy [20,21,22]. The electricity sector is an important sector in the macro-economy, and many researchers have studied this problem based on the CGE model. The application of the CGE model to the electric power sector can be summarized from the following aspects.
For the previous studies, some researchers focus on the relationship between electricity supply and economics based on the CGE model [23,24,25,26,27], and many scholars, such as [28,29,30,31,32], assessed the impacts from the electricity demand side. Moreover, the impact of the increase of electricity price is of great significance, and many studies have focused on this problem in China and abroad [33,34,35,36,37]. In addition, the core of energy reform is to straighten out energy prices and form a proper and transparent pricing mechanism. Energy prices in China are controlled by government pricing and cross subsidies, which will result in the low efficiency of energy consumption in the long run. China, with India and Russia, has followed the patterns of reducing energy subsidies, which are characterized by two steps forward, one step back [38]; thus, further energy subsidy reform is needed. Existing research [39,40] mostly focuses on the impacts of energy subsidies on residential living, energy consumption and carbon dioxide emissions and less on the effects of eliminating the subsidy on industrial development and industrial structure. The partial equilibrium analysis and input-output models are commonly used. Hosoe [41], Akkemi [42], Li et al. [43] and Chi et al. [44] applied a CGE model to analyze the impacts of power market reform and policies.
To sum up, using the CGE model, these researchers study the impacts of the electric power sector from many aspects, and CGE is a good method to simulate policies or the shocks of exogenous events. However, much attention is focused on electricity demand or supply, price and market reform; few of them have ever analyzed the influences of power shortages on economics with the CGE model. In China, despite the rapid expansion of electricity infrastructure, electricity shortages remain common. The problem of power shortages in China is mostly cyclical, and undoubtedly, electricity shortages would hamper China’s healthy development. The CGE models not only involve the relationship and diffraction effects among various sectors, which the partial equilibrium analysis cannot achieve, but also overcome the defect of fixed input coefficients in the input-output model, so it is effective in structural analysis to simulate power shortages and to calculate the equilibrium after disturbance and quantify the impacts of shocks on the economic system. Thus, in this paper, we apply the CGE model to analyze the economic impacts of power shortages.
3. Model Construction
In the CGE model, the general equilibrium theory is transformed from an abstract form into a realistic and computable one. Actually, it uses a set of equations to describe supply, demand and equilibrium in the economic system. In these equations, there are both exogenous variables (economic shocks) and endogenous variables (quantities and prices). The impacts of exogenous shocks on any sector will spread to the whole system, leading to the changes in quantities and prices. The equilibrium state changes from one to another. When external conditions (exogenous variables) change, new equilibrium quantities and prices can be obtained by solving the CGE model. We build our model based on [45]; thus, the static CGE model used in this paper consists of five parts, namely production, income, demand, price and international trade, which will be described in detail below.
3.1. The Production Part
The production function is the core in this part, and the main economic agents are producers. The CGE model assumes that each production sector consists of many similar companies, and enterprises from different sectors produce different products [46], so each sector is in complete competition. Generally, labor and capital are the main input factors in the production function. In reality, as energy becomes increasingly scarce and important, we put electricity, coal and petroleum into a nested constant elasticity of substitution (CES) production function in this paper.
A standard CES function is as follows:
where x1 and x2 represent two different inputs; A represents factors affecting output, except input factors, such as technological progress, which is known as the “factor of the total-factor of production” or the “technological progress parameter”. δ1, and δ2 indicate the shares of two inputs, and δ1 + δ2 = 1. ρ is used to define the elasticity of substitution between two inputs. However, it is not the substitution elasticity, and its relationship with elasticity of substitution σ is as follows:
When the CES function includes two or more inputs, the inputs will be nested into the function. For example, if there are three input factors, capital K, labor L and land E, K and L are firstly organized as a composite input XKL in the form of the CES function; then XKL and E are put into the final output function.
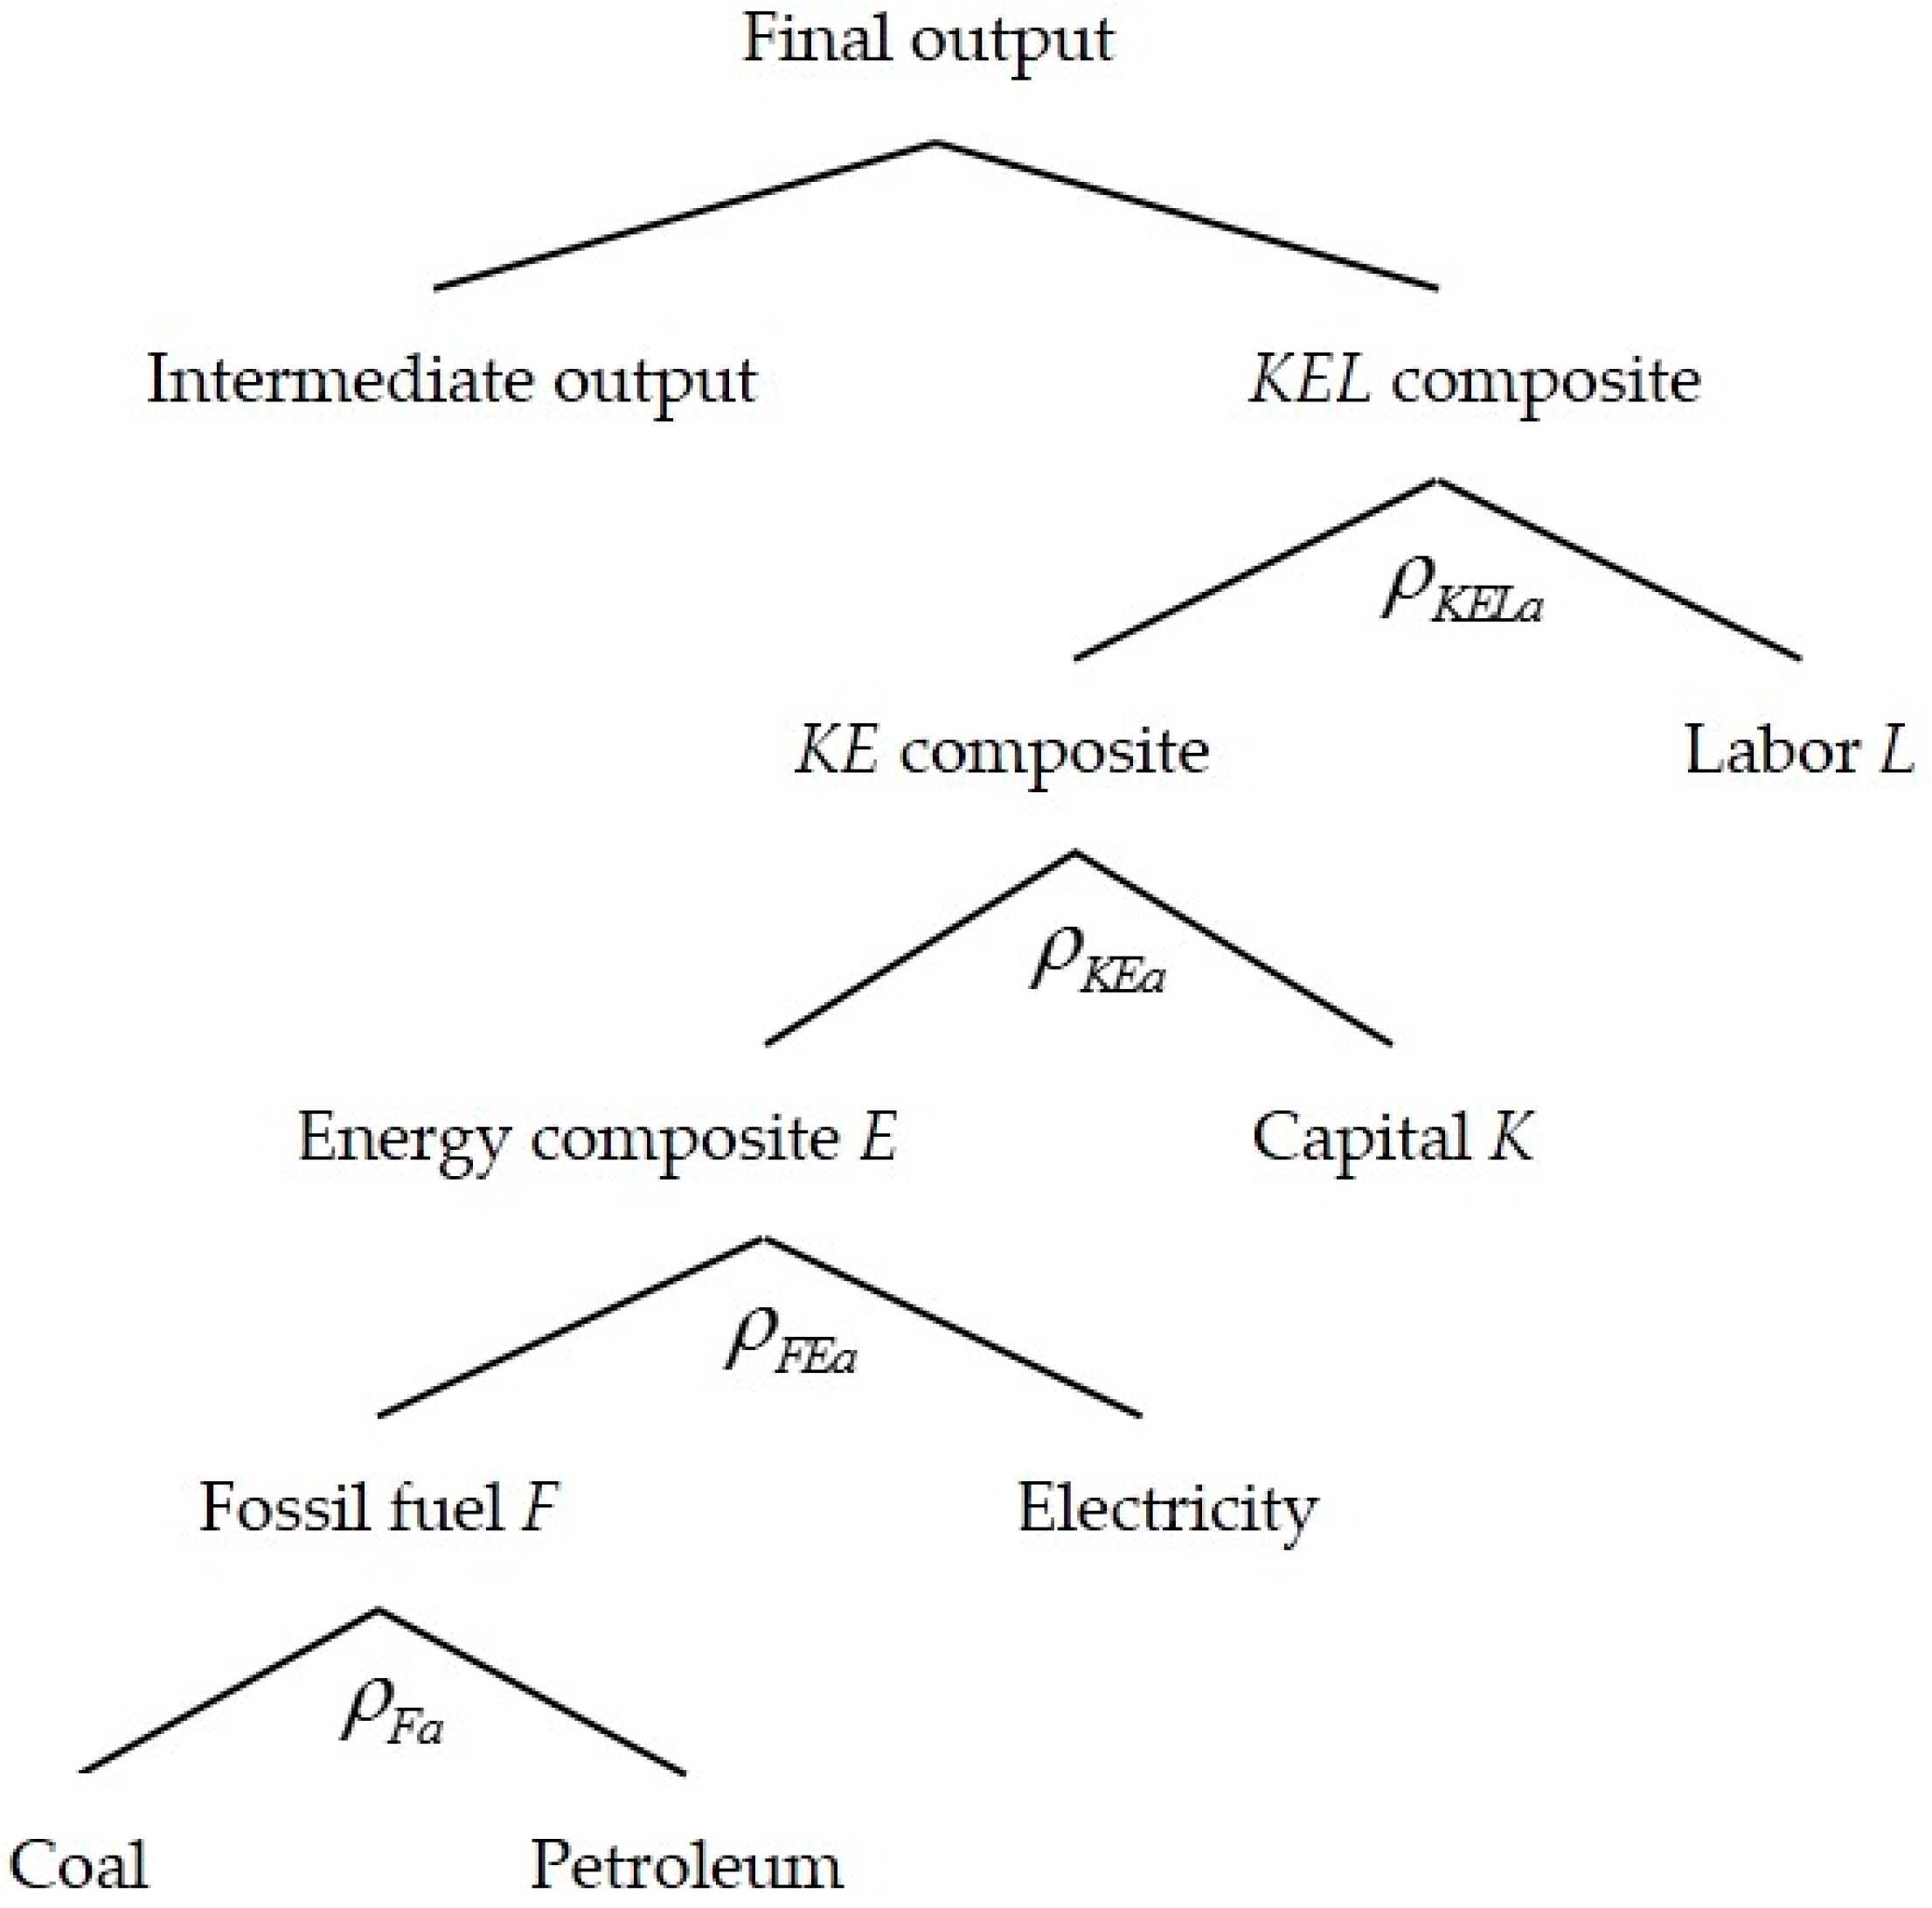
The production function in the paper includes capital, labor, energy and other intermediate inputs, so we adopt a nested CES production function as follows and the specific nesting of the production function is shown in Figure 1.
In order to explore the role of energy, particularly electricity in the economic system, we used the nested function mentioned above. The detailed analysis can be found in the relevant literature [45]. The elasticity in each nested layer will be discussed and determined in the following section in detail. Each nested function is shown as follows. The Leontief production function [47,48] is used in the first layer:
The proportions of input and output are:
When the production tax accounting for a fixed proportion of total output is added into the production function, then:
The second layer is a composite function of capital, energy composite and labor, shown as follows:
The first-order condition for cost minimization is:
The price of the composite product is:
The second layer is the composite function of intermediate inputs, except energy, which also has the form of the Leontief production function.
Additionally, its price is:
The third layer is a composite function of capital and energy (KE):
Its first-order condition for cost minimization is:
Its price is:
The fourth layer is a composite function of fossil fuel composite and electricity (FE). The fossil fuel composite consists of coal and petroleum, shown as follows:
Its first order condition for cost minimization is:
Its price is:
The fifth layer is the composite function of coal and petroleum (F):
Its first order condition for cost minimization is:
Its price is:
3.2. The Product Market Part
Taking input and output into consideration, products produced by different sectors are not necessarily the total supply in the domestic market. First of all, most domestic products would be sold in the domestic markets (selling), and some are exported. Secondly, some goods sold in the domestic market would be imported from overseas.
Notably, a small country assumption is adopted with regard to import and export for simplicity. That is, import and export prices are set exogenously, and domestic economic subjects are price takers.
Specific settings are shown as follows:
3.2.1. Flow of Domestic Product
Ultimate outputs (QA) of domestic production are sold in the domestic market (QDA) and exported (QE), and the substitution between them satisfies the CET conversion function:
Similar to the CES production function, the parameter is also determined exogenously. The price of product sold in the domestic market is PDA, and the price of exported product is PE. The first-order condition for optimization is:
The relationship between those two prices is:
PDA is determined by the domestic market, but PE is exogenous:
where pwe is duty-paid free on board (FOB) calculated in a foreign currency (e.g., U.S. dollars). tε is the export tax rate. EXR is the exchange rate quoted as the domestic currency per unit of foreign currency. In other words, pwe is FOB including export tax, but it is not what the producer can finally obtain. It minus a certain tax is the export price that the producer can get.
3.2.2. Conversion from Domestic Product (QDA) to Domestic Commodity (QDC)
In this model, based on the social accounting matrix (SAM) table [49], it is assumed that one production department produces only one product; there is a one-to-one correspondence between products and goods. For better construction of the CGE model, we also need to convert product to commodity in various sectors. As mentioned above, a indicates sector, and c indicates commodity. For example, product produced and sold in the domestic market is represented by QDAa, and the corresponding commodity is QDCc. To convert QDAa into corresponding QDCc, the CGE model should be processed as follows.
I is an n-dimensional identity matrix; QDA is an n-dimensional column vector of the product; QDC is an n-dimensional column vector of the commodity. PDA and PDC are the prices of the corresponding column vectors, and they satisfy the following relationship:
For ease of programming, the above equations can be re-written as follows:
3.2.3. Sources of Domestic Supply
Let be the amount of commodity consumed in the domestic market, and the corresponding price is . is the demand for various domestic economic subjects (consumers, companies, government), including consumption, intermediate inputs and investment.
On the other hand, the supply of comes from the domestic market () and import (). Substitution between them is described by the Armington condition:
The first-order condition for optimization is:
The relationship for price is:
PDCc is determined by the above-mentioned conversion relationship, while PMc is set exogenously:
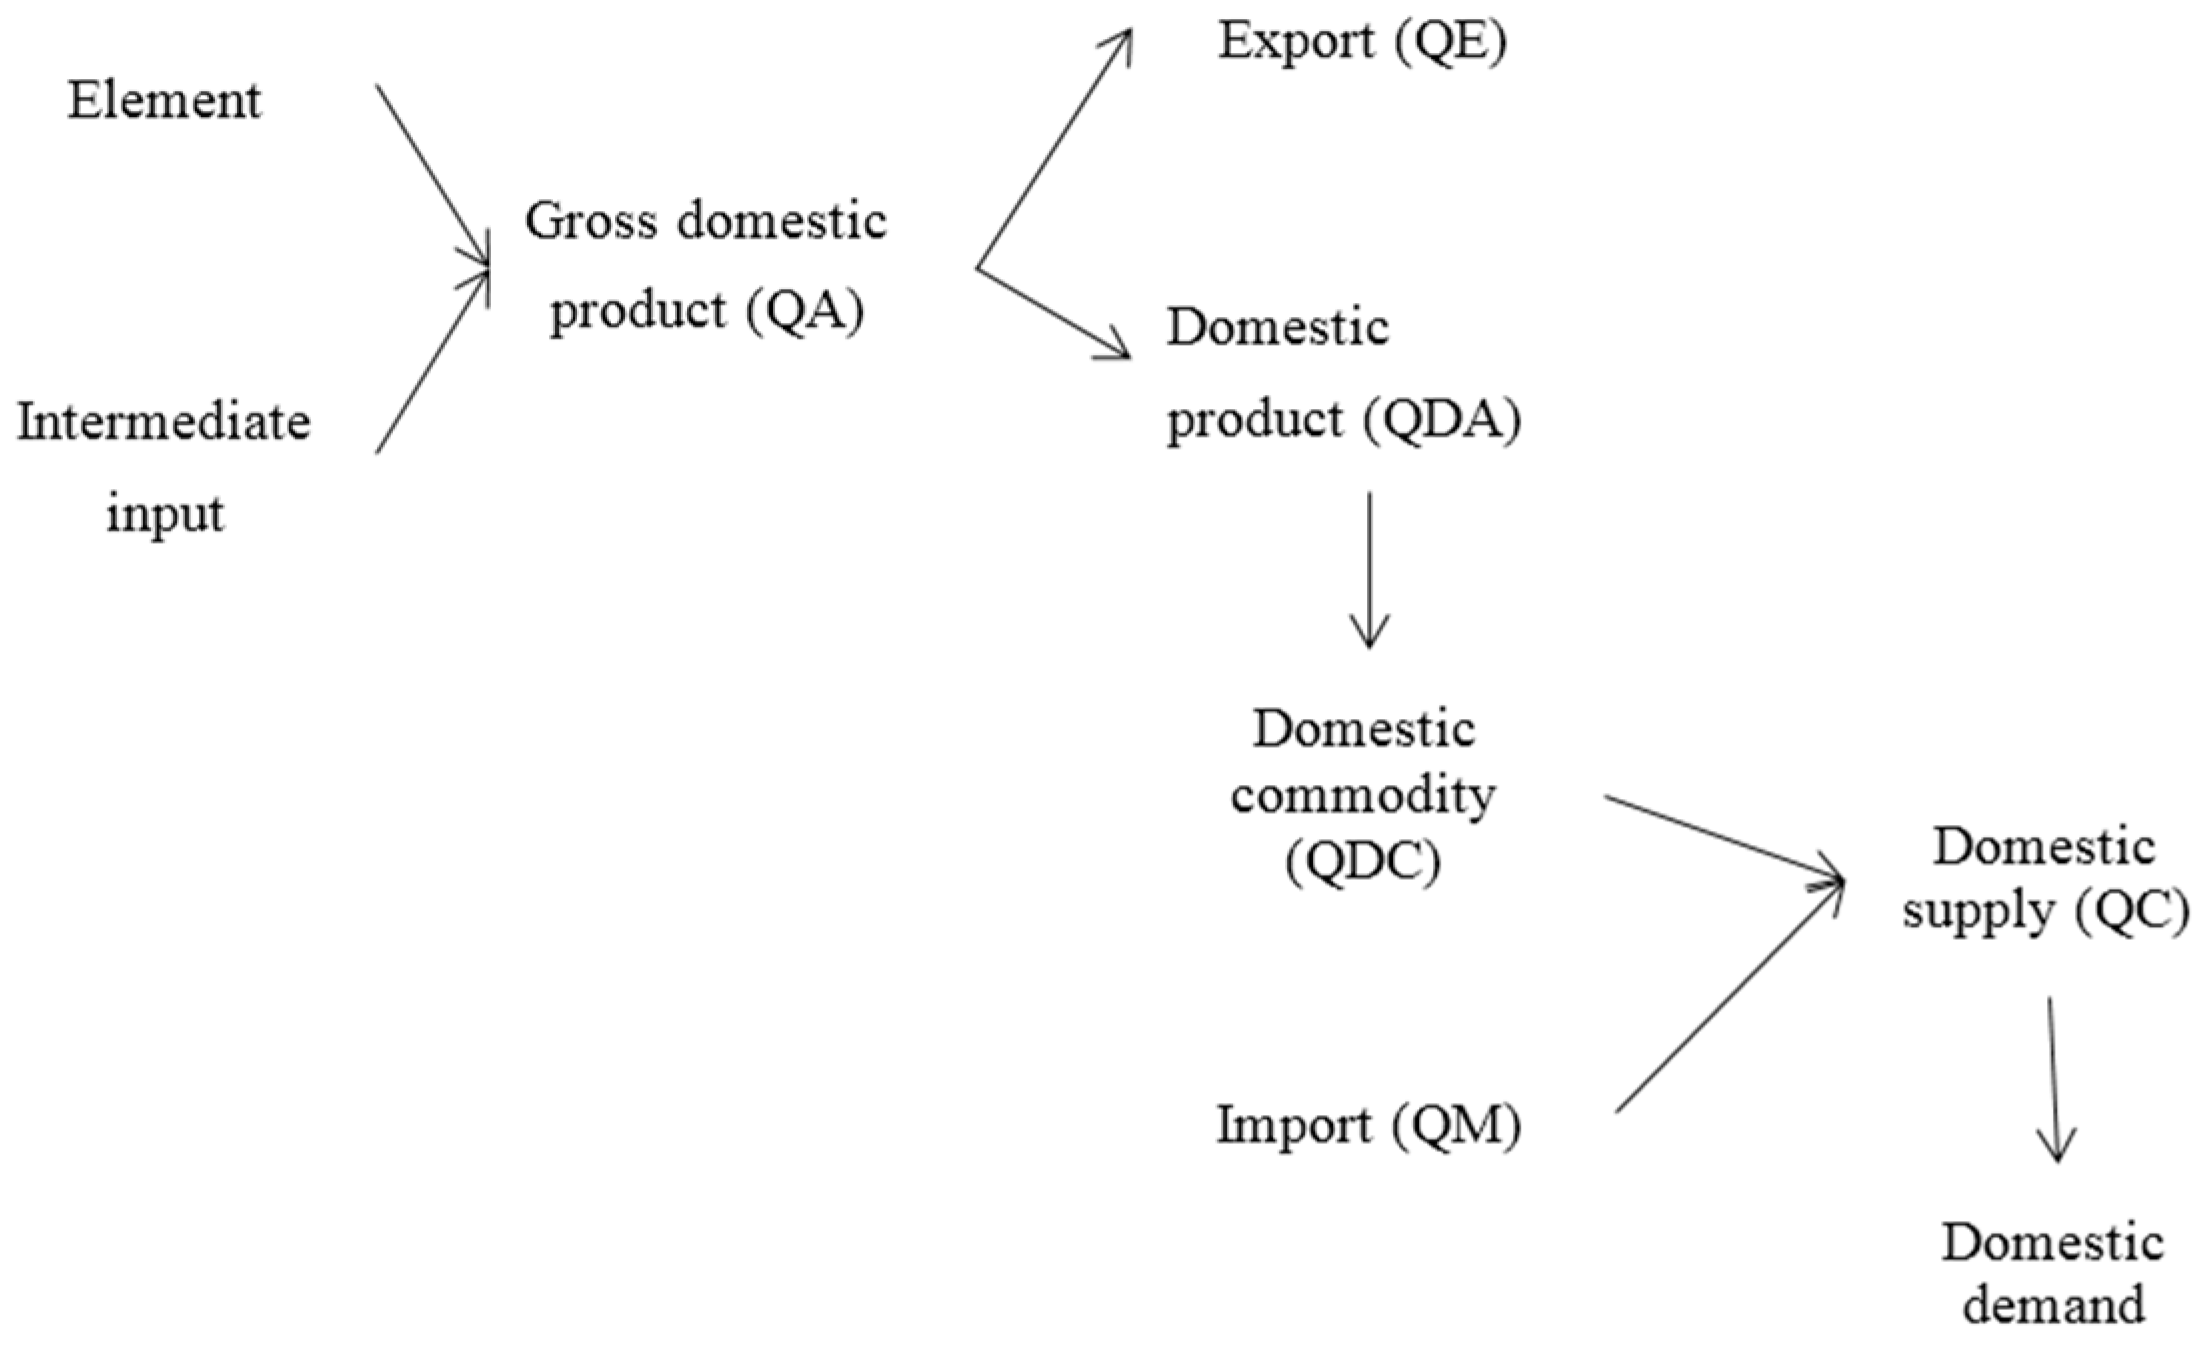
Similar to the previous export price, tm is the import tax rate, and pwm is the CIF (cost, insurance and freight) of the commodity calculated in a foreign currency without import tax. The result of pwm plus the import tax is the price of imported commodity that consumers pay. The Figure 2 shows the flow of production and the supply of goods.
3.3. The Economic Subject Part
3.3.1. Resident Account
Residential income includes labor income, capital income, enterprise transfer payment, government transfer payment and transfer payments overseas. According to the model, all labor is from the residents, and they get all of the labor payment. Capital income is distributed among enterprises, residents and the government. For simplicity, it is supposed that the shares three subjects are fixed. The share of capital income residents is shifhk. Transfer payments from the government and overseas are set exogenously, and transfer payments from enterprises are a fixed proportion of enterprise revenue. Residential income is as follows:
where , and are set to be fixed and calibrated by SAM.
Let be the proportion of transfer payment (fixed value, calibrated by SAM), and then, the transfer payment from enterprises to residents is shown below, given that YENT is enterprise revenue:
Residential expenditure is primarily for individual income tax and consumption. Set tih to be the rate of individual income tax, and then, the disposable income of residents is . If the marginal propensity to consume is mpch, then the income used for consumption is . tih and mpch are calibrated by the SAM table.
Suppose the utility function for residents is a Cobb-Douglas function, and then, residents’ demand for commodity c is:
Residents’ savings (HSAV) is:
3.3.2. Enterprise Account
Enterprise income only comes from capital gains. Set shifentk to be the share of capital gains, which is calibrated by the SAM table, so enterprise income is as follows:
Business spending includes corporate income tax (tax rate is tient) and business transfer payments to residents (transfrhent). Business savings are as below:
3.3.3. Government Account
Government income includes: production tax, customs duty, import VAT (import tax), capital gains, individual income tax, corporate income tax, income yield, transfer payment from overseas, and so on. Let the government income be YGOV, the production tax rate be , the import tax rate be , the individual income tax rate be , the corporate income tax rate be , the share of the government’s capital gains be , the transfer payment from overseas to the government be transfrgovrow and the bond yield be . These parameters are calibrated by the SAM table.
Government expenditure includes consumption and transfer payments to residents and foreigners. Let the government expenditure be EGOV, the consumption for commodity c be QGc, the transfer payment to residents be and the transfer payment to foreigners be , then:
where government transfer payments to residents and foreigners are exogenous variables calibrated by the SAM table. Therefore, the point is how to determine government consumption QGc. For simplicity, some scholars set QGc as exogenous. Generally, the government, as a regulatory agency, is independent of the economic system relatively and usually taken as exogenous. Without considering the evolution of the economic system, the set of fixed government consumptions is feasible in the static CGE model. A more complex approach is to set a utility function for the government and to derive its consumption demand. If the utility function is set, we also need the government’s spending budget in order to determine the government consumption of different goods. In other words, in the government consumption part, there must be an exogenous variable (similar to residents’ savings rate). In this article, the utility function is assumed as the Leontief function, where the ratio of the government demand for various goods is maintained as fixed. The government spending budget is set to be a fixed proportion of government income and determined by the SAM table.
Government savings (GSAV) is:
3.3.4. Foreign Account
The foreign account mainly involves the exchange rate and trade surplus. For China, the exchange rate (EXR) is set to be exogenous and fixed, so the balance of payment (foreign savings) FSAV is an endogenous variable, shown as follows:
3.4. Closed System Part
3.4.1. Commodity Market Clearing
As previously mentioned, the supply of domestic commodity c is QCc, and the demand for commodity c includes intermediate inputs, resident consumption, government consumption and investment QINVc.
In equilibrium:
3.4.2. Elements Market Clearing
Aggregate demand for capital and labor equals the aggregate supply of capital and labor in equilibrium:
3.4.3. Investment-Savings Balance
Total savings come from resident savings (HSAV), corporate savings (ENTSAV), government savings (GSAV) and foreign savings (FSAV). Some of the savings are for investment (including desired investment and inventory investment), and the others are lent to the government (government debt income). The equations are as follows:
where debt income (idt) is fixed and calibrated by the SAM table (see the “government account”). Investment on commodity c (QINVc) is a fixed proportion of total investment, which is determined by the SAM table.
3.4.4. Macro-Closure
Macro-closure mainly refers to the aggregate supply of capital and labor. Whether the aggregate supply of capital and labor is variable has been the focus of debate among major economic scholars, so it must be considered carefully. Generally, there are four kinds of macro-closures: neo-classicism closure, Keynes closure, Lewis closure and Koldorian closure. In China, urban and rural development are in disharmony, and there is a large amount of surplus labor in the countryside. The price for labor would be inelastic for a long time. Thus, Lewis closure is used in the model here [50], where labor supply is sufficient; wage is fixed; capital supply is fixed; and capital price is an endogenous variable.
4. Data
Data in this paper are based on the SAM table of the input-output of 42 sectors in 2007. The social accounting matrix (SAM) has a close relationship with the national economy accounting. It contains detailed information of various transaction and socio-economic flows, and it is an important form to illustrate the relationship among different parts of the socio-economic system.
Referring to the sector classification of the input-output table and based on reality, we divide the 42 sectors of the input-output table into agriculture, light industry, heavy industry, construction industry, service industry, coal mining and selection industry, petroleum and gas extracting industry, electricity and heat production and supply industry, for simplicity. In order to analyze the correlation between the electricity industry and the entire economy, it is necessary to pull apart the three energy industries: electricity, coal and petroleum. The light industry produces consumer goods and makes hand tools, while the heavy industry provides material and the technical basis and other kinds of production. The classification of light and heavy industries refers to China Energy Statistical Yearbook [51]. The sources in detail are shown in Table 1.
As the SAM data come from different sources, their statistic scope and accuracy are also different. It is difficult to match them with each other, so the SAM based on this cannot guarantee that the sum of all rows is equal to that of all columns. When completing the SAM table, although we have taken some less important data as balance items if necessary, the SAM table still cannot be balanced. The SAM table still needs to be further processed. Balancing the SAM table is a mathematical operation. Due to the contradiction or defect of external information, mathematical methods are used to artificially adjust the data of the SAM table, in order to make the SAM table eventually balanced. The basic principle of balancing SAM is making the overall difference between the original SAM and adjusted SAM minimum. How to measure and control the overall difference is the focus of different methods. Currently, the methods most commonly used are the RAS [52] and cross-entropy (CE) method, and in this paper, the CE method is applied. The basic idea of cross-entropy is embedding the added information into SAM, thus making the difference between adjusted SAM and original SAM minimum. The difference could be measured by “cross-entropy distance”, which is proposed by Kullback–Leibler ([53,54]).
Parameters in this CGE model are divided into two kinds: one needs to be calibrated by SAM, such as the coefficients of shares of the element inputs in the production function and the initial values of all variables; the other ones are set by certain econometric methods or experience, such as the elasticity of the production function and the conversion elasticity of import and export.
5. Simulation Results
China’s electricity shortage can be divided into hard electricity shortage and soft electricity shortage. Hard electricity shortage refers to insufficient capacity caused by insufficient investment and construction of electric power. Soft electricity shortage is the result of the unwillingness of power enterprises to generate electricity even with full capacity, and the cause of it is the conflict between coal market and planned electricity. Although both hard electricity shortage and soft electricity shortage are power shortages, their causes, time span and economic impacts are different. The CGE model is used to simulate the economic impacts of these two kinds of power shortages.
5.1. Model Setting for “Hard Electricity Shortage”
In reality, “shortage” refers to the fact that the demand for a certain commodity is not met, which can be addressed only by queuing and quotation. From the view of economics, the so-called shortage means that at a certain price, effective demand of a certain commodity is greater than the actual supply. In an efficient market system, long-term shortage would not exist. Even if short-term shortage occurs, the market can quickly adjust the supply and demand to make them balanced through the price mechanism. Electricity shortage for months or even years in China is very common, which has something to do with the special situation of China’s electric power industry. On the one hand, electricity construction itself takes a long time, so it is difficult to keep up with the pace of economic growth. On the other hand, the monopoly of China’s electricity market and administrative pricing make the price mechanism fail.
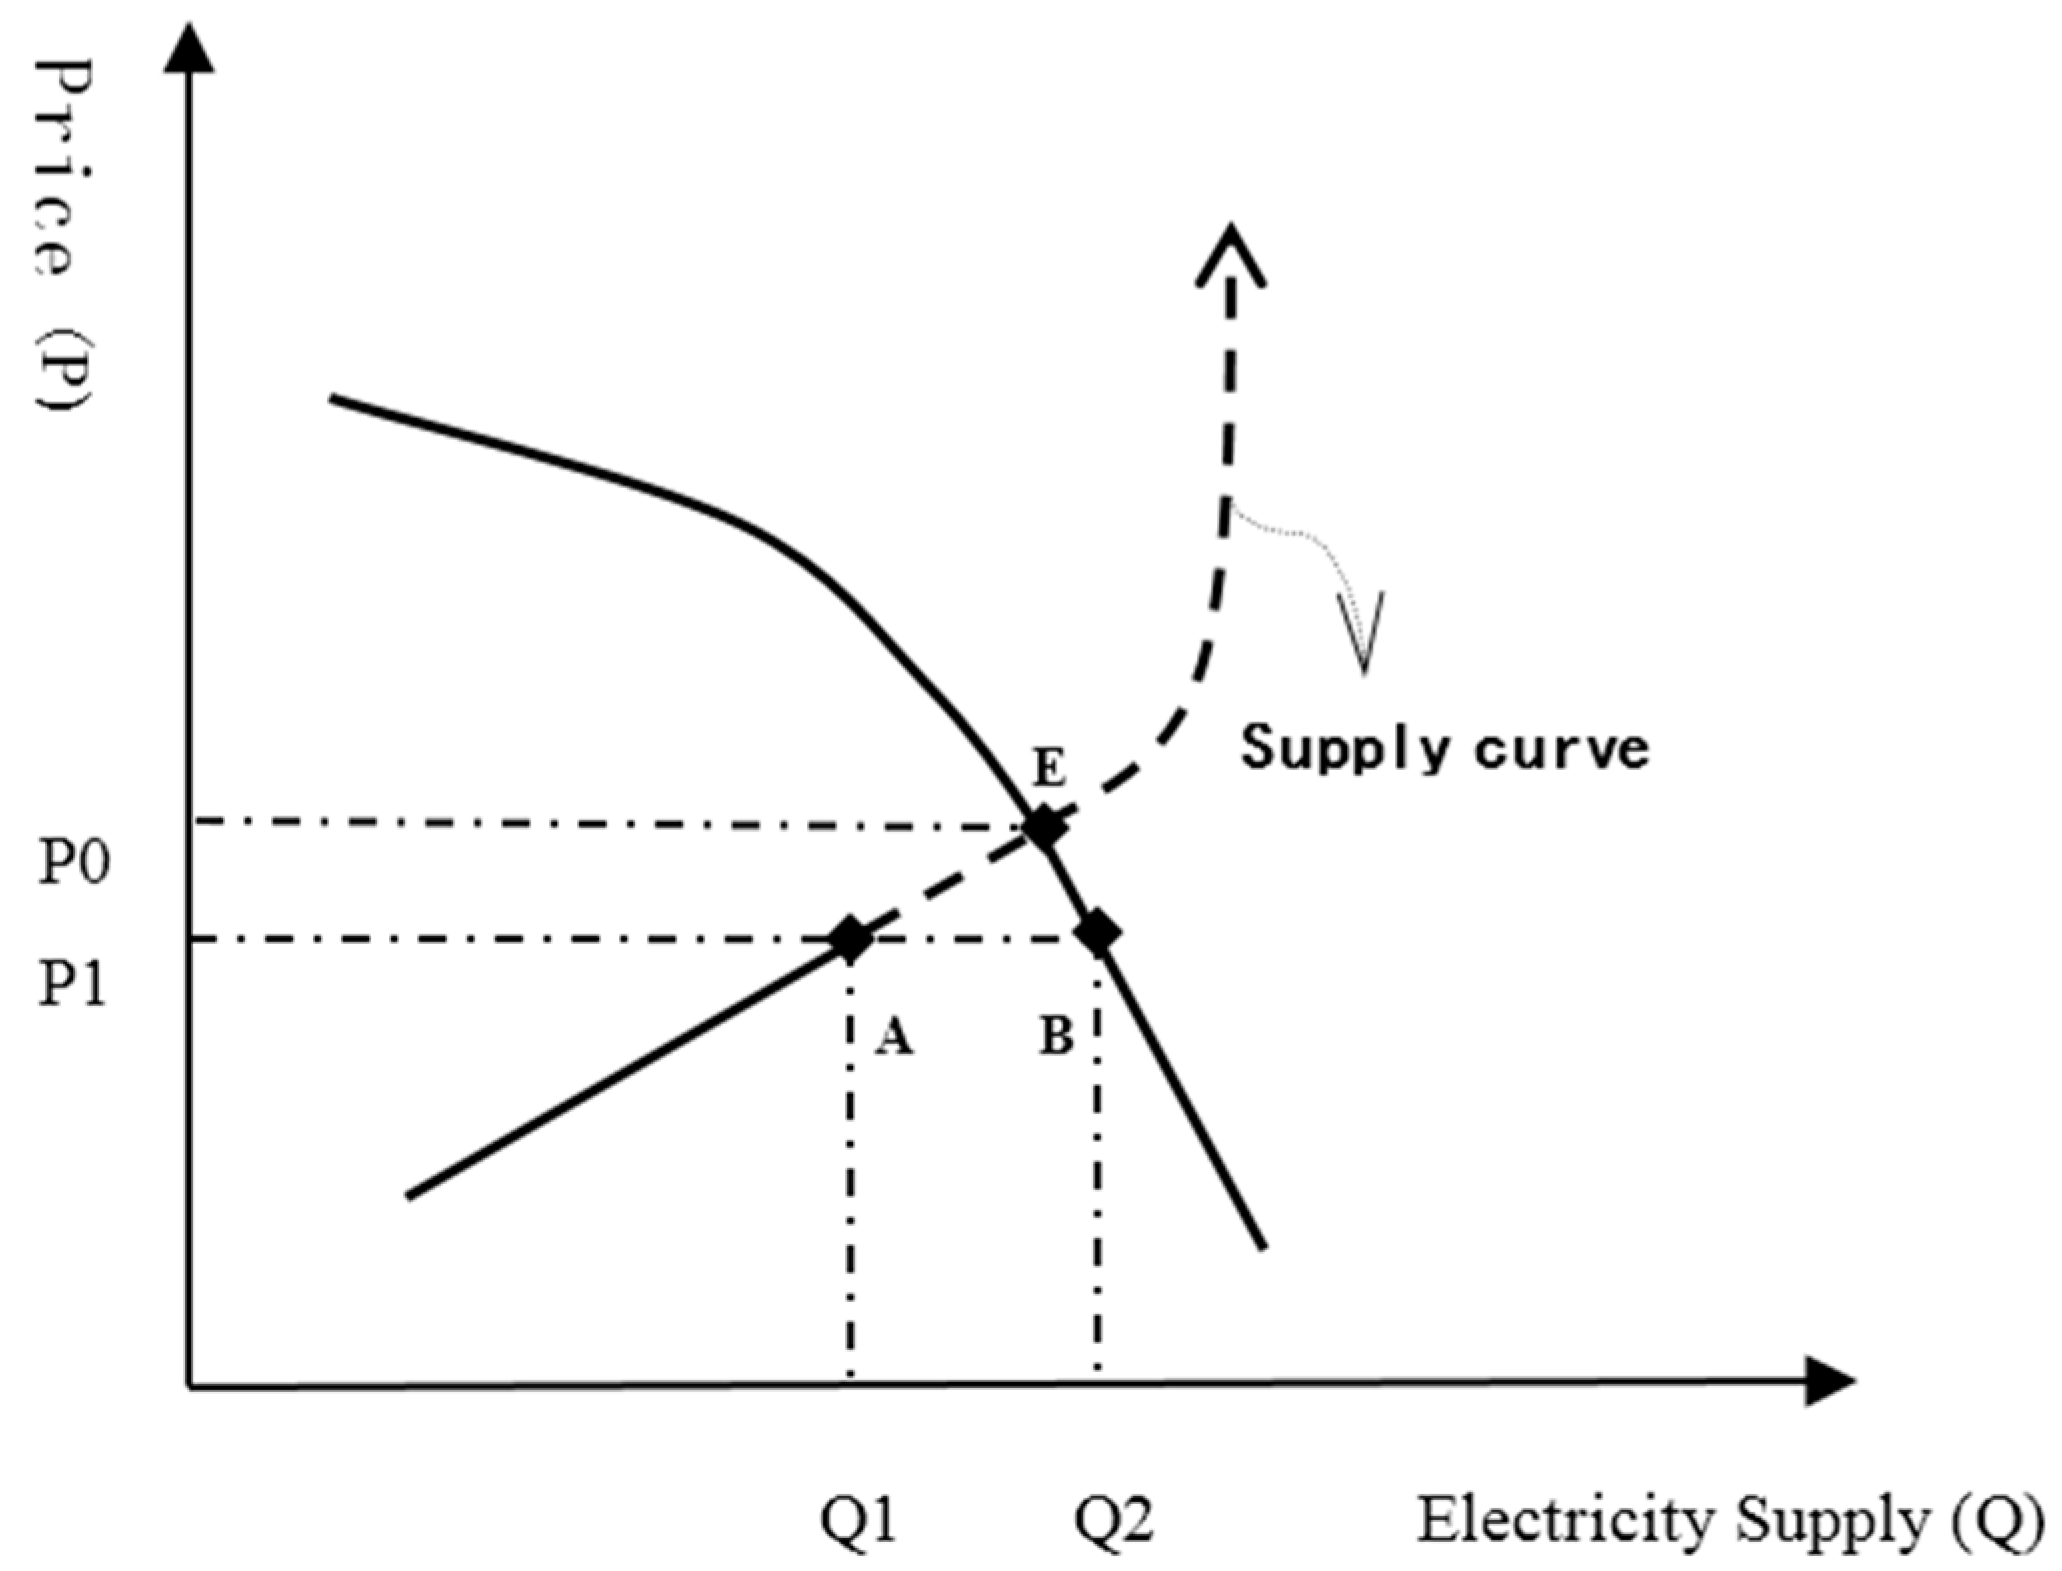
Under the condition of hard electricity shortage, the capacity of the electric power industry has already reached the saturation point, where generation hours are very long and power output almost reaches installed capacity. We believe that the power industry’s output is at a rigid level, and the electricity supply curve is a vertical line. The supply and demand of electricity is shown in Figure 3.
As shown in the figure, the electricity prices is set to be P1 administratively; the corresponding equilibrium point should be at B; and the corresponding supply is Q2 in equilibrium. When hard electricity shortage occurs, the construction of electricity is not enough, and the actual supply curve shifts left. At that time, power output has already reached saturation, and the power supply curve is a vertical line. In shortage, under the market condition, the electricity market should achieve equilibrium at Point E with the equilibrium price of P0. However, the electricity price is fixed at P1 by the government, lower than the equilibrium price P0, so a power shortage exists. The actual power supply is Q1, so the amount of electricity shortage is Q2 − Q1.
It is assumed that power supply is in equilibrium (Point B above) in the reference state. When simulating the effects of hard electricity shortage, the power supply curve is moved left by a certain proportion (indicated by (Q2 − Q1)/Q1). Besides, the inputs and outputs of the power industry are fixed. What is more, it is supposed that there is a gap between effective demand and actual demand. The simulation results are shown below.
The impacts of electricity shortage vary with sectors, and the importance of different sectors in the national economy differs. The impacts of hard electricity shortage on different sectors may not be the same. Limited to the availability of data, it is assumed that electricity shortage accounts for a certain proportion of effective power demand for simplicity. Based on the proportion of electricity consumption of different sector in the base year, we set the amount of electricity shortage of different sectors. We set up four cases for the proportion of power shortage: 3%, 7%, 11% and 15% (that is, the electricity supply curve shifts from Q2 to Q1). After simulation in the CGE model, power shortages of different production sectors (except the electricity production sector) are shown in the Table 2.
As can be seen from the above table, when the total power shortage is set to be 3%, 7%, 11% and 15%, respectively, the proportions of electricity shortage in various industries are different, but the differences are not very large on the whole.
5.1.1. Macro Impacts
As a basic industry of the national economy, the electricity industry plays an irreplaceable role to support economic development. The impacts of power shortage on GDP should be put in the first place in order to know the power shortage better. Under hard electricity shortage, the impacts of different levels of power shortage on GDP are shown in the Table 3.
As shown in the previous table, the negative impacts of power shortage on GDP are very significant. GDP loss accelerates as the proportion of power shortage increases. When the proportion is 15%, GDP decreases by 6.39%. The effects of electricity shortage on GDP are the result of the output reduction of the electricity sector itself; moreover, the output of other sectors also falls to different extents with limited electricity. Lin and Liu [55] point out that, in the stage of the industrialization and urbanization process, there is a relatively stable 1:1 relationship between the growth rates of Chinese GDP and energy consumption in the long term, which does not conflict with the results in this paper. On the one hand, we focus much on the stock relationship between GDP and power demands, not the flow relationship. On the other hand, the CGE model offers equilibrium results, where industries would move from high power-consuming sectors to low power-consuming ones in the case of a power shortage, easing rigid demand for electricity to some extent.
Changes in consumer welfare are also presented in the above table. Consumer welfare is measured by Hicksian equivalent variation, and its expression is:
where EV indicates the Hicksian equivalent variation of consumer welfare; PAb is the price before changes. XACb and XACs are the amount of consumption before and after changes. Consumer welfare decreases with an accelerating rate with more power shortages, but much smaller compared to GDP. Consumer spending habits would be changed by hard power shortage.
In addition, a power shortage causes prices to rise. The output of various sectors would be reduced due to the lack of electricity, and the supply reduces more than demand does.
5.1.2. Impacts on the Output of Various Sectors
The impacts of hard electricity shortage on the output of various sectors are shown in Table 4. As can be seen, the impacts of hard electricity power on various sectors are different. The heavy industry and the light industry the most affected, whose output reduction increases as power shortage increases. When the power shortage proportion is 15%, the output of heavy industry and light industry decreases by 11.39% and 10.12%, respectively. The primary industry, the construction industry and the service industry are less affected, but the coal mining and selection industry are also heavily affected. In contrast to other sectors, the output of the petroleum and gas extracting industry increases slightly.
The results mentioned above illustrate several economic effects of hard electricity shortage.
- (1)
- As a basic input of the national economy, power shortage makes the output of almost every sector decline.
- (2)
- The reduction in output varies greatly among different sectors. The heavy industry and the light industry are the most affected, while other sectors are less affected, indicating that under the background of a long-term power shortage, industries transfer to low power-consuming sectors.
- (3)
- As energy inputs, a contrary trend is observed for coal output and oil output. This is because coal is taken as the primary energy in China, so electricity shortage leads to a reduction in coal output rigidly. Coal can substitute for electricity to some extent, but at this point, the complementation effect is clearly greater than the substitution effect. As for the power supply, only a small part of the electricity supply is from petroleum and gas, so the oil department of electricity mainly reflects the substitution effect. For the power shortage in 2011 in China, when many small and medium-sized enterprises used their own diesel engines for power generation, the oil output did not fall, but rose.
5.2. Model Setting for Soft Electricity Shortage
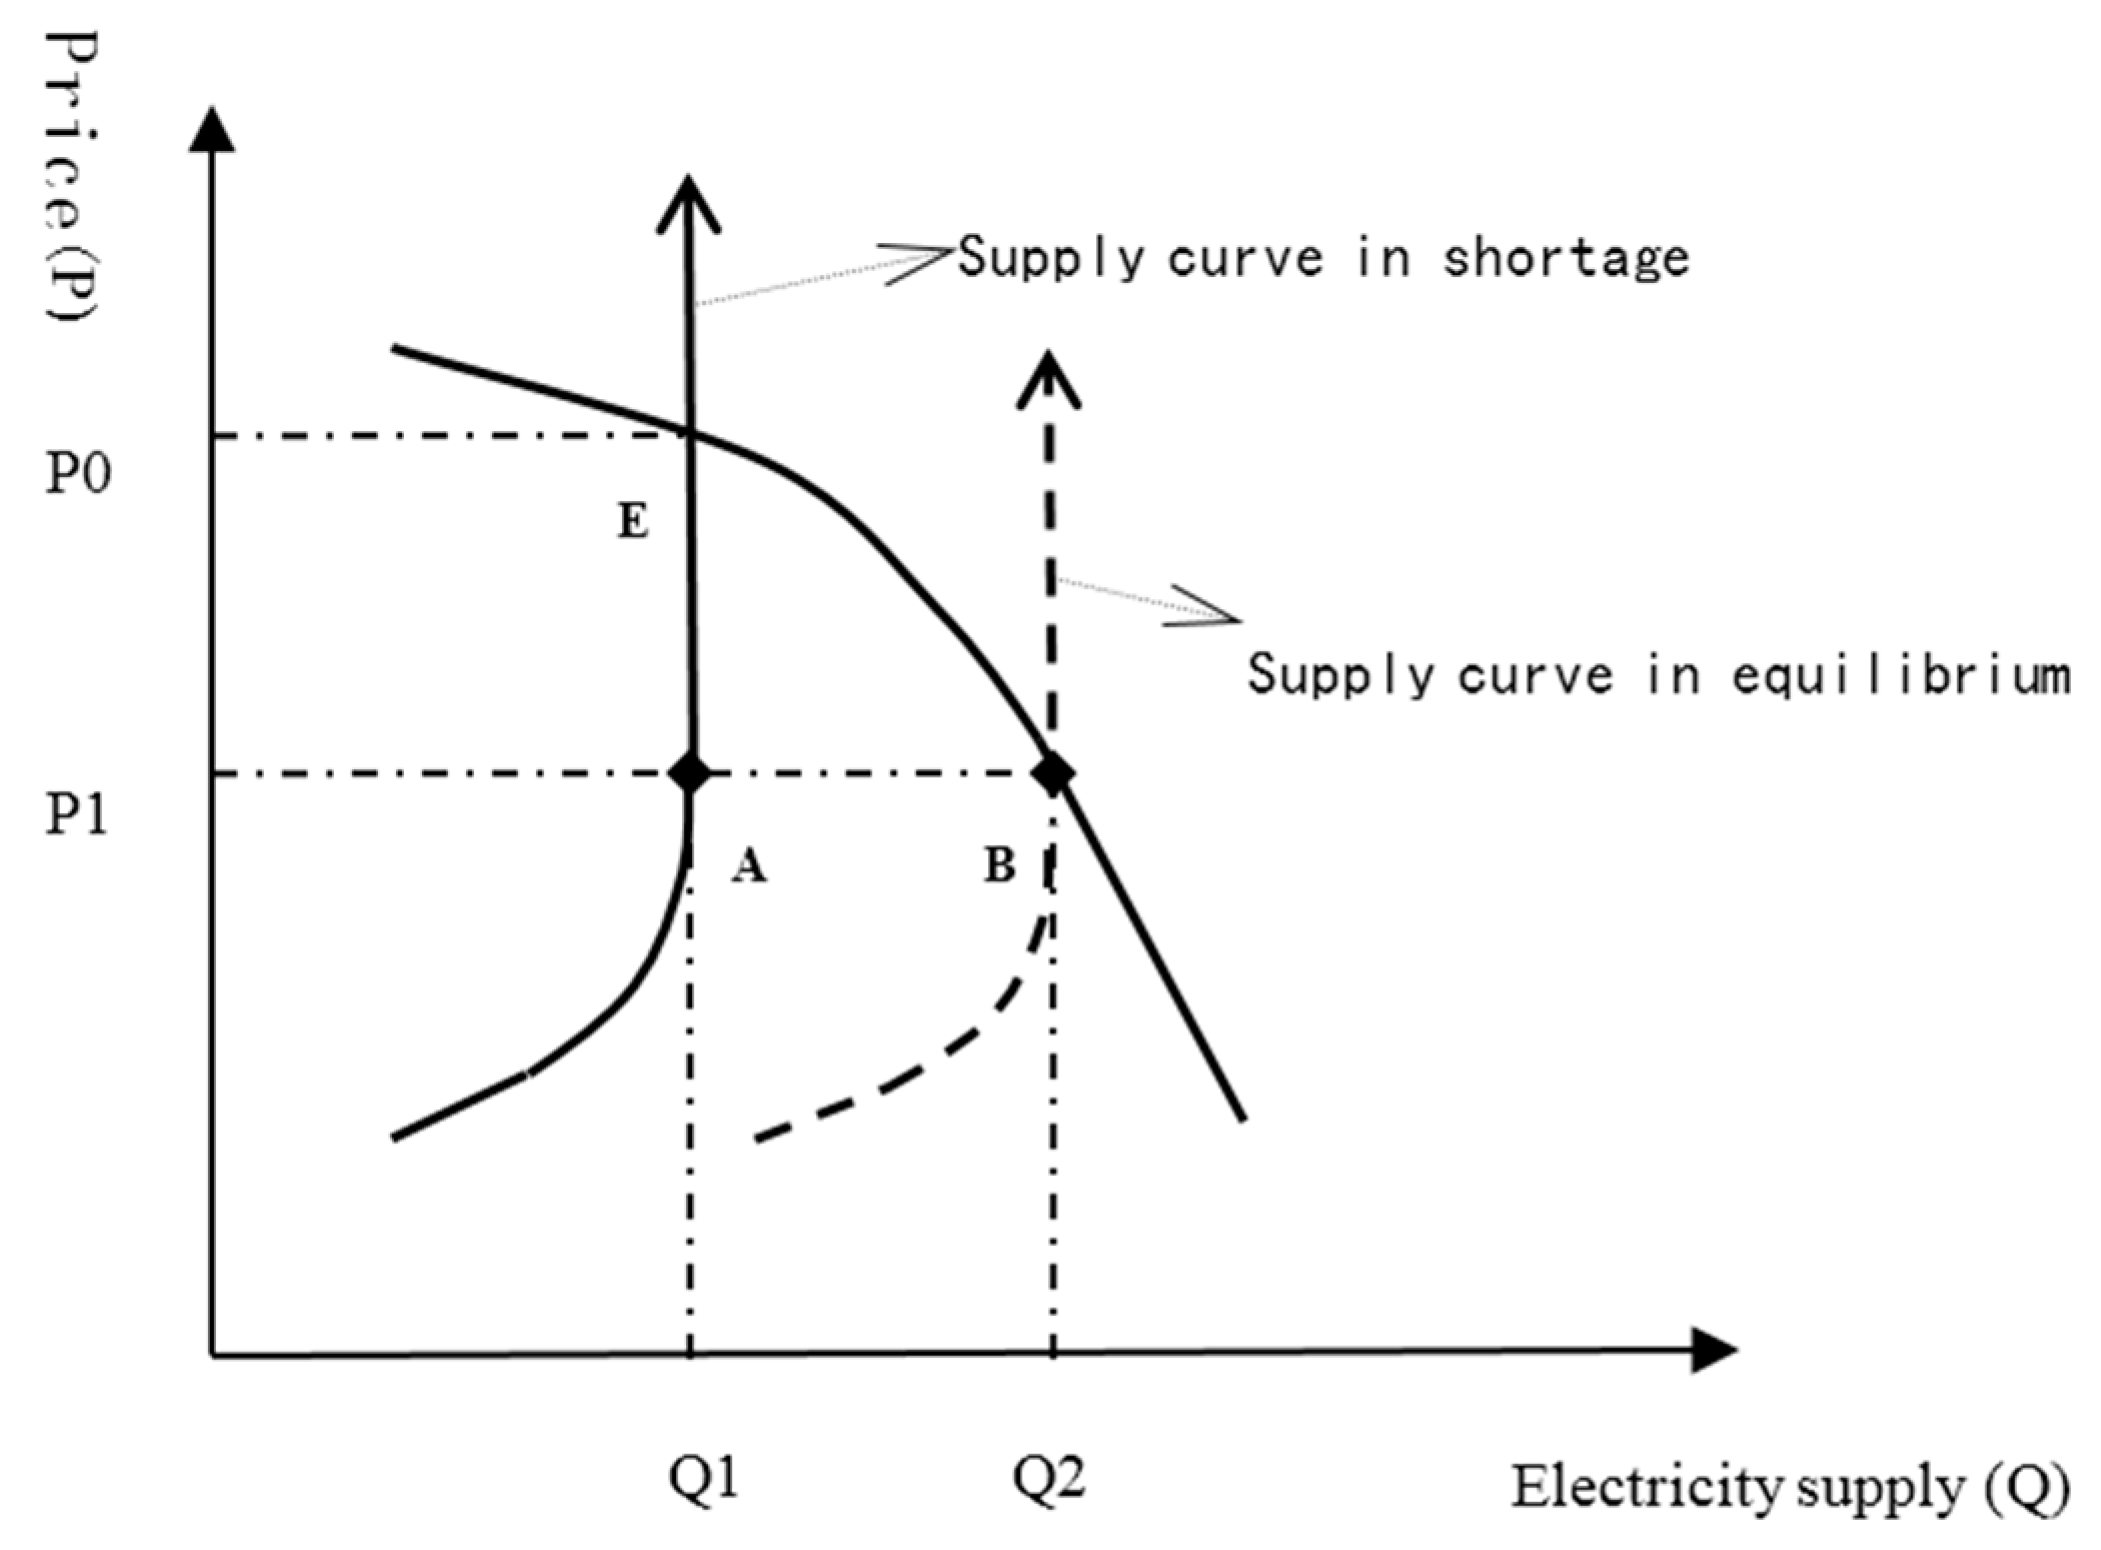
Different from hard electricity shortage, the electric power industry has sufficient capacity in the case of soft electricity shortage. Since the administratively-regulated price is less than the equilibrium price, the effective electricity demand is greater than the actual supply, and the difference between them is the amount of power shortage. As shown in the following figure, in the case of soft electricity shortage, the supply curve is an oblique upward curve. The equilibrium point is E, and the equilibrium price is P0. P1 is less than P0, which results in insufficient power output and power shortage.
It is assumed that, in the reference state, power supply is in equilibrium (Point E below). When simulating soft electricity shortage, it is supposed that there is a gap (indicated by (Q2 − Q1)/Q1) between effective demand and actual demand. Besides, the power output is changeable. Simulation results are shown in Figure 4.
Different from hard electricity shortage, soft electricity shortage is the result of a low price in the short run. The initial equilibrium point in the above figure is not Point B, but E. We set Point E as a reference state of the CGE model. Similarly, it is assumed that electricity shortage accounts for a certain proportion of effective power demand. Based on the proportion of the electricity consumption of different sectors in the base year, we set the amount of electricity shortage of different sectors. We set up four cases for the proportion of power shortage: 3%, 7%, 11% and 15%. After simulation in the CGE model, power shortages of different production sectors (except the electricity production sector) are shown in the Table 5.
5.2.1. Macro Impacts
Under the case of soft electricity shortage, the impacts of different proportions of power shortage on GDP are shown in the Table 6.
As can be seen, the effects of soft electricity shortage on GDP, consumer welfare and prices are similar, but differ in degree. Compared to hard electricity shortage, the negative impacts of soft electricity shortage on GDP and consumer welfare are more significant. There are two reasons:
- (1)
- Although we use the same reference point to simulate two kinds of power shortage, the specific operation modes are not the same. Moreover, the hard electricity shortage results from inadequate investment, which tends to be the result of economic development for a longer time. The soft electricity shortage is the result of industrial structure imbalance in a shorter period. The economic explanations behind them are different, and there is no full comparability, so a horizontal comparison between their macro-economic impacts only has a reference significance.
- (2)
- During the soft electricity shortage, the time involved is much shorter. Substitution effects among inputs are not so obvious, neither is the substitution among different goods. Industry structure and consumption tendency do not change too much. As the relationship between GDP and electricity consumption is more rigid, the negative effects of power shortage on economic development are more obvious.
5.2.2. Effects on the Output of Various Sectors
The effects of soft electricity shortage on the output of various sectors are shown in Table 7. The output of all sectors drops less than that under the case of hard electricity shortage. The coal production industry is affected most, because demand for coal is rigidly decreased by the reduction of the power output. Meanwhile, oil output does not increase, but begins to fall, because the substitution of oil for electricity is not obvious. The outputs of heavy industry and light industry decrease greatly. When the proportion of short electricity shortage is 15%, the outputs of heavy industry and light industry decrease by 12.32% and 11.3%, respectively. The construction industry is least affected.
6. Conclusions and Suggestions
In this paper, a CGE model is used to simulate the impacts of hard electricity shortage and soft electricity shortage on China’s economy, and we have these research findings. Firstly, the macro-economy, such as GDP and the welfare of consumers, is negatively affected by electricity shortage. With more electricity shortage, macro-economic loss accelerates, due to the rigid demand for energy, as China is currently in the stage of industrialization and urbanization. Moreover, the negative impacts of soft electricity shortage are more obvious than that of hard electricity shortage. Regardless of differences in model setting, the rigid relationship between economic development and electricity demand is becoming more obvious in the case of soft electricity shortage. Finally, as for the outputs, the light industry, heavy industry and coal production industry are influenced most. This is easy to understand. The first two industries rely more heavily on electricity, and coal is a major resource for electricity generation. It is worth noting that the output loss of various sectors in the case of hard electricity shortage differs greatly, while this is not the case of soft electricity shortage. Theoretically speaking, long-term power shortage under the background of hard electricity shortage forces industries to transfer to low electricity-consuming industries. However, in reality, it seems that power supply is guided by the economic situation and industry pattern, but not vice versa. The effects of power shortage on the industry pattern are still questionable, which need be further studied and improved.
Through the simulation, we understand the economic costs of electricity shortage, and there is no doubt that the economic cost of avoiding electricity shortage is far less than that of power shortage. To solve the problem of Chinese power shortage better, we propose the following suggestions.
Firstly, to solve the power shortage, it is very critical for effective electric power demand forecasting to plan power investment rationally. In these years, China has emphasized much the electricity infrastructure construction; thus, the threat of hard power shortage becomes less. There is a new problem, and that is over-capacity. In China, the plans of electricity power facilities construction and grid infrastructure should be audited and determined by the National Development and Reform Commission (NDRC). One of the reasons for the hard power shortage around 2004 is the mistakes of electricity prediction and planning due to the specific electric system. Accordingly, the NDRC or the government should pay more attention to the relationship between electricity consumption and GDP growth, coordinate capacity and inter-regional transmission network investments and, thus, plan the construction of electricity rationally.
Secondly, as mentioned above, we know that the main cause for soft power shortage is the conflict between market coal and planned electricity, and thus, to figure out the relationship between the prices of them is essential and inevitable. In 2004, China’s government has begun to implement the policy of the linkage between coal price and entered-network price, namely if the increase of coal prices reaches or surpasses a certain degree, then the electricity price will be increased. During these years, the policy has been blocked repeatedly, and the dilemma of coal and electricity has not been settled appropriately. However, further advancing this policy will ease the conflict between market coal and planned electricity and ensure the profits of the generation plants in the condition of sufficient marketization. If implemented effectively, the policy of the coal-electricity price linkage is a good way to solve the soft power shortage.
Finally, the two suggestions above can just be temporary solutions. In the long-term, to solve power shortage completely, electric price reform is essential and inevitable. Nowadays, the Chinese economy has entered “the new normal”, where economic growth slows down and the coal price falls. The two-track system of coal has been integrated, and the contradiction between power supply and demand is mitigated. It is a great time to advance and deepen the electric price reform. It is common sense that China’s electric price is in need of reform, but in which direction? The important things of the reform are to clarify the transmission and distribution prices, then to make the power grid enterprises be service providers instead of middlemen; and moreover, to introduce competition into the generation and retail side. The on-grid prices are decided by true price bidding instead of the so-called price bidding at present. In this way, electricity is an important approach to adjust market demand instead of the macro-adjustment tool of the government. The connection between generation plants and end-user could be built, and the generation plants could be paid and compensated for their efforts by prices that work as transmission channels. The flow of capital into the electricity sector is free. The investments in the electric sector and the benefits of generation plants could be decided by the market instead of the government; what is more, demand side management will become possible. Power shortage and other electric problems could be better mitigated and solved finally.
Acknowledgments
The paper is supported by the National Natural Science Foundation of China (No. 71203186), the Program for Major Projects in Philosophy and Social Science Research of the Ministry of Education of China (No. 14JZD031) and the major projects of the National Social Science Fund (No. 14ZDB144).
Author Contributions
Peng Ou constructed the CGE models, performed all calculations and wrote most of the paper. Ruting Huang collected data and wrote the literature review. Xin Yao proposed research ideas, analyzed the research results and offered policy suggestions.
Conflicts of Interest
The authors declare no conflict of interest.
References and Notes
- Woo, C.K.; Pupp, R.L. Costs of service disruptions to electricity consumers. Energy 1992, 17, 109–126. [Google Scholar] [CrossRef]
- Sun, T.; Wang, X.; Ma, X. Relationship between the economic cost and the reliability of the electric power supply system in city: A case in Shanghai of China. Appl. Energy 2009, 86, 2262–2267. [Google Scholar] [CrossRef]
- Shiu, A.; Lam, P.L. Electricity consumption and economic growth in China. Energy Policy 2004, 32, 47–54. [Google Scholar] [CrossRef]
- Tsai, C.M. The reform paradox and regulatory dilemma in China’s electricity industry. Asian Surv. 2011, 51, 520–539. [Google Scholar] [CrossRef]
- Zhang, L.; Ruan, J.; Ding, J. The institutional power shortage in China: Capacity shortage or capacity under-utilisation? Appl. Energy 2014, 136, 480–494. [Google Scholar] [CrossRef]
- Ming, Z.; Song, X.; Ling, Y.; Wang, Y.; Wei, Y.; Li, Y. China’s large-scale power shortages of 2004 and 2011 after the electricity market reforms of 2002: Explanations and differences. Energy Policy 2013, 61, 610–618. [Google Scholar] [CrossRef]
- Cherni, J.A.; Kentish, J. Renewable energy poliy and electricity market reform in China. Energy Policy 2007, 35, 3616–3629. [Google Scholar] [CrossRef]
- Ngan, H.W. Electricity regulation and electricity market reforms in China. Energy Policy 2010, 38, 2142–2148. [Google Scholar] [CrossRef]
- Li, H.Z.; Tian, X.L.; Zou, T. Impact analysis of Coal-electricity pricing linkage scheme in China based on stochastic frontier cost function. Appl. Erengy 2015, 151, 296–305. [Google Scholar] [CrossRef]
- Song, M.L.; Cui, L.B. Economic evaluation of Chinese electricity price marketization based on dynamic computational general equilibrium model. Comput. Ind. Eng. 2016. [Google Scholar] [CrossRef]
- Lin, B.Q. Power Shortage, Short-run Response, and Long-run Consideration. Econ. Res. J. 2004, 3, 28–36. [Google Scholar]
- Cheng, Y.S.; Wong, W.K.; Woo, C.K. How much have electricity shortages hampered China’s GDP growth? Energy Policy 2013, 55, 369–373. [Google Scholar] [CrossRef]
- Ma, H.; Oxley, L.; Gibson, J. China’s energy situation in the new millennium. Renew. Sustain. Energy Rev. 2009, 13, 1781–1799. [Google Scholar] [CrossRef]
- Fisher-Vanden, K.; Mansur, E.T.; Wang, Q.J. Electricity shortages and firm productivity: Evidence from China’s industrial firms. J. Dev. Econ. 2015, 114, 172–188. [Google Scholar] [CrossRef]
- Thomson, E. Power shortages in China: Why? China Int. J. 2005, 3, 155–171. [Google Scholar] [CrossRef]
- Yuan, J.; Lei, Q.; Xiong, M.; Guo, J.; Zhao, C. Scenario-Based Analysis on Water Resources Implication of Coal Power in Western China. Sustainability 2014, 6, 7155–7180. [Google Scholar] [CrossRef]
- Apergis, N.; Payne, J.E. A dynamic panel study of economic development and the electricity consumption-growth nexus. Energy Econ. 2011, 33, 770–781. [Google Scholar] [CrossRef]
- Yang, Y.; Chen, Y.E.; Liu, Z. Energy constraints and China’s economic development. J. Econ. Policy Reform 2007, 10, 343–354. [Google Scholar] [CrossRef]
- Johansen, L. A multi-sectoral study of economic growth. Am. Econ. Rev. 1961, 51, 436–438. [Google Scholar]
- Jiang, L.; Wu, F.; Liu, Y.; Deng, X.Z. Modeling the impacts of urbanization and industrial transformation on water resources in china: An integrated hydro-economic CGE analysis. Sustainability 2014, 6, 7586–7600. [Google Scholar] [CrossRef]
- Boccanfuso, D.; Savard, L.; Estache, A. The distributional impact of developed countries’ climate change policies on senegal: A macro-micro CGE application. Sustainability 2013, 5, 2727–2750. [Google Scholar] [CrossRef]
- Li, N.; Wang, X.; Shi, M.; Yang, H. Economic Impacts of Total Water Use Control in the Heihe River Basin in Northwestern China—An Integrated CGE-BEM Modeling Approach. Sustainability 2015, 7, 3460–3478. [Google Scholar] [CrossRef]
- Scaramucci, J.A.; Perin, C.; Pulino, P.; Bordoni, O.F.; Da Cunha, M.P.; Cortez, L.A. Energy from sugarcane bagasse under electricity rationing in Brazil: A computable general equilibrium model. Energy Policy 2006, 34, 986–992. [Google Scholar] [CrossRef]
- Welsch, H.; Ochsen, C. Dismantling of nuclear power in Germany: Sectoral and macroeconomic effects. Energy Policy 2001, 29, 279–289. [Google Scholar] [CrossRef]
- Cansino, J.M.; Cardenete, M.A.; González-Limón, J.M.; Román, R. The economic influence of photovoltaic technology on electricity generation: A CGE (computable general equilibrium) approach for the Andalusian case. Energy 2014, 73, 70–79. [Google Scholar] [CrossRef]
- Cansino, J.M.; Cardenete, M.A.; Gonzalez, J.M.; Pablo-Romero, M.D.P. Economic impacts of solar thermal electricity technology deployment on Andalusian productive activities: A CGE approach. Ann. Reg. Sci. 2013, 50, 25–47. [Google Scholar] [CrossRef]
- Cai, Y.; Arora, V. Disaggregating electricity generation technologies in CGE models: A revised technology bundle approach with an application to the US Clean Power Plan. Appl. Energy 2015, 154, 543–555. [Google Scholar] [CrossRef]
- Tarancón, M.A.; del Río, P.; Albinana, F.C. Assessing the influence of manufacturing sectors on electricity demand. A cross-country input-output approach. Energy Policy 2010, 38, 1900–1908. [Google Scholar] [CrossRef]
- Rodrigues, R.; Linares, P. Electricity load level detail in computational general equilibrium—Part I—Data and calibration. Energy Econ. 2014, 46, 258–266. [Google Scholar] [CrossRef]
- Rodrigues, R.; Linares, P. Electricity load level detail in computational general equilibrium—Part II—Welfare impacts of a demand response program. Energy Econ. 2015, 47, 52–67. [Google Scholar] [CrossRef]
- Holmoy, E. The Anatomy of Electricity Demand: A CGE Decomposition for Norway. Statisics Norway, Research Department. 2005. Available onlinde: https://brage.bibsys.no/xmlui/handle/11250/180277 (accessed on 16 July 2016).
- Wiskich, A. Implementing a load duration curve of electricity demand in a general equilibrium model. Energy Econ. 2014, 45, 373–380. [Google Scholar] [CrossRef]
- Nguyen, K.Q. Impacts of a rise in electricity tariff on prices of other products in Vietnam. Energy Policy 2008, 36, 3145–3149. [Google Scholar] [CrossRef]
- Liu, M.H.; Margaritis, D.; Zhang, Y. Market-driven coal prices and state-administered electricity prices in China. Energy Econ. 2013, 40, 167–175. [Google Scholar] [CrossRef]
- He, Y.X.; Zhang, S.L.; Yang, L.Y.; Wang, Y.J.; Wang, J. Economic analysis of coal price-electricity price adjustment in China based on the CGE model. Energy Policy 2010, 38, 6629–6637. [Google Scholar] [CrossRef]
- He, Y.X.; Yang, L.F.; He, H.Y. Electricity demand price elasticity in China based on computable general equilibrium model analysis. Energy 2011, 36, 1115–1123. [Google Scholar] [CrossRef]
- Hwang, W.S.; Lee, J.D. A CGE analysis for quantitative evaluation of electricity market changes. Energy Policy 2015, 83, 69–81. [Google Scholar] [CrossRef]
- Dansie, G.; Lanteigne, M.; Overland, I. Reducing energy subsidies in China, India and Russia: Dilemmas for decision makers. Sustainability 2010, 2, 475–493. [Google Scholar] [CrossRef] [Green Version]
- Lin, B.Q.; Jiang, Z.J. Estimates of energy subsidies in China and impact of energy subsidy reform. Energy Econ. 2011, 33, 273–283. [Google Scholar] [CrossRef]
- Wang, Y.; Almazrooei, S.A.; Kapsalyamova, Z.; Diabat, A.; Tsai, I.T. Utility subsidy reform in Abu Dhabi: A review and a Computable General Equilibrium analysis. Renew. Sustain. Energy Rev. 2016, 55, 1352–1362. [Google Scholar] [CrossRef]
- Hosoe, N. The deregulation of Japan’s electricity industry. Jpn. World Econ. 2006, 18, 230–246. [Google Scholar] [CrossRef]
- Akkemik, K.A.; Oğuz, F. Regulation, efficiency and equilibrium: A general equilibrium analysis of liberalization in the Turkish electricity market. Energy 2011, 36, 3282–3292. [Google Scholar] [CrossRef]
- Li, J.F.; Wang, X.; Zhang, Y.X.; Kou, Q. The economic impact of carbon pricing with regulated electricity prices in China—An application of a computable general equilibrium approach. Energy Policy 2014, 75, 46–56. [Google Scholar] [CrossRef]
- Chi, Y.; Guo, Z.; Zheng, Y.; Zhang, X. Scenarios analysis of the energies’ consumption and carbon emissions in China based on a dynamic CGE Model. Sustainability 2014, 6, 487–512. [Google Scholar] [CrossRef]
- Lofgren, H.; Harris, R.L.; Robinson, S. A Standard Computable General Equilibrium (CGE) Model in GAMS. International Food Policy Research Institute. 2002. Available online: http://www.un.org/en/development/desa/policy/mdg_workshops/training_material/lofgren_lee_and_robinson_2002.pdf (accessed on 14 July 2016).
- Some CGE models allow that one sector produces a variety of different products, and that different sectors produce the same product, but it has little effect on results. For the sake of simplicity, the CGE model in this article assumes one sector produces one product.
- The Leontief production function is a special form of CES production function when ρ equals −∞.
- Roland-Holst, D. General Equilibrium Techniques for Policy Modeling. 2009. Available online: http://are.berkeley.edu/~dwrh/FAO_ECTAD_FMD_Cambodia/Documents/Modeling_Manual_RHVDM.pdf (accessed on 14 July 2016).
- A Social Accounting Matrix (SAM) represents flows of all economic transactions that take place within an economy (regional or national).
- Rattso, J. Different macro-closures of the original Johansen model and their impact on policy evaluation. J. Policy Model. 1982, 4, 85–97. [Google Scholar] [CrossRef]
- Chinese Energy Statistical Yearbook edited by Energy Statistics is an annual statistical publication, which covers very comprehensive data in energy construction, production, consumption, equilibrium of supply and demand in an all-round way.
- RAS method is a kind of methods which are used to amend the technical coefficient matrix of the orgnial input-output table and thus to compile the input-output table in the planning period with some data controlled.
- Pyatt, G. A SAM approach to modeling. J. Policy Model. 1988, 10, 327–352. [Google Scholar] [CrossRef]
- Robinson, S.; Cattaneo, A.; El-Said, M. Updating and Estimating a Social Accounting Matrix Using Cross Entropy Methods. Econ. Syst. Res. 2001, 13, 47–64. [Google Scholar] [CrossRef]
- Lin, B.Q.; Liu, C. Why is electricity consumption inconsistent with economic growth in China? Energy Policy 2016, 88, 310–316. [Google Scholar] [CrossRef]
Figure 1.
Nesting of the production function.

Figure 2.
The flow of production and the supply of goods.

Figure 3.
Hard electricity shortage.

Figure 4.
Soft electricity shortage.

| Row Account | Colum Account | Corresponding Transaction | Data Source |
|---|---|---|---|
| 1 activity | 2 commodity | self-cropping and self-selling | Difference between total output and export; a balance account |
| 9 abroad | export | Input-output table in 2007 | |
| 2 commodity | 1 activity | Intermediate inputs | Input-output table in 2007 |
| 2 commodity | transaction cost | Transaction cost is not considered in this table | |
| 5 resident | resident consumption | Input-output table in 2007 | |
| 7 government | government consumption | Input-output table in 2007 | |
| 8 saving-investment | investment | Input-output table in 2007; gross capital formation, stock added and others are combined | |
| 3 element | 1 activity | added value of elements | Input-output table in 2007; capital income equals fixed asset depreciation and operational surplus |
| 8 abroad | element reward from overseas | Capital flow statement in 2007 (physical quantity) | |
| 4 resident | 3 element | resident’s element income | Labor income is a balance item; data of capital reward comes from capital flow statement in 2007 (physical quantity) |
| 5 enterprise | transfer payment from enterprises to residents | A balance item of the resident account | |
| 6 government | transfer payment from government to residents | China Finance Yearbook 2008 | |
| 8 abroad | transfer payment from overseas to residents | China Statistical Yearbook 2008 | |
| 5 enterprise | 3 element | element reward of enterprise | Input-output table in 2007 |
| 6 government | 1 activity | production tax and value added tax | Input-output table in 2007 |
| 2 commodity | sales tax and duties | Input-output table in 2007 | |
| 3 element | element tax | Element tax is not considered in this table | |
| 4 resident | resident income tax | China Finance Yearbook 2008 | |
| 5 enterprise | enterprise tax | China Finance Yearbook 2008 | |
| 7 S-I | government debt | China Finance Yearbook 2008 | |
| 7 saving-investment | 4 resident | resident savings | A balance item of resident account |
| 5 enterprise | enterprise savings | A balance item of enterprises account | |
| 6 government | government savings | A balance item of the government account | |
| 8 abroad | net foreign savings | A balance item of the foreigner account | |
| 8 abroad | 2 commodity | import | Input-output table in 2007 |
| 6 government | transfer payment from government to foreigners | China Finance Yearbook 2008 |
Table 2.
Electricity shortage of various sectors under the condition of “hard electricity shortage”; unit: %.
| Proportion of Power Shortage | 3 | 7 | 11 | 15 |
|---|---|---|---|---|
| Primary industry | 4.45 | 9.96 | 15.04 | 19.75 |
| Heavy industry | 4.53 | 10.39 | 16.03 | 21.44 |
| Light industry | 4.50 | 10.21 | 15.59 | 20.67 |
| Construction industry | 4.44 | 9.92 | 14.94 | 19.54 |
| Service industry | 4.47 | 10.05 | 15.27 | 20.17 |
| Coal mining and selection industry | 4.53 | 10.36 | 15.92 | 21.18 |
| Petroleum and gas extracting industry | 4.42 | 9.81 | 14.67 | 19.06 |
| Proportion of Power Shortage | 3 | 7 | 11 | 15 |
|---|---|---|---|---|
| GDP | −0.98 | −2.51 | −4.31 | −6.39 |
| Welfare of consumers | −0.62 | −1.40 | −2.14 | −2.92 |
| Price | 0.63 | 1.51 | 2.41 | 3.33 |
| Loss Relative to Equilibrium Output | 3 | 7 | 11 | 15 |
|---|---|---|---|---|
| Primary industry | −0.22 | −0.59 | −1.04 | −1.58 |
| Heavy industry | −1.51 | −4.10 | −7.39 | −11.39 |
| Light industry | −1.32 | −3.62 | −6.54 | −10.12 |
| Construction industry | −0.14 | −0.42 | −0.81 | −1.31 |
| Service industry | −0.13 | −0.38 | −0.72 | −1.16 |
| Coal mining and selection industry | −1.46 | −3.37 | −5.23 | −7.01 |
| Petroleum and gas extracting industry | 0.48 | 1.15 | 1.86 | 2.62 |
| Electricity and heat production and supply industry | −3.00 | −7.00 | −11.00 | −15.00 |
Table 5.
Electricity shortage of different sectors under the condition of “soft electricity shortage”; (unit: %).
| Proportion of Power Shortage | 3 | 7 | 11 | 15 |
|---|---|---|---|---|
| Primary industry | 3.61 | 8.70 | 14.12 | 19.92 |
| Heavy industry | 3.60 | 8.63 | 13.91 | 19.42 |
| Light industry | 3.66 | 8.95 | 14.78 | 21.21 |
| Construction industry | 3.61 | 8.65 | 13.99 | 19.64 |
| Service industry | 3.69 | 9.15 | 15.33 | 22.39 |
| Coal mining and selection industry | 3.75 | 9.49 | 16.16 | 23.83 |
| Petroleum and gas extracting industry | 3.70 | 9.15 | 15.23 | 21.96 |
| Proportion of Power Shortage | 3 | 7 | 11 | 15 |
|---|---|---|---|---|
| GDP | −1.60 | −3.84 | −6.21 | −8.78 |
| Welfare of consumers | −0.62 | −1.66 | −2.99 | −4.67 |
| Price | 0.85 | 1.96 | 3.04 | 4.06 |
| Loss Relative to Equilibrium Output | 3 | 7 | 11 | 15 |
|---|---|---|---|---|
| Primary industry | −1.37 | −3.23 | −5.16 | −7.20 |
| Heavy industry | −2.32 | −5.49 | −8.81 | −12.32 |
| Light industry | −2.02 | −4.86 | −7.93 | −11.30 |
| Construction industry | −0.82 | −1.95 | −3.13 | −4.37 |
| Service industry | −1.33 | −3.20 | −5.18 | −7.34 |
| Coal mining and selection industry | −3.12 | −7.10 | −10.89 | −14.50 |
| Petroleum and gas extracting industry | −2.18 | −4.99 | −7.72 | −10.36 |
| Electricity and heat production and supply industry | −2.88 | −6.66 | −10.37 | −14.01 |
© 2016 by the authors; licensee MDPI, Basel, Switzerland. This article is an open access article distributed under the terms and conditions of the Creative Commons Attribution (CC-BY) license (http://creativecommons.org/licenses/by/4.0/).
Share and Cite
MDPI and ACS Style
Ou, P.; Huang, R.; Yao, X. Economic Impacts of Power Shortage. Sustainability 2016, 8, 687. https://0-doi-org.brum.beds.ac.uk/10.3390/su8070687
AMA Style
Ou P, Huang R, Yao X. Economic Impacts of Power Shortage. Sustainability. 2016; 8(7):687. https://0-doi-org.brum.beds.ac.uk/10.3390/su8070687
Chicago/Turabian StyleOu, Peng, Ruting Huang, and Xin Yao. 2016. "Economic Impacts of Power Shortage" Sustainability 8, no. 7: 687. https://0-doi-org.brum.beds.ac.uk/10.3390/su8070687
Note that from the first issue of 2016, this journal uses article numbers instead of page numbers. See further details here.