Article

Novel Role of Rural Official Organization in the Biomass-Based Power Supply Chain in China: A Combined Game Theory and Agent-Based Simulation Approach

School of Economics and Management, North China Electric Power University, Beijing 102206, China
*
Author to whom correspondence should be addressed.
Sustainability 2016, 8(8), 814; https://0-doi-org.brum.beds.ac.uk/10.3390/su8080814
Submission received: 7 May 2016 / Revised: 8 August 2016 / Accepted: 16 August 2016 / Published: 19 August 2016

Abstract

:
Developing biomass-based power generation is helpful for China to reduce the dependence on fossil fuels and to release the targets of carbon emission peak. The decentralized farming method leads to Chinese farmers’ weak willingness to collect and sell crop residues to biomass-based power plants. The purpose of this paper is to solve the issue by proposing a novel biomass feedstock supply model with China’s rural official organization—villagers’ committee, which has great influence on villagers’ decision making. Introducing it into the biomass-based power supply chain is beneficial to motivating farmers’ supplying enthusiasm. A combined game theory and agent-based simulation approach is applied to study the effectiveness of this new supply model. Multiple simulation scenarios are built to study impacts of different simulation parameters, and results show that farmers tend to supply more biomass material for electricity production in the proposed villagers’ committee model, compared with the two conventional supply models, direct-deal and broker models. The supply model incorporating the rural official organization can ensure the feedstock sufficiency for plants. A proper model design depends on the feed-in tariff subsidy for biomass-based electricity, feedstock shipping distance, performance appraisal system of the villagers’ committee, as well as farmers’ utility weights on net income and public service improvement.

1. Introduction

As the world’s largest greenhouse-gas (GHG) emitter [1], China commits to hit the carbon emission peak at around 2030, promising to make the best efforts to realize the target early. In order to achieve that goal, the carbon dioxide emission per unit of gross domestic product is aimed to be cut by 60 percent to 65 percent from the 2005 level by 2030. Moreover, the share of non-fossil fuels in its primary energy consumption will be increased to around 20 percent from the 11.2 percent ratio in 2014 [2]. Approved on 16 March 2016, China’s 13th Five-Year Plan explicitly indicates the promotion of optimizing and upgrading energy mix and the improvement of policy supporting for the power generation based on renewable energies, including wind and solar, as well as biomass [3].
Biomass-based generation is deemed as a promising utilization pathway of renewable energy in China because of its carbon neutrality feature [4], resource abundance [5,6] and its stability compared to other renewable power options, such as wind and solar [7]. Since China’s Renewable Energy Law was promulgated in 2006, the biomass-based generation industry has entered a new stage of rapid expansion. The nation-wide total installed capacity of biomass-based plants increased from approximately 1400 MW in 2006 to 9477.10 MW (grid-connected) in 2014. In addition, the electricity annually generated rose from 7.50 billion kWh (Kilowatt hour) in 2006 to 41.66 billion kWh in 2014 [8]. However, along with the fast developing, biomass-based plants started to face the challenge of insufficiency of feedstock supply from 2010 [9,10]. With crop residues (e.g., wheat and rice straw, corn stover, and cotton stalk) as the major feedstock for China’s biomass-based power plants [11], the dominant small-scaled self-supporting agriculture in a decentralized method undermines farmers’ willingness to deliver raw materials. Our field investigation revealed the fact that less than 10 percent of crop residues were collected as feedstock in practice, and the majority were discarded or even incinerated in farmlands, which led to severe air pollution. Direct reasons are that participation in the supply chain with modest purchasing price versus high collections costs, resulting from exorbitant labor and transportation in current agricultural economy, contributes little to farmers’ income and utility. Thus, without the consideration of important influences on farmers’ behaviors, the sustainable operation of the biomass-based power supply chain would be gloomy.
In the context of urban-rural economic dualism, Chinese farmers’ social and economic behaviors are greatly affected by local government actions [12,13,14,15]. Based on surveys with rural households from China’s provinces, Wang and Qu et al. found that the promotion from the government has significant effect on households’ decision of participating in the biomass energy supply chain [16,17]. He et al. indicated a need for joint effort between the government and farmers to take advantage of the benefits of biomass and recommended to leverage the incentive role of government subsidies and the exemplary role of opinion leaders and acquaintances in rural areas [18]. By analyzing the biomass-based generation industry chain using SCP (structure, conduct and performance) paradigm, Yan proposed a countermeasure that the government should assist to cultivate the biomass-based generation market and to establish the collection network of biomass resources through promoting farmers’ extensive participation and increasing their job opportunities and incomes [19]. While previous studies reached an agreement that the government should play a more active part in the supply chain of biomass energy before the mature modern industrial chain and sound distributed energy systems were established, the concrete role and detailed method of government involvement have not been explored. This research gap could be bridged by the quantitative investigation on the consequence of introducing the rural grass-rooted official government, which directly affects local villagers’ life. Villagers’ committees (VCs) are the grass-rooted official organizations in China’s vast rural areas, which play a double-joint role in the rural political life. They are not only groups that represent local villagers’ interests and help farmers to achieve self-organization, management and service, but also agents that extend administrative functions of the superior government and effectively implement national rural and agricultural policies [20]. It is this important bridge meaning of linking the state and farmers that motivates us to consider introducing the VC into the biomass-based power supply chain. Meanwhile, during our interviews, relevant experts and farmers also expressed the idea that the VC should have more significant and detailed part in biomass supplying.
In the research field of biomass supply chain models, Wang indicated that currently in China there are two typical styles, direct-deal supply model (farmer + plant) and broker supply model (farmer + broker + plant) [21]. By building a dynamic game model of complete information, Wu figured out that because of the fluctuated price there was no stable Nash equilibrium between the bio-firm (bio-refinery or biomass plant) and farmers [22]. In practice, our field investigations found that in the direct-deal model the biomass plant had to contact with numerous dispersed farmers, which was also the reason that caused transactions between plant and farmers to lack stability. As for the broker supply model, in order to maximize their profit brokers tended to lift prices for the plant so that the feedstock purchasing cost would be too high for the plant to make profit. Wang established a signaling game between the plant and broker where the quality of biomass feedstock was uncertain. The equilibrium analysis showed that this transaction mechanism could not ensure the broker to deliver the feedstock of high quality [21]. Thus, disadvantages of these two conventional supply models to a great extent hinder the development of China’s biomass-based power generation.
This paper proposes a novel model of the biomass-based power supply chain incorporating the rural official organization. In this model, being led by the VC, farmers are united to collect crop residues enjoying the benefit of reduced collection, transportation and pre-treatment costs since the VC provides relevant machinery and vehicles. In return, farmers gain part of the income and more utilities in that local village infrastructure and public services (roads, education, medical cares, etc.) are improved with the revenue from selling residues. The only contact with the VC saves the biomass-based power plant from troublesome negotiations with plentiful dispersed farmers. Moreover, this paper studies the issues associated with the VC supply model, including its performance compared with that of the two conventional models, the policy making of feed-in tariff subsidy for biomass-based electricity and the application radius of this model.
Methodologically, we combine the game theory and the agent-based simulation technique to study the effectiveness of this proposal. In the biomass-based power supply chain, feedstock transactions between the biomass-based plant, farmers, intermediate brokers and/or logistics carriers are pricing games [21]. The theory of non-cooperative game studies the behaviors of players in any situation where each player’s optimal choice may depend on his forecast of the choices of his opponents. However, the game-theoretic viewpoint is more useful in settings with a small number of players [23]. Supply chains, as well as biomass-based power supply chains, are complex adaptive systems (CASs) made up of heterogeneous production subsystems gathered in vast dynamic and virtual coalitions, where each partner has the characteristics of autonomy, social ability, reactivity and pro-activeness [24]. Introduced for dealing with these characteristics, the agent-based simulation technique provides a mechanism for modeling such CASs [25]. The combination of the two approaches above gives us a way of formulating the inter-dependence of agents’ behaviors, as well as simulating and analyzing a wide range of multi-agent interaction scenarios [26]. The main contributions of the simulation are not only to compute the numerical equilibrium, but also to observe the equilibrium evolution over time and the convergency speed with the bounded rationality.
The rest of the paper is organized as follows. The game-theoretical models of supply chains in the novel VC supply model as well as in the two conventional models are built, and the corresponding equilibriums are calculated in Section 2. With intelligent agents modeled based on the game equilibriums, a case study is simulated using the agent-based approach, and results are presented and discussed in Section 3 and Section 4. The final section concludes the paper, provides some policy implications and notes areas of future research.

2. Game-Theoretical Modeling

2.1. Models

In this section, we model the biomass-based power supply chains in the two conventional supply models—direct-deal and broker models—and the proposed model incorporating the VC. We assume that the biomass-based power supply chains involve with the game players of the biomass-based power plant, farmers, brokers and the VC. The architectures of the three supply chains are presented in Figure 1.

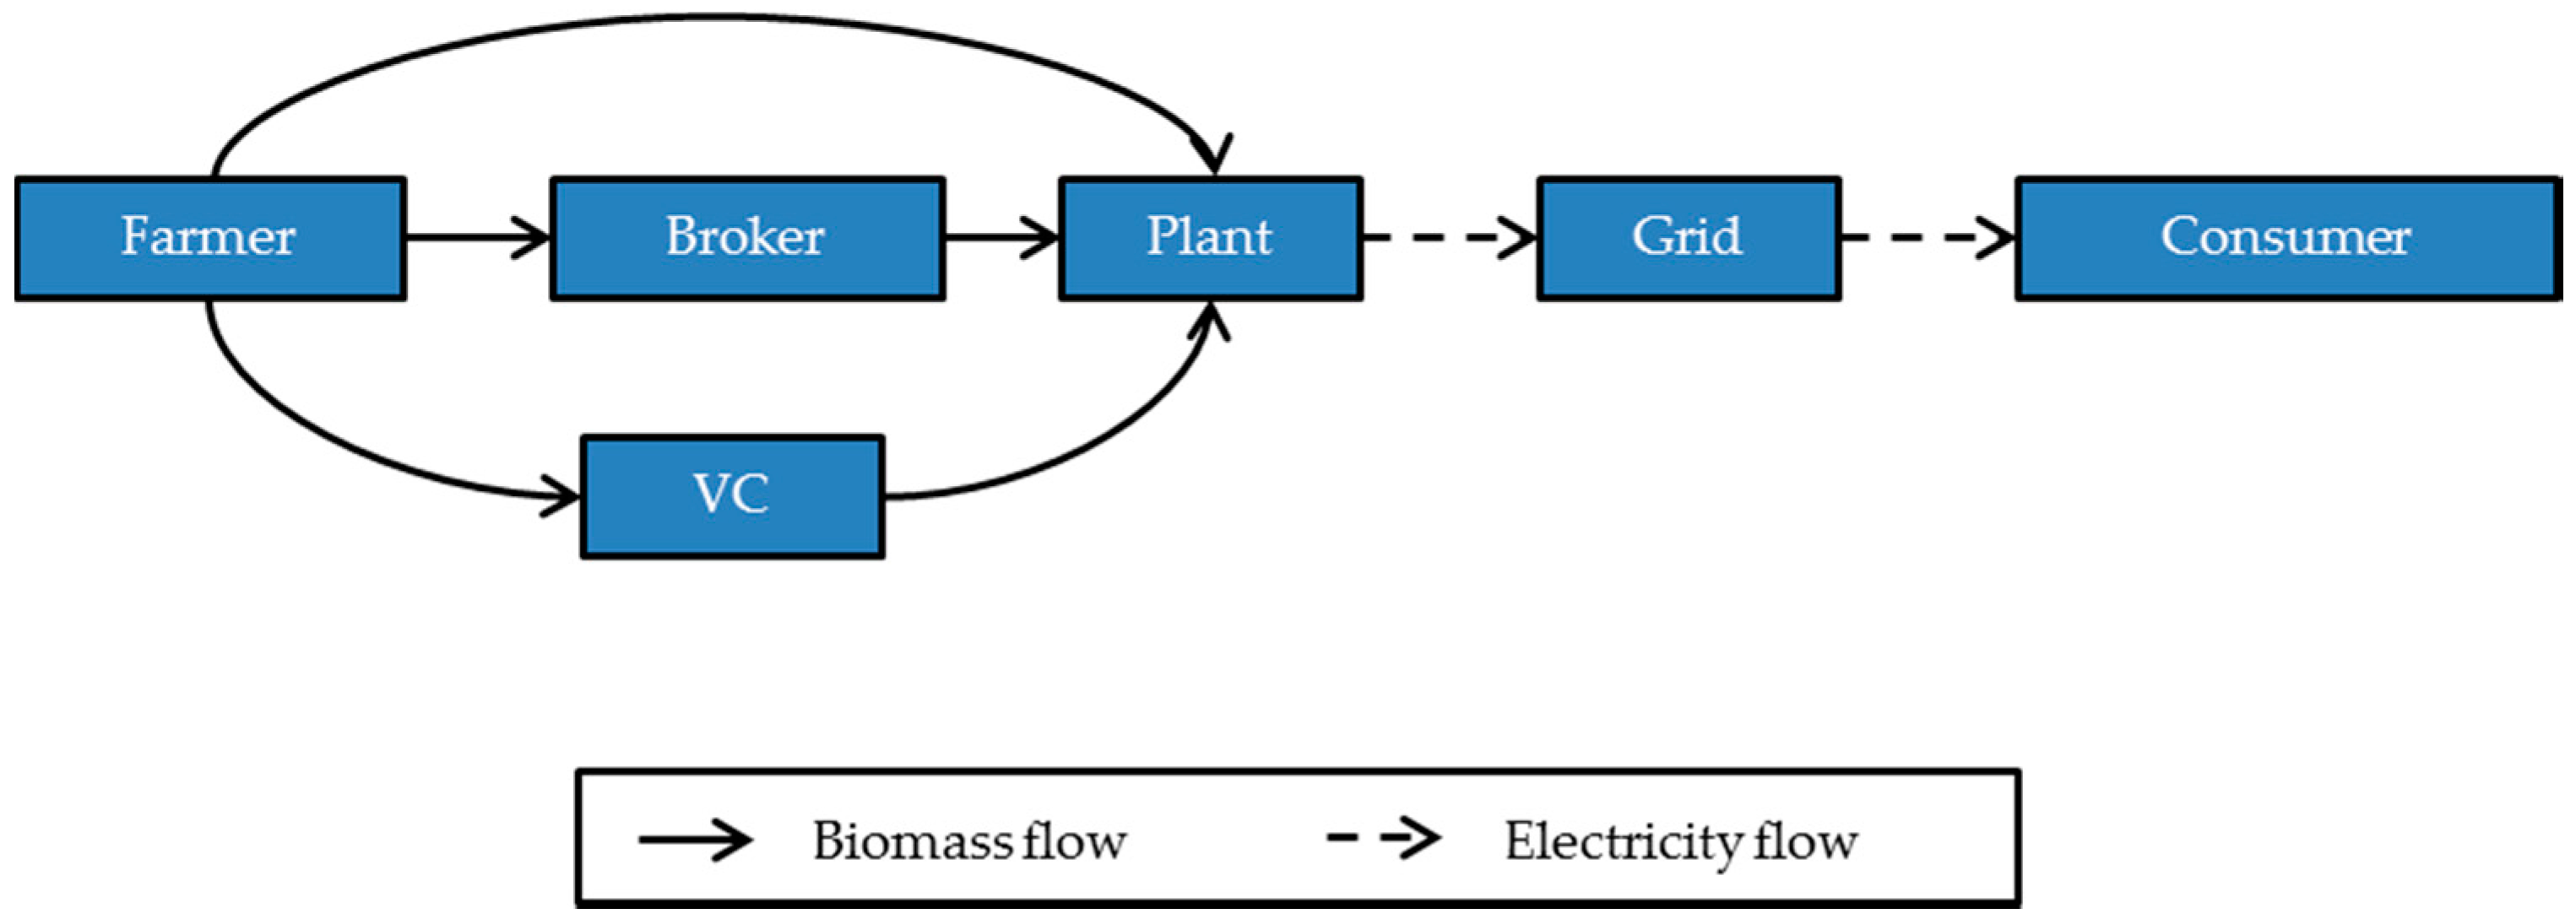
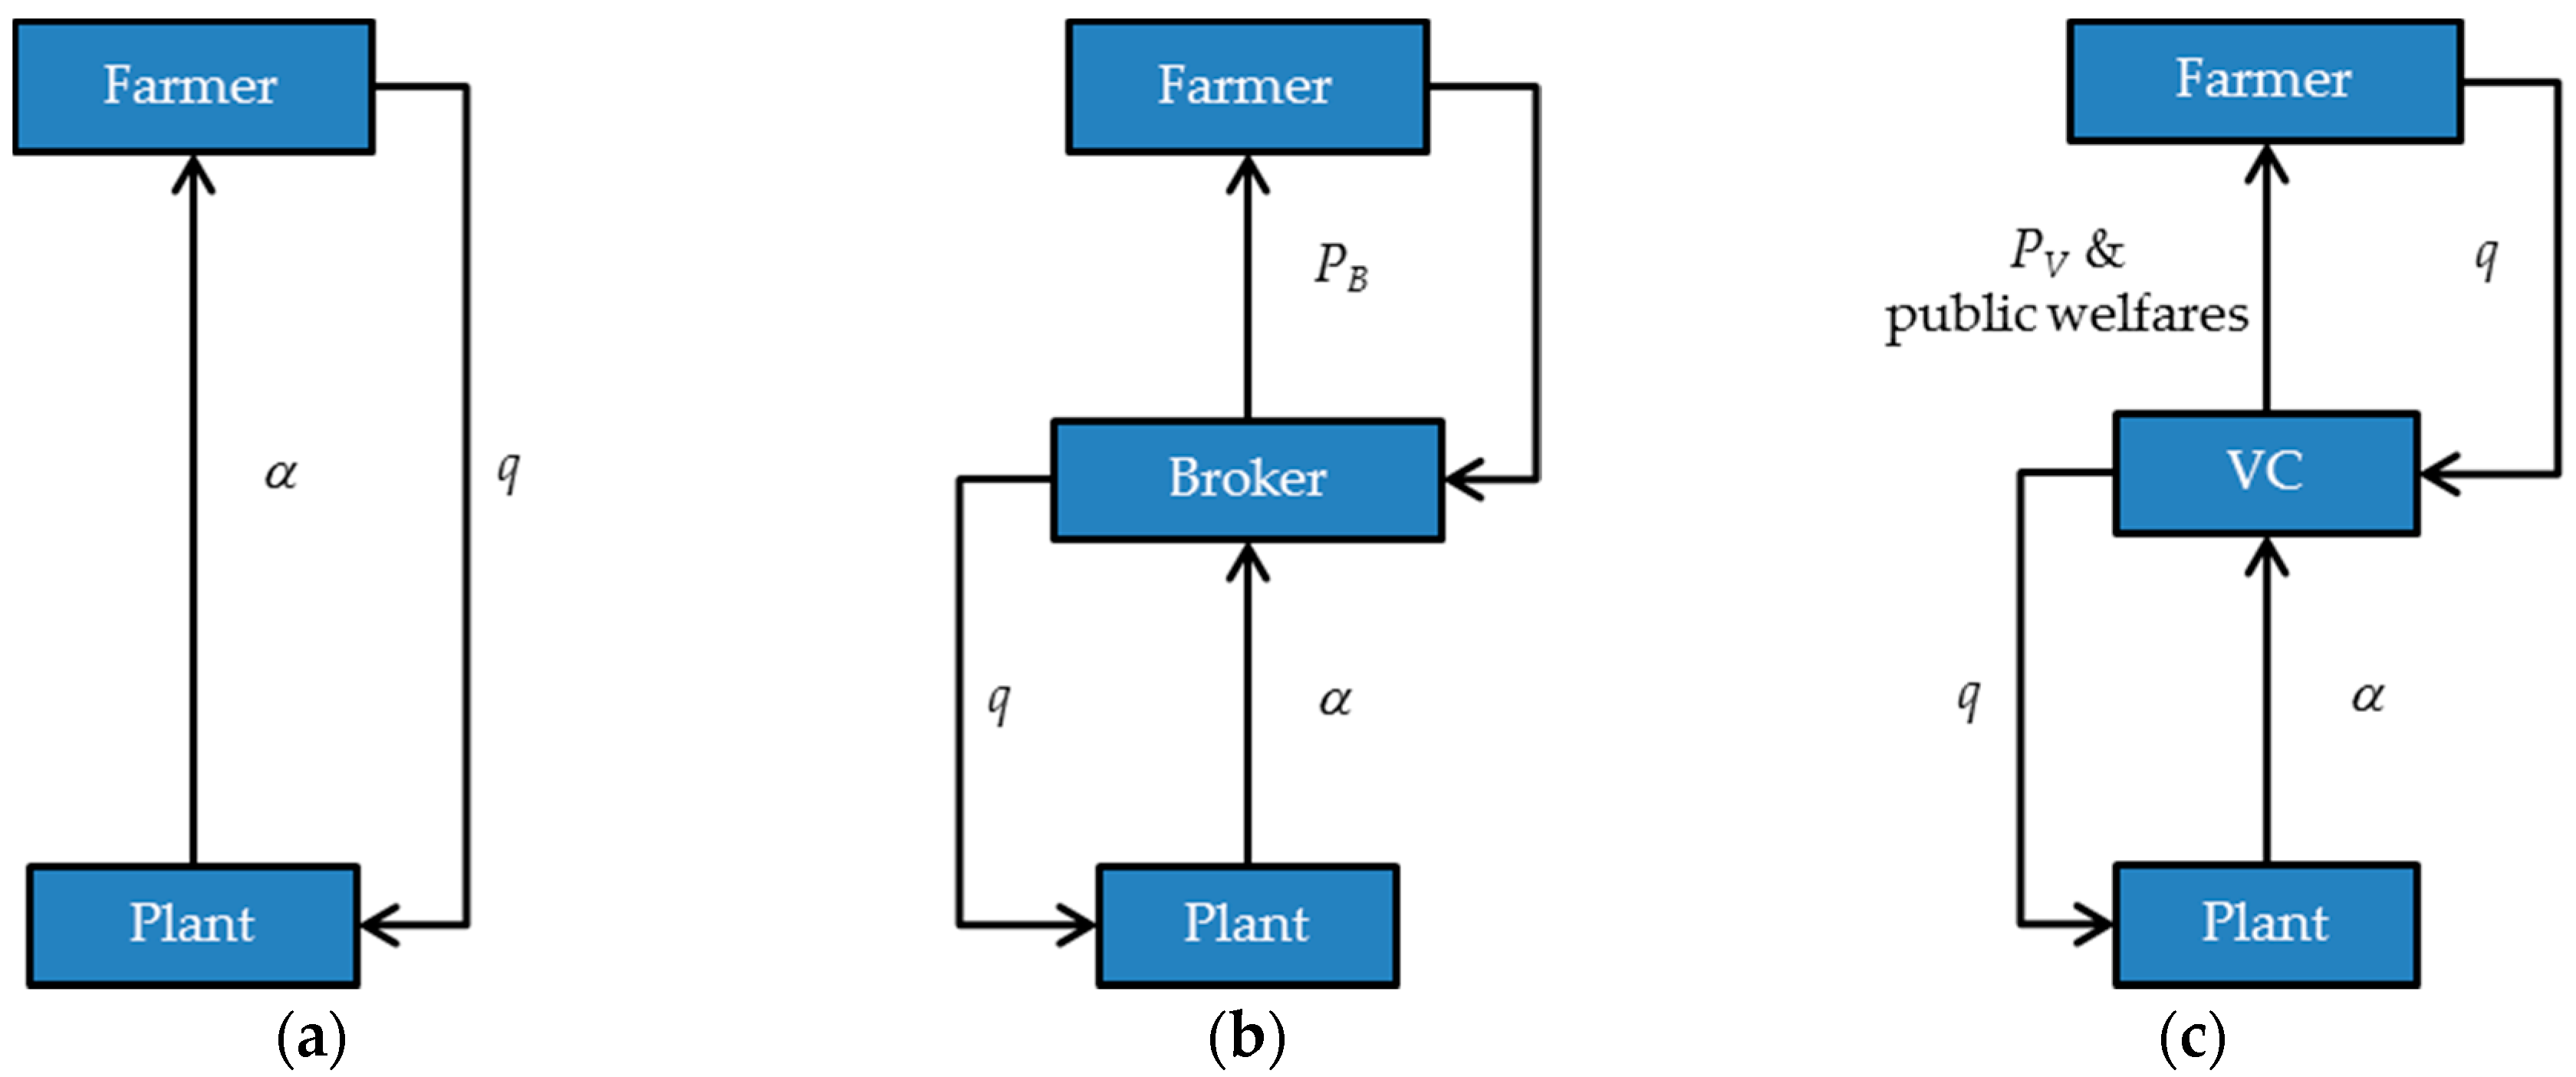
2.1.1. Direct-Deal Model (DDM)

In the DDM, we consider a game involving two players: the biomass-based power plant (player P ), and the farmer who supplies the biomass material (player F ). As a result of the interactions between the two players, the game is played sequentially (Figure 2a). Although the grid company, which in China has the monopoly of electric distribution, is an important stakeholder in the biomass-based power supply chain, we do not put an emphasis on it in this paper because the overall power based on renewable energy sources is ensured to be purchased by the grid company [27] and the feed-in tariff of biomass-based power is within the fixed benchmarking price policy [28].
The biomass-based plant moves first and announces its purchasing policy of crop residues to the farmer. Knowing this, the farmer then decides the quantity of these resources that he is willing to sell to the plant. We assume that the plant announces biomass purchasing price to the participating farmer specifying a mechanism P P (in Yuan/t) (Yuan represents the monetary unit of China), i.e., a formula that provides a premium price for the farmer, with respect to the market price of biomass material, to stimulate biomass supply for power generation:
P P = P m ( 1 + α ) ,
where P m is the market price of biomass feedstock (Yuan/t), reflecting its best alternative use; α the plant’s incentive coefficient for feedstock.
In this paper, a player’s payoff is formulated with the Cobb-Douglas utility function, because any monotonic transform of this function in the game-theoretic deduction represents the same preferences:
U = R α W β ,
subject to α + β = 1 , where R denotes monetary benefit; W non-monetary benefit. Particularly, when the player only considers monetary benefit, α = 1 and β = 0 .
In the light of Figure 2a, decision problems of these two players, located at nodes of the chain, are identified as follows (with α and q as decision variables of the plant and farmer, respectively).
Plant—we consider monetary profit as the plant’s utility, so the profit-maximization problem of the plant is given by [29]:
max α 0   π P ( α ) = ( P e O C ) γ q P P q C s q ,
subject to P P = P m ( 1 + α ) , where P e is the feed-in tariff for biomass-based electricity; O C the plant’s operation cost per unit of generated electricity (Yuan/kWh); γ the conversion ratio of biomass feedstock to electricity (kWh/t); q the amount of biomass converted to electricity by the plant (t); C s storage cost per unit of biomass material (Yuan/t).
Model (1) describes the plant’s decision-making behavior of the amount of incentive to offer to the farmer. The quantity of biomass feedstock received from the farmer, as a result of such an incentive, will correspond to the plant’s electricity production level, γ q .
Farmer—based on the plant’s proposed contract, the farmer decides about his level of biomass supply for generation. The cost function for supplying biomass material is denoted by c q ( q ) , including two parts of collection and shipping cost. We assume it is convex increasing and satisfying c q ( 0 ) = 0 . To ease the computational burden, it is assumed to be approximated in a satisfactory manner by a quadratic function, i.e.,
c q ( q ) = 1 2 C q q 2 C l 1 L q ,
where C q is the cost coefficient of collection cost; C l 1 the farmer’s transportation cost per unit of distance and biomass amount (Yuan/t·km), with his own farm vehicle; L the shipping distance (km).
Because the farmer only has monetary benefit in the direct-deal model, his utility optimization problem then reads as follows:
max q 0   u F ( q ) = P P q c q ( q ) ,
subject to P P = P m ( 1 + α ) .

2.1.2. Broker Model (BM)

In the same spirit as the DDM, the sequential BM game is played as Figure 2b, involving three players: the biomass-based plant (player P ), the biomass feedstock broker (player B ) and the farmer (player F ).
The plant firstly offers the purchasing price mechanism to the broker as Equation (1). Given that, the broker announces his purchasing price to the farmer. The farmer finally makes the decision of biomass supply amount. Decision problems of these three players are described as follows (with α , P B and q as decision variables of the plant, the broker and the farmer, respectively).
Plant—unlike in the DDM, the duty of storage is taken by the broker, which including drying, bundling and storage of biomass, so the plant’s cost is assumed to include the biomass purchasing cost. The profit-optimization problem of the plant is presented as:
max α 0   π P ( α ) = ( P e O C ) γ q P P q ,
subject to P P = P m ( 1 + α ) .
Broker—because the feedstock newly purchased from farmers is with high moisture, the broker is generally required to dry the biomass feedstock in the sun so that the moisture could be lowered to the satisfactory degree. In addition, for the convenience of transportation, the broker tends to bundle and package the biomass, which is also tractable for the feedstock pre-treatment of the plant. The broker’s costs contain three parts of the biomass purchasing, shipping and storage costs:
c B ( q ) = P B q ( C l 2 L + C s ) q ,
where C l 2 is the broker’s transportation cost per unit of distance and biomass amount (Yuan/t·km), with trucks of his own or rented.
The broker’s objective is to maximize his profit, so his profit optimization problem is given by [21]:
max P B 0   π B ( P B ) = P P q c B ( q ) ,
subject to P P = P m ( 1 + α ) .
Farmer—because the broker takes the storage duty, only the collection cost is included. In the BM, the farmer’s utility optimization problem then reads as follows:
max q 0   u F ( q ) = P B q 1 2 C q q 2 ,
subject to P P = P m ( 1 + α ) .

2.1.3. Villagers’ Committee Model (VCM)

VCM is a novel model of the biomass-based power supply chain that we proposed. In this model, farmers are organized by the VC to collect crop residues. On the one hand, the VC eases the plant’s negotiation burden since the plant does not have to deal with the plenty of dispersed farmers. On the other hand, the VC is a nonprofit organization, which could provide more public welfares with the revenue from selling residues.
As seen in Figure 2c, the biomass-based plant moves first in this supply model and announces its purchasing price of crop residues to the VC as Equation (1). Knowing this, the VC announces its purchasing price to the farmer who then decides the quantity of these resources that he is willing to supply. Decision problems of these three player are described as follows (with α , P V and q as decision variables of the plant, the VC and the farmer, respectively).
Plant—the profit-optimization problem of the plant in the VCM is as Equation (6).
VC—since the VC is a nonprofit organization, the utility-optimization problem reflects its performance appraisal system. The system demonstrates the dual roles which are agents both representing villagers’ interests and executing the government’s policies. Due to the urban-rural economic dualism, public infrastructure in rural areas is backward, such as roads, education and medical cares, especially in the inland China. In addition, the state government puts more and more emphasis on the ecological civilization in its policies, as mentioned in Section 1. The VC’s work is affected by political incentive from compulsory requirement by higher levels of government, which is the difference between VCs and private brokers. Thus, the VC’s utility is assumed to contain the two parts of public services and environmental improvement. Its utility optimization problem then reads as follows:
max P V 0   u V ( P V ) = [ P P q P V q ( C l 2 L + C s ) q ] A q B ,
subject to P P = P m ( 1 + α ) and A + B = 1 , where A denotes the weight that the VC’s performance appraisal system puts on public welfare; B the utility weight that the VC puts on environmental improvement represented by the amount of biomass.
Farmer—compared with in the two conventional supply models, the farmer’s utility in the VCM contains two parts, the profit from selling biomass, and the public welfare improvement:
max q 0   u F ( q ) = ( P V q 1 2 C q q 2 ) M [ P P q P V q ( C l 2 L + C s ) q ] N ,
subject to P P = P m ( 1 + α ) and M + N = 1 , where M denotes the farmer’s utility weight on his net income; N the farmer’s utility weight on the public welfare improvement.

2.2. Equilibriums

The solution approach of such sequential games is the backward induction founded on the recognition that a leader player can anticipate the response of the follower to its strategic choice. Thus, we calculate equilibriums of these three games by starting from followers’ decision problems to identify their best response functions to leaders’ strategies. In addition, then, by replacing these response functions in leaders’ problems we proceed to compute equilibriums of these games, i.e., subgame-perfect Nash equilibriums. In our case, we seek equilibriums that no player can benefit by changing unilaterally its decision.

2.2.1. Direct-Deal Model

According to Figure 2a, we should start from the farmer’s problem and proceed backward towards the plant as the initiating player of this game. The result of such a backward induction is stated in Equation (18). Equations (12) and (15) characterize the optimal strategy of the farmer and the plant, respectively.
The farmer’s optimal strategy of supplying biomass for electricity generation q * is given by:
q * = { q 1 * 0 < P m < C l 1 L q 2 * P m C l 1 L ,
where
q 1 * = { P m ( 1 + α ) C l 1 L C q ( α C l 1 L P m 1 ) 0 ( 0 α < C l 1 L P m 1 ) ,
q 2 * = P m ( 1 + α ) C l 1 L C q .
This presents that if the biomass market price or the incentive by the plant exceeds certain values, the farmer’s supply function, i.e., the optimal quantity that the farmer is willing to supply for electricity generation, depends positively on the market price ( P m ) and the incentive offered by the plant ( α ). As expected, this quantity decreases with collection and transportation costs.
Provided the farmer’s supplying action, the plant’s pricing strategy α * is given by:
α * = { α 1 * 0 < P m < C l 1 L α 2 * P m C l 1 L ,
where
α 1 * = { ( P e O C ) γ + C l 1 L C s 2 P m 1 ( P e C s + C l 1 L γ + O C ) C l 1 L P m 1 ( 0 < P e < C s + C l 1 L γ + O C ) ,
α 2 * = { ( P e O C ) γ + C l 1 L C s 2 P m 1 ( P e 2 P m + C s C l 1 L γ + O C ) 0 ( 0 < P e < 2 P m + C s C l 1 L γ + O C ) .
The above function states that when the feed-in tariff for the biomass-based electricity exceeds a certain level, the optimal incentive α offered by the plant increases, if it can attain a better feed-in tariff, and also if its productivity is improved, i.e., higher γ , lower O C and C s . The incentive will decline when biomass becomes more expensive and transporting it costs less.
The sequential Nash equilibrium of the game is as follows:
E D D M = { E D D M 1 C 1  and  C 2 E D D M 2 E D D M 3 C 3 C 4 ,
where
E D D M 1 = ( ( P e O C ) γ + C l 1 L C s 2 P m 1 ( P e O C ) γ ( C l 1 L + C s ) 2 C q ) ,
E D D M 2 = ( C l 1 L P m 1 0 ) ,
E D D M 3 = ( 0 P m C l 1 L C q ) ,
and
C 1 : 0 < P m < C l 1 L  and  P e C s + C l 1 L γ + O C ,
C 2 : P m C l 1 L  and  P e 2 P m + C s C l 1 L γ + O C ,
C 3 : 0 < P m < C l 1 L  and  0 < P e < C s + C l 1 L γ + O C ,
C 4 : P m C l 1 L  and  0 < P e < 2 P m + C s C l 1 L γ + O C .
Note that depending on the biomass market price and the biomass-based electricity feed-in tariff, the subgame perfect Nash equilibrium is either E D D M 1 , E D D M 2 and E D D M 3 . In the general case, E D D M 1 happens when the feed-in tariff is high enough. When the tariff is not that high, we face E D D M 2 or E D D M 3 , where the farmer supplies no biomass or only a small quantity.

2.2.2. Broker Model

Referencing to the induction process in the DDM model, we have the optimal strategy of the farmer, the broker and the plant, respectively, as Equations (26), (27) and (30), and the subgame perfect Nash equilibrium as Equation (33).
The farmer’s optimal decision of supplying biomass for electricity generation q * is given by:
q * = P B C q .
It means that the optimal supply amount depends positively on the broker’s purchasing price and negatively on the biomass collection cost.
Given the response function above, the broker’s pricing decision P B is presented by:
P B * = { P B 1 * 0 < P m C l 2 L + C s P B 2 * P m > C l 2 L + C s ,
where
P B 1 * = { P m ( 1 + α ) ( C l 2 L + C s ) 2 ( α C l 2 L + C s P m 1 ) 0 ( 0 α < C l 2 L + C s P m 1 ) ,
P B 2 * = P m ( 1 + α ) ( C l 2 L + C s ) 2 .
This shows that if the biomass market price or the incentive by the plant exceeds certain values, the optimal price that the broker is willing to offer depends positively on the market price ( P m ) and the incentive offered by the plant ( α ), negatively on the transportation and storage costs.
The plant’s optimal pricing strategy for biomass feedstock is given by:
α * = { α 1 * 0 < P m C l 2 L + C s α 2 * P m > C l 2 L + C s ,
where
α 1 * = { ( P e O C ) γ + ( C l 2 L + C s ) 2 P m 1 ( P e C l 2 L + C s γ + O C ) C l 2 L + C s P m 1 ( 0 < P e < C l 2 L + C s γ + O C ) ,
α 2 * = { ( P e O C ) γ + ( C l 2 L + C s ) 2 P m 1 ( P e 2 P m ( C l 2 L + C s ) γ + O C ) 0 ( 0 < P e < 2 P m ( C l 2 L + C s ) γ + O C ) .
Compared with Equation (15), this response function is only different in that the relationship between the incentive and the storage cost is reversed, which means the incentive increases with higher storage cost. It is because the broker takes the job of storage.
The sequential Nash equilibrium of the game is as follows:
E B M = { E B M 1 C 1  and  C 2 E B M 2 E B M 3 C 3 C 4 ,
where
E B M 1 = ( ( P e O C ) γ + ( C l 2 L + C s ) 2 P m 1 ( P e O C ) γ ( C l 2 L + C s ) 4 ( P e O C ) γ ( C l 2 L + C s ) 4 C q ) ,
E B M 2 = ( C l 2 L + C s P m 1 0 0 ) ,
E B M 3 = ( 0 P m ( C l 2 L + C s ) 2 P m ( C l 2 L + C s ) 2 C q ) ,
and
C 1 :   0 < P m C l 2 L + C s  and  P e C l 2 L + C s γ + O C ,
C 2 :   P m > C l 2 L + C s  and  P e 2 P m ( C l 2 L + C s ) γ + O C ,
C 3 :   0 < P m C l 2 L + C s  and  0 < P e < C l 2 L + C s γ + O C ,
C 4 :   P m > C l 2 L + C s  and  0 < P e < 2 P m ( C l 2 L + C s ) γ + O C .
Similar to the equilibrium in the DDM, E B M happens depending on the biomass market price and the biomass-based electricity feed-in tariff. Only when the tariff exceeds a certain level, the general case E B M 1 will take place. Otherwise, if the market price is low, the transaction will break; or if the market price is high, the biomass supply amount will be small.

2.2.3. Villagers’ Committee Model

In the VCM, the farmer’s optimal decision of supplying biomass for electricity generation q * is given by:
q * = 2 P V ( M + 1 ) C q ,
This shows that in this novel supply model, the optimal supplying quantity has relationship not only with the purchasing price offered by the VC and the collection cost, but also with the farmer’s utility weight on net income. The quantity grows if the utility weight descends.
Given the farmer’s response function above, the VC’s pricing decision P V is presented by:
P V * = { P V 1 * 0 < P m C l 2 L + C s P V 2 * P m > C l 2 L + C s ,
where
P V 1 * = { P m ( 1 + α ) ( C l 2 L + C s ) A + 1 ( α C l 2 L + C s P m 1 ) 0 ( 0 α < C l 2 L + C s P m 1 ) ,
P V 2 * = P m ( 1 + α ) ( C l 2 L + C s ) A + 1 .
We can find that besides the biomass market price, the plant’s incentive and the transportation and the storage costs, weight of the VC’s performance appraisal system on public welfares also affects the VC’s optimal price. When the incentive is intense enough, the VC’s optimal price depends negatively on that weight.
The plant’s optimal pricing strategy for biomass feedstock is given by:
α * = { α 1 * 0 < P m C l 2 L + C s α 2 * P m > C l 2 L + C s ,
where
α 1 * = { ( P e O C ) γ + ( C l 2 L + C s ) 2 P m 1 ( P e C l 2 L + C s γ + O C ) C l 2 L + C s P m 1 ( 0 < P e < C l 2 L + C s γ + O C ) ,
α 2 * = { ( P e O C ) γ + ( C l 2 L + C s ) 2 P m 1 ( P e 2 P m ( C l 2 L + C s ) γ + O C ) 0 ( 0 < P e < 2 P m ( C l 2 L + C s ) γ + O C ) .
Note that the response function of the plant’s optimal incentive is identical to that in the BM, which has no relationship with the VC’s and the farmer’s utility preferences.
Considering the functions above, the sequential Nash equilibrium of the game is as follows:
E V C M = { E V C M 1 C 1  and  C 2 E V C M 2 E V C M 3 C 3 C 4 ,
where
E V C M 1 = ( ( P e O C ) γ + ( C l 2 L + C s ) 2 P m 1 ( P e O C ) γ ( C l 2 L + C s ) 2 ( A + 1 ) ( P e O C ) γ ( C l 2 L + C s ) ( A + 1 ) ( M + 1 ) C q ) ,
E V C M 2 = ( C l 2 L + C s P m 1 0 0 ) ,
E V C M 3 = ( 0 P m ( C l 2 L + C s ) A + 1 2 [ P m ( C l 2 L + C s ) ] ( A + 1 ) ( M + 1 ) C q ) ,
and
C 1 :   0 < P m C l 2 L + C s  and  P e C l 2 L + C s γ + O C ,
C 2 :   P m > C l 2 L + C s  and  P e 2 P m ( C l 2 L + C s ) γ + O C ,
C 3 :   0 < P m C l 2 L + C s  and  0 < P e < C l 2 L + C s γ + O C ,
C 4 :   P m > C l 2 L + C s  and  0 < P e < 2 P m ( C l 2 L + C s ) γ + O C .

3. Agent-Based Modeling

With the game theoretical analysis above, an agent-based model is developed in this section to study the effectiveness of the VCM and to find the appropriate VCM mechanism. First, the overall simulation framework is formulated in Section 3.1. Second, the action rules of the intelligent agents are described in detail in Section 3.2.

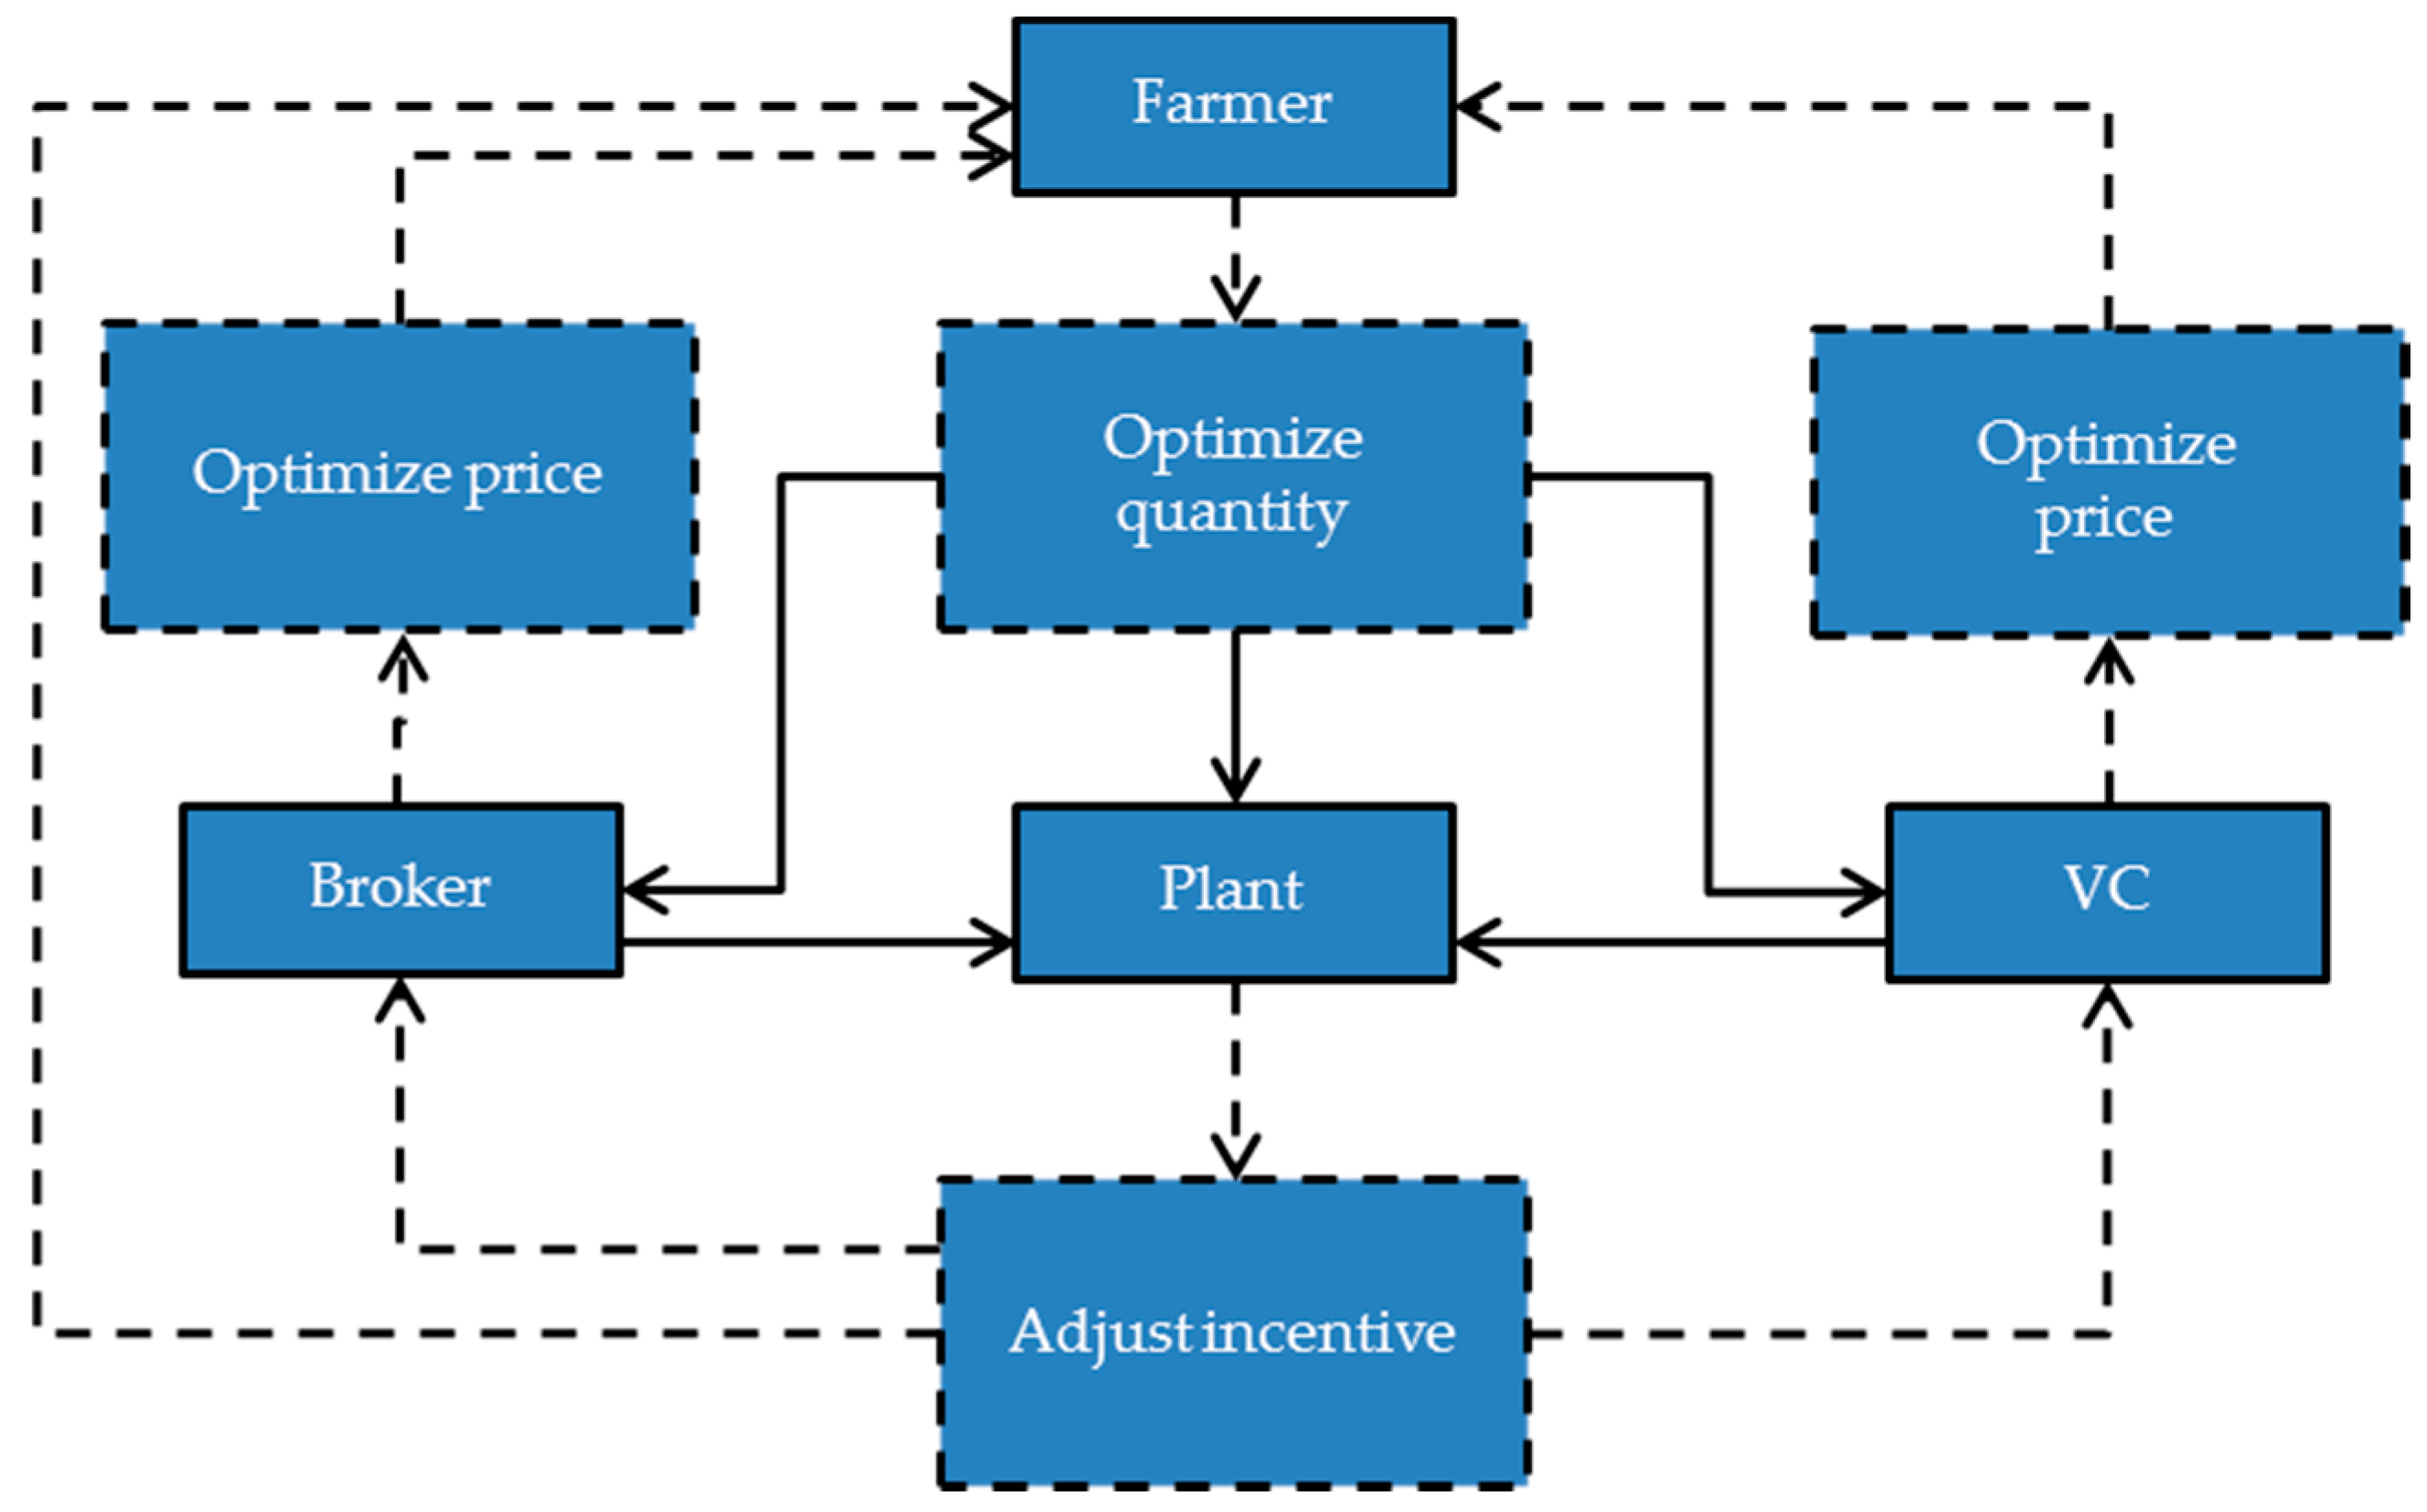
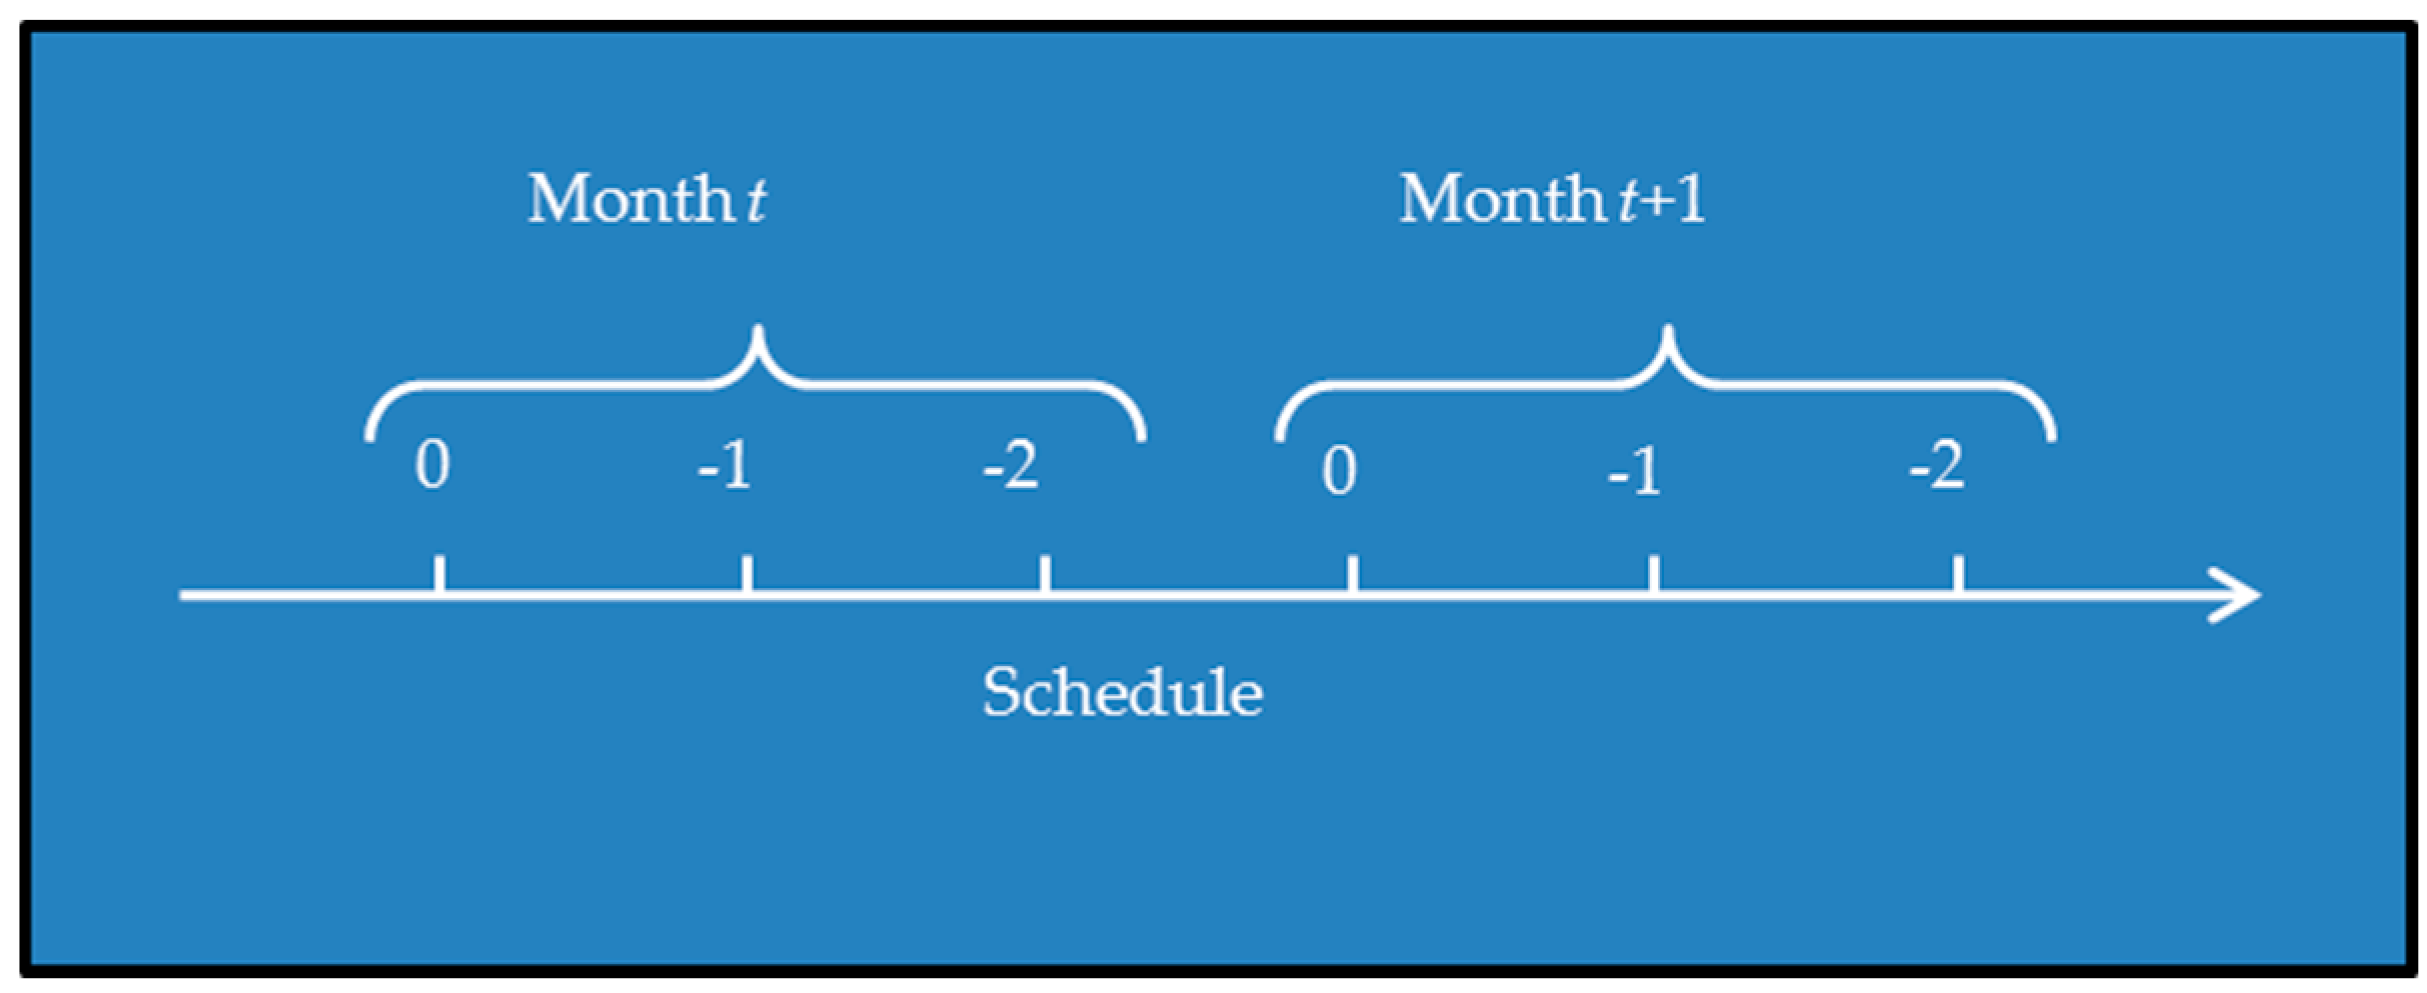
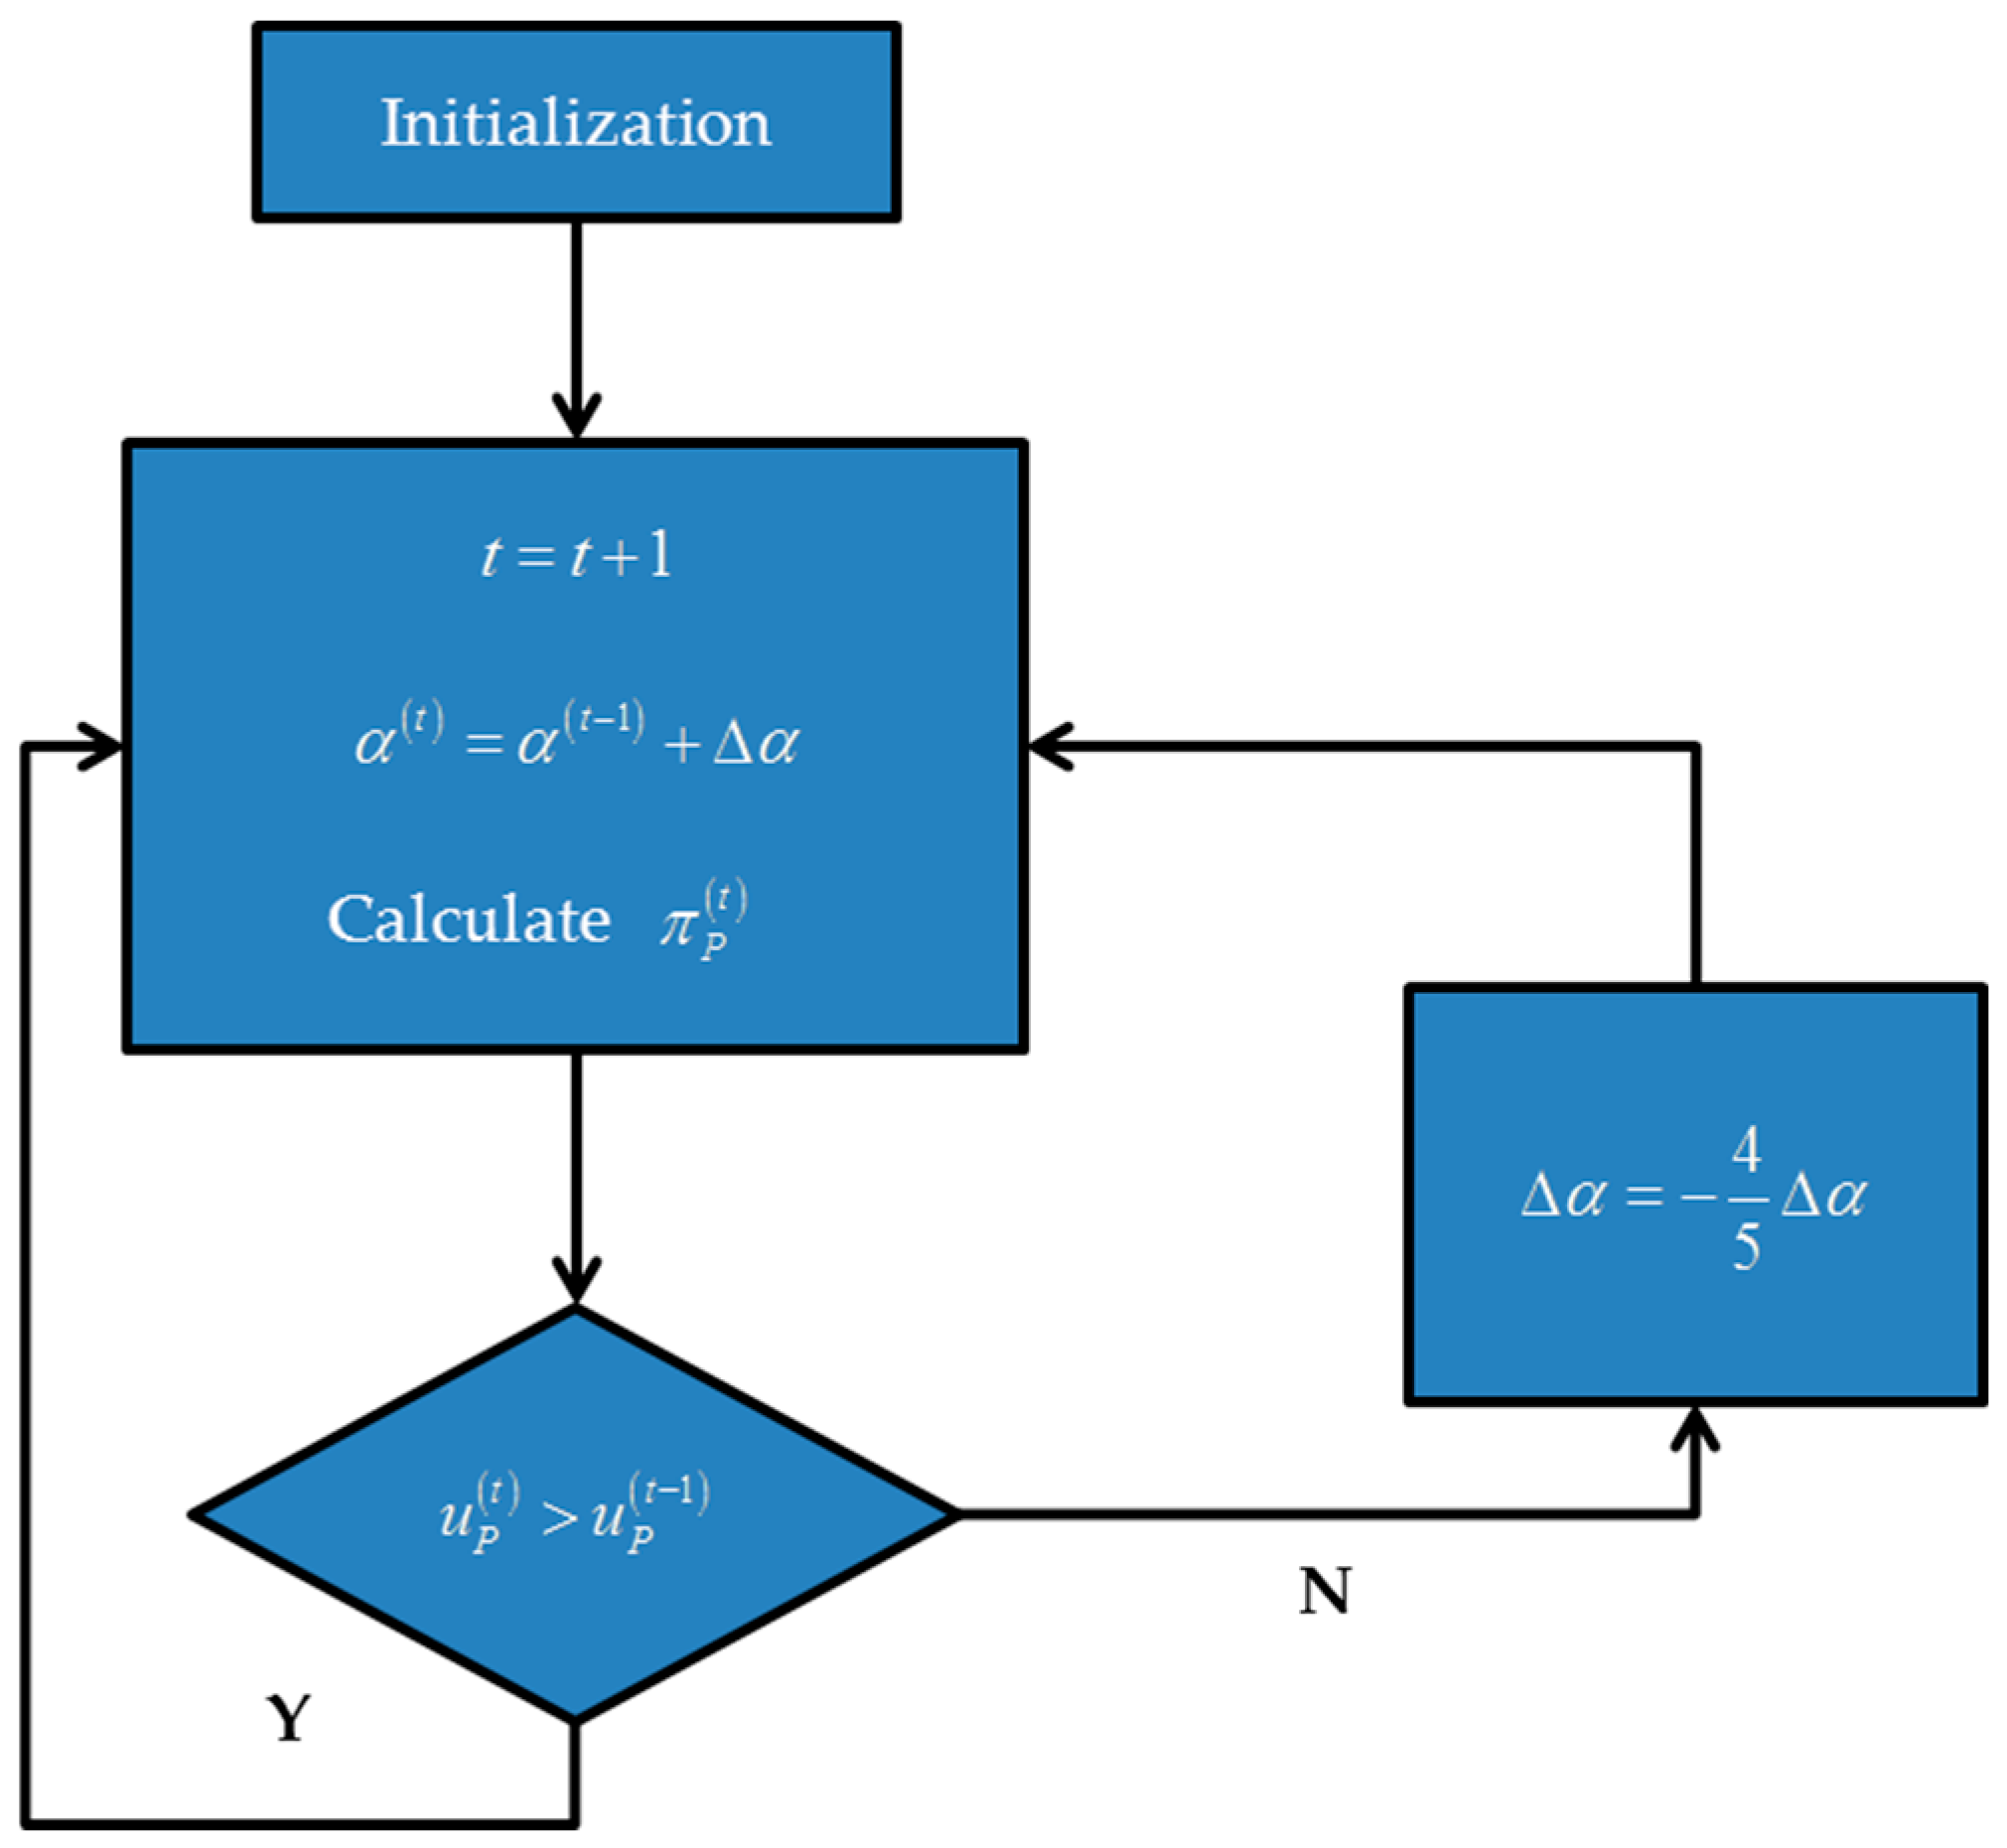
3.1. Simulation Framework

A description of the overall logic of our simulation is provided in this section. The interaction relationships amongst the different agents in the three supply models are modeled as a set of autonomous agents who optimize their behavior in economic environment characterized by features in biomass-based power supply chains. To this end, Figure 3 shows an activity diagram of our biomass feedstock supply chains. These supply chains are driven by both the physical movement of biomass feedstock (indicated by solid arrows) from individual farmer up through to the plant, as well as with information flows across agents (indicated by dotted arrows). Each participant in the supply chains collects relevant information for decision making. To start every trading, the plant dynamically adjusts the incentive based on the profit growth from previous rounds. In turn, receivers of the incentive information choose their strategies: the farmer decides the optimal biomass quantity in the DDM; the broker and the VC optimize their price strategies, respectively, in the BM and the VCM. In addition, finally with the end of a complete trading round, there will be a supply amount of biomass, and the agents of the plant, the broker, the VC and the farmer will gain their corresponding utility.
The agent-based simulation program proceeds with the time schedule mechanism, where an agent takes action at a specific time node. We assume one complete trading round happens within a month; and within a trading round, agents behave sequentially by priority ranks (Figure 4). The priority ranks are indicated by ordinal numbers (0, −1 and −2), and if the absolute value of the number is lower, the corresponding behaviors happen earlier (Table 1).

3.2. Agents’ Behaviors

In biomass-based power supply chains, all agents in the economic system choose optimal decisions according to their respective goals and constraints, and make adjustments in accordance with the external environment to improve their adaptability. The action rules of various agents, i.e., the plant, farmer, broker and VC, are provided in detail in this section.
Plant—the biomass-based plant is assumed to rely on crop residues collected in the region for the production of power. The objective of the plant is to increase the profit, i.e., to improve the production capacity represented here in terms of the biomass processed per month, which can be achieved by using as much of the available biomass as possible, and to minimize the production cost by trying to buy the biomass from farmers at the lowest possible price. The plant therefore adjusts the feedstock purchasing price at the beginning of each month using the feedback regulation approach, based on the change of profit (Figure 5), where the plant is assumed to have bounded rationality since it deals with numbers of biomass suppliers. Although a real biomass plant will not modify the price every month, this assumption has been included for the sake of simplicity. The paper also assumes that there is only one biomass-based plant in each supply chain.
Farmer, broker and VC—in this simulation, farmers act collectively as one economic intellectual agent, as well as the broker and VC. Their main activities include receiving the price information from down-stream demander and deciding the optimal values of their own decision variables. Because the number of counterparties they deal with is relatively small, we assume these agents fully rational, i.e., their optimization behaviors comply with the mathematical descriptions in Section 2.2 as Equations (12), (26), (27), (41) and (42), respectively.

4. Case Study

4.1. Data and Parameter Assumptions

The paper considers Shanxian biomass plant and its feedstock supply system as the practical case to study the effectiveness of the proposed supply model. As the China’s first biomass-based power plant invested by the National Bio-energy Group, Shanxian biomass plant went into production on 1 December 2006. It was designed with the installed capacity of 30 MW and the annual generated electricity of 210 million kWh, consuming biomass feedstock of approximately 300,000 t every year [30]. Shanxian is a county covering an area of 1702 km2 with 502 incorporated villages [31] and yielding grain of 850,000 t annually (2015) [32], where the major crops are wheat, corn and cotton. With the average residue/crop ratio of 2 (wheat—1.1, corn—2.0 and cotton—3.0 [33]), the local annual production of crop residues is 1,700,000 t, which is far more enough for the plant’s operation. However, our field investigation found that due to farmers’ low supplying willingness, less than 10% of crop residues were collected as feedstock for electricity generation. Because of the insufficiency of crop residues, the Shanxian biomass plant in recent years has turned to purchase forestry residues (bark, abandoned plywood, etc.) as feedstock, whose proportion at one time reached 60%. The relative high purchasing price and pre-treatment cost of forestry residues result in meager profit status of the plant. Moreover, the disposal of crop residues leads to a lot of wasting of agricultural biomass, and the incineration causes severe air pollution.
For simplicity, we consider crop straw as the major biomass feedstock of the plant. The simulation is programed and operated on the open source agent-based toolkit, RePast Simphony (Argonne National Laboratory, Argonne, IL, USA). Table 2 shows the data and parameters used for the case study simulation, and references have been provided wherever applicable. Note that the average shipping distance of biomass feedstock is assumed to be 15 km as one half of the plant’s designed feedstock supply radius of 30 km. The VC’s weight on environmental improvement is assumed to be 0.2, which is the average level from the studies [34,35,36] on the government’s preference for environmental protection. Angelopoulos et al. [34], and Qi and Hu [35] set the baseline weight on environmental quality in the utility function initially as 0.4 and 0.2, respectively. Tian et al. [36] used the ratio of environmental taxes to Gross Domestic Product (GDP) as the government’s preference for environmental quality, which was 0.1105 based on the data of 31 provinces in China. Chinese governments at various levels have issued relevant documents on comprehensive utilization of straw and prohibitions of crop straw burning. Although climate change and intended nationally determined contributions (INDC) are too far away to the VC, considering that the VC is an agent of the government, which should follow policies of superior government, 0.2 is a reasonable motivation level of the VC to care about eco-system. Zhang and Cai [37] estimated that the coefficient of monetary utility was four times as that of non-monetary benefit (education, pension, etc.). Thus, in this paper the farmer’s weight on net income is estimated as 0.8.

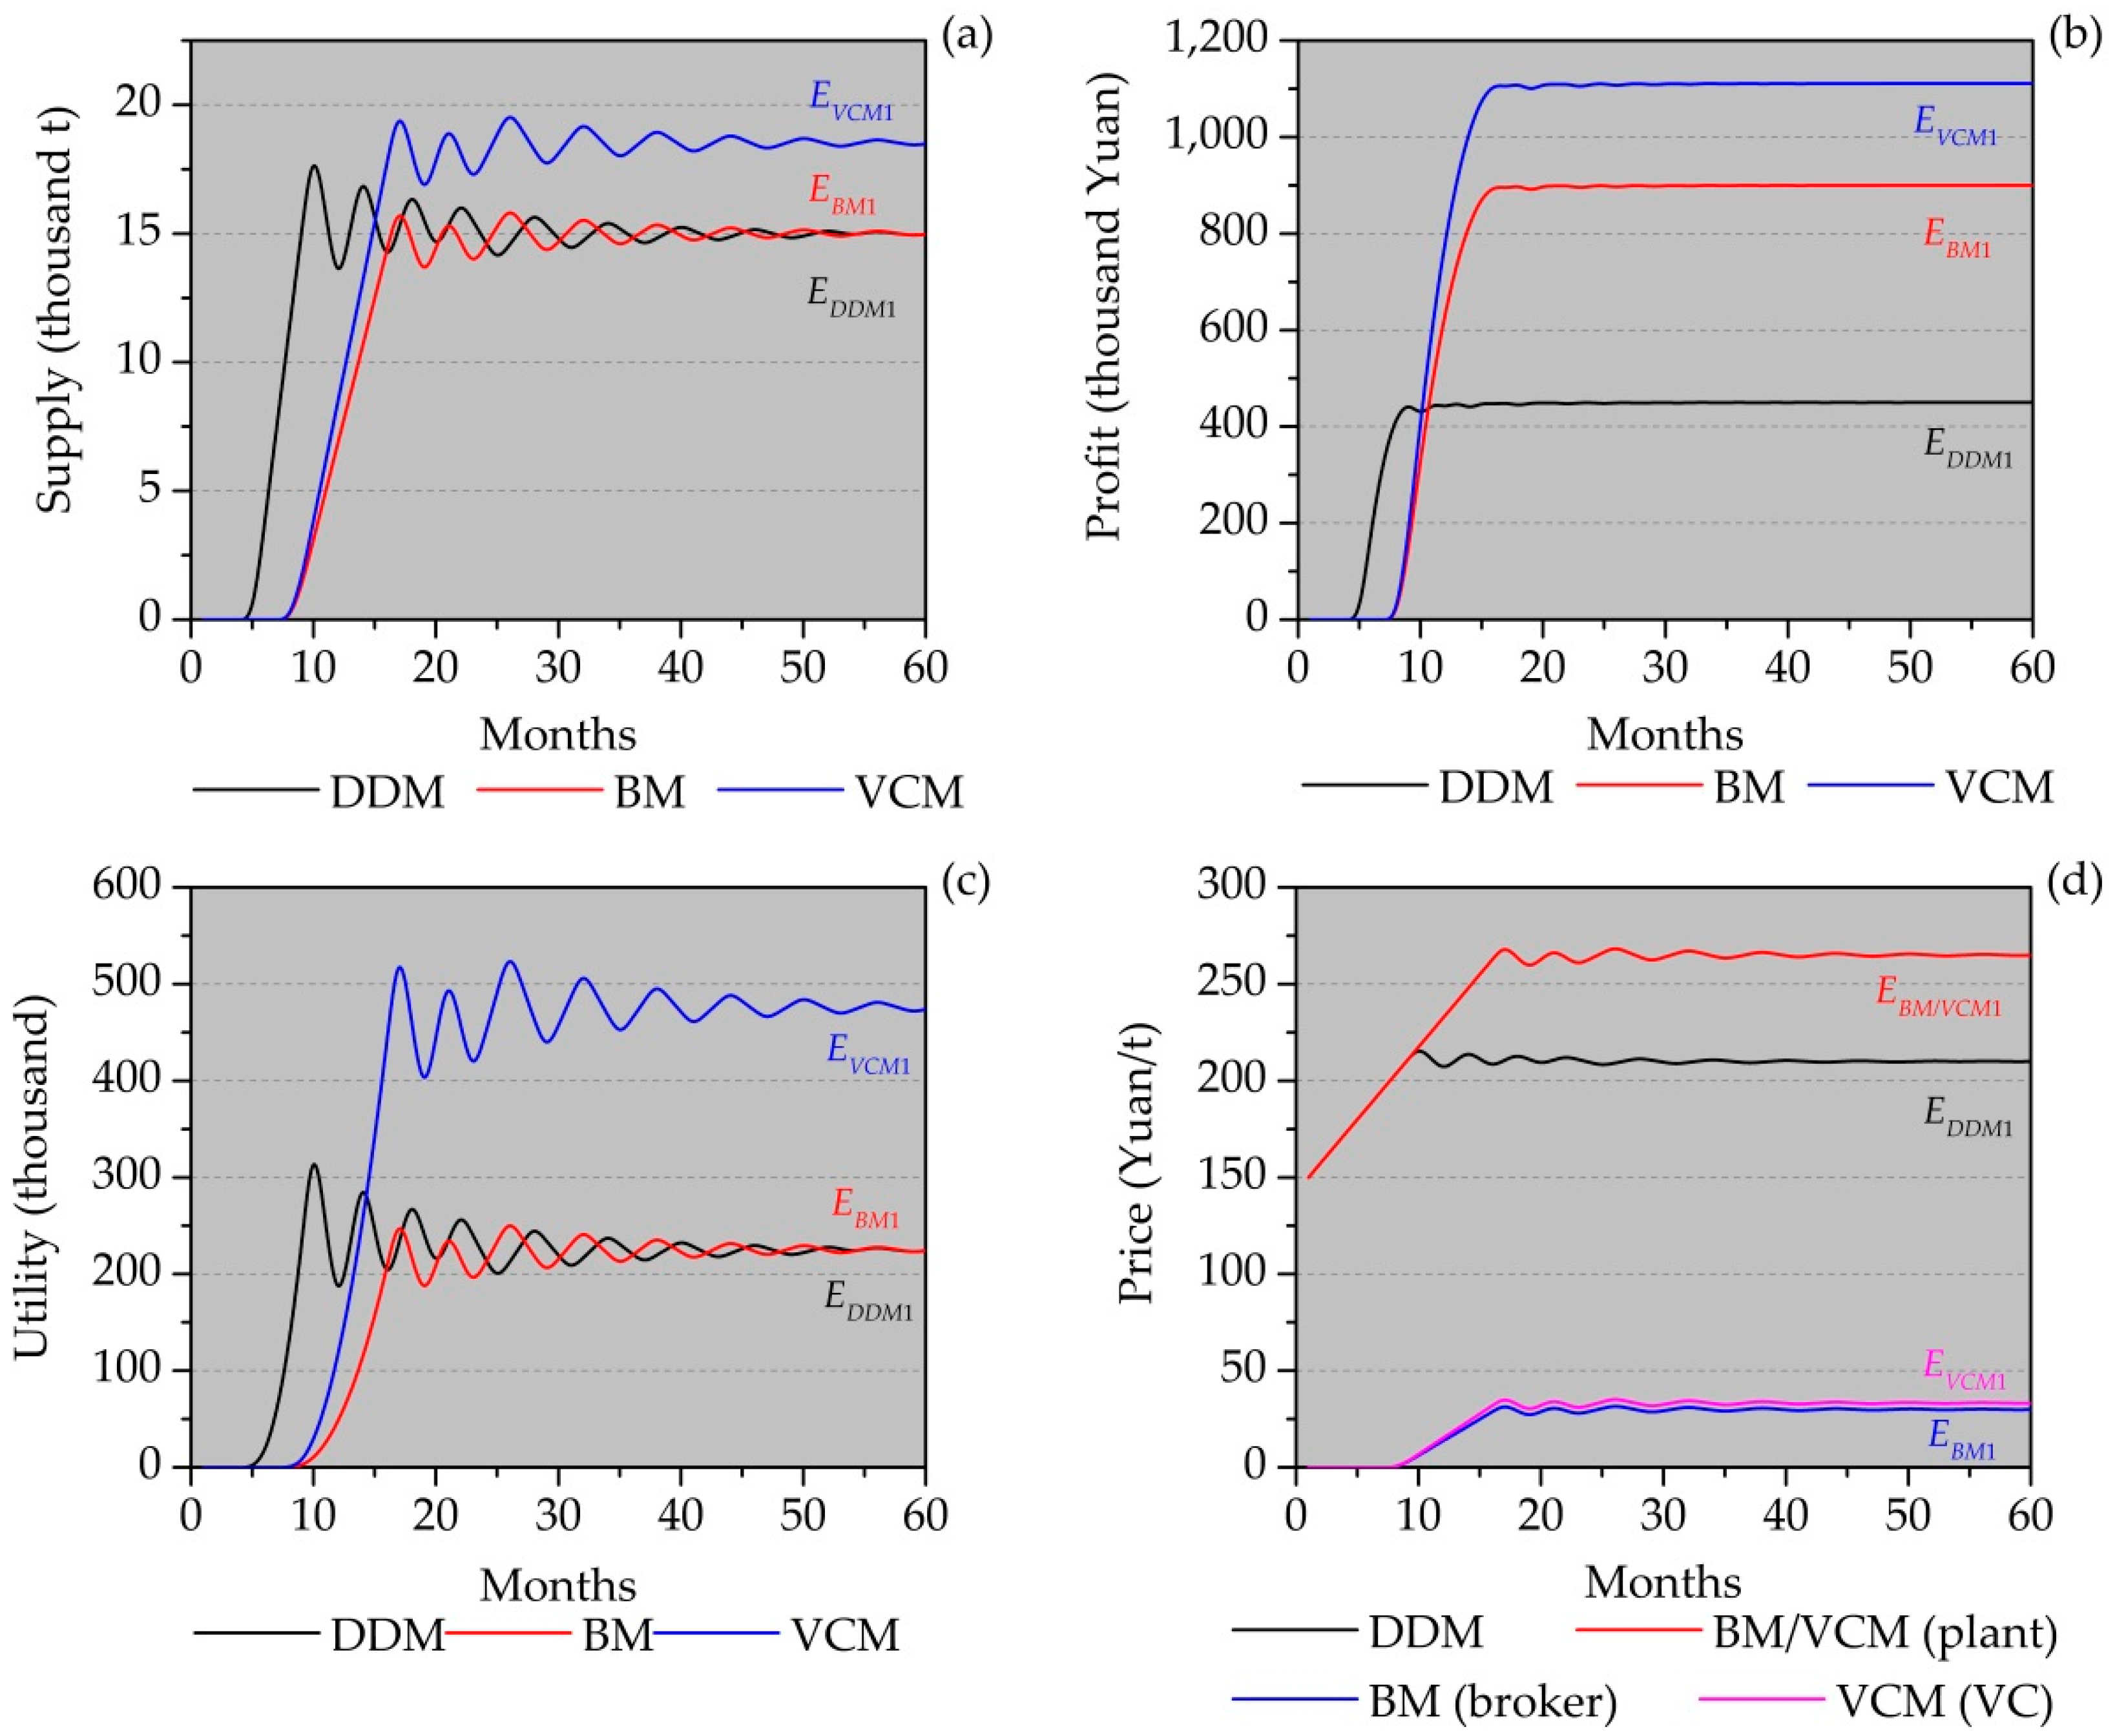
4.2. Simulation Results

Based on the established agent-based models and the data collected within field investigations, we study the impacts of the proposed VCM on straw supply and price, profit of the plant and the farmer’s utility, compared with the performances of the two conventional models, the DDM and the BM.
The plant, farmer, broker and VC agents interact with each other within supply chains through time. Simulated results are presented in a set of figures (Figure 6). All plots in the figures experience certain periods of increasing, then fluctuate up and down, and eventually reach stable at approximately the 40th month (the fluctuation magnitude of supply below 0.25 thousand t, 1% of the designed feedstock assumption in one month). It is because in the assumed conditions, the final stable straw price offered by the plant is higher than the market price; during the feedback regulation proceeding, the plant agent progressively enlarges the incentive coefficient α ; when the system is reaching the stability, the magnitude of adjustment Δ α tends to approach to zero. Before the 10th month, straw supply, profit of the plant and the farmer’s utility in the DDM, as seen in Figure 6a–c, are all higher than those in the BM and the VCM, which are at quite low levels close to zero. The reason is that with equal straw price, the farmer’s expected utility is larger in the DDM than that in the BM and the VCM at the initial stages. After that, the situation changes, especially for the VCM. The final phases witness the curves of VCM are above the other two models. It should be noted that the straw supply of the DDM stabilizes at the level equal to that of the BM, which is the same case with the farmer’s utility. It is possible that at this supply distance, the farmer could expect equivalent utility no matter how he delivers the straw, directly to the plant or to the broker. This speculation will be further discussed in the Section 4.3.2. In addition, the overall changing tendencies of the straw supply plots are identical to those of the farmer’s utility plots. As with the straw price, plants in the BM and the VCM offer equivalent purchasing prices, which are higher than that in the DDM. Because of the lower equilibrium straw price, the system in the DDM reaches stable earlier (the 39th month) than in the BM and the VCM (the 42nd month). Besides, the prices offered by the broker and the VC are fluctuating below the market price, because the purchasing price for the plant includes costs of intermediate links, which the purchasing price for the broker or the VC does not include. Combined with the equilibrium analysis in Section 2.2, the stable states of the three models respectively belong to EDDM1, EBM1 and EVCM1, which are labeled beside the plots, with the base case assumptions.
Table 3 demonstrates the stables values, i.e., the final equilibrium. Compared with the DDM, the VCM show the improvements of straw supply, profit of the plant and the farmer’s utility respectively by 24%, 147% and 112%. In addition, with the BM, this model has the improvements by 24%, 23% and 111%. It is because VCM enhances the farmer’s enthusiasm to provide his own straw and increases the price elasticity of straw supply. The plant is willing to offer higher price for more profit. The farmer could gain more utility if he delivers more straw in VCM. So, finally, although the purchasing cost rises, more straw supply ensures more profit for the plant.

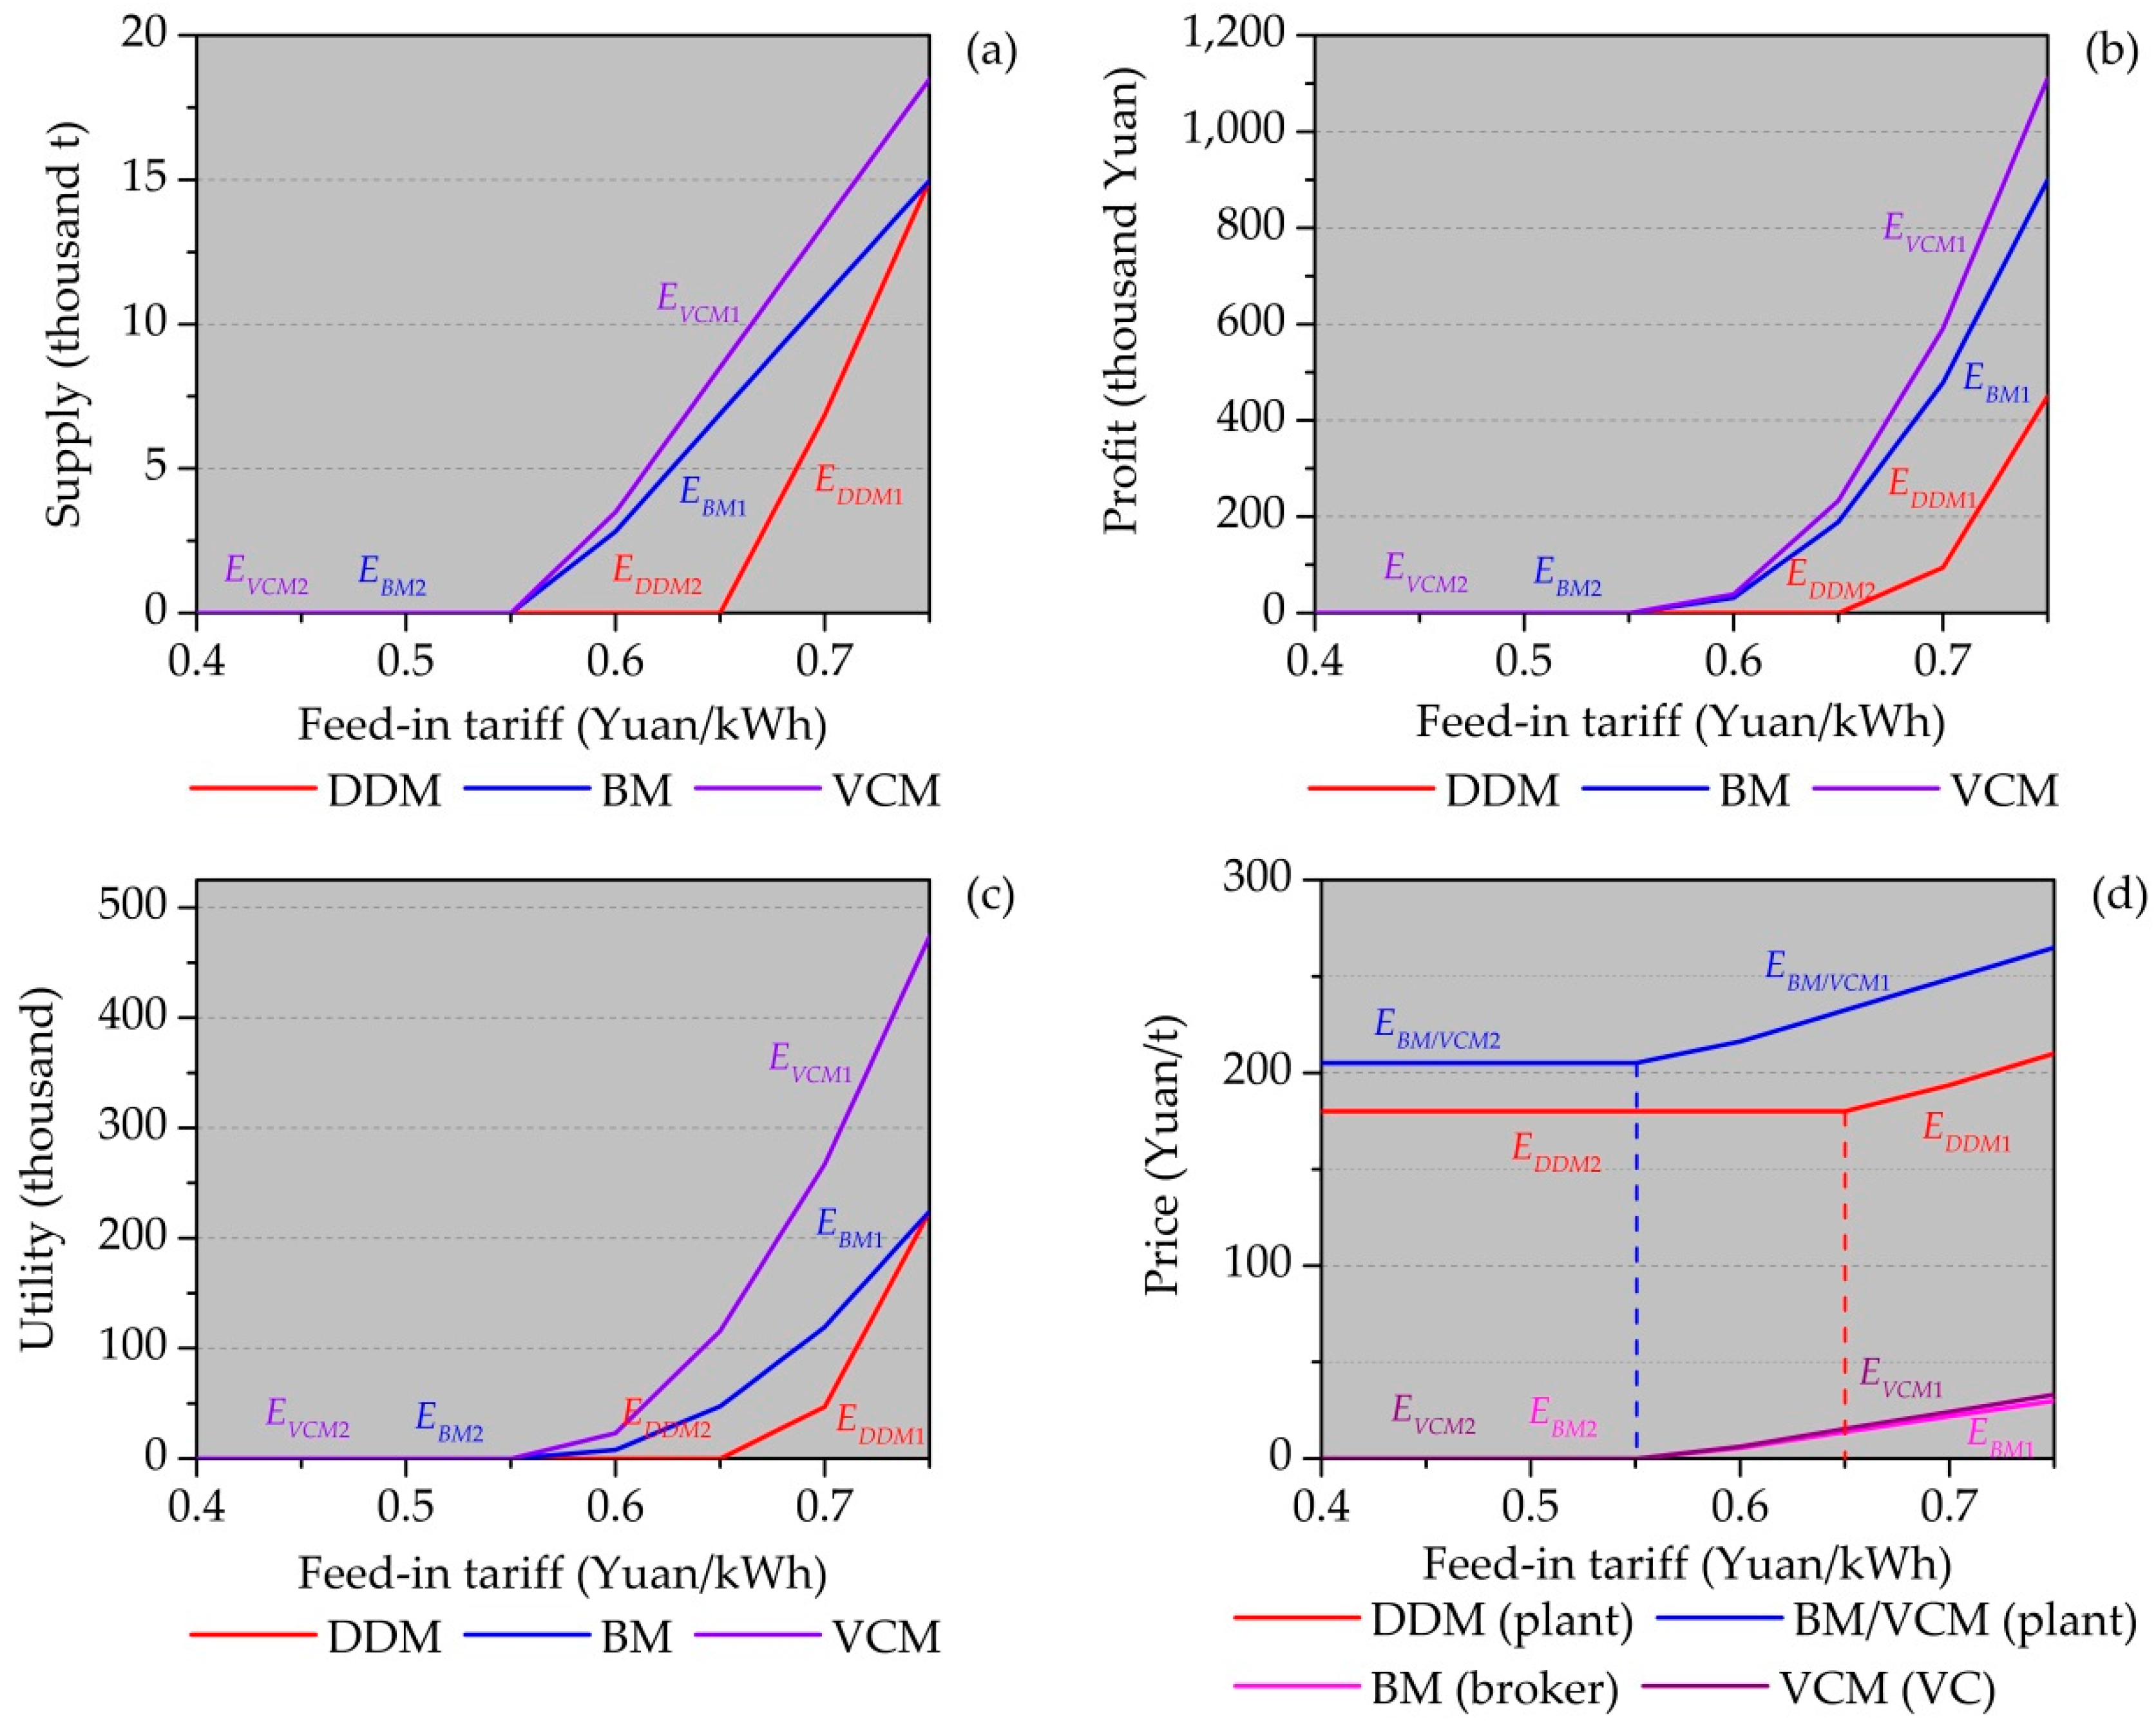
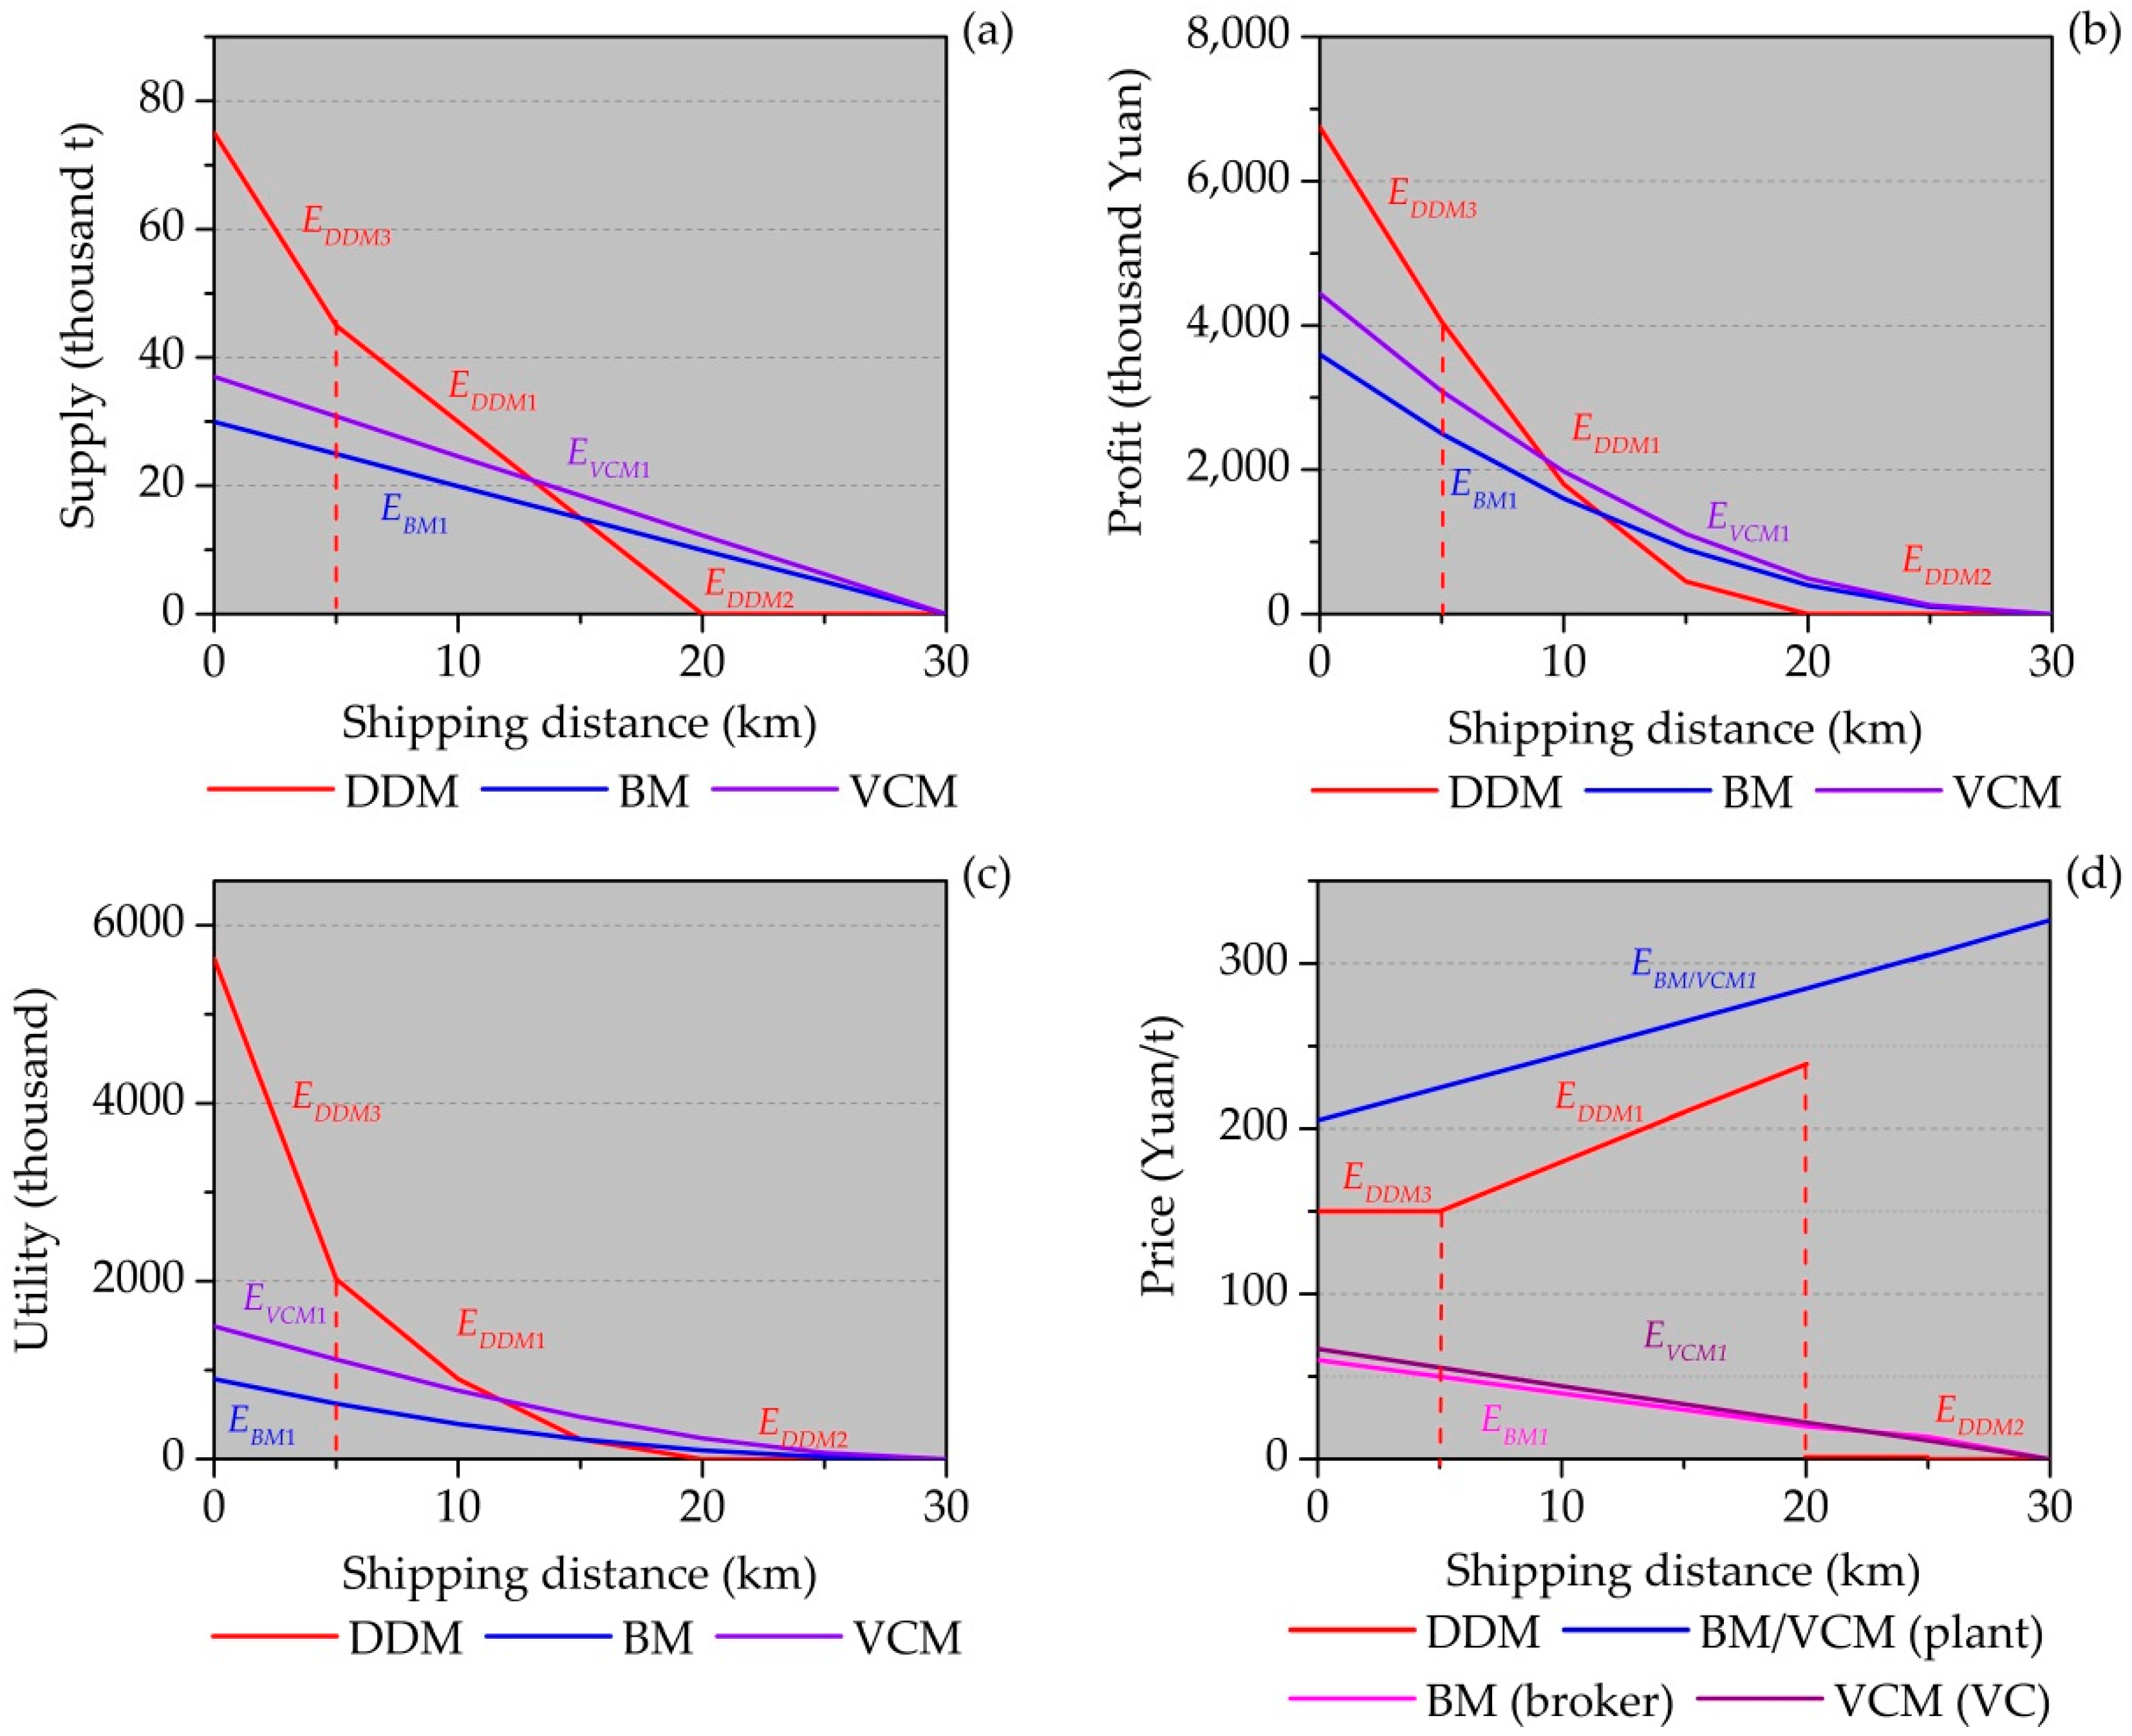
4.3. VCM Design Exploration

To determine an appropriate VCM scheme, three groups of scenarios are designed and simulated with different feed-in tariff, shipping distance, VC’s utility weight on public service and farmer’s utility weight on net income, as the results shown in Section 4.3.1, Section 4.3.2 and Section 4.3.3, respectively.

4.3.1. Preferential Feed-in Tariff

A nation-wide competitive power market has not been established. The feed-in tariff policy is important for the development of renewable energy generation industries, especially for the biomass-based power generation. According to studies [10,38] and our field investigations, the profitability of biomass-based power plants largely depends on the on-grid price. Without the preferential on-grid price, biomass-based plants would be in losses due to high costs. At present, the feed-in tariff for renewable electricity is comprised of the local benchmarking feed-in tariff for coal-fired units with desulfurization and the subsidized price [39]. That policy was promulgated by China’s National Development and Reform Commission (NDRC) in 2006. In addition, NDRC set the benchmarking on-grid price for biomass-based electricity (except for bidding projects) as 0.75 Yuan/kWh in 2010 [28]. There exist controversies among researchers with regard to the preference level. Liu et al. pointed out that with the existing tariff level, the biomass-based generation projects still operate at a loss [9]. Zhao et al. deemed that more detailed feed-in tariff policy should be formulated, including a price index system for different biomass materials and financial subsidy standards for different technologies [11]. However, Zhang et al. indicated that based on the fact that some projects had been profitable, it was inappropriate to promulgate more fiscal subsidies or tax preference policies, and biomass power plants could make profits with current policies if they gain enough feedstock and strengthen internal management [7]. Thus, we try to investigate this issue through the approach of agent-based simulation. Different scenarios are simulated where the on-grid price is set to be from 0.4 Yuan/kWh (the average tariff of coal-fired electricity with desulfurization in Shandong Province [40,41]) to 0.75 Yuan/kWh with the increasing magnitude of 0.05 Yuan/kWh.
The simulation results indicate that the preferential feed-in tariff policy has a positive impact on the performance of the biomass-based power supply chain. The equilibriums in the three models experience the switches from EDDM2 to EDDM1, EBM2 to EBM1 and EVCM2 to EVCM1, respectively (Figure 7). When the tariff exceeds certain levels, straw supply, profit of the plant, the farmer’s utility and straw price in three models start to grow with different degrees. As for profit of the plant, the increase in the VCM is the largest, followed by the BM, and the profit growth in the DDM is the smallest. As with straw supply and the farmer’s utility, the VCM plot also presents the largest growth. In addition, with different starting points to grow, the plots of the DDM and the BM finally reach the same point when the tariff is 0.75 Yuan/kWh.
An implication is that the price subsidy should be properly selected. If the level is too low, on one side, the plant would not offset its operation cost. On the other, it could not be able to set higher straw purchasing price. Then the farmer would not expect any utility of taking part in the supply chain, so that the plant would have too little straw supply to make profit. However, with excessive price subsidy, the government’s fiscal burden would be too huge. Thus, it is necessary to examine the costs of biomass generation projects using different technology types in different regions, to provide bases for setting appropriate price subsidy level. Moreover, in the VCM it needs lower level of tariff to make the plant profitable. It means when the VCM have been established, the government could save price subsidy by decreasing the feed-in tariff level. From the perspective of straw supply, the tariff could be cut by about 5.3% to 0.71 Yuan/kWh in the VCM to achieve the same supply in the DDM and BM. According to the generated biomass-based electricity of 41.6 billion kWh in 2014, it would reduce the price subsidy of about 1.7 billion Yuan for the government.

4.3.2. Shipping Distance

For a 30 MW biomass power plant, the designed feedstock supply radius is about 30–40 km. In fact, because of farmers’ lack of motivation to supply straw, the actual radius exceeds that distance. In order to acquire enough straw, the plant and brokers trend to expend the feedstock purchasing area. In practice, some plants even seek feedstock (crop and forestry residues) from the range of 100 km [42]. Because the transportation cost takes up about 43.88% of the feedstock cost [43], shipping distance would largely influence the profitability. The base case scenario assumes the shipping distance to be 15 km, where the DDM and the BM present the same straw supply. It is important to understand the impact of shipping distance on the performance of the supply chain. Different scenarios are therefore modeled where shipping distance ranges from 0 to 30 km with the increasing magnitude of 5 km.
Figure 8 shows straw supply, profit of the plant, the farmer’s utility and straw price, respectively. These results illustrated a significant impact of shipping distance on the supply chain operation. Longer shipping distance led to lower utility for the farmer, which results in lower straw supply, and moreover less profit for the plant. While the distance increases from 0 to 30 km, the equilibria of the supply chains in the BM and the VCM keep unchanged as EBM1 and EVCM1, respectively. In addition, the equilibrium in the DDM experiences the switch from EDDM3 to EDDM1, and then to EDDM2. It should be noted that the supply plot of the DDM intersects with that of the VCM at the shipping distance of 13 km and with the plot of the BM at 15 km, and the supply becomes 0 at 20 km. As the distance is elongated, the straw purchasing price for the plant rises, but the prices for the broker and the VC decrease.
The results emphasize that the DDM still presents its advantage in the area adjacent to the plant. For this case study, the feedstock supply radius, with which the DDM has superiority to other two models, is 13 km. In addition, the VCM should be implemented in a ring-shaped zone from the radius of 13 km to 30 km. Because as the shipping distance increases, the farmer’s transportation cost goes up more rapidly in the DDM than the BM and the VCM. With the scale benefit, the transportation costs in the BM and the VCM also grow, but not that fast. In addition, because the VCM could bring more utility for farmers, the straw supply in this model is higher. In addition, the DDM would bring no profit for the plant with the shipping distance of more than 20 km, and the BM and the VCM show unprofitability with the distance of more than 30 km. Maybe because the biomass feedstock considered in the case study is just straw, which features lower density than other biomass types, for instance, bark, corn stover and cotton stalk, the profitability radius is shorter than 100 km estimated in [42].

4.3.3. VC’s Utility Weight on Public Services and Farmer’s Utility Weight on Net Income

The base case scenario assumes that the VC’s utility weight on public services (A) and the farmer’s utility weight on net income (M) are 0.8, i.e., the rural official government values public welfares over environment quality, and the farmer puts more emphasis on monetary benefit. However, since the Chinese government attaches more and more importance to the sustainability of eco-system, the VC would increase the weight on the environmental improvement. Considering that a farmer’s monetary income earned from selling crop residues is quite small, the actual weight on net income would be lower than the base case. It is, thus, important to understand the impact of these assumptions on the model simulation results. Different scenarios are simulated where the VC’s utility weight on public services and the farmer’s utility weight on net income range from 0.1 to 0.8 in unit of 0.1, respectively.
Figure 9 shows the results for these simulations. It is clearly evident that the VC’s utility weight on public services and the farmer’s utility weight on net income have significant impact on the straw supply. For lower VC’s utility weight on public services and lower farmer’s utility weight on net income, the supply increases accordingly. Since the straw purchase price has no relationship with these two parameters as Equation (48) presents, the plant could make more profit. It should be noted that with the changing of these two parameters, the supply is always higher than the base case (18.49 thousand t presented as the light blue plane) and that in other two conventional models (14.97 thousand t presented as the dark blue plane). Because A and M have no impact on equilibrium conditions as presented in Equations (52)–(55), the equilibrium in the VCM keeps as EVCM1.
The simulation results provide the implication for the VCM design that as the local government lays more emphasis on environmental quality, the performance of the new supply model would improve. In addition, the VC should build an appropriate performance appraisal system corresponding to local farmers’ emphasis on the public welfares. On the one hand, the VC’s decision making is supposed to reflect the collective willingness of local villagers. When the farmer’s utility weight on net income is low, i.e., farmers are more desiring public welfares, the appraisal system should put larger weight on public services. On the other hand, it should proactively raise the straw supply. When the farmer’s utility weight on net income is relatively high, the VC is ought to properly reduce the weight on public services. From the regional perspective, rural areas in China’s relative impoverished provinces are deficient in infrastructures, where local villagers are crying out for the improvement of public welfares. Thus, the VCM mechanism design should impose more emphasis on the public infrastructures. With regarding to relatively affluent regions, people tend to take more account for environmental conditioning. In that context, the local government should pay more attention to the environmental utility. The establishment of the VCM in that method could ensure more feedstock supply for the biomass-based plant.

5. Conclusions

The insufficiency of biomass feedstock supply is the major plight of China’s biomass-based power supply chain. Because the main raw material of China’s biomass-based power plants is agricultural residue, farmers’ supply willingness has significant impact on the sustainable operation of that supply chain. The fact is that due to the decentralized farming method and high collection cost, farmers tend to discard or even incinerate the crop residues. The feature of Chinese administration is the vertical central-local governments from top to bottom. As the local rural official organization, the VC acts an important role in social and economic lives of native farmers and has enormous influence on their supplying behavior. According to our interviews with experts and field investigations on local villagers, incorporation of the VC is desired to incent farmers’ enthusiasm of delivering crop residues.
Considering that context, this work initiates a novel villager’s committee supply model featured with introducing the rural official government, where this organization takes the responsibility of uniting villagers to collect crop residues for supplying to biomass-based power plants and improving infrastructures for the promotion of natives’ public utilities with the revenue from the delivery of residues. In order to observe the performance of this supply model, a combined game theory and agent-based simulation approach is employed to compare its efficiency with that of two conventional models—direct-deal and broker supply models. We formulate the payoff of each player in the three models and calculate the equilibriums of these dynamic games of complete information in the game-theoretical analysis. In addition, then operations of supply chains in three models are simulated using agent-based method, where intellectual agents’ behaviors are built on the bases of the equilibriums deduced and the data from a case study of a biomass power plant in Shandong Province. Moreover, various scenarios are simulated to understand the impact of different model parameters on the supply chains and to explore a proper villager’s committee supply model design.
The simulation results demonstrate the effectiveness of our novel supply model and provide meaningful implications for the development of China’s biomass power generation. First, the introduction of the rural grass-rooted official organization is able to elevate the crop residue supply so that sufficient feedstock of biomass plants could be ensured to prevent deficit states and local farmers would gain more public utilities. Second, the on-grid price subsidy policy significantly influences the operation of the biomass-based power supply chain and should be continued. Chinese government could reduce the price subsidy spending for biomass-based power with incorporation of the VC. The level of subsidy needs to be detailed in accordance with costs of biomass-based plants in different regions and with technology types. Third, the VC model has a ring-shaped applicable zone from a certain distance to the maximum feedstock purchase radius of the plant. For the areas within that distance, the direct-deal model still presents its advantages. The novel supply model should be established with a performance evaluation system for the rural official organization, in order to both reflect local villagers’ emphasis on net income, public utilities and environmental improvement, and proactively incent feedstock supply. In addition, the further research will be extended in the future by considering other factors within the supply chain. The payoff functions and decision-making rules for these intellectual agents will be renovated as more information and data available.

Acknowledgments

The authors are grateful for the financial support provided by the National Science Foundation of China (Grant No. 71373077), the Major Program of the National Social Science Fund of China (Grant No. 15ZDB165), the Special Items Fund of Beijing Municipal Commission of Education and the Fundamental Research Funds for the Central Universities (Grant No. 2015XS35).

Author Contributions

Kaiyan Luo modeled the game-theoretical problems, performed the simulation program, and wrote the paper. Xingping Zhang designed the feedstock supply model incorporating the rural official organization for China’s biomass-based power supply chain and revised the paper; Qinliang Tan contributed materials and data, and supervised the project. All the authors contributed to the analysis and conclusion, read and approved the final manuscript.

Conflicts of Interest

The authors declare no conflict of interest. The founding sponsors had no role in the design of the study; in the collection, analyses, or interpretation of data; in the writing of the manuscript, and in the decision to publish the results.

Abbreviations

The following abbreviations are used in this manuscript:
GHGgreenhouse-gas
SCPstructure, conduct and performance
VCvillagers’ committee
CAScomplex adaptive system
DDMdirect-deal model
BMbroker model
VCMvillagers’ committee model
USAUnited States of America
NDRCChina’s National Development and Reform Commission
PRCPeople’s Republic of China

References

  1. Tollefson, J. China’s carbon emissions could peak sooner than forecast. Nature 2016, 531, 425–426. [Google Scholar] [CrossRef] [PubMed]
  2. NDRC. Enhanced Actions on Climate Change: China’s Intended Nationally Determined Contributions. Available online: http://www.gov.cn/xinwen/2015-06/30/content_2887330.htm (accessed on 2 July 2016). (In Chinese)
  3. People’s Republic of China. The Thirteenth Five-Year Plan for National Economic and Social Development of the People’s Republic of China; People’s Publication House: Beijing, China, 2015. (In Chinese) [Google Scholar]
  4. Thakur, A.; Canter, C.E.; Kumar, A. Life-cycle energy and emission analysis of power generation from forest biomass. Appl. Energy 2014, 128, 246–253. [Google Scholar] [CrossRef]
  5. Li, N.; Xie, G.; Zhang, C.; Xiao, Y.; Zhang, B.; Chen, W.; Sun, Y.; Wang, S. Biomass Resources Distribution in the Terrestrial Ecosystem of China. Sustainability 2015, 7, 8548–8564. [Google Scholar] [CrossRef]
  6. Yan, Q.; Tao, J. Biomass Power Generation Industry Efficiency Evaluation in China. Sustainability 2014, 6, 8720–8735. [Google Scholar] [CrossRef]
  7. Wang, C.; Zhang, L.; Chang, Y.; Pang, M. Biomass direct-fired power generation system in China: An integrated energy, GHG emissions, and economic evaluation for Salix. Energy Policy 2015, 84, 155–165. [Google Scholar] [CrossRef]
  8. Zhu, M.; Shi, L.; Liang, Z.; Wang, Z. Renewable Energy Date Manual 2015; China National Renewable Energy Centre: Beijing, China, 2015. (In Chinese) [Google Scholar]
  9. Liu, L.; Ye, J.; Zhao, Y.; Zhao, E. The plight of the biomass power generation industry in China—A supply chain risk perspective. Renew. Sustain. Energy Rev. 2015, 49, 680–692. [Google Scholar] [CrossRef]
  10. Liu, J.; Wang, S.; Wei, Q.; Yan, S. Present situation, problems and solutions of China’s biomass power generation industry. Energy Policy 2014, 70, 144–151. [Google Scholar] [CrossRef]
  11. Zhao, X.; Wang, J.; Liu, X.; Feng, T.; Liu, P. Focus on situation and policies for biomass power generation in China. Renew. Sustain. Energy Rev. 2012, 16, 3722–3729. [Google Scholar]
  12. Qian, W.; Ying, Y. Analysis on farmers’ willingness of participating in rural public infrastructure supply and its factors. China Rural Econ. 2014, 11, 39–51. (In Chinese) [Google Scholar]
  13. Liu, C.; Zhang, L.; Huang, J.; Luo, R.; Yi, H. Project design, village governance and infrastructure quality in rural China. China Agric. Econ. Rev. 2013, 5, 248–280. [Google Scholar]
  14. Wang, X.; Otto, I.M.; Yu, L. How physical and social factors affect village-level irrigation: An institutional analysis of water governance in northern China. Agric. Water Manag. 2013, 119, 10–18. [Google Scholar] [CrossRef]
  15. Meng, X.; Zhang, L. Democratic participation, fiscal reform and local governance. China Econ. Rev. 2011, 22, 88–97. [Google Scholar] [CrossRef]
  16. Qu, W.; Tu, Q.; Bluemling, B.; Cao, L. Which factors are effective for farmers’ biogas use?—Evidence from a large-scale survey in China. Energy Policy 2013, 63, 26–33. [Google Scholar] [CrossRef]
  17. Wang, X. Research on Farmers’ Behavior during the Development and Utilization of Biomass-Energy in China. Master’s Thesis, Chinese Academy of Agricultural Sciences, Beijing, China, 19 June 2009. [Google Scholar]
  18. He, K.; Zhang, J.; Jiang, L. Farmer Demand for the Low-Carbon Utilization of Biomass. Resour. Sci. 2013, 35, 1635–1642. (In Chinese) [Google Scholar]
  19. Yan, H. Research on Industrial Chain Evaluation and Development of Biomass Power Generation in China. Master’s Thesis, North China Electric Power University, Beijing, China, 25 March 2013. [Google Scholar]
  20. Ye, J.; Wang, C. The role of villagers’ committee in the New Village Construction. China Rural Econ. 2008, 12, 69–76. (In Chinese) [Google Scholar]
  21. Wang, Y. The Studies of Biomass Power Generation Supply Chain Cooperation Patterns in the Game Situation. Master’s Thesis, Nanjing University of Aeronautics and Astronautics, Nanjing, China, 1 March 2011. [Google Scholar]
  22. Wu, H. Mechanisms Research on the Relationship between Corporation and Farmers in the Chain of Biomass Energy. Master’s Thesis, Hunan University, Changsha, China, 29 November 2010. [Google Scholar]
  23. Fundenberg, D.; Tirole, J. Game Theory; MIT Press: Cambridge, MA, USA, 1991. [Google Scholar]
  24. Chaib-draa, B.; Muller, J.P. Multiagent Based Supply Chain Management; Springer: New York, NY, USA, 2006. [Google Scholar]
  25. North, M.J.; Collier, N.T.; Ozik, J.; Tatara, E.R.; Macal, C.M.; Bragen, M.; Sydelko, P. Complex adaptive systems modeling with Repast Simphony. Complex Adapt. Sys. Model. 2013, 1, 3. [Google Scholar] [CrossRef]
  26. Parsons, S.; Wooldridge, M. Game Theory and Decision Theory in Multi-Agent Systems. Auton. Agents Multi-Agent 2002, 5, 243–254. [Google Scholar] [CrossRef]
  27. NDRC. Regulations on Renewable Energy Power Generation. Available online: http://www.sdpc.gov.cn/zcfb/zcfbtz/200602/t20060206_58735.html (accessed on 8 August 2016). (In Chinese)
  28. NDRC. Notification on Improving Feed-in Tariff Policy of Agriculture or Forestry Residues Power Generation. Available online: http://www.ndrc.gov.cn/zcfb/zcfbtz/201007/t20100728_363362.html (accessed on 8 August 2016). (In Chinese)
  29. Nasiri, F.; Zaccour, G. An exploratory game-theoretic analysis of biomass electricity generation supply chain. Energy Policy 2009, 37, 4514–4522. [Google Scholar] [CrossRef]
  30. Zhang, H. Frustration of the Biomass-Based Generation Conglomerate—National Bio-Energy Group. Available online: http://www.bioon.com/bioindustry/bioenergy/523655.shtml (accessed on 17 August 2016). (In Chinese)
  31. Profile of Shanxian County. Available online: http://www.shanxian.gov.cn/sxweb/newsDetail/201508144123202105725828183058.html (accessed on 17 August 2016). (In Chinese)
  32. 2016 Government Work Report of Shanxian County. Available online: http://xxgk.shanxian.gov.cn/sxweb/newsDetail/201602013917216104051272629863.html (accessed on 17 August 2016). (In Chinese)
  33. Yang, J.; Wang, X.; Ma, H.; Bai, J.; Jiang, Y.; Yu, H. Potential usage, vertical value chain and challenge of biomass resource: Evidence from China’s crop residues. Appl. Energy 2014, 114, 717–723. [Google Scholar] [CrossRef]
  34. Angelopoulos, K.; Economidis, G.; Philippopoulos, A. What Is the Best Environmental Policy? Taxes, Permits and Rules under Economic and Environmental Uncertainty; Bank of Greece: Athens, Greece, 2010; p. 20. [Google Scholar]
  35. Qi, J.; Hu, Y. Environment quality and economic growth: Based on heterogeneous preferences and the government’s horizon. China Econ. Stud. 2013, 280, 28–38. (In Chinese) [Google Scholar]
  36. Tian, S.; Dong, W.; Xu, W. Fiscal expenditure for environmental protection, the government’s preference for environment and policy performance: A empirical analysis based on industrial pollution data of provinces in China. Inq. Econ. Issues 2016, 7, 14–21. (In Chinese) [Google Scholar]
  37. Zhang, X.; Cai, G. Income, values and sense of happiness: A empirical study on residents in Guangdong Province, China. Manag. World 2011, 9, 63–73. (In Chinese) [Google Scholar]
  38. Zhao, Z.; Yan, H. Assessment of the biomass power generation industry in China. Renew. Energy 2012, 37, 53–60. [Google Scholar] [CrossRef]
  39. NDRC. Interim Management Measures for Renewable Power Tariff and Cost Allocation. Available online: http://www.ndrc.gov.cn/fzgggz/jggl/zcfg/200601/t20060120_748054.html (accessed on 8 August 2016). (In Chinese)
  40. NDRC. Notice on Decreasing the Coal-Fired Feed-in Tariff and the General Industrial and Commercial Electricity Prices. Available online: http://www.ndrc.gov.cn/zcfb/zcfbtz/201512/t20151230_769620.html (accessed on 8 August 2016). (In Chinese)
  41. NDRC. Notice on Decreasing the Coal-Fired Feed-in Tariff and the Industrial and Commercial Electricity Prices. Available online: http://www.ndrc.gov.cn/fzgggz/jggl/zcfg/201504/t20150417_688504.html (accessed on 8 August 2016). (In Chinese)
  42. Zhao, D. Report on 3E Models and LCA for a Power Generation System from Selected Agriculture and Forestry Biomass; Guangzhou Institute of Energy Conversion, CAS: Guangzhou, China, 2008. (In Chinese) [Google Scholar]
  43. Tan, Q.; Yang, H.; Zhang, X.; Deng, Y.; Wei, Y. Measurement Model and Empirical Analysis of Fuel Collection Cost for Biomass Power Generation. Forum Sci. Technol. China 2014, 5, 117–123. (In Chinese) [Google Scholar]
Figure 1. Architectures of the biomass-based power supply chains in the three supply models.
Sustainability 08 00814 g001
Figure 2. Interactions between players in the (a) DDM; (b) BM; and (c) VCM.
Sustainability 08 00814 g002
Figure 3. Agent activity diagram—biomass feedstock supplying.
Sustainability 08 00814 g003
Figure 4. Simulation schedule for biomass-based power supply chains.
Sustainability 08 00814 g004
Figure 5. Adjustment proceeding of the plant’s feedstock purchasing price.
Sustainability 08 00814 g005
Figure 6. Evolutions of (a) straw supply; (b) profit of the plant; (c) the farmer’s utility; and (d) straw price of three models through time.
Sustainability 08 00814 g006
Figure 7. Impact of varied feed-in tariff levels on equilibrium values of (a) straw supply; (b) profit of the plant; (c) farmer’s utility; and (d) straw price in three models.
Sustainability 08 00814 g007
Figure 8. Impact of varied shipping distance on equilibrium values of (a) straw supply; (b) profit of the plant; (c) farmer’s utility; and (d) straw price in three models.
Sustainability 08 00814 g008
Figure 9. Impact of A and M on the equilibrium straw supply in the VCM.
Sustainability 08 00814 g009
Table 1. Agents’ behaviors corresponding to the priority ranks.
PriorityAgentBehavior
0PlantOffering the incentive α with the feedback regulation to achieve the maximum profit
−1BrokerDeciding the optimal straw price P B given the plant-offered incentive α to pursue the maximum profit
VCDeciding the optimal straw price P V given the plant-offered incentive α to gain the maximum utility
−2FarmerDeciding the amount of straw supply q given the plant-offered incentive α (DDM), the broker-offered price P B (BM) or the VC-offered price P V (VCM)
PlantCalculating the profit in the current round
Table 2. Case study data and parameter assumptions.
Model ParameterNotationValue
Feed-in tariff for biomass-based power P e 0.75 Yuan/kWh 1
Plant’s operation cost per unit of the generated electricity O C 0.25 Yuan/kWh 2
Conversion ratio of biomass material to electricity γ 650 kWh/t 2
Market price of the biomass product P m 150 Yuan/t 2
Storage cost per unit of the straw C s 85 Yuan/t 3
Straw collection cost coefficient C q 0.002 3
Transportation cost for the farmer C l 1 12 Yuan/t·km 2
Transportation cost for the broker or VC C l 2 8 Yuan/t·km 2
Shipping distance L 15 km
VC’s utility weight of public services A 0.8 4
Farmer’s utility weight of net income M 0.8 5
1 [28]; 2 Field investigations; 3 [21]; 4 [34,35,36]; 5 [37].
Table 3. Summary of the stable performances in the three models.
ModelStraw Supply (103 t)Profit of the Plant (103 Yuan)Farmer’s Utility (103)Straw Purchasing Price for the Plant (Yuan/t)Straw Purchasing Price for the Broker/VC (Yuan/t)
DDM14.97450.00224.04209.94N/A
BM14.97900.00224.25264.9029.95
VCM18.491111.11474.03264.9033.28

