Article

Breaking Resilient Patterns of Inequality in Santiago de Chile: Challenges to Navigate towards a More Sustainable City

by
Ignacio C. Fernández
1,*,
David Manuel-Navarrete
1 and
Robinson Torres-Salinas
2
1
School of Sustainability, Arizona State University, Tempe, AZ 85281, USA
2
Faculty of Environmental Sciences, Universidad de Concepción, Casilla 160-C, Concepción 4070386, Chile
*
Author to whom correspondence should be addressed.
Sustainability 2016, 8(8), 820; https://0-doi-org.brum.beds.ac.uk/10.3390/su8080820
Submission received: 26 May 2016 / Revised: 14 August 2016 / Accepted: 17 August 2016 / Published: 19 August 2016
(This article belongs to the Special Issue Urban Resilience and Urban Sustainability: From Research to Practice)

Abstract

:
Resilience can have desirable and undesirable consequences. Thus, resilience should not be viewed as a normative desirable goal, but as a descriptor of complex systems dynamics. From this perspective, we apply resilience thinking concepts to assess the dynamics of inequality, spatial segregation, and sustainability in Chile’s capital city of Santiago. Chile’s economy boosted since democracy was restored in 1990, but continuity of neoliberal reforms and transformations of Pinochet’s dictatorship (1973–1990) seem to have locked Chilean cities in resilient, albeit unsustainable, patterns of uneven development. Socio-economic data from Santiago shows highly resilient patterns of urban inequality and segregation from 1992 to 2009 despite democratic efforts, political agendas and discourses packed with calls for reducing poverty and inequality. We present a conceptual model based on the notion of stability landscapes to explore potential trade-offs between resilience and sustainable development. We mapped Santiago’s spatio-temporal inequality trends and explored if these patterns support an inequality-resilience stability landscape. Analysis of temporal and spatial distribution of development assets across four human development dimensions (i.e., income, education, health, democracy) revealed potential socio-political and spatial feedbacks supporting the resilience of inequality and segregation in Santiago. We argue that urban sustainability may require breaking this resilience, a process where bottom-up stressors such as social movements could play a key role.

1. Introduction

Chile experienced a remarkable macroeconomic performance since recovering democracy in 1990 after 17 years of dictatorial military regime ruled by General Pinochet. GDP-PPP (purchasing power parity) per capita rose from US$4787 in 1990 to US$21,980 in 2014 [1]. At the same time, the high poverty and extreme poverty levels left by the military regime were reduced, respectively, from 38.6% and 13.0% in 1990 to 7.8% and 2.5% in 2013 [2]. Nevertheless, despite macroeconomic success achieved by democratic governments, benefits from economic growth have remained highly unevenly distributed, and with a Gini index of 0.51 in 2013 [3]. Chile ranks amongst the world’s most unequal countries. Alongside income inequality, Chilean cities are highly spatially segregated [4,5]. Segregation is pervasive across Chilean urban areas and particularly prevalent in the capital city of Santiago, where huge disparities exist in quality of life indices across the 34 municipalities that make up the city. In fact, Santiago contained in 2014 the best six and worst six urban municipalities to live in Chile [6].
Chile’s high levels of inequalities and segregation are not recent phenomena, nevertheless they became more prevalent following several neoliberal economic and social policies implemented by Pinochet’s dictatorial regime [7]. The military coup derailed the import-substitution model of industrialization that had operated since the 1940s and implemented a series of reforms and neoliberal transformations. In essence, these transformations focused on reducing the role of the state as entrepreneur, investor, and economic promoter by transferring these and other roles to an empowered private sector operating in a highly liberalized market [8]. Under this neoliberal paradigm, the private sector became a key provider of fundamental assets for human development such as education, health and housing, which were re-organized to make them play by market rules [9,10,11]. Neoliberal ideology and practice also permeated urbanization by strongly reducing the role of the state in urban planning, relaxing limits of urban expansion, and promoting private sector’s participation in urban infrastructure development and decision-making [12]. Deregulation of urbanization and sprawling zoning decisions led to concentration of low-income housing at the urban fringe and fostered spatial segregation between rich and poor, which in turn reinforced unequal access to development opportunities between lower and higher income groups [13].
Patterns of spatial segregation between socioeconomic groups in Santiago are coupled to the uneven spatial allocation of economic, environmental, and social assets, which are fundamental for human development [14,15]. Here we use the concept of “human development assets” as an indicator of the means by which people can enhance opportunities to pursue a better quality of life, thus emphasizing the role of capabilities and choices as key for development [16]. The uneven spatial development of Santiago is not only segregating people access to human development assets but could also act as a driver expanding the gap between rich and poor sectors of the population. In this kind of situations chances of vulnerable people to access development opportunities is severely limited, creating a highly resilient unequal system that lock the system in an inequality trap from which low income sectors have little chances to escape [17,18]. Thus, the extreme neoliberal politics and economic transformations implemented during the dictatorial regime may have contributed to generate a highly resilient system of inequality and segregation in Santiago, trapping the city in an undesirable resilient unequal development pattern, and hampering the potential of Santiago to move toward a desirable resilient and sustainable pathway.
Addressing inequality has been fundamental in Chilean political discourse and practice since the recovery of democracy in 1990. “Growth with equity” was a popular slogan amongst the successive center-left governments in power until 2010 [19]. However, the system has remained trapped in a state characterized by high inequality and segregation. This is in spite of external perturbations such as earthquakes as well as efforts of governments to offset the effects of the neoliberal regime instituted by Pinochet with policies targeting low income sectors, supporting democratic processes, and promoting social inclusion [19,20]. Whereas these policies enabled impressive rates of economic growth and poverty reduction, they had little effect in reducing inequalities or spatial segregation [7]. Indeed, by 2009 Santiago was ranked among the most unequal Latin-American cities with Gini index of 0.56 [14].
Santiago’s income inequalities and segregation is widely acknowledged [7,13,21,22], but the role of spatial segregation on inequalities is yet to be explored [23]. Whereas some authors suggest that high levels of spatial segregation in Santiago contribute to consolidating income inequalities [21], others argue for the lack of evidence to support this claim [24,25]. Reasons proposed to explain the prevalence of income inequalities in Chile include unequal access to quality education and health services, concentration of wealth and political power in the elite, and disempowerment of civil society and civic institutions [26,27,28]. Similar factors have also been proposed as indicators of urban resilience to extreme events [29]. However, spatial segregation has been largely absent from inequality analysis in Chile as well as from urban resilience research. We consider that resilience thinking may provide key insights for understanding the role of spatial segregation in the failure of inequality mitigation policies, thus allowing exploring more effective interventions.
We argue that difficulties of democratic elected governments to reduce inequalities in Santiago are rooted in an economic development model that naturalizes a spatial association between income status and access to human development assets [30]. According to this model, concentrating development opportunities and making them available to better-off populations would yield more efficient results than trying to equalize access across income strata. This generates a highly unequal resilient system characterized by the segregation of low income populations in areas with low access to development assets. In resilience terms, spatial segregation creates in Santiago positive feedback loops reinforcing the city’s tendency to remain locked in an inequality trap [18]. To explore and support this argument we evaluate the temporal and spatial dynamics of inequalities among Santiago’s 34 municipalities from 1992 to 2009 by comparing the trends of four human development assets measured through the following four indicators: household income, higher education diploma rates, access to private health system, and participation in local-level elections. We analyze these results under a resilience framework to conceptualize how the uneven spatial distribution of development assets may generate a resilient state of inequality, and discuss the main challenges for breaking this undesirable resilient pattern and transforming the system towards new desirable sustainable pathways.

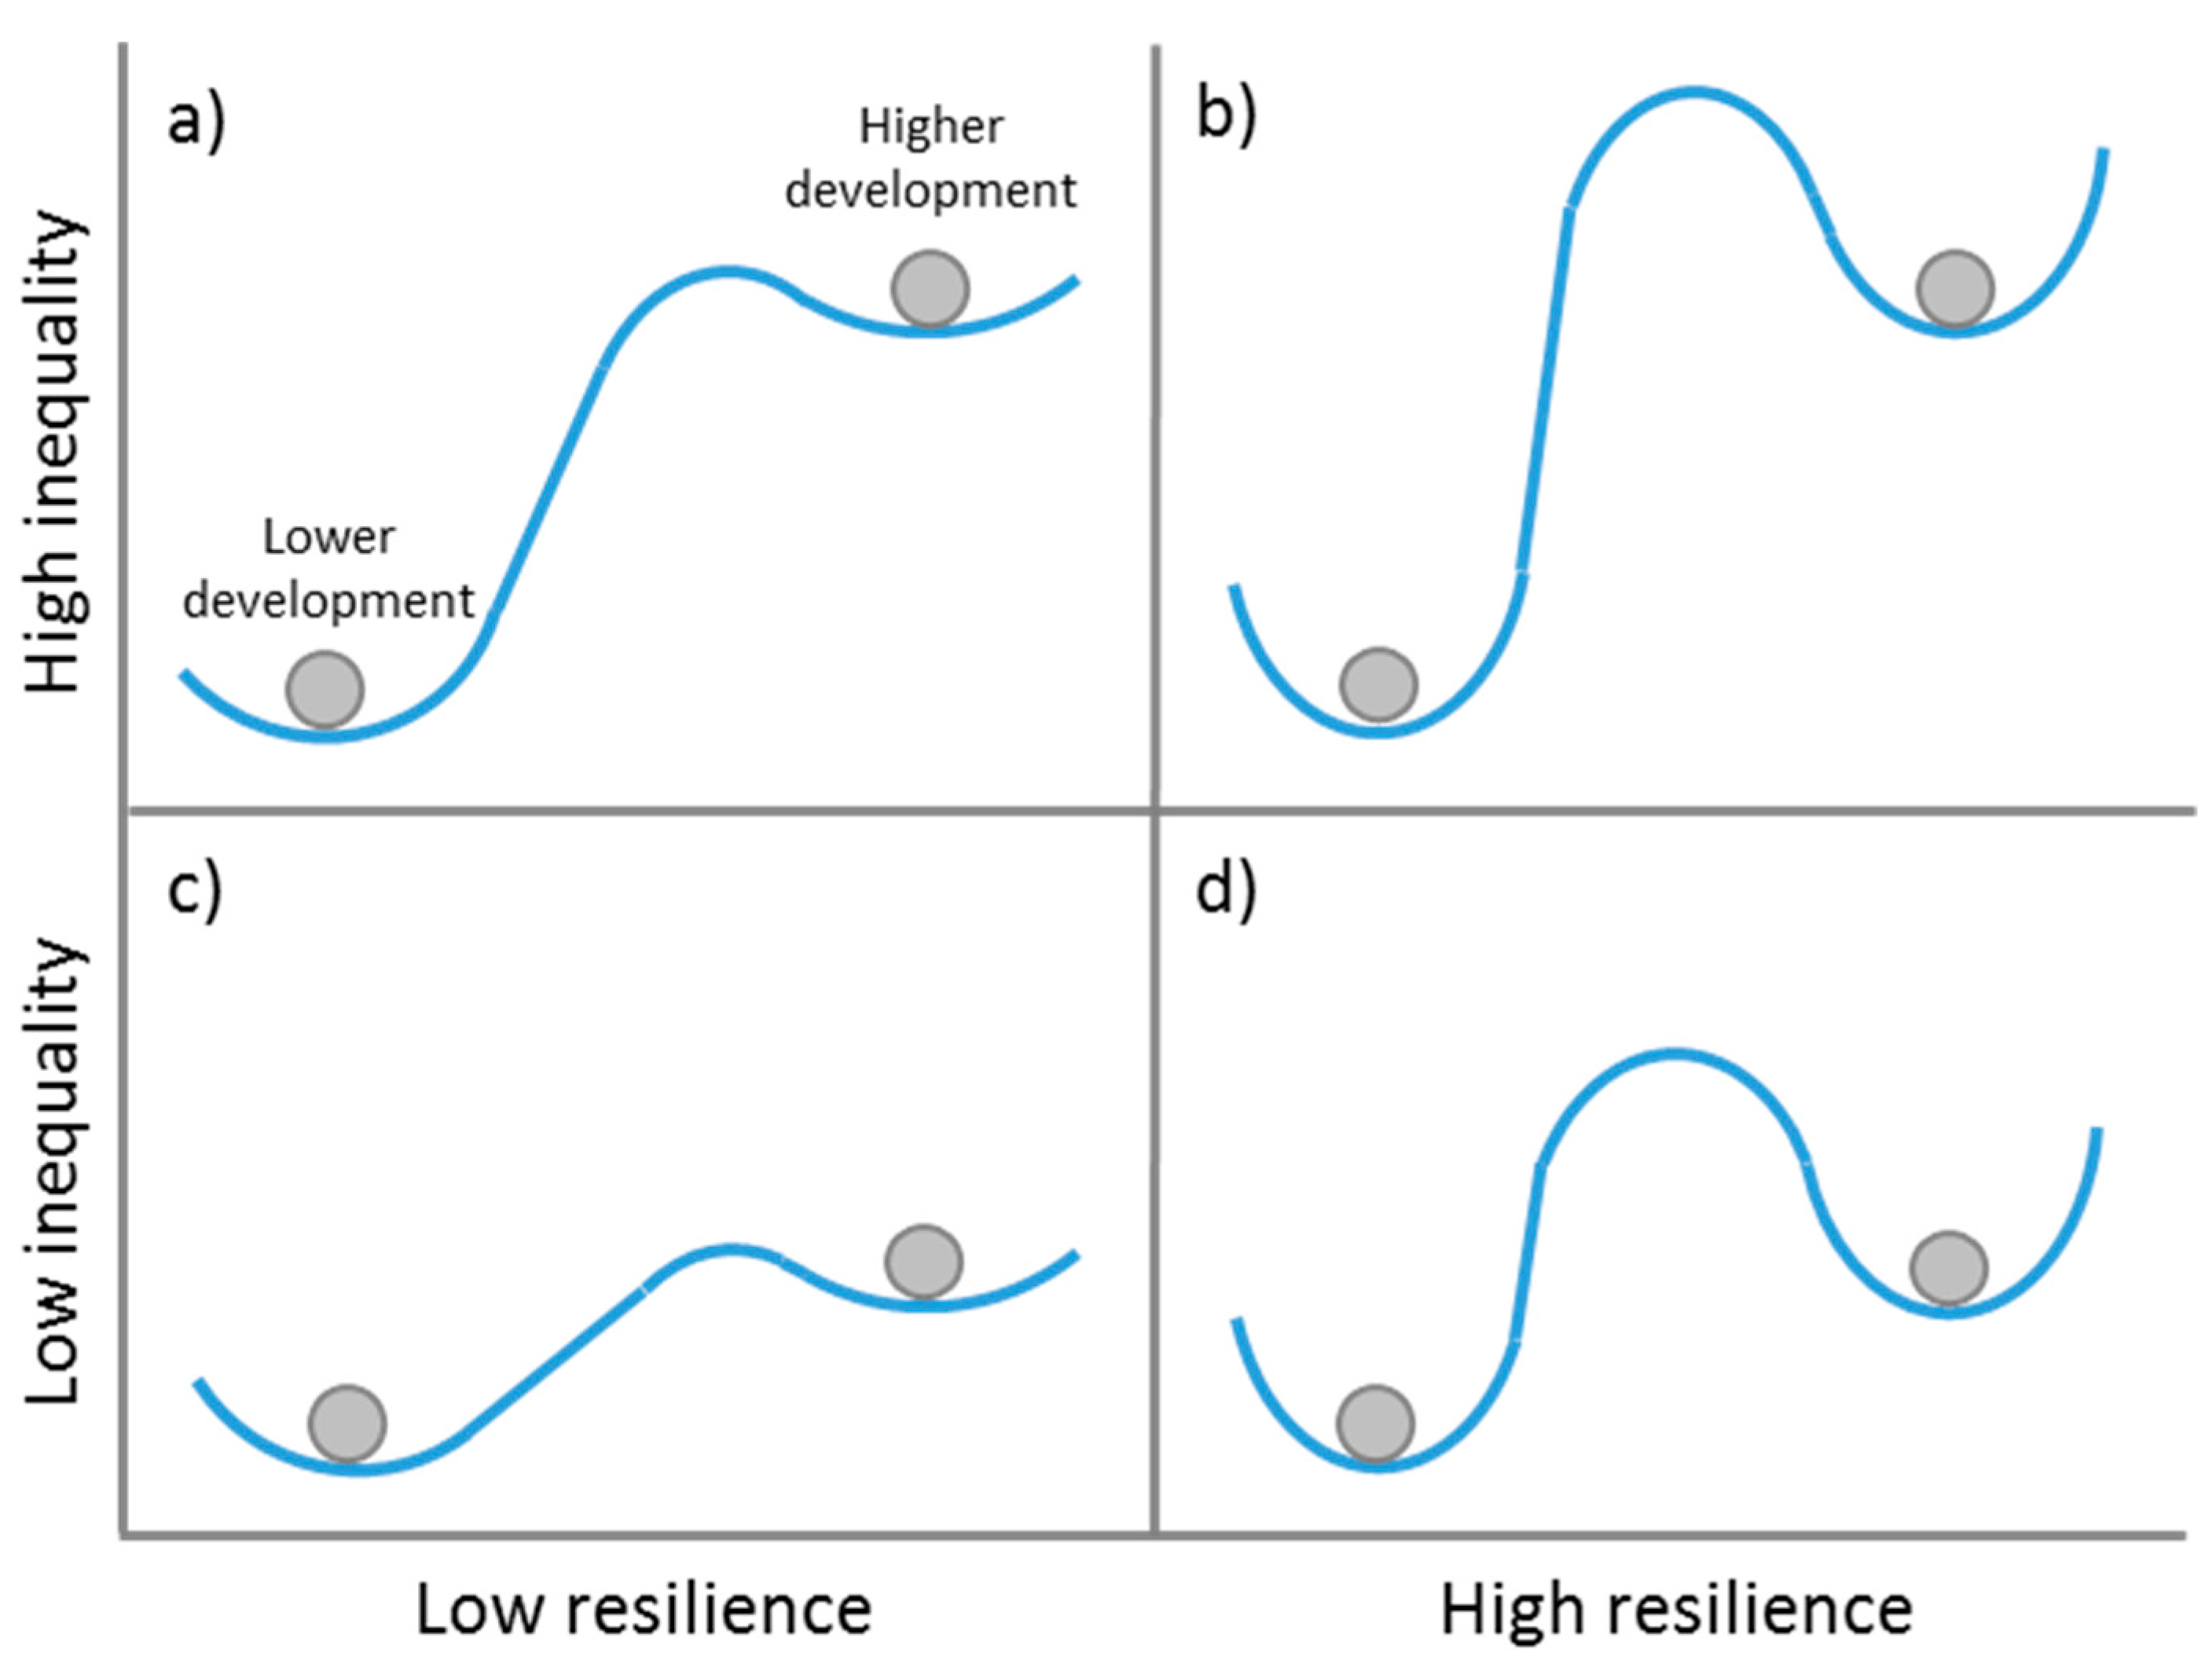
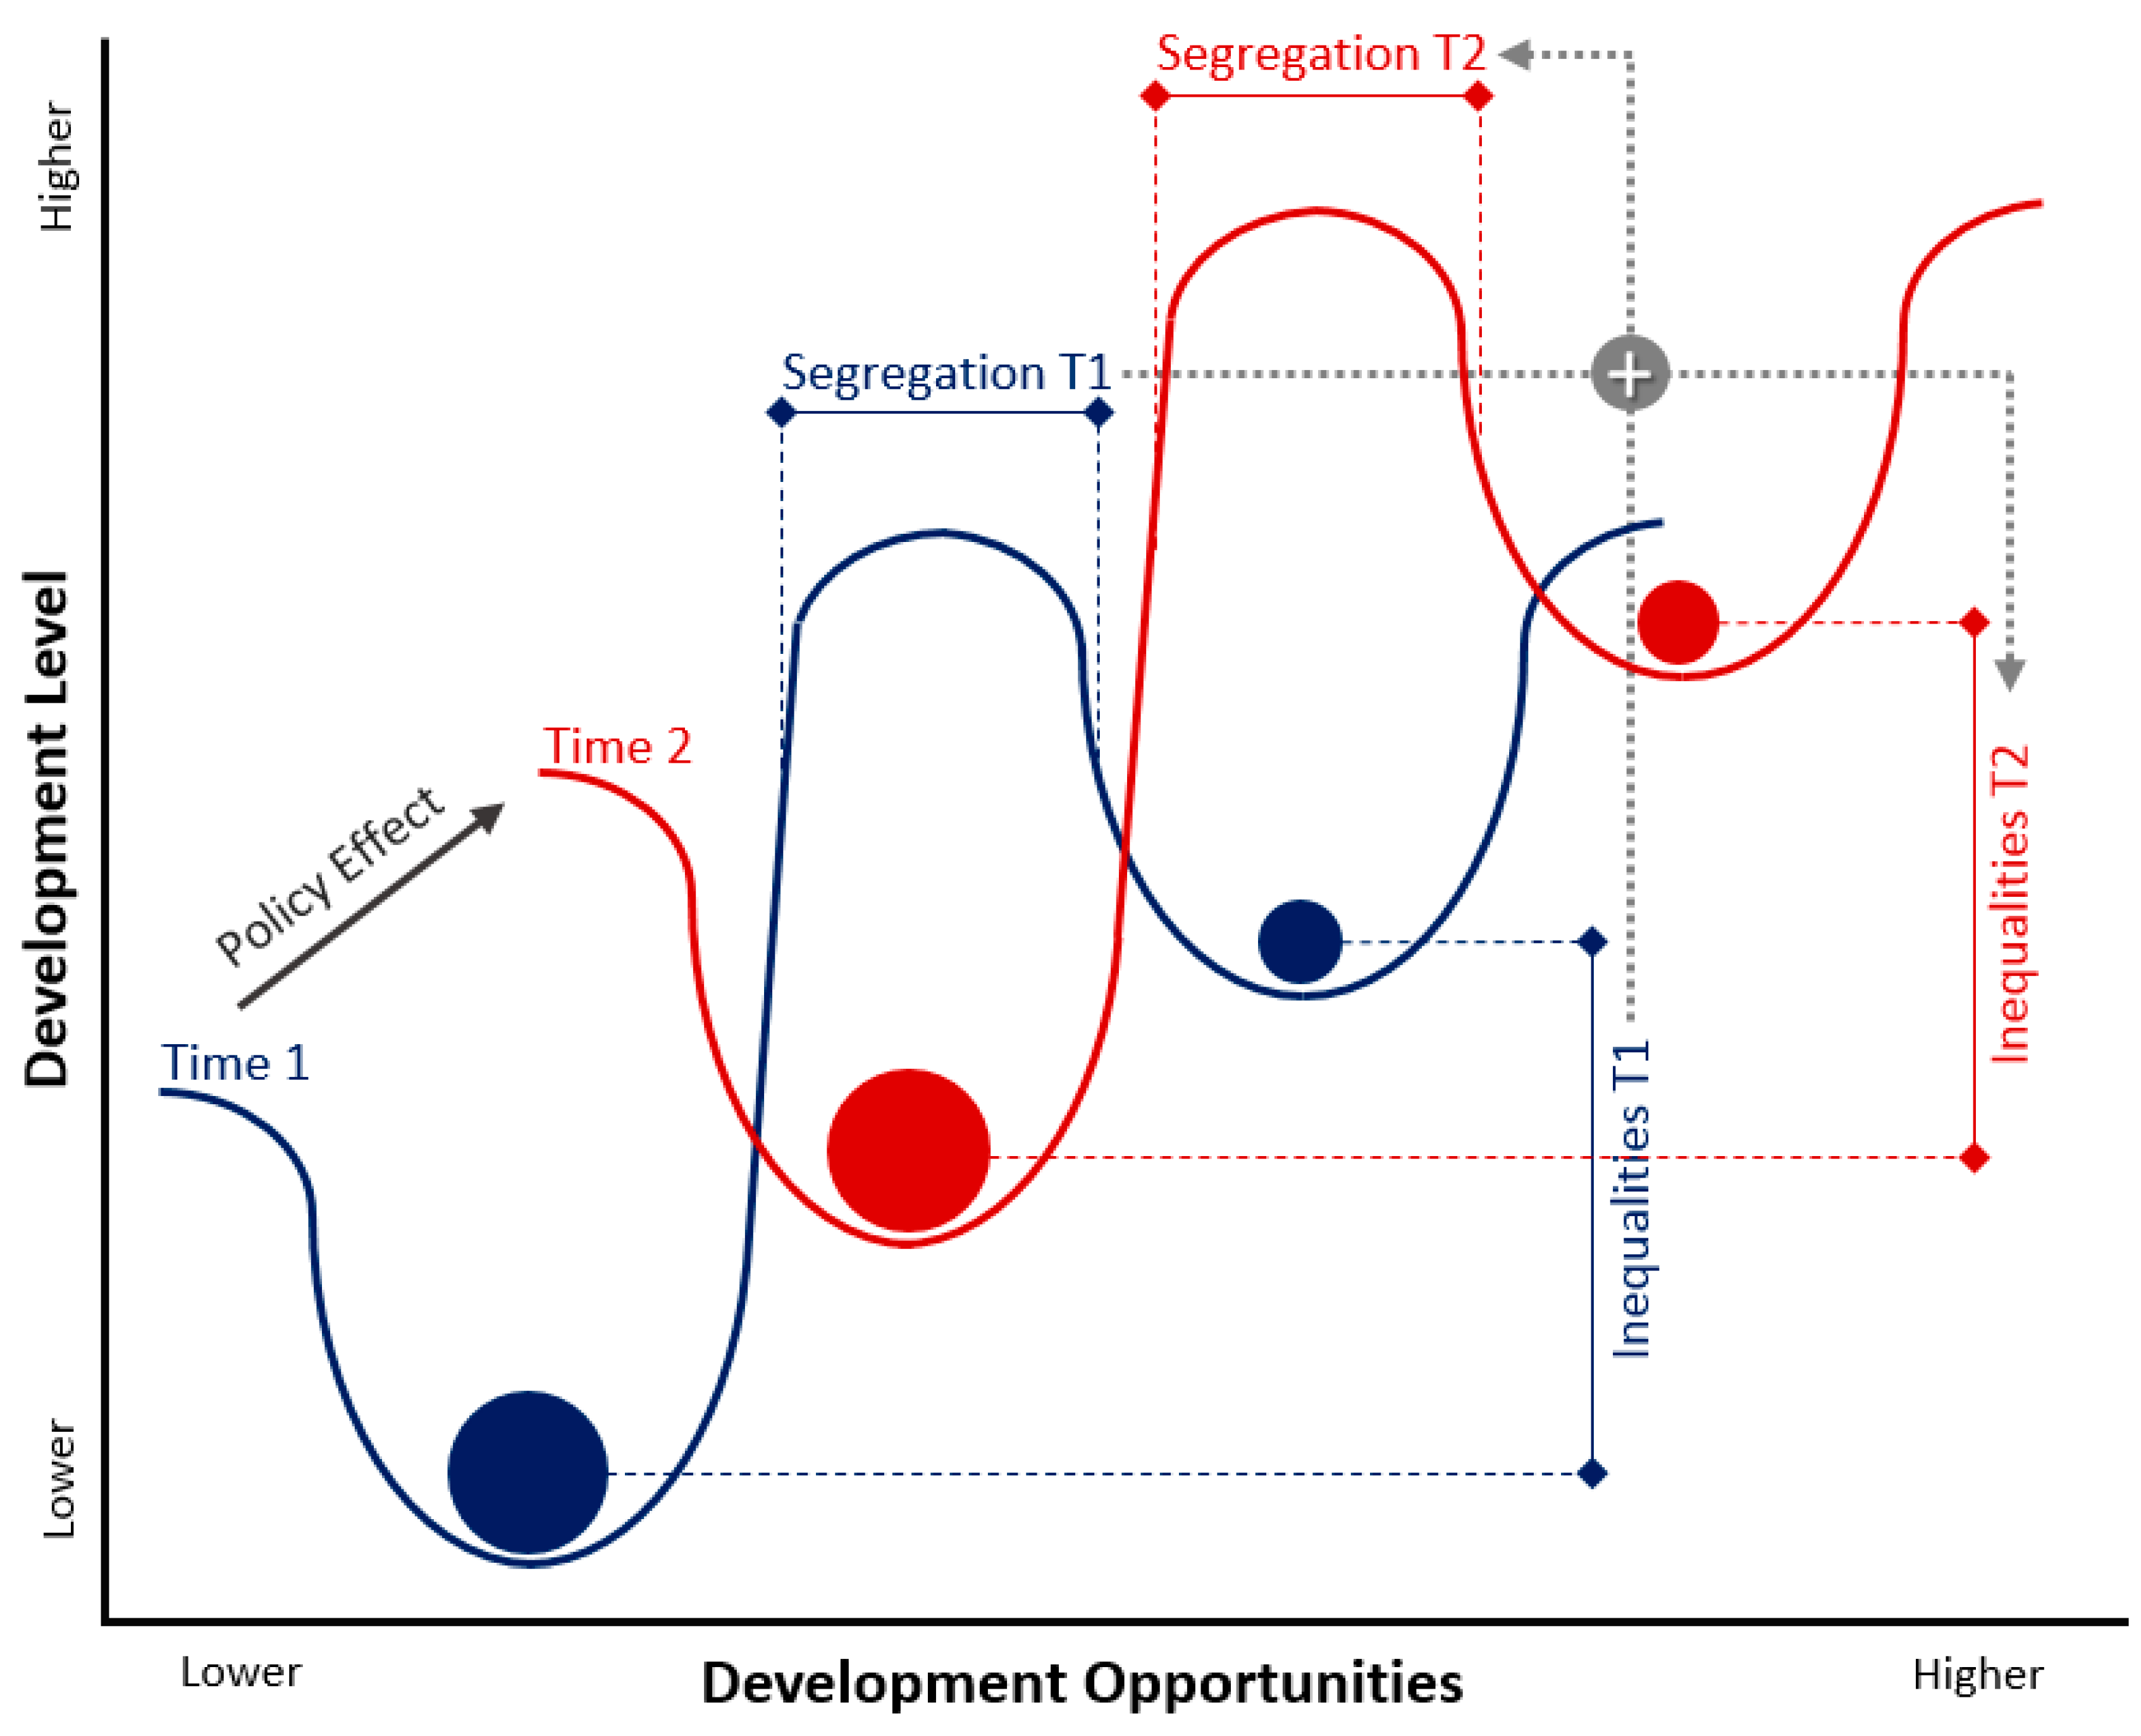
2. A Resilience Framework of Urban Inequality Dynamics

Mainstream resilience theory is conceptually rooted in ecological systems dynamics [31]. From this point of view, resilience can be defined as “the capacity of a system to absorb disturbance and reorganize while undergoing change so as to still retain essentially the same function, structure and feedbacks, and therefore identity, that is, the capacity to change in order to maintain the same identity” [32,33]. Thus, under this approach resilience relates to an intrinsic characteristic of a particular system dynamics without implying a normative stance regarding resilience consequences. However, the concept of resilience is still evolving and being refined towards meaningful applications in social-ecological systems [34,35,36]. In urban studies, resilience is often assumed to be a desirable property of urban systems, implying a positive social connotation [37,38,39]. However, the desirability of a particular urban resilient dynamics depends on carefully analyzing the questions of resilience of what to what, and desirable for whom, because what could be seen as desirable for some, it could be highly undesirable for others [38,39,40,41]. Addressing these questions from a neutral stance is essential to applying resilience thinking to urban systems, where the concept of sustainability can provide the normative supplement [42,43].
However, unlike natural ecosystems, the pre-analytical selection of boundaries and scales of social-ecological systems has profound ethical and political implications. This is because complex adaptive systems are often integrated by a set of hierarchically nested dynamic structures (or panarchies in Gunderson and Holling (2002) [44] nomenclature). Panarchies include slow large-scale dynamics acting as “remember” controls from above, and fast small-scale dynamics acting as “revolt” forces from below [45,46]. This panarchical organization means that a resilient system at one level is not necessarily assembled by a set of nested resilient systems because at lower levels transformation may be the dominant dynamic [47]. Indeed, transformation at one level may be required to support resilience at another level or in another sector of the system [48]. In ecological systems we can give intrinsic value to resilience at a higher scale without much concern for the fast transformations that might be required from lower scale dynamics, but in social-ecological systems keeping higher scale structures resilient may involve keeping the components at lower scales (e.g., families or individuals) under stress, hardship, or undesired transformations [49]. Thus, one needs to ask whether benefits of maintaining resilience at, for instance, the level of macro-economic dynamics, offsets human costs derived from constant instability (possibly experienced as vulnerability or insecurity) at the neighborhood, household or individual level.
To frame our analysis we propose a conceptual model based on the concept of stability landscapes [48] for analyzing urban inequality and segregation, assessing urban sustainability, and linking resilience and transformation across scales (Figure 1). Stability landscapes represent the multiple basins that a system may move from and to, and the boundaries that separate them [48]. Depending on the shape of these basins and boundaries, the system can respond to endogenous dynamics and exogenous stressors by moving within a basin of attraction, or moving from one basin to another, with the later implying a regime shift [50]. In the stability landscape, deeper and larger basins represent higher resilience, whereas shallow and smaller basin represents lower resilience. Moving a system or nested subsystems from one basin to another does not indicate a process of transformation if the stability landscape remains the same. For a transformation process to take place the stability landscape has to be fundamentally altered into a different configuration [50].
We adapt Kay et al. (1999) [51] and Scheffer (2001) [50] notions of attractors and stability landscapes to conceptualize the resilience of inequality between neighborhoods and to link it to spatial segregation within cities. In essence, the resilience of inequality in any city can be represented by an “inequality resilience stability landscape” consisting of two or more basins of attraction pulling neighborhoods at different development levels (Figure 1). A city’s inequality-resilience stability landscape includes not only each basin of attraction position and shape but also the city’s whole inequality resilience, which in our conceptual model is represented by the hills’ height between basins of attraction (Figure 1). Our representation of inequality-resilience stability landscapes makes visible the broad range of types of sustainability interventions that can be implemented for mitigating inequality, which may include: (1) pushing a particular neighborhood towards another attractor; (2) reshaping a particular attractor to facilitate neighborhoods moving in or out (e.g., moving from Figure 1b to Figure 1a); (3) altering the height of the hills separating the attractors (e.g., from Figure 1b to Figure 1d); and (4) transforming the whole stability landscape to another of lower inequality (e.g., from Figure 1b to Figure 1c).
We applied the conceptual model shown in Figure 1 to Santiago arguing that the persistent high levels of inequality reported for this city can be associated with a stability landscape characterized by highly resilient levels of high inequality, such as the one depicted in Figure 1b. As development opportunities are highly spatially segregated in Santiago, we assume that this segregation plays a key role as a positive feedback loop increasing the resilience of the system and trapping the city in a stable state of high inequality. In Figure 2, we present the conceptual framework we use to analyze the role that spatial segregation may be playing in the resilience of Santiago’s inequality. In this framework, each basin characterizes a neighborhood’s current level of development (position along the Y-axis), and access to development opportunities (position along the X-axis). We assume that Santiago’s inequality landscape is constituted by two main attractors spatially segregated via dissimilar development opportunities between a large group of municipalities with lower development levels, and a smaller group presenting higher development levels. Segregation creates an almost unreachable threshold for lower development level municipalities. Government policies have increased development levels across the city (homogenously moving the stability landscape), but have failed to modify levels of inequalities or segregation (Figure 2).
Our conceptual framework formalizes spatial segregation and inequality as integral to urban system dynamics. This is consistent with calls for applying ecological approaches to understanding resilience of social-ecological systems in urban contexts, and identifying key resilience components that may facilitate or hamper transforming cities towards more sustainable patterns [38,52,53]. Our empirical analysis provides spatially-explicit insights adding to existing non-spatial explanations of policy failures to break resilience in Santiago [26,54]. This emphasizes that our aim is not to enhance current urban systems’ undesirable resilience but to evaluate how to break it in order to transform the system towards a new resilient configuration promoting urban sustainability. In this regard, we promote convergence between resilience and political-ecology literature; in particular, the one focusing on uneven development [55,56]. Uneven development is “social inequality blazoned into the geographical landscape, and it is simultaneously the exploitation of that unevenness for certain socially determined ends” [56]. This convergence opens the door to use the notion of breaking resilience not only to inform policy but also as a political tool for people affected by uneven spatial distribution of human development assets to contest inequality, destabilize neoliberal discourse and advocate system-level transformations. Social movements are among the main drivers leading these transformations. Our purpose is to make resilience thinking usable and useful for discussing potential pathways for transforming the current stability landscape.

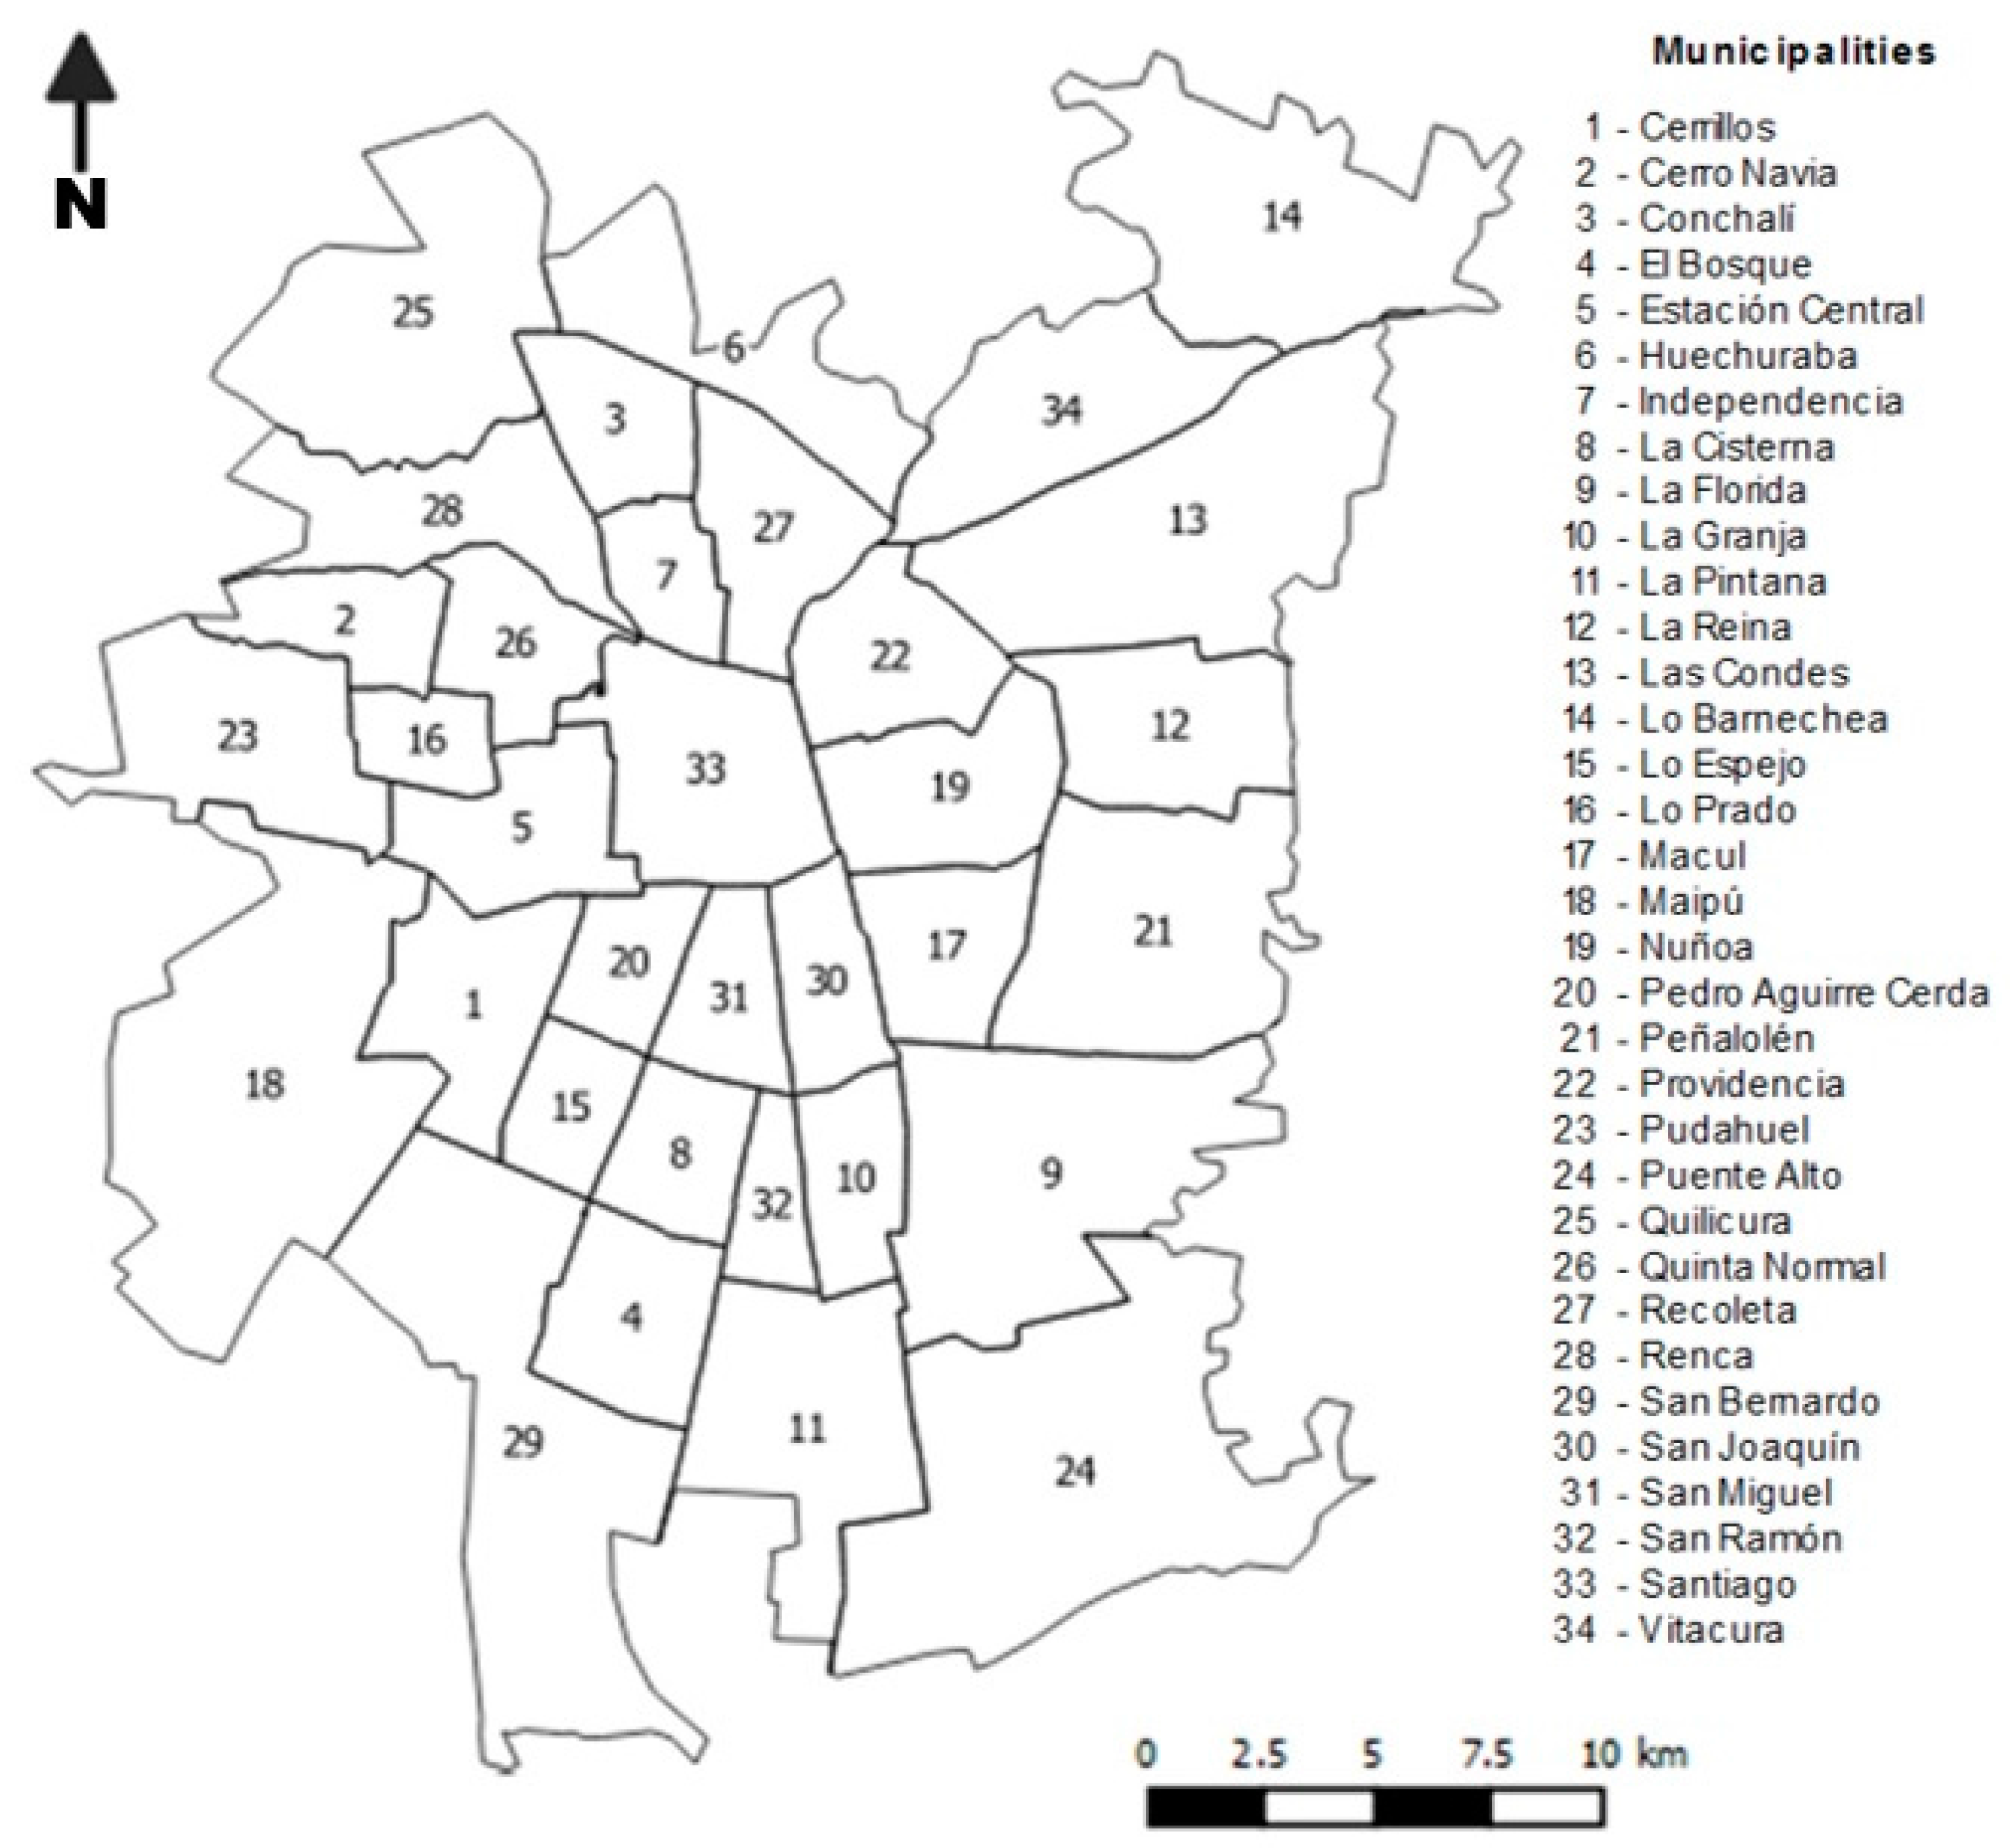
3. Materials and Methods

Our analysis compares the 34 municipalities forming the conurbation commonly known as The Greater Santiago (Figure 3). This urban area covers over 60,000 ha [57] and is home to approximately 6.5 million inhabitants [58]. Population is highly segregated with higher income groups clustered in municipalities in the northeastern cone of the city (e.g., Las Condes, Lo Barnechea, Providencia, and Vitacura), and low income groups spread to the southern and northwestern areas [59]. Distribution of business districts, shopping malls, universities, green areas, and other services tend to be concentrated in municipalities inhabited by higher income groups [22,60,61].

3.1. Analyzed Human Development Assets

To explore the spatial and temporal trends of human development assets in Santiago, we looked for assets within four main dimensions of human development: Wealth, Education, Health, and Democracy. Wealth, Education and Health are included because assets within these dimensions are commonly acknowledged as fundamental in providing opportunities for human development [16,62]. We added the democracy dimension due to the importance of political power in altering urban inequalities and fostering social-ecological change [36,63]. The United Nations also identifies political participation as key for human development [64], and might be particularly pertinent in Chile due to dictatorial recent history.
Obtaining relevant data on assets pertaining to the four human development dimensions required evaluating several Chilean government databases. A main challenge was finding data consistently gathered at the municipal level for the period of analysis (i.e., 1990–2010). We used the “Socioeconomic National Characterization Survey” (CASEN for its acronym in Spanish), one of the most important instruments used by the Chilean government to collect data for developing social policies. Data from the CASEN survey cover years 1992, 1998, 2003 and 2009. We discarded using more recent CASEN data because the survey design was modified after 2009 resulting in data not representative at the municipal level. The CASEN survey is administered every two or three years. It focuses mainly on social variables at the household level and provides no data of political participation. Hence, for the democracy dimension, we used the Chilean Electoral Service database (SERVEL), which collects national and local scale electoral information disaggregated at the municipal level. SERVEL database covered municipal elections in 1992, 1996, 2000, 2004, and 2008. There was no municipal election near 1998; therefore we interpolated data from the 1996 and 2000 elections.
We exported four variables from these two databases, each one representing a human development asset related with one of the four human development dimensions. The first variable, “per-capita total income” of households, includes autonomous income plus transfers from government subsidies and it is the development asset related to the wealth dimension. Second, the variable, “percentage of people with higher education diploma (university or technological college)”, indicates a development asset related with the education dimension. We used higher education diploma, instead of simply high school diploma because having a college or university degree in Chile largely increases the chances to access both more secure and better remunerated jobs [65]. Third, “percentage of people with private health system membership”, was the variable selected for the health dimension. We chose this variable because even though in Chile there is a public health system, the quality, waiting time and options of the private system are largely better than the public one [66,67]. Fourth, the variable “percentage of potential voters effectively voting in municipal elections” is a measure of the democracy dimension.

3.2. Data Analysis

We used two complementary approaches for data analysis. First, we analyzed the distribution of absolute values of assessed variables to evaluate temporal trends of each one of the four assessed variables across municipalities. This information is useful to understand how these variables have evolved in time, but constrains our ability to evaluate relative differences between municipalities. As inequality is conceptually based on relative differences or statistical dispersion of a variable of interest, our second approach was to standardize our variables into comparable indicators by using the following formula:
Standarized indicator = ( value municipality  x max .  value assessed municipalities )
This formula transformed the original values into comparable standardized indicators with potential values ranging between 0 and 1. We used this transformation because it allows for comparison between assessed variables, highlights different degrees of inequality between municipalities, allows for calculating relative gaps between municipalities, and facilitates the generation of maps for visual qualitative interpretation. We calculated two statistics to quantify and compare the levels of inequalities between municipalities: standardized gap, and Gini inequality index. The standardized gap was simply calculated as the arithmetic difference between the standardized indicator value from the top and bottom municipalities. The Gini index was computed by using the inequality package (“ineq” v.0.2-13) in R-Studio (ver. 0.98.1103). To quantify the level of spatial segregation we calculated the Moran’s I index of spatial autocorrelation by using the spatial statistics toolbox in ArcGIS (ver. 10.3). Moran’s I provides a measure of the spatial clustering of the analyzed variable and it is useful to compare social segregation across time [68]. Both Gini and Moran’s I are based on the analysis of relative values and therefore their results are not affected if the computation is made for the absolute (i.e., original variables) or standardized indicators values. All spatial layers and maps were generated using Quantum GIS (v.2.10 Pisa).

4. Results

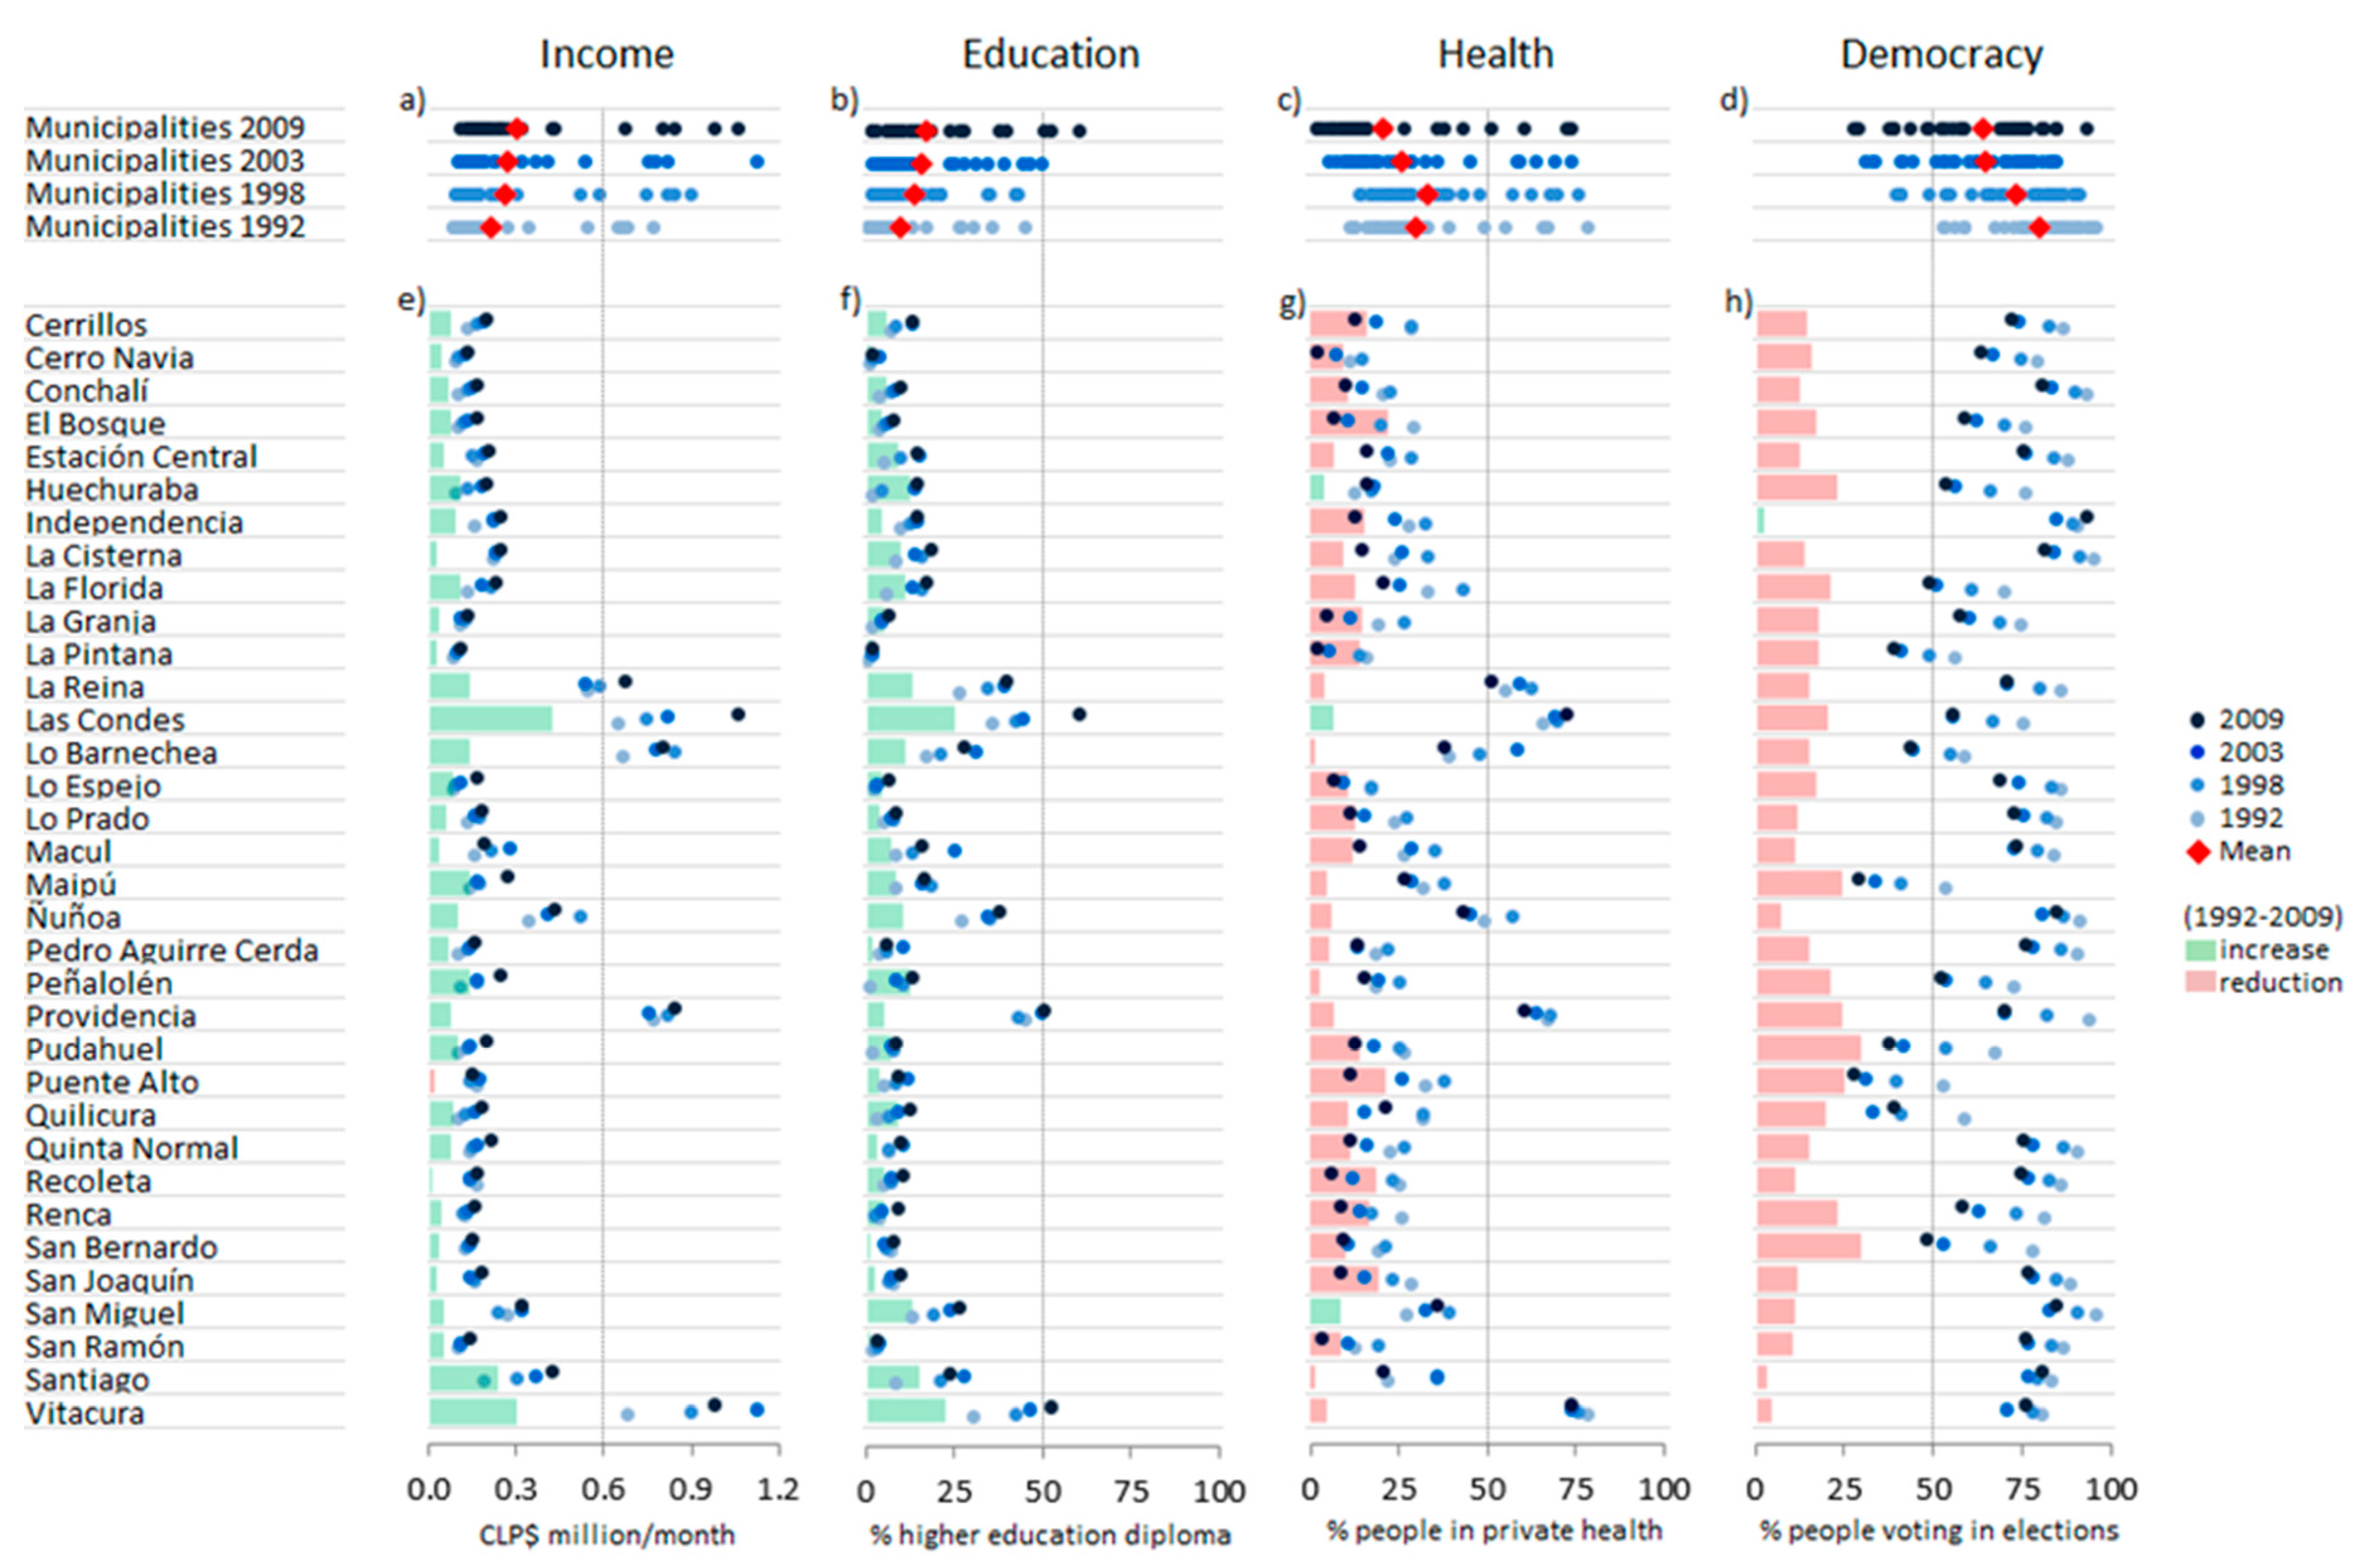
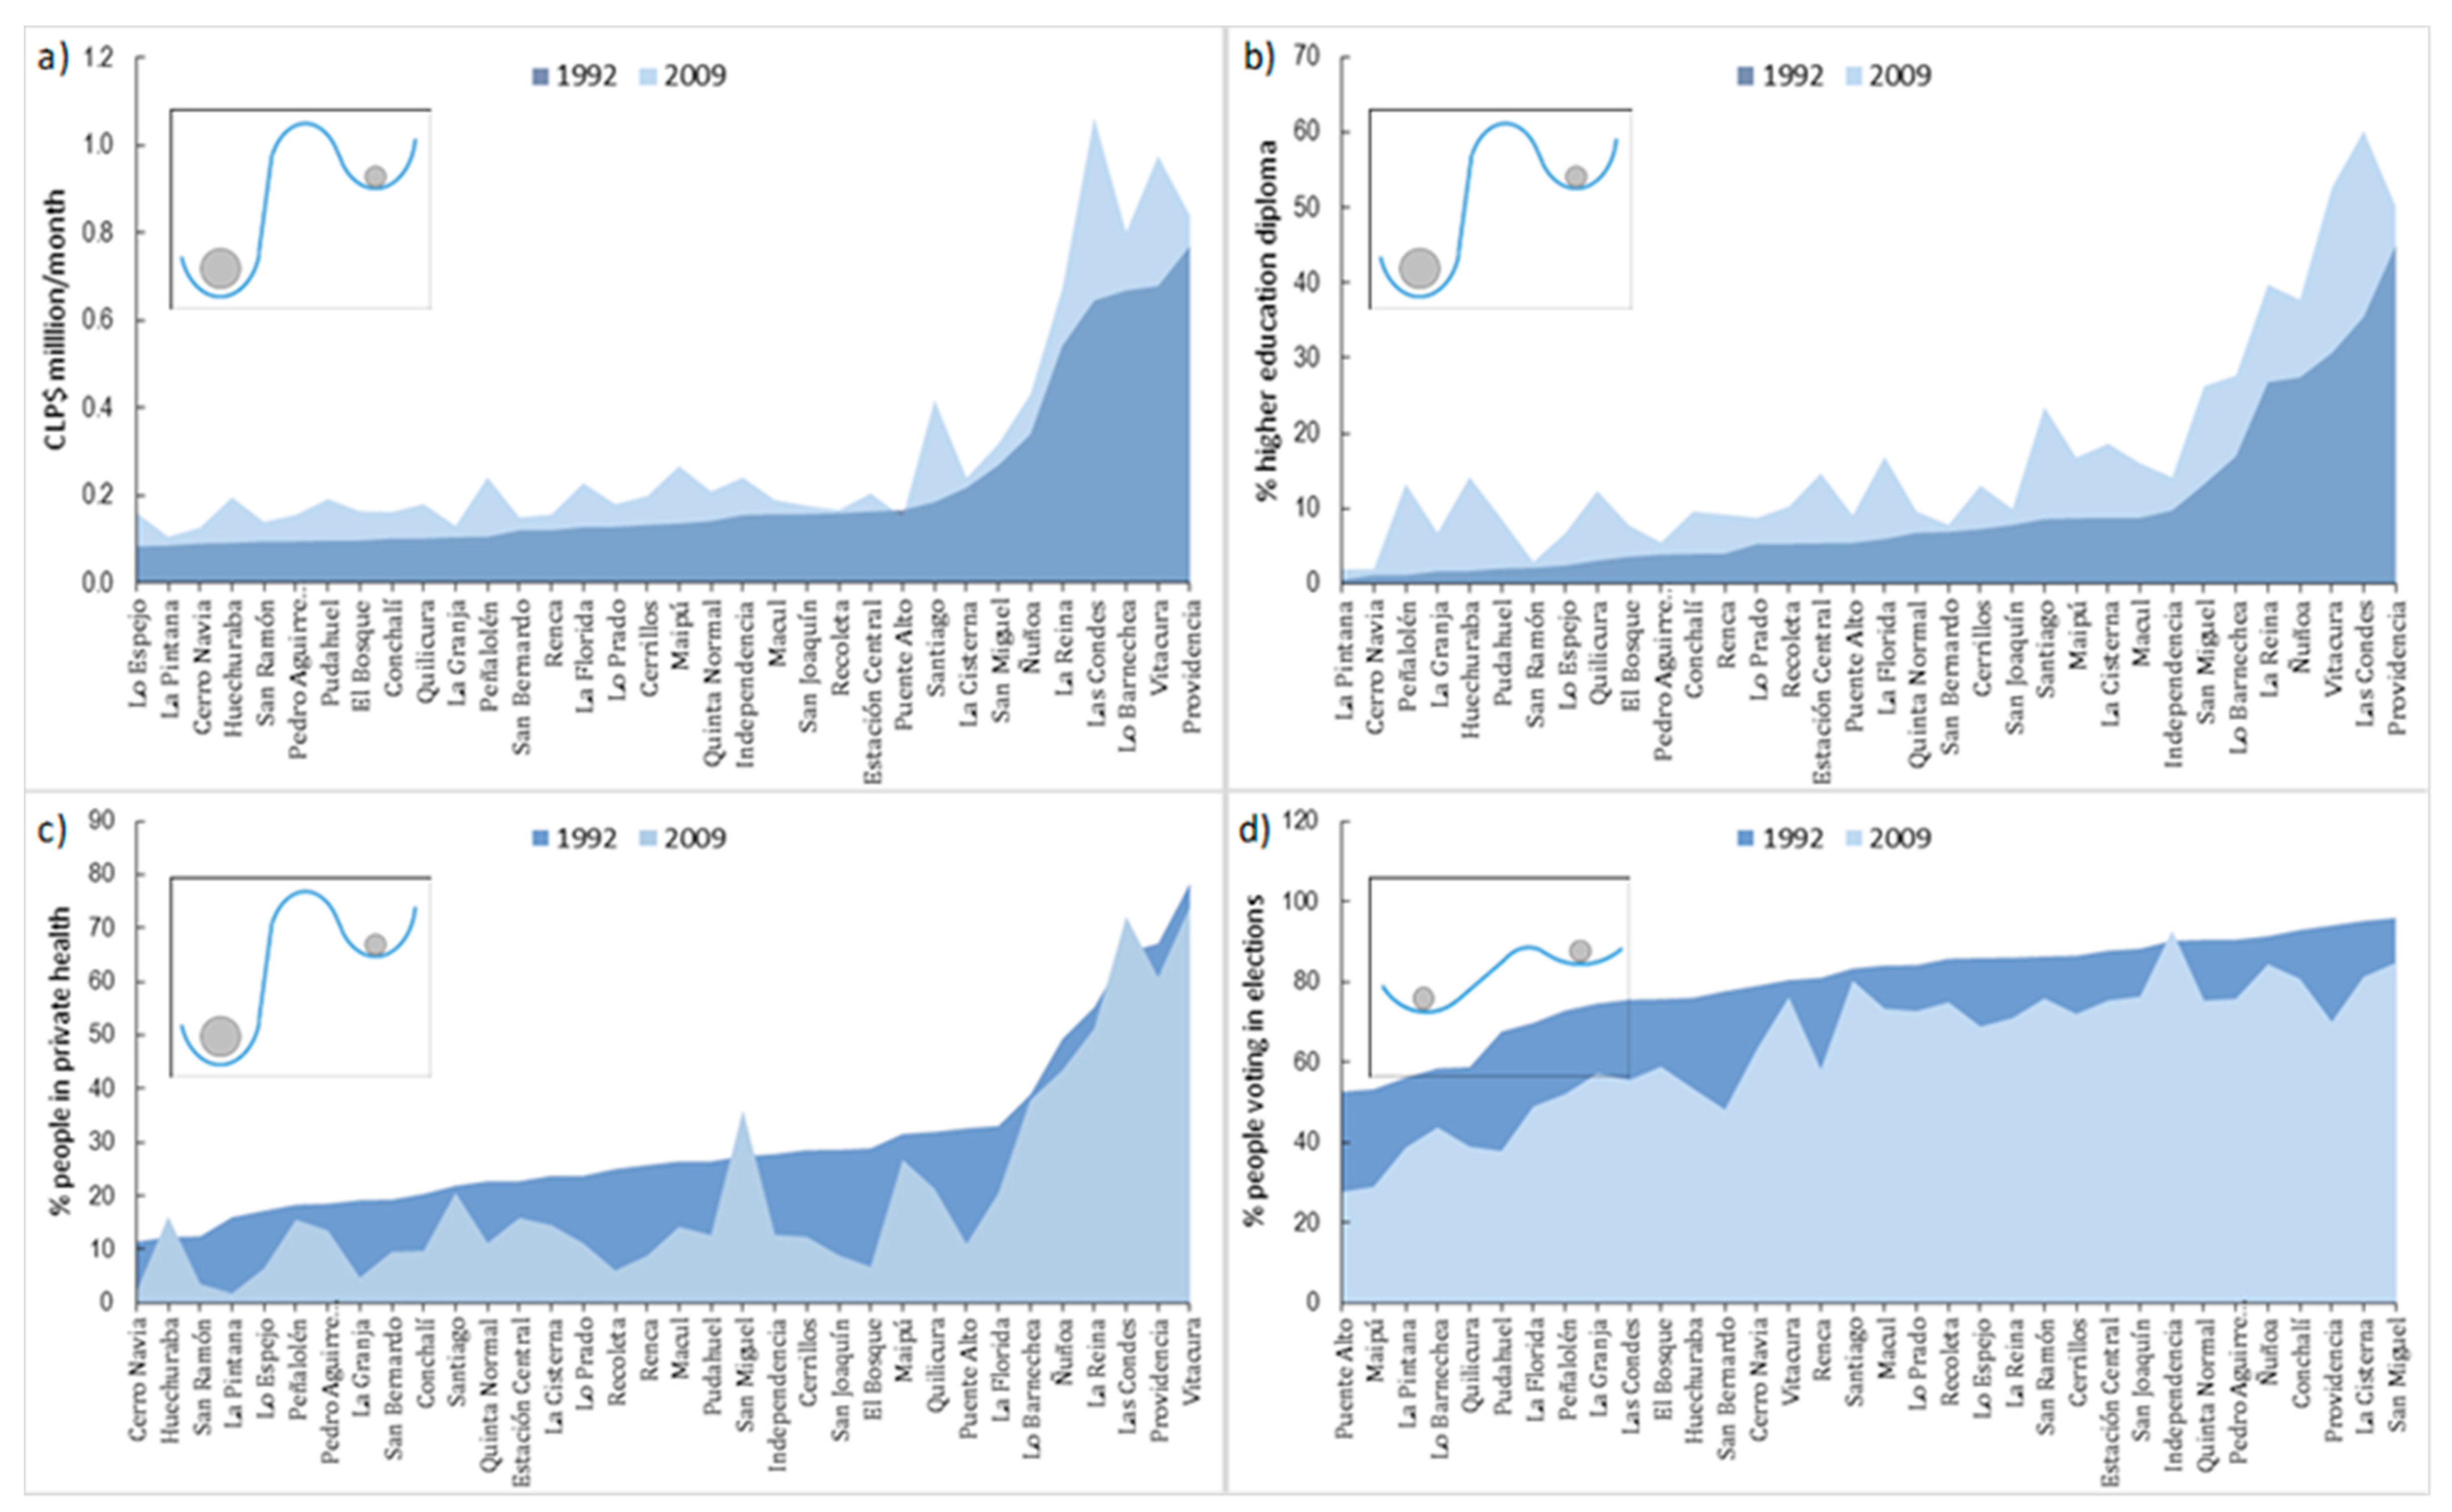
4.1. Temporal Trends of Analyzed Variables

From 1992 to 2009 average per capita income rose in Santiago from 0.22 to 0.30 million 2009-adjusted-CLP$ per month (455 to 849 PPP US dollars per month approximately), and rate of adult people attaining higher degree diploma incremented from 9.62% to 17.20%. In the same period, the average rate of people with access to private health system decreased from 29.68% to 20.41%, and percentage of people voting in elections declined from 79.63% to 63.87% (Figure 4). These overall trends at the city level have not been homogenously distributed among municipalities as indicated by increasing gaps between municipalities’ achievements in the four assessed variables (Figure 4a–d).
Regarding income, all municipalities increased from 1992 to 2009, except for Puente Alto that slightly decreased (Figure 4e). The vast majority of municipalities showing growing income during this period experienced an uninterrupted increase, but some municipalities (i.e., Vitacura, Ñuñoa, Macúl, and Lo Barnechea) experienced a reduction of average income from 2003 to 2009. The increase in income is very uneven between municipalities. Those starting with higher per capita income in 1992 presented larger increases in absolute terms during the analyzed period. Whereas the top five income municipalities in 1992 (i.e., Providencia, Vitacura, Lo Barnechea, Las Condes, and La Reina) increased their averaged income by 0.21 million CLP$ during the analyzed period (from 0.66 to 0.87 million $CLP), the bottom five income municipalities by 1992 (i.e., Lo Espejo, La Pintana, Cerro Navia, Huechuraba, and San Ramon), only increased their averaged income by 0.06 million CLP$ (from 0.09 to 0.15 million $CLP) (Figure 4e). Even though lowest income municipalities experienced a relatively larger increase of incomes than wealthiest municipalities, the much larger absolute increase of income in the wealthiest municipalities rendered a significant growth of the income gap between municipalities from 1992 to 2009 (Figure 4a).
In relation to education, all municipalities increased rates of higher education diploma attainment from 1992 to 2009 (Figure 4f). However, as with income, there is a large disparity across municipalities. Las Condes, Vitacura, Santiago, San Miguel and La Reina show the largest increases (Figure 4f). Except for Santiago, all of these municipalities were amongst the top 10 of higher education diploma rates in 1992. Whereas average increase for the top five “most educated” municipalities (i.e., Providencia, Las Condes, Vitacura, Ñuñoa, and La Reina) was 15.05%, the bottom five municipalities (i.e., La Pintana, Cerro Navia, Peñalolén, La Granja, and Huechuraba) only grew 6.40%. Although some municipalities at the bottom significantly increased (e.g., Peñalolén, and Huechuraba), the relatively larger increase of some at the top (e.g., Las Condes, and Vitacura) enlarged the educational gap (Figure 4b).
Percentage of people with access to private health increased from 1992 to 1998, but there was a strong decline from 1998 to 2009, which led to an overall reduction of people with access to private heath for the 1992–2009 period (Figure 4c). All but three municipalities (i.e., Huechuraba, Las Condes, and San Miguel) decreased rates of people with access to the private health system during the analyzed period. This reduction was larger in those municipalities historically presenting medium rates of access to private health (e.g., San Joaquin, Recoleta, El Bosque, and Puente Alto), whereas municipalities with historically larger access rates (e.g., Vitacura, Providencia, and La Reina) presented only slight reductions (Figure 4g). The dissimilar trends experienced by different municipalities increased the gap in access to private health (Figure 4c).
Regarding percentage of people voting in elections, all but one municipality (i.e., Independencia) declined during the analyzed period (Figure 4h). This generalized decline is not evenly distributed among municipalities with some experiencing strong reductions (e.g., Pudahuel, San Bernardo, Puente Alto, and Maipú), and others presenting only slight declines (e.g., Santiago, and Vitacura). Municipalities with the largest decline are those presenting the lowest percentage of people voting in 1992 (Figure 3h). In fact, whereas the top five voting municipalities in 1992 (i.e., Conchalí, La Cisterna, Ñuñoa, Providencia, and San Miguel) reduced their averaged absolute participation in elections by 13.67% (from 93.85% in 1992 to 80.19% in 2009), the bottom five voting municipalities (i.e., La Pintana, Lo Barnechea, Maipú, Puente Alto, and Quilicura) reduced their participation by 20.27% (from 55.85% to 35.58%). As with the other variables, dissimilar trends of municipalities during the assessed period enlarged the gap of percentage of people voting between municipalities (Figure 4d).

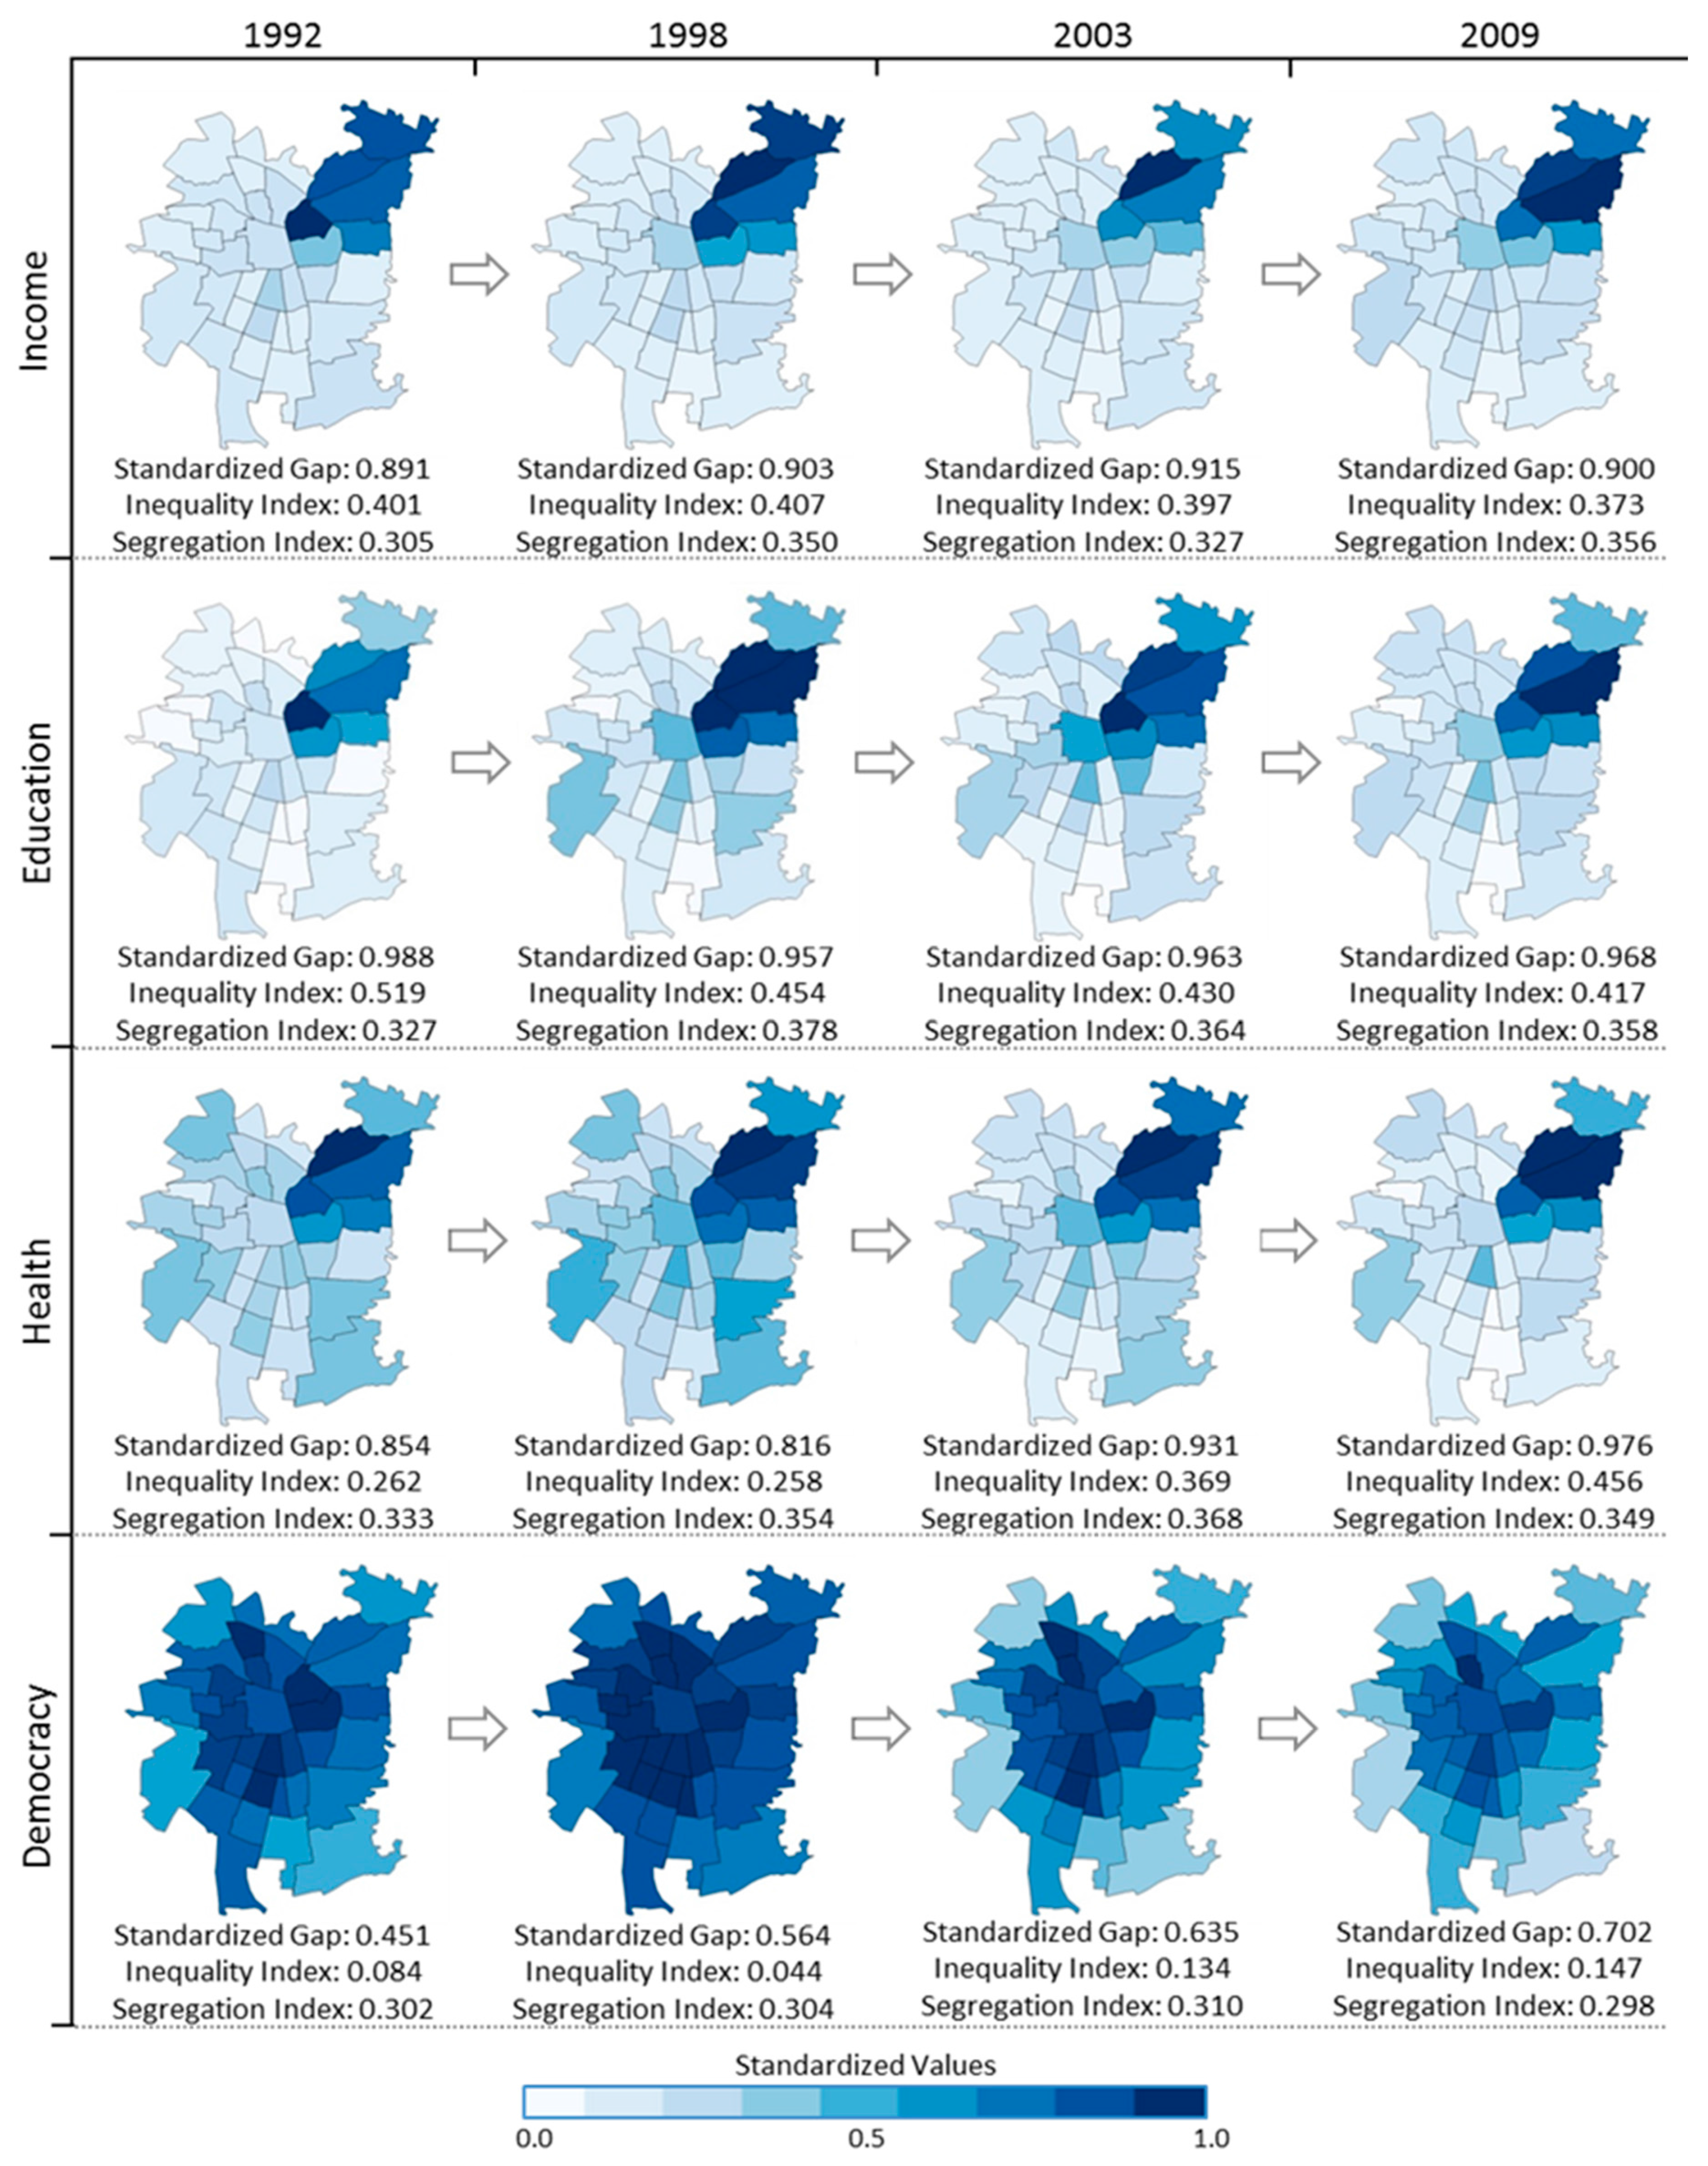
4.2. Temporal Trends of Spatial Inequalities and Segregation

When original data are transformed to standardized indicators and mapped to evaluate the role of the spatial dimension in Santiago’s inequalities, resilient patterns of segregation and uneven spatial distribution of development opportunities become evident (Figure 5). In general, the six municipalities situated in the northeastern cone of Santiago (i.e., La Reina, Las Condes, Lo Barnechea, Ñuñoa, Providencia, and Vitacura) tend to consistently concentrate the largest income, highest rates of higher education diploma, and highest rates of access to the private health system for all the assessed years. Democracy is the only exception as the highest percentages of people voting in elections concentrate on historical municipalities near the city center (Figure 5).
The standardized gap between municipalities shows the existence of huge gaps (i.e., >0.8) between municipalities for income, education and health indicators for all the assessed years (Figure 5). Whereas the income gap increased from 0.891 to 0.915, the education gap decreased from 0.988 to 0.968. The health gap significantly increased from 0.854 to 0.976. Democracy had the smallest gap, but it experienced the largest increase, going from 0.451 in 1992 to 0.702 in 2009 (Figure 5).
In terms of our inequality index, all values were consistently high, but trends were mixed. While income inequality slightly decreased and education significantly decreased, health and democracy significantly increased (Figure 5). Education is the indicator experiencing the largest reduction of inequalities between municipalities, experiencing a constant reduction from 0.519 to 0.417. While income inequalities decrease during the assessed period, this reduction was not constant, presenting a slight increase from 1992 to 1998 and then a slight reduction towards 2009. Although health experienced a slight reduction from 1992 to 1998, it was largely offset by its exponential increase from 1998 to 2009. Democracy presents a similar temporal pattern of inequalities, with reductions by 1998 and then a larger increase towards 2009 (Figure 5).
In regards to the level of segregation, results show a strong and persistent pattern of segregation for all assessed indicators independently of inequality trends (Figure 5). Income indicator shows the largest increase of segregation between 1992 and 2009, followed by education and health. Democracy seems to have remained stable during the analyzed period (Figure 5). Income, education, and health indicators show a strong and increasing level of correlation during the analyzed period (Table 1), suggesting the presence of positive feedback loops consolidating or reinforcing observed inequalities.

4.3. Changes in the Inequality Landscape

Ranking municipalities from lower to higher level of achievement for each of the analyzed human development assets provides a striking picture of the resilient patterns of inequalities and segregation of Santiago (Figure 6), and links our results to the conceptual models presented in Figure 1 and Figure 2. Whereas almost all municipalities have experienced changes in the achievements of development assets from 1992 to 2009, the general pattern of these achievements has remained almost unaltered (Figure 6). This is evidence of a resilient pattern where the urban system has been changing (improving human development across the board) while at the same time preserving its basic structure, function and identity of spatial inequality and segregation. Patterns for income, education and health reveal an inequality landscape characterized by a large group of municipalities locked in an attractor of lower development and opportunities, and a small group of municipalities locked in an attractor of high development and opportunities (Figure 6a–c). This small group of municipalities encompasses a cluster of six municipalities located in the northeastern part of Santiago (i.e., Las Condes, La Reina, Lo Barnechea, Ñuñoa, Providencia, and Vitacura), highlighting the role of the spatial dimension in Santiago’s inequalities. In contrast, democracy presented less spatial segregation and a more homogenous distribution across municipalities (Figure 6d).

5. Discussion

Our results support the argument that spatial segregation generated due to neoliberal reforms implemented during the dictatorship may play a key role in the resilient patterns of inequalities observed in Santiago. Maps in Figure 5 show that inequality follow a clear pattern of segregation represented by an isolated cluster of higher developed municipalities located at the northeastern part of the city. Spatial segregation may act as a mechanism that reinforces income inequalities by spatially clustering the lower income population in areas with lower access to human development assets, such as education [69], health [70] and housing [71]. This suggests that the neoliberal model prevailing in Chile is limiting the access to development assets (e.g., private health, and higher education) for lower income sectors [66,72]. This limitation may not only be due to monetary or income restrictions of families but also because of planning policies promoting spatial segregation, such as the implementation of housing projects for low income sectors in perimeter areas with limited access to services [71]. Furthermore, as the vast extent of urban soil in Santiago is privately owned and their prices controlled by the market, people living in less developed municipalities will be unlikely to ever amass economic resources necessary to afford migrating to the richer municipalities that concentrate development opportunities [12]. Public housing projects have also been planned under the logic of market land prices under neoliberal policies, which means that the vast majority of housing projects are located on less expensive lands at the fringes of lower income municipalities [24,71,73]. Although the overall level of development can improve across the board, our data shows that income and access to development assets opportunities are positively correlated. This suggests positive feedbacks between income, access to private health and education, and political participation. Indeed, policies aiming to increase people´s income (e.g., through government transfers) in lower development level municipalities will probably have little effects in increasing the access to development opportunities, because private health facilities are mostly located in richer municipalities, and the quality of schools is strongly positively associated with municipal development level [10,74]. Therefore, even though people in lower development municipalities could afford paying university tuitions through education credits, the lower education quality they receive at the school level would make difficult for them to achieve the scores in the standardized test required to enroll in Chile’s selective university system. Nevertheless, additional data would be needed to test for a causal link between income and human development assets and the feedback between spatial segregation and inequalities. For instance, our analysis suggests but cannot confirm whether individuals inhabiting municipalities in the northeastern corner of Santiago are more likely to get a higher education diploma or access private health care because they happen to live there or simply because their higher incomes. However, positive results from few experimental policies aimed at relocating “slums” within wealthier areas via housing projects tend to support our argument [73].
In relation to participation in democratic election processes, the lack of association between the spatial pattern of democracy indicator and patterns of the other three indicators may suggest that participation in formal democracy is not affected by educational or income level. However, a deeper analysis of our raw data reveals that the percentage of null and blank votes by municipality is strongly negatively correlated to the income of municipalities (Pearson correlation coefficients of −0.84, −0.83, −0.56, and −0.61 for the four assessed years; p < 0.001 for all years). As blank and null votes could easily represent more than 10% of total votes in lower income municipalities, this implies that there could be a hidden reduction of democratic participation in low-income municipalities that is not revealed by our data. Although it is difficult to assess if this level of null and blank votes is part of the called “protest votes”, or simply reflect people that were afraid to be fined by not voting while been previously registered in the electoral system, data from recent elections support the later. In fact, an analysis from the 2012 municipal election, which was done under a fully voluntary voting system, reveals that the percentage of people voting per municipality in Santiago is positively correlated with municipalities’ income level [75]. Therefore, this suggests that municipalities located in the northeastern part of Santiago have not only persistently concentrated the largest incomes, rates of higher education diploma, and access to the private health system, but have also increasingly accumulated a relatively larger weight in democratic election processes.
A limitation of our study is that we are assessing a small number of human development assets representing a small fraction of the universe of variables that are relevant for human development and quality of life [76,77]. Furthermore, the development assets explored here are not the only segregating spatial factors that may promote the resilience of inequality in Santiago. For instance, uneven distribution of green areas [61], urban vegetation cover [78], heat risk [79], and air pollution [80] are environmental factors that may also support the resilience of inequalities between municipalities. Thus, our data has to be interpreted with caution as it just evaluates trends of inequalities and segregation in some key human development assets, but do not reflect temporal trends of quality of life between Santiago’s municipalities. In fact, quality of life has been increased in almost all municipalities of Santiago during the last 15 years, but inequalities have remained almost unaltered [81].

Challenges for Breaking Resilience and Navigating towards a Sustainable Urban Development

Urban resilience typically describes the property of an urban system to bounce back to a resilient state after being exposed to an external shock [35,82]. This definition makes much sense in the context of enhancing a city’s adaptation to climate change, where environmental variability is safely assumed to be undesirable, and resilience becomes an effective property of the urban system to cope with the negative effects of increasing variability [83]. However, resilience should not always be assumed as an intrinsically valuable dynamic for social-ecological organization. Ecosystems self-organize and increase complexity in deterministic ways by building structures, feedbacks, functions, and identities that are contingent on biophysics. Resilience allows this intrinsically good self-organization to persist, through change and despite environmental shocks, so that the ecosystem keeps building complexity. In contrast, social-ecological organization is contingent on socio-political decisions, which forces us to ask: “organization and complexity for what?” [34]. As the case of Santiago shows, the structures, functions, feedbacks and identities of an urban system are neither just instrumental (to build a good organization, complexity and stability) nor neutral. They are the consequence of political decisions and carry out strong implications for justice and equity. Therefore, the desirability of urban resilience needs to be understood as contingent on who benefits from what types of structures, functions, feedbacks and identities. In this view, resilience can become an obstacle for urban sustainability. From a sustainability perspective, the resilience of a highly unequal urban system needs to be broken.
The current inequality landscape of Santiago is a long-lasting legacy from neoliberal urban planning policies implemented in the 1980s during Pinochet’s dictatorship. Key factors explaining segregation and inequality include the disproportionate role of the private sector deciding on the allocation of key urban infrastructure, absence of central metropolitan authority, lack of coordination between national and local authorities, powerless urban planning regulations, unbalanced budgets among municipalities, dissimilar planning rules and urban visions between municipalities, and lack of public participation in decision-making [84]. Whereas several of these factors have been long pointed as main drivers of segregation and inequalities in Santiago [21,85], democratic elected governments have been so far unsuccessful in transforming this highly resilient and uneven urban development model. Santiago might be trapped in what Marschke and Berkes (2006) [86] described as “bad resilience”: a self-reinforcing feedback that locks the system into an undesirable regime or attractor (see also [48]).
The lack of substantial reforms to the neoliberal urban planning policies is probably rooted in the large influence that the Chilean economic elite has had in political decisions in Chile, which is increasingly seen as one of the key factors limiting attempts to make structural changes to the neoliberal prevailing model [87]. Spatial segregation in Santiago may be favoring the coalescence and coordination of the elite and therefore contributing to the resilience of inequality. Although the tight coupling between political and economic elites allowed these groups to conserve an asymmetrical power relation that has largely reinforced their privileges, it has also led to rising levels of social protest against the prevailing development model, irruption of empowered social movements, and high levels of distrust in current political institutions [88]. Whereas the irruption of these social movements and distrust in political institutions is perceived by politicians as a worrying crisis, from an urban sustainability perspective they can be seen as symptoms of an imminent transformation process that could provide a window of opportunities for breaking resilience and transitioning into a new urban development model. For instance, during the last decade (2006–2016) an increasing transformative politics is appearing led among others by the student movement that exploded in the political arena in 2011 [89]. This nationwide social movement has as its goal the elimination of the profit and market model in the education system, proposing that education (at all levels, from elementary to university) must be free for all because it must be conceptualized as a social right, not a commodity.
During the Presidential campaign of 2013, Michele Bachelet picked up the student movement demands, promising to reform the education system in order to provide free education if she was elected. In December 2013, she was finally elected with 64% of the vote in the second round, which clearly expressed the support and legitimacy of the student’s demands for Chilean society, particularly in Santiago. Since Bachelet took the office in 2014, there has been a national process of deliberation—in the parliament, political circles, the student movement, and Chilean society in general—about how to implement reforms and navigating from a privatized/paid to public/free education system. Indeed, all these processes and outcomes can be interpreted as a partial triumph of the transformative politics led by the student social movement. We say ‘partial’ because it is still being debated and no final decisions have been made yet, but the promise is that universal, public, and free education will be implemented before Bachelet leaves office in 2018. Therefore, the transformative processes led by Chilean students are very significant because they suggest that social mobilization is one of the key factors for breaking the resilient patterns of inequality existing in Santiago and in other Chilean cities. In this case, the resilient pattern of uneven development produced by the privatization of education during the Pinochet dictatorship. The student struggles are precisely seeking to open the University for people excluded during these neoliberal decades, the majority of them living in segregated and lower incomes municipalities like those located in southern and western areas of Gran Santiago.
Social-ecological systems dynamics have been described in resilience literature as proceeding through phases of institutional stability, challenge, crisis, and reorganization, with the possibility of getting locked in any of these phases, or to reorganize and transform into a new different system [48]. Transformations often involve changes in perceptions, social networks, leadership interactions, power relations, organizations and institutional arrangements [32]. All of these transformative elements are present in Chile’s socio-political landscape, and the current government is already implementing structural reforms (e.g., the mentioned educational one, tributary, labor market, health, retirement, and a new Constitution) that seek to reduce the large levels of inequality prevailing in Chile. Even though these reforms are necessary, our conceptual model and supporting results indicate that they will have little effect unless they are linked to a new urban development model that is capable of reshaping the current inequality-resilience stability landscape. Although a new urban development policy explicitly addressing urban segregation problems has also been proposed [90], this document only set principles and guidelines, and it does not have any legal binding. Conversion of these proposals into effective urban planning regulations could be inspired by urban resilience analyses like the one presented here. However, the real test for breaking the resilient patterns of inequality and segregation still entails overcoming the opposition of powerful sectors that have benefited from neoliberal urban policies. Social movements have been gradually contesting elites through the democratic political struggles, which can be considered a major driver for breaking bad resilience in Santiago and elsewhere. Results from our work may provide insightful information for policy-makers, but can also inform social movements for embracing reduction of urban segregation as one of their key demands.

Acknowledgments

This material is based upon work supported by the United States National Science Foundation under Grant Number 1444755, and Chilean National Commission for Scientific and Technological Research Grant FONDAP/15130015. We would also like to thanks Cristián Massad, from Ecomabi Foundation, for his help processing data from CASEN survey.

Author Contributions

Ignacio C. Fernández conceived, designed and led the research and writing process for this manuscript. Ignacio C. Fernández performed the statistical analysis. Ignacio C. Fernández, David Manuel-Navarrete and Robinson Torres-Salinas developed the methodological framework. Ignacio C. Fernández and David Manuel-Navarrete developed the conceptual models. Ignacio C. Fernández, David Manuel-Navarrete and Robinson Torres-Salinas wrote the manuscript.

Conflicts of Interest

The authors declare no conflict of interest.

References

  1. OECD. Statistics. Available online: http://0-www-oecd--ilibrary-org.brum.beds.ac.uk/statistics (accessed on 20 May 2016).
  2. CEPAL. Statistics and Indicators. Available online: http://estadisticas.cepal.org/cepalstat (accessed on 20 May 2016).
  3. The World Bank GINI Index. Available online: http://data.worldbank.org/indicator (accessed on 20 May 2016).
  4. Azócar, G.; Romero, H.; Sanhueza, R.; Vega, C.; Aguayo, M.; Muñoz, M.D. Urbanization patterns and their impacts on social restructuring of urban space in Chilean mid-cities: The case of Los Angeles, Central Chile. Land Use Policy 2007, 24, 199–211. [Google Scholar] [CrossRef]
  5. Borsdorf, A.; Hidalgo, R.; Sánchez, R. A new model of urban development in Latin America: The gated communities and fenced cities in the metropolitan areas of Santiago de Chile and Valparaíso. Cities 2007, 24, 365–378. [Google Scholar] [CrossRef]
  6. Orellana, A. Indice de Calidad de Vida Urbana Ciudades Chilenas; ICVU: Santiago, Chile, 2015. [Google Scholar]
  7. Rodriguez, A.; Rodriguez, P.; Saborido, M.; Segovia, O.; Mires, L. Visible and invisible violence and inequality in neoliberal Santiago. Environ. Urban. 2014, 26, 359–372. [Google Scholar] [CrossRef]
  8. Ffrench-Davis, R. Economic Development in Chile since the 1950s. In Economic Reforms in Chile: From Dictatorships to Democracy; Solimano, A., Ed.; The University of Michigan Press: Ann Arbor, MI, USA, 2002; pp. 2–28. [Google Scholar]
  9. Holst, J.; Laaser, U.; Hohmann, J. Chilean health insurance system: A source of inequity and selective social insecurity. J. Public Health 2004, 12, 271–282. [Google Scholar] [CrossRef]
  10. Elacqua, G. The impact of school choice and public policy on segregation: Evidence from Chile. Int. J. Educ. Dev. 2012, 32, 444–453. [Google Scholar] [CrossRef]
  11. Posner, P.W. Targeted assistance and social capital: Housing policy in Chile’s neoliberal democracy. Int. J. Urban Reg. Res. 2012, 36, 49–70. [Google Scholar] [CrossRef]
  12. Valencia, M.A. El desmontaje de la planeación urbana en Chile 1975–1985. La nueva política de desarrollo urbano y transformaciones en la cultura metropolitana. Rev. Diseño Urbano y Paisaje 2008, 5, 1–23. (In Spanish) [Google Scholar]
  13. Scarpaci, J.L.; Infante, R.P.; Caete, A. Planning residential segregation: The case of Santiago, Chile. Urban Geogr. 1988, 9, 19–36. [Google Scholar] [CrossRef]
  14. UN-Habitat. Construction of more Equitable Cities: Public Policies for Inclusion in Latin America; United Nations Human Settlements Programme: Nairobi, Kenya, 2014. [Google Scholar]
  15. Ferreiro, S. Retrato de la Desigualdad en Chile; Senado Congreso Nacional de Chile: Valparaíso, Chile, 2012. (In Spanish) [Google Scholar]
  16. UNDP. Human Development Report 1990; United Nations Development Programme: New York, NY, USA, 1990. [Google Scholar]
  17. Grant, U. Spatial Inequality and Urban Poverty Traps; ODI Working Paper; Overseas Development Institute: London, UK, 2010. [Google Scholar]
  18. Bebbington, A.J.; Dani, A.A.; de Haan, A.; Walton, M. Insitutional Pathways to Equity: Addressing Inequality Traps; The World Bank: Washington, DC, USA, 2008. [Google Scholar]
  19. Pressacco, C.; Salvat, P. Consideraciones Críticas Sobre Política Pública y Social de los Gobiernos Concertación: Chile, 1990–2010. Del Crecimiento con Equidad al Crecimiento Basado en la Competencia y el Subsidiarismo Generalizado? Papel Político 2012, 17, 85–118. (In Spanish) [Google Scholar]
  20. Murray, W.E.; Overton, J.D. Neoliberalism is dead, long live neoliberalism? Neostructuralism and the international aid regime of the 2000s. Prog. Dev. Stud. 2011, 11, 307–319. [Google Scholar] [CrossRef]
  21. Dockemdorff, E.; Rodríguez, A.; Winchester, L. Santiago de Chile: Metropolization, globalization and inequity. Environ. Urban. 2000, 12, 171–183. [Google Scholar] [CrossRef]
  22. Borsdorf, A.; Hidalgo, R. New dimensions of social exclusion in Latin America: From gated communities to gated cities, the case of Santiago de Chile. Land Use Policy 2008, 25, 153–160. [Google Scholar] [CrossRef]
  23. Ruiz-Tagle, J.; López, E. El estudio de la segregación residencial en Santiago de Chile: Revisión crítica de algunos problemas metodológicos y conceptuales. EURE 2014, 40, 25–48. (In Spanish) [Google Scholar] [CrossRef]
  24. Sabatini, F.; Wormald, G.; Sierralta, C.; Peters, P.A. Residential segregation in Santiago: Scale-Related effects and trends, 1992–2002. In Urban Segregation and Governance in the Americas; Roberts, B.R., Wilson, R.H., Eds.; Palgrave Macmillan: New York, NY, USA, 2009; pp. 121–143. [Google Scholar]
  25. Agostini, C.A. Pobreza, desigualdad y segregación en la Region Metropolitana. Estud. Públicos 2010, 117, 219–268. (In Spanish) [Google Scholar]
  26. Solimano, A. Three Decades of Neoliberal Economics in Chile: Achievements, Failures and Dilemmas; UNU-WIDER Working Papers; UNU-WIDER: Helsinki, Finland, 2009. [Google Scholar]
  27. Contreras, D.; Ffrench-davis, R. Policy Regimes, Inequality, Poverty and Growth: The Chilean Experience, 1973–2010; UNU-WIDER Working Papers; UNU-WIDER: Helsinki, Finland, 2012. [Google Scholar]
  28. Olavarría-Gambi, M. Beyond income: Analysis of inequality in Chile from 1980 to 2000 decades. Tékhne 2012, 10, 39–53. [Google Scholar] [CrossRef]
  29. Satterthwaite, D. The political underpinnings of cities’ accumulated resilience to climate change. Environ. Urban. 2013, 25, 381–391. [Google Scholar] [CrossRef]
  30. Manuel-Navarrete, D.; Pelling, M.; Redclift, M. Critical adaptation to hurricanes in the Mexican Caribbean: Development visions, governance structures, and coping strategies. Glob. Environ. Chang. 2011, 21, 249–258. [Google Scholar] [CrossRef]
  31. Holling, C.S. Resilience and Stability of Ecological Systems. Annu. Rev. Ecol. Syst. 1973, 4, 1–23. [Google Scholar] [CrossRef]
  32. Folke, C.; Carpenter, S.R.; Walker, B.; Scheffer, M.; Chapin, T.; Rockström, J. Resilience thinking: Integrating resilience, adaptability and transformability. Ecol. Soc. 2010, 15, 20. [Google Scholar]
  33. Walker, B.; Holling, C.S.; Carpenter, S.R.; Kinzig, A. Resilience, Adaptability and Transformability in Social—Ecological Systems. Ecol. Soc. 2004, 9, 5. [Google Scholar]
  34. Cote, M.; Nightingale, A.J. Resilience thinking meets social theory situating social change in socio-ecological systems (SES) research. Prog. Hum. Geogr. 2012, 36, 475–489. [Google Scholar] [CrossRef]
  35. Davidson, D.J. The Applicability of the Concept of Resilience to Social Systems: Some Sources of Optimism and Nagging Doubts. Soc. Nat. Resour. 2010, 23, 1135–1149. [Google Scholar] [CrossRef]
  36. Manuel-Navarrete, D. Double coupling: Modeling subjectivity and asymmetric organization in social-ecological systems. Ecol. Soc. 2015, 20, 26. [Google Scholar] [CrossRef]
  37. Meerow, S.; Newell, J.P.; Stults, M. Defining urban resilience: A review. Landsc. Urban Plan. 2016, 147, 38–49. [Google Scholar] [CrossRef]
  38. Chelleri, L.; Waters, J.J.; Olazabal, M.; Minucci, G. Resilience trade-offs: Addressing multiple scales and temporal aspects of urban resilience. Environ. Urban. 2015, 27, 181–198. [Google Scholar] [CrossRef]
  39. Vale, L.J. The politics of resilient cities: Whose resilience and whose city? Build. Res. Inf. 2014, 42, 37–41. [Google Scholar] [CrossRef]
  40. Davoudi, S.; Shaw, K.; Haider, L.J.; Quinlan, A.E.; Peterson, G.D.; Wilkinson, C.; Fünfgeld, H.; McEvoy, D.; Porter, L. Resilience: A Bridging Concept or a Dead End? “Reframing” Resilience: Challenges for Planning Theory and Practice Interacting Traps: Resilience Assessment of a Pasture Management System in Northern Afghanistan Urban Resilience: What Does It Mean in Planning? Plan. Theory Pract. 2012, 13, 299–333. [Google Scholar]
  41. Lebel, L.; Anderies, J.M.; Campbell, B.; Folke, C.; Hatfield-Dodds, S.; Hughes, T.P.; Wilson, J. Governance and the capacity to manage resilience in regional social-ecological systems. Ecol. Soc. 2006, 11, 19. [Google Scholar]
  42. Derissen, S.; Quaas, M.F.; Baumgartner, S. The relationship between resilience and sustainability of ecological-economic systems. Ecol. Econ. 2011, 70, 1121–1128. [Google Scholar] [CrossRef]
  43. Redman, C.L. Should sustainability and resilience be combined or remain distinct pursuits? Ecol. Soc. 2014, 19, 37. [Google Scholar] [CrossRef]
  44. Gunderson, L.H.; Holling, C.S. Panarchy: Understanding Transformations in Systems of Humans and Nature; Island Press: Washington, DC, USA, 2002. [Google Scholar]
  45. Wu, J.; Wu, T. Ecological Resilience as a Foundation for Urban Design and Sustainability. In Resilience in Ecology and Urban. Design: Linking Theory and Practice for Sustainable Cities; Pickett, S.T.A., Cadenasso, M.L., McGrath, B., Eds.; Springer Netherlands: Dordrecht, The Netherlands, 2007; pp. 211–229. [Google Scholar]
  46. Folke, C. Resilience: The emergence of a perspective for social-ecological systems analyses. Glob. Environ. Chang. 2006, 16, 253–267. [Google Scholar] [CrossRef]
  47. Elmqvist, T. Urban Resilience Thinking. Solutions 2014, 5, 26–30. [Google Scholar]
  48. Pelling, M.; Manuel-Navarrete, D. From Resilience to Transformation: The Adaptive Cycle in Two Mexican Urban Centers. Ecol. Soc. 2011, 16, 11. [Google Scholar]
  49. Manuel-Navarrete, D.; Pelling, M. Subjectivity and the politics of transformation in response to development and environmental change. Glob. Environ. Chang. 2015, 35, 558–569. [Google Scholar] [CrossRef]
  50. Scheffer, M.; Carpenter, S.; Foley, J.A.; Folke, C.; Walker, B. Catastrophic shifts in ecosystems. Nature 2001, 413, 591–596. [Google Scholar] [CrossRef] [PubMed]
  51. Kay, J.J.; Regier, H.A.; Boyle, M.; Francis, G. An ecosystem approach for sustainability: Addressing the challenge of complexity. Futures 1999, 31, 721–742. [Google Scholar] [CrossRef]
  52. Pickett, S.T.A.; Boone, C.G.; McGrath, B.P.; Cadenasso, M.L.; Childers, D.L.; Ogden, L.A.; McHale, M.; Grove, J.M. Ecological science and transformation to the sustainable city. Cities 2013, 32, S10–S20. [Google Scholar] [CrossRef]
  53. Pickett, S.T.A.; Cadenasso, M.L.; Grove, J.M. Resilient cities: Meaning, models, and metaphor for integrating the ecological, socio-economic, and planning realms. Landsc. Urban Plan. 2004, 69, 369–384. [Google Scholar] [CrossRef]
  54. Solimano, A. Prosperity without Equality: The Chilean Experience after the Pinochet Regime; International Center for Globalization and Development: Santiago, Chile, 2011. [Google Scholar]
  55. Harvey, D. Spaces of Neoliberalization: Towards a Theory of Uneven Geographical Development; Franz Steiner Verlag: Stuttgart, Germany, 2008. [Google Scholar]
  56. Smith, N. Uneven Development. Nature, Capital, and the Production of the Space, 3rd ed.; University of Georgia Press: Athens, GA, USA, 2008. [Google Scholar]
  57. Romero, H.; Vásquez, A.; Fuentes, C.; Salgado, M.; Schmidt, A.; Banzhaf, E. Assessing urban environmental segregation (UES). The case of Santiago de Chile. Ecol. Indic. 2012, 23, 76–87. [Google Scholar] [CrossRef]
  58. United Nations. World Urbanization Prospects: The 2014 Revision; United Nations Department of Economic and Social Affairs: New York, NY, USA, 2015. [Google Scholar]
  59. Aquino, F.; Gainza, X. Understanding Density in an Uneven City, Santiago de Chile: Implications for Social and Environmental Sustainability. Sustainability 2014, 6, 5876–5897. [Google Scholar] [CrossRef]
  60. Borsdorf, A.; Hildalgo, R.; Vidal-Koppmann, S. Social segregation and gated communities in Santiago de Chile and Buenos Aires. A comparison. Habitat Int. 2016, 54, 18–27. [Google Scholar] [CrossRef]
  61. Reyes-Packe, S.; Figueroa, I.M. Distribución, superficie y accesibilidad de las áreas verdes en Santiago de Chile. EURE 2010, 36, 89–110. (In Spanish) [Google Scholar] [CrossRef]
  62. UNDP. Human Development Report 2014; United Nations Development Programme: New York, NY, USA, 2014. [Google Scholar]
  63. Solt, F. Economic inequality and democratic political engagement. Am. J. Political Sci. 2008, 52, 48–60. [Google Scholar] [CrossRef]
  64. UNDP. Human Development Report 2002: Depening. Democracy in a Fragmented World; United Nations Development Programme: New York, NY, USA, 2002. [Google Scholar]
  65. Urzúa, S. La Rentabilidad de la Educación Superior en Chile. Rev. Estud. Públicos 2012, 125, 1–52. (In Spanish) [Google Scholar]
  66. Unger, J.-P.; De Paepe, P.; Cantuarias, G.S.; Herrera, O.A. Chile’s neoliberal health reform: An assessment and a critique. PLoS Med. 2008, 5, e79. [Google Scholar] [CrossRef] [PubMed]
  67. Goic, A. El Sistema de Salud de Chile: Una tarea pendiente. Rev. Med. Chile 2015, 143, 774–786. (In Spanish) [Google Scholar] [CrossRef]
  68. Johnston, R.; Poulsen, M.; Forrest, J. Evaluating changing residential segregation in Auckland, New Zealand, using spatial statistics. Tijdschrift. Econ. Soc. Geogr. 2011, 102, 1–23. [Google Scholar] [CrossRef]
  69. Alves, F.; Elacqua, G.; Koslinki, M.; Martinez, M.; Santos, H.; Urbina, D. Winners and losers of school choice: Evidence from Rio de Janeiro, Brazil and Santiago, Chile. Int. J. Educ. Dev. 2015, 41, 25–34. [Google Scholar] [CrossRef]
  70. Sánchez, H.R.; Albala, C.B. Mortalidad Del Adulto En Comunas. Rev. Méd. Chile 2004, 132, 453–460. (In Spanish) [Google Scholar] [CrossRef] [PubMed]
  71. Peters, P.A. Spatial Segregation in Complex Urban Systems: Housing and Public Policy in Santiago, Chile. Ph.D. Thesis, The University of Texas at Austin, Austin, TX, USA, May 2009. [Google Scholar]
  72. Torche, F. Privatization Reform and Inequality of Educational Opportunity: The Case of Chile. Sociol. Educ. 2005, 78, 316–343. [Google Scholar] [CrossRef]
  73. Brain, I.; Cubillos, G.; Sabatini, F. Integración social urbana en la nueva política habitacional. Temas Agenda Pública 2007, 2, 1–15. (In Spanish) [Google Scholar]
  74. Manzi, J.; Strasser, K.; Martín, E.S.; Contreras, D. Quality of Education in Chile; Centro de Medición UC: Santiago, Chile, 2008. [Google Scholar]
  75. PNUD. Condicionantes de la Participación Electoral en Chile; Programa de las Naciones Unidas para el Desarrollo: Santiago, Chile, 2015. (In Spanish) [Google Scholar]
  76. Marans, R.W. Quality of urban life & environmental sustainability studies: Future linkage opportunities. Habitat Int. 2015, 45, 47–52. [Google Scholar]
  77. Alkire, S. Dimensions of human development. World Dev. 2002, 30, 181–205. [Google Scholar] [CrossRef]
  78. Escobedo, F.J.; Nowak, D.J.; Wagner, J.E.; De la Maza, C.L.; Rodríguez, M.; Crane, D.E.; Hernández, J. The socioeconomics and management of Santiago de Chile’s public urban forests. Urban For. Urban Green. 2006, 4, 105–114. [Google Scholar] [CrossRef]
  79. Peña, M. Relationships between remotely sensed surface parameters associated with the urban heat sink formation in Santiago, Chile. Int. J. Remote Sens. 2008, 29, 4385–4404. [Google Scholar] [CrossRef]
  80. Escobedo, F.J.; Nowak, D.J. Spatial heterogeneity and air pollution removal by an urban forest. Landsc. Urban Plan. 2009, 90, 102–110. [Google Scholar] [CrossRef]
  81. Orellana, A.; Bannen, P.; Fuentes, L.; Gilabert, H.; Pape, K. Traces of the metropolization process in Chile. Rev. Invi. 2013, 28, 17–66. [Google Scholar]
  82. Leichenko, R. Climate change and urban resilience. Curr. Opin. Environ. Sustain. 2011, 3, 164–168. [Google Scholar] [CrossRef]
  83. Jabareen, Y. Planning the resilient city: Concepts and strategies for coping with climate change and environmental risk. Cities 2013, 31, 220–229. [Google Scholar] [CrossRef]
  84. Hölzl, C.; Nuissl, H. Urban policy and spatial planning in a globalized city—A stakeholder view of Santiago de Chile. Plan. Pract. Res. 2014, 29, 21–40. [Google Scholar] [CrossRef]
  85. Rodríguez, A.; Winchester, L. Santiago de Chile. In Santiago en la Globalización: Una Nueva Ciudad; De Mattos, C., Ducci, M.E., Rodríguez, A., Yáñez, G., Eds.; Ediciones Sur/Libros Eure: Santiago, Chile, 2004; pp. 115–136. (In Spanish) [Google Scholar]
  86. Marschke, M.J.; Berkes, F. Exploring Strategies That Build Livelihood Resilience: A Case From Cambodia. Ecol. Soc. 2006, 11, 42. [Google Scholar]
  87. Solimano, A. Elites, Concentración Económica y Corrupción en Chile: Las Sombras de un País Modelo. Red de Estudios para la Profundización Democrática, 14 May 2015. (In Spanish) [Google Scholar]
  88. Mayol, A.; Azócar, C. Politización del malestar, movilización social y transformación ideológica: El caso “Chile 2011”. Polis (Santiago) 2011, 10, 163–184. (In Spanish) [Google Scholar] [CrossRef]
  89. Stromquist, N.P.; Sanyal, A. Student resistance to neoliberalism in Chile. Int. Stud. Sociol. Educ. 2013, 23, 152–178. [Google Scholar] [CrossRef]
  90. MINVU; PNUD. Política Nacional de Desarrollo Urbano; Ministerio de Vivienda y Urbanismo de Chile: Santiago, Chile, 2014. (In Spanish) [Google Scholar]
Figure 1. Conceptual model of four ideal types of inequality-resilience stability landscapes. The shape of the lines depicts the stability landscape. Balls are neighborhoods with different relative development levels. Inequality level is represented by the difference of balls position in the Y-axis, and resilience by the height of the hill and the depth of the basin.
Sustainability 08 00820 g001
Figure 2. Conceptual framework of the resilient spatial patterns of inequalities in Santiago. This figure shows the stability landscape at times 1 (blue) and 2 (red) for a large set of low development municipalities (larger ball), and a segregated cluster of higher development municipalities (smaller ball). Position along the Y-axis characterizes the cluster’s level of development, and the relative difference between two clusters expresses the city’s inequalities. Position along the X-axis represents the relative difference of access to development opportunities for each cluster, which are largely driven by the level of spatial segregation (shape of the hill). Policies may improve the system’s overall level of development without reducing inequalities or segregation.
Sustainability 08 00820 g002
Figure 3. Map showing the 34 municipalities making up the Greater Santiago urban area.
Sustainability 08 00820 g003
Figure 4. Absolute values of assessed variables for the 34 municipalities of Santiago for years 1992, 1998, 2003, and 2009. Dots in top rows show the variable’s dispersion for each assessed year, (a) income, (b) education, (c) health, (d) democracy. Mean value is the arithmetic mean among the 34 municipalities not weighted by municipal population. Dots in bottom rows show specific values for each of the assessed municipalities for the four assessed years, (e) income, (f) education, (g) health, (h) democracy. Green and red bars represent absolute increase or decrease of the assessed variable in each municipality for the 1992–2009 period.
Sustainability 08 00820 g004
Figure 5. Indicator maps of temporal trends (1992–2009) of inequalities and spatial segregation for standardized values of development assets between Santiago’s 34 municipalities. Standardized Gap measures relative difference between the best-off and worst-off municipality; values range from 0 (no difference) to 1 (maximum difference). Inequality (Gini) index range between 0 and 1; larger values represent higher levels of inequality. Segregation (Moran’s I autocorrelation) index range between −1 and 1, larger values represent higher levels of spatial segregation.
Sustainability 08 00820 g005
Figure 6. Inequality-resilience stability landscape of Santiago for years 1992 and 2009. Color bars represent development levels for each analyzed asset arranged from lower (left) to higher (right) ranked municipalities based in the year 1992. Stability landscapes depicted within each graph illustrates the likely conceptual model operating for each variable. (a) income, (b) education, (c) health, (d) democracy.
Sustainability 08 00820 g006
Table 1. Pearson correlation analysis for the four standardized indicators values.
IncomeEducationHealth
1992199820032009199219982003200919921998200032009
Education0.929 *0.908 *0.916 *0.945 *
Health0.887 *0.905 *0.954 *0.946 *0.919 *0.970 *0.971 *0.978 *
Democracy0.081−0.0750.0370.0730.231−0.0180.1250.1720.026−0.1080.0150.084
* p < 0.001.

