Article

Comparison of European Olive Production Systems

by
Carlo Russo
1,*,
Giulio Mario Cappelletti
1,
Giuseppe Martino Nicoletti
1,
Alfredo Ernesto Di Noia
1 and
George Michalopoulos
2
1
Department of Economics CeSETEA, University of Foggia, Via R. Caggese n. 1, 71121 Foggia, Italy
2
RodaxAgro Ltd., Kottou 48, Metamorphosis, 14452 Athens, Greece
*
Author to whom correspondence should be addressed.
Sustainability 2016, 8(8), 825; https://0-doi-org.brum.beds.ac.uk/10.3390/su8080825
Submission received: 30 May 2016 / Revised: 16 August 2016 / Accepted: 17 August 2016 / Published: 22 August 2016

Abstract

:
(1) Background: Spain, Italy, and Greece are the world’s top olive oil producers. In recent decades, these countries have gradually diversified their farming system in the olive groves. The element of innovation with respect to the state of the art is that this paper aims to compare the environmental performance of different farming systems in a European context by performing a simplified Life Cycle Assessment; (2) Methods: Environmental performance was calculated according to the methodology of Life Cycle Assessment and the “Guidance for the implementation of the Product Environmental Footprint (PEF)”. Average data were considered in order to describe a system with a great degree of complexity and high spatial heterogeneity; (3) Results: The study highlights the difficulty of identifying the farming method that presents the best environmental performance in each of the impact categories considered. In Greece, the lowest use of diesel, electricity, and water brings about advantages for many impact categories, albeit with low yields. While the highest olive yield obtained in Italy has positive consequences in terms of global warming, the highest use of fertilisers, in many cases, entails higher environmental impacts. On the other hand, in Spain the highest use of organo-phosphorous pesticides entails the highest impacts of eco-toxicity; (4) Conclusion: the reduction of the use of fertilizers and pesticides, as well as water conservation, are important issues which require the optimization of timing and techniques in order to achieve environmental advantages.

1. Introduction

The olive tree (Olea europaea L.) is an evergreen and long-lived species, cultivated worldwide for centuries for its edible fruits. This plant is suitable for all countries included in a latitude of 30°–45° in both hemispheres. In recent years, the olive production area has increased world-wide, due to the introduction of innovations in the farming systems and cultivars [1,2,3,4]. Accordingly, new lands were dedicated to the cultivation of olives, and new producer countries appeared on the market [5,6]. Nowadays, according to the International Olive Oil Council (IOOC) data, over 10 million hectares are cultivated with olive groves globally, of which 95% are located in the Mediterranean basin [7]. According to Eurostat data [8], the European Union accounts for some 70% of the world’s olive production, from about 1.9 million olive growing farms.
Table 1 shows that a large number of small operators characterizes the sector (varying from 0.5 hectare to over 20 hectares per farm). Among the European countries, Spain accounts for 50% of the total olive area, followed by Italy (24%) and Greece (17%).
The cultivation of olives presents a certain degree of complexity. This is mainly due to the different agricultural systems, farming techniques, and genetic resources. The main cultivation methods, which involve irrigation and mechanization, are:
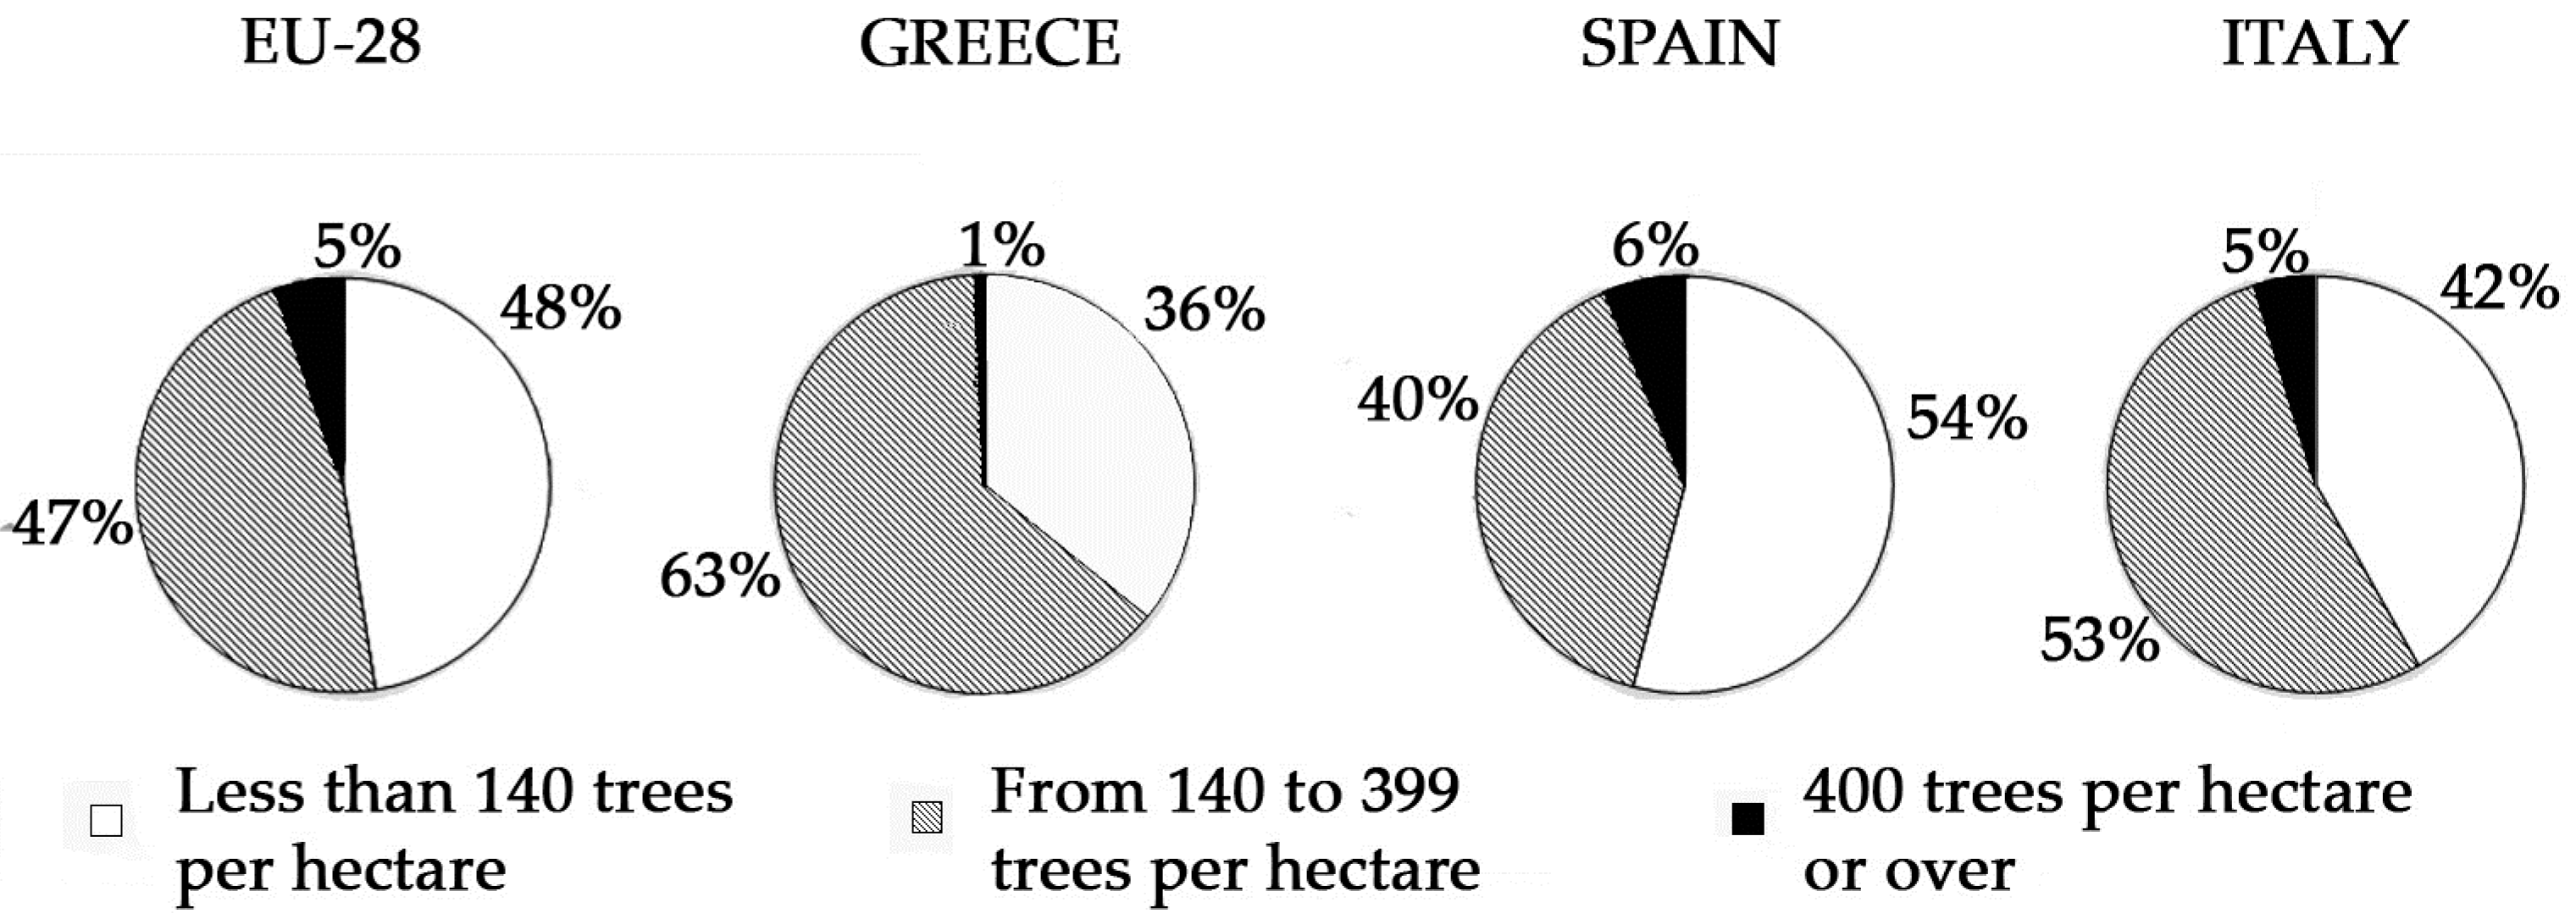
  • Traditional or Extensive. It is characterized by low inputs of labour and resources. Additionally, there are many structurally-limiting factors: plantations on land with steep slopes, old and large-sized olive trees scattered or grown at low-density plantation (less than 140 trees per hectare), unfertile soils, fragmentation of the properties, no irrigation. The plantations show low productivity, an accentuated alternate bearing behaviour (yield once every two years) and, consequently, poor profitability;
  • Semi-intensive. It is subjected to more intensive farming practices (use of chemical fertilisers and pesticides for pest control; weed control by tillage or herbicides; irrigation; mechanised or semi-mechanised harvest), high number of plants per hectare (plantation density from 140 to 399 trees per hectare);
  • Super-intensive. It is characterised by intensive and super-intensive agronomical interventions (very high density plantation, up to 2500 trees per hectare) located on flat areas; use of non-vigorous olive cultivars, high input of fertilisers and pesticides, and huge irrigation volumes, mechanisation of harvest and pruning practices; it can be really effective with respect to plant productivity (yield of 10 tons of olives per hectare, on average). However, there is no experience on the longevity of such olive groves, whilst the extensive and semi-intensive are known to be satisfactorily productive for centuries.
According to Eurostat data [9], Figure 1 shows the breakdown of the different farming systems.
Olive tree crops have an important climate change mitigation potential, since as permanent crops they provide carbon storage in soils [10,11,12,13]. In addition, the use of olive grove residues from orchard management and olive oil extraction residues (pomace, olive pit) in biomass boilers as fossil fuel replacement provide additional reductions in greenhouse gas (GHG) emissions [14,15]. The above issues and other environmental aspects have been investigated in many studies by using the Life Cycle Assessment methodology (LCA), both at local and global scales [16,17,18,19]. In these studies, the environmental performance of the olive oil sector is investigated by performing a traditional LCA (from “cradle to grave”), following an attributional approach. While, in other cases, only the agricultural phase was taken into account [5,20,21]. This is due to the fact that this phase is identified as the most impactful from the majority of the scientific literature, and especially when the results of LCA are used for an Environmental Declaration (such as the International Environmental Product Declaration System®, EPD or the European system of the Product Environmental Footprint, PEF), it must be analysed separately [22]. For these reasons, this paper aims to analyse the environmental performances of the olive cultivation systems by adopting an approach of “Simplified LCA” (S-LCA). The comparison among the three main European producer countries—Spain, Italy, and Greece—represents the element of innovation with respect to the state of the art. The effort was to calculate average data for simply describing a system with a great degree of complexity and high spatial heterogeneity.

2. Materials and Methods

The Life Cycle Assessment methodology was adopted according to the ISO 14040 and 14044 standards [23,24], and the guidance provided by the International Reference Life Cycle Data System (ILCD) [25].
As suggested by Mourad et al. (2006) [22] and Salomone et al. (2015) [17], according to the scope of carrying out a S-LCA, the functional unit (FU) was set as one hectare of olive groves, and system boundaries were defined as all the agricultural practices from cradle to farm gate (Figure 2). The impact categories considered and their calculation methods were those defined in the “Guideline for the implementation of the EU PEF” used for the PEF Pilot phase [26]; the long-term emissions were not included (Table 2).
As for yield data, it is worth nothing that it is affected by great variability and high spatial heterogeneity which are not always directly due to the agricultural practices—many factors contribute to determine the amount of olives per hectare. However, according to the Eurostat data for the years 2010–2012 (2010–2011 for Italy), the average yields were considered:
  • Spain 2.436 tons·ha−1;
  • Italy 2.720 tons·ha−1;
  • Greece 2.157 tons·ha−1.
These data were adopted for calculation of CO2 sequestrated from the fruits per hectare, by considering an average value of 0.25 kg of carbon per kg of olives [10,27]. According to the aims of the study, the positive effect in terms of carbon sequestration from the agricultural system was highlighted, though, successively, the CO2 sequestrated is released in the atmosphere in the other phases of the life cycle (that in this study were excluded from the system boundaries).
As for olive tree plantations, the impacts related to land use change were not considered, justified by the fact that for the majority of the olive groves, land use change took place practically in an ancient era.
As for the geographical context of the Life Cycle Inventory (LCI), the data for Spanish olive production system is based on the average data from representative Andalusian conventional and organic farms. This choice is due to the relevance that this region has on the Spanish olive production [28].
The data for the Italian olive production were collected through surveys directly from farmers located in the regions of Apulia and Abruzzo on all types of plantations (traditional, intensive, and super intensive).
As for olive production in Greece, the inventory was referred to data collected in three representative areas of Southern Greece in the context of the LIFE Project “OLIVECLIMA” [29] (preliminary data) and of the LIFE Project ”SAGE10” [30]. This is a source of significant difference between the Greek data and the ones from the other two countries. The Greek data are based on actual recordings by farmers for 120–600 olive groves, so they represent mostly the established situation as affected by various factors, such as economic pressure (cautious inputs), olive oil prices, proportion of organic vs. conventional farming, etc. Above all, though, low input values reflect the sum of actual inputs applied to some of the olive groves, divided by all the hectares of a definite area that was registered for the LIFE projects. So, activity data values show what really happens (even if wrong), and not what should happen as good local practice.
For all countries, the following agricultural practices were considered: soil management, pruning, irrigation, plant protection products and herbicides use, fertilising, and harvesting. For each practice, the following methodological assumptions were adopted:
Soil management: this practice was modelled according to the Ecoinvent dataset. For Greece, the area examined is dominated (about 70%) by zero tillage practice for more than 10 years. Main equipment used is mowers and weed smashers.
Pruning: It was modelled considering the use of chainsaw, so the same assumption of the two-stroke engine emissions done in the harvesting phase was considered. In this case, more consumption of lubricant oil occurred (for two-stroke fuel/oil mixture and lubricating oil for chain).
Irrigation: Mean electricity consumption was either based on the electricity bills (Greece) or calculated per cubic meter of water used for irrigation; also, the plastic material of the drip irrigation system was investigated. The scenario includes an electric pump that abstracts ground water from a well to the irrigation pipework. The ground water flows were regionalized according to the different countries.
Plant protection and herbicide use: the production of pesticides were obtained from the Ecoinvent dataset, while the dispersion in air, soil and water was calculated according to Mackay’s fugacity model [31].
Fertilising: This practice was modelled by considering the N–P–K content required per hectare; so, a generic N–P–K fertilizer was taken into account, according to the Ecoinvent dataset. For Greece, actual recordings of quantities and types of fertilizers for each olive grove were used. The nitrogen losses were estimated by using the Bentrup’s model [32]. The NOx and phosphorous emissions were calculated according to Ecoinvent report n.15 on Agricultural production systems [33].
Harvesting: The process was modelled by considering the principal harvesting techniques adopted in each country. In particular, pneumatic or electrical olive harvesting tools were considered. As for Italy, the Ecoinvent [33] processes of using of fertilising broadcaster was adopted in order to calculate the diesel consumption and the emissions of the use of air compressors activated by a double cardan joint connected to a tractor. For Spain and Greece, the two-stroke engine vibrator was considered. According to the literature, the emissions of the combustion of two-stroke fuel/oil mixture were modelled by applying a correction factor to the emissions of a petrol engine [34,35].
Table 3 shows the different values considered in the LCI for each country. Large differences observed (e.g., for water/electricity consumption) are explained by the different ratio of irrigated/rain-fed olive groves, as the functional unit encompasses both. The choice to consider average values is due to the need to describe systems affected by high variability, in order to compare them.

3. Results

Figure 3 shows the comparison of the impact assessment of Spanish, Italian, and Greek cultivation systems. The environmental performances of the olive cultivation in Greece seem to be the best for 14 impact categories. Concerning Global Warming, if the biogenic carbon is excluded, the worst system is the Italian (GWPf), and, despite the GWPb is the highest (higher carbon sequestration due to higher olive yield), the Italian system remains the one that presents the highest GWPt value. The electricity consumption for irrigation entails the highest value of OD for the Spanish system, while for Human Toxicity, the Italian system has the highest value, principally due to the use of diesel and N-fertilisers (HTc, HTnc). For the same reasons, the Italian system presents the highest Acidification Potential (A) due to the use of copper (for disease control). As for the particulate matter category (PM), in Spain, the emissions of diesel combustion used for pneumatic harvesting tools and the two-stroke engine used for pruning (chainsaw) brings about the highest impact compared to the other systems. Impact category E is most affected by the use of pesticides, so the Spanish system has the worst performance. The category Ir is instead affected by the production of insecticides, so, in this case, the Italian system is the worst. The use of diesel and N-fertilisers influences the categories POF and TE, and the Italian system has highest values, despite the fact that for POF the difference with the Spanish one is minimal. In Italy, the use of phosphorous and nitrogen fertilisers brings about the highest value, respectively, for FE and ME. For these categories, Spain presents the best performance. The values of category LU have small differences among the countries, while for category RDw, the Spanish system presents the highest value due to the high volume of water used for irrigation. Finally, the Italian system presents the highest value for category RD, which is principally affected by the use of fertilisers and pesticides.

4. Discussion

The life cycle impact assessment represents a snapshot of the average of the environmental performances of the agricultural systems investigated in a certain period and situation. Furthermore, agricultural data and data about olive yields are affected by a certain variability [36], whilst no standardized data collection method suitable for LCA has been agreed upon (e.g., sampling, stratification, level of traceability between data and performance, etc.). The main sources of data uncertainty are both exogenous and endogenous to LCA methodology. The first category comprises: pedoclimatic factors, availability of irrigation, biannual harvest (exclusively for traditional cultivation method), cultivar, exposure to pests and diseases, but also intensity of agricultural practices (ranging from organic to super-intensive) and, especially for the yield (harvested olives), expectations of olive growers in terms of market prices and agricultural subsidies (e.g., Community Agricultural Policy). The second category includes methodological assumptions (e.g., different calculation methods of the air and water emissions, inclusion or not of carbon sequestration from fruits, etc.).
For these reasons, a sensitivity analysis is needed in order to evaluate the variability of the results.

Sensitivity Analysis

In this study, we would like to point out the uncertainty arising from different calculation methodologies to determine the values of nitrogen compound emissions from fertiliser application.
According to the results of the impact assessment, nitrogen compound emissions represent an important environmental issue, but some differences in results could derive from the way in which they are accounted for. Table 4 shows data about the accounting of nitrogen compounds leaching in water and nitrogen compounds losses in air carried out by the use of Bentrup’s model (N2 in air, NH4+ in air, N2O in air, NO3 in water) [28] and Nemececk’s formula (NOx in air) [24]. This scenario (Base Scenario) was compared with one in which Nemececk’s model was adopted (Scenario 2).
Figure 4 shows the variation of the values of the impact categories TE and ME in Scenario 2 compared to the Base Scenario for each country. As for TE, a significant increase is observed for all countries. On the contrary, the adoption of Nemececk’s model brings about an important reduction for ME. This is due to the fact that the NO3 leaching in water is accounted as negligible.
Figure 5 shows the comparison between the CO2 emissions of the two scenarios for the three countries. In all cases, the carbon sequestration from olive fruits is higher than the emissions arising from their cultivation activities. Nemececk’s model entails N-emissions twice higher than the Base Scenario (Table 4); this brings about a higher value of GWPf. So, the positive effect represented by the GWPb value is reduced, particularly for the Italian system.

5. Conclusions

This paper investigates the environmental aspects of the cultivation of olives, with a focus on the agricultural phase. The LCA methodology was used to compare an instance of farming methods adopted in the three European main olive producer countries: Spain, Italy, and Greece. Despite the difficulties in describing the scenarios with a great degree of complexity and variability in a wide geographical context, some important preliminary results have been highlighted. In Greece, the lowest use of diesel, electricity, and water brings about advantages for many impact categories. In Italy, the highest use of fertilizers and other inputs entails higher total global warming, even considering the positive effects of carbon sequestration (biogenic) from the fruits. On the other hand, the highest use of organo-phosphorous pesticides in Spain entails the highest impacts of eco-toxicity. In general, the reduction of the use of fertilisers and pesticides, as well as the reduction of water use, are important issues, which require the optimization of timing and techniques in order to achieve environmental advantages. The pre-requisite for fair performance comparisons, however, is the harmonization of data collection procedures for LCA, especially for the use of inputs. Use rates such as ”kg per hectare” of plant protection products or fertilizers are most important not only for LCA, but also as an indicator of the success of Integrated Crop Management (ICM), a trend wherein only the amounts needed for a given set of olive groves (group of farmers, cooperatives, regions, etc.) are used. Proper and fair comparisons will need to be based on dynamic, robust, and traceable data collection systems for at least 3 years, so as to lead to accurate description of the specific set of olive groves. Even more time may be required if they wish to encompass the important issue of permanent carbon storage in soil, which is still under thorough investigation. In this regard, higher olive yield entails an increase in carbon sequestration. At first glance, higher yields can be obtained with the use of more inputs (fertilisers, pesticides, water, fuels, etc.), but they are affected by great variability and high spatial heterogeneity, which are not always directly due to the agricultural practices—many factors contribute the determination of the amount of olives per hectare. Efforts should be made to improve the efficiency of resource use by better crop husbandry through ICM, such as improved pruning to make the most out of the sunlight for carbon sequestration, prevention of plant health and yield losses via Integrated Pest Management (IPM), minimum or zero cultivation of soil to reduce losses of soil carbon, better water management, etc. In this sense, LCA helps substitute inputs by good agronomic services, in order to optimize the balance between resource consumption and carbon sequestration.

Acknowledgments

The study was carried out according the involvement of the authors in the Olive Oil PEF pilot. All information could be find at the following link: https://webgate.ec.europa.eu/fpfis/wikis/display/EUENVFP/PEFCR+Pilot%3A+Olive+oil.

Author Contributions

Giuseppe Martino Nicoletti designed the research; Carlo Russo and George Michalopoulos performed research and analysed data; Giulio Mario Cappelletti and Alfredo Di Noia wrote the paper. All authors read and approved the final manuscript.

Conflicts of Interest

The authors declare no conflict of interest.

References

  1. Lopriore, G.; Abatantuono, I.A. Superintensivo, Efficienza e Risparmio Idrico; Olive e Olio: Bologna, Italy, 2016. [Google Scholar]
  2. Lopriore, G.; Gatta, G.; Scelsa, D.; Lo Storto, M.C.; Abatantuono, I.A.; Pati, S. Water Scarcity, Salinization & Plant Water Relations for Optimal Production & Quality Symposium. In Water Stress, Yield And Oil Characteristics of PRD and Deficit Irrigated Very-High Density Olive Orchard (Olea Europaea L. cv. ‘Arbequina’), Proceedings of the 29th International Horticultural Congress (IHC2014), Brisbane, Australia, 17–22 August 2014.
  3. Caruso, T.; Campisi, G.; Marra, F.P.; Camposeo, S.; Vivaldi, G.A.; Proietti, P.; Nasini, L. Growth and yields of the cultivar Arbequina in high density planting systems in three different olive growing areas in Italy. Acta Hortic. 2014, 1057, 341–348. [Google Scholar] [CrossRef]
  4. León, L.; de la Rosa, R.; Rallo, L.; Guerrero, N.; Barranco, D. Influence of spacing on the initial production of hedgerow ‘Arbequina’ olive orchards. Span. J. Agric. Res. 2007, 4, 554–558. [Google Scholar] [CrossRef]
  5. De Gennaro, B.; Notarnicola, B.; Roselli, L.; Tassielli, G. Innovative olive-growing models: An environmental and economic assessment. J. Clean. Prod. 2012, 28, 70–80. [Google Scholar] [CrossRef]
  6. Gucci, R.; Caruso, G. Environmental stresses and sustainable olive growing. Acta Hortic. 2011, 924, 19–30. [Google Scholar] [CrossRef]
  7. The International Olive Oil Council. Available online: http://www.internationaloliveoil.org/ (accessed on 18 April 2016).
  8. Eurostat. Agriculture, Forestry and Fishery Statistics, 2014 ed.; Eurostat: Luxembourg City, Luxembourg, 2015. [Google Scholar]
  9. Eurostat. Agricultural Production—Orchards. Available online: http://ec.europa.eu/eurostat/statistics-explained/index.php/Agricultural_production_-_orchards (accessed on 18 April 2016).
  10. Sofo, A.; Nuzzo, V.; Palese, A.M.; Xiloyannis, C.; Celano, G.; Zukowskyj, P.; Dichio, B. Net CO2 Storage in Mediterranean Olive and Peach Orchards. Sci. Hortic. 2005, 107, 17–24. [Google Scholar] [CrossRef]
  11. Montanaro, G.; Celano, G.; Dichio, B.; Xiloyannis, C. Effects of soil-protecting agricultural practices on soil organic carbon and productivity in fruit tree orchards. Land Degrad. Dev. 2010, 21, 132–138. [Google Scholar] [CrossRef]
  12. Nieto, O.M.; Castro, J.; Fernández, E. Long-Term Effects of Residue Management on Soil Fertility in Mediterranean Olive Grove: Simulating Carbon Sequestration with RothC Model. In Principles, Application and Assessment in Soil Science; Intech: Rijeka, Croatia, 2011; pp. 130–150. [Google Scholar]
  13. Palese, A.M.; Vignozzi, N.; Celano, G.; Agnelli, A.E.; Pagliai, M.; Xiloyannis, C. Influence of soil management on soil physical characteristics and water storage in a mature rainfed olive orchard. Soil Tillage Res. 2014, 144, 96–109. [Google Scholar] [CrossRef]
  14. Cappelletti, G.M.; Ioppolo, G.; Nicoletti, G.M.; Russo, C. Energy Requirement of Extra Virgin Olive Oil Production. Sustainability 2014, 6, 4966–4974. [Google Scholar] [CrossRef]
  15. Russo, C.; Cappelletti, G.M.; Nicoletti, G.M. LCA of Energy Recovery of the Solid Waste of the Olive Oil Industries. In Proceedings of the 6th International Conference on LCA in the Agri-Food Sector—Towards a Sustainable Management of the Food Chain, Zurich, Switzerland, 12–14 November 2008.
  16. Salomone, R.; Cappelletti, G.M.; Ioppolo, G.; Mistretta, M.; Nicoletti, G.M.; Notarnicola, B.; Olivieri, G.; Pattara, C.; Russo, C.; Scimia, E. Italian Experiences in Life Cycle Assessment of Olive Oil: A Survey and Critical Review. In Proceedings of LCA Food 2010, 7th International Conference on Life Cycle Assessment in the Agri-Food Sector, Bari, Italy, 22–24 September 2010; pp. 265–270.
  17. Salomone, R.; Cappelletti, G.M.; Malandrino, O.; Mistretta, M.; Neri, E.; Nicoletti, G.M.; Notarnicola, B.; Pattara, C.; Russo, C.; Saija, G. Life Cycle Assessment in the Olive Oil Sector. In Life Cycle Assessment in the Agri-Food Sector. Case Studies, Methodological Issues and Best Practices; Notarnicola, B., Salomone, R., Petti, L., Renzulli, P.A., Roma, R., Cerutti, A.K., Eds.; Springer: London, UK, 2015; pp. 57–122. [Google Scholar]
  18. Salomone, R.; Ioppolo, G. Environmental Impacts of Olive Oil Production: A Life Cycle Assessment Case Study in the Province of Messina (Sicily). J. Clean. Prod. 2012, 28, 88–100. [Google Scholar] [CrossRef]
  19. Pattara, C.; Cichelli, A.; Salomone, R. Carbon Footprint of Extra Virgin Olive Oil: A Comparative and Driver Analysis of Different Production Processes in Centre Italy. J. Clean. Prod. 2016, 127, 533–547. [Google Scholar] [CrossRef]
  20. Olivieri, G.; Falconi, F.; Pergreffi, R.; Neri, P.; Romani, A. Life Cycle Assessment for Environmental Integrated System in the Olive Oil Tuscan Company. In Proceedings of the 12th SETAC Europe LCA Case Studies Symposium, 2004/2005 European Meeting of the International Society for Industrial Ecology, Bologna, Italy, 10–11 January 2005; pp. 127–130.
  21. Russo, G.; Vivaldi, G.A.; de Gennaro, B.; Camposeo, S. Environmental sustainability of different soil management techniques in a high-density olive orchard. J. Clean. Prod. 2015, 107, 498–508. [Google Scholar] [CrossRef]
  22. Mourad, A.L.; Coltro, L.; Oliveira, P.A.P.L.V.; Kletecke, R.M.; Baddini, J.P.O.A. A simple methodology for elaborating the life cycle inventory of agricultural products. Int. J. Life Cycle Assess. 2006, 12, 408–413. [Google Scholar] [CrossRef]
  23. ISO 14040. ISO 14040:2006: Environmental Management—Life Cycle Assessment—Principles and Framework; International Standard Organization: Geneva, Switzerland, 2006. [Google Scholar]
  24. ISO 14044. ISO 14044:2006: Environmental Management—Life Cycle Assessment—Requirements and Guidelines; International Standard Organization: Geneva, Switzerland, 2006. [Google Scholar]
  25. European Commission, Joint Research Centre, Institute for Environment and Sustainability. International Reference Life Cycle Data System (ILCD) Handbook—General Guide for Life Cycle Assessment—Detailed Guidance; Publications Office of the European Union: Luxembourg City, Luxembourg, 2010. [Google Scholar]
  26. European Commission. Guidance for the Implementation of the EU Product Environmental Footprint (PEF) during the Environmental Footprint (EF) Pilot Phase, Guidance for the Implementation of the EU PEF during the EF Pilot Phase, version 5.2; European Commission: Luxembourg City, Luxembourg, 2016. [Google Scholar]
  27. Nardino, M.; Pernice, F.; Rossi, F.; Georgiadis, T.; Facini, O.; Motisi, A.; Drago, A. Annual and Monthly Carbon Balance in an Intensively Managed Mediterranean Olive Orchard. Photosynthetica 2013, 51, 63–74. [Google Scholar] [CrossRef]
  28. European Commission. Economic Analysis of the Olive Sector; European Commission: Luxembourg City, Luxembourg, 2012. [Google Scholar]
  29. LIFE Project OLIVE CLIMA. Introduction of New OLIVE Crop Management Practices Focused on CLIMAte Change Mitigation and Adaptation. LIFE11 ENV/GR/942—OLIVE CLIMA. 2013. Available online: http://ec.europa.eu/environment/life/project/Projects/index.cfm?fuseaction=search.dspPage&n_proj_id=4194&docType=pdf (accessed on 20 April 2016).
  30. LIFE Project SAGE10. Establishment of Impact Assessment Procedure as a Tool for the Sustainability of Agroecosystem: The Case of Mediterranean Olives. LIFE09/ENV/GR/000302—SAGE10. 2011. Available online: http://ec.europa.eu/environment/life/project/Projects/index.cfm?fuseaction=search.dspPage&n_proj_id=3681&docType=pdf (accessed on 20 April 2016).
  31. Mackay, D. Multimedia Environmental Models: The Fugacity Approach; Lewis Publishers, Inc.: Chelsea, MI, USA, 1991. [Google Scholar]
  32. Brentrup, F.; Küsters, J.; Lammel, J.; Kuhlmann, H. Methods to Estimate on-Field Nitrogen Emissions from Crop Production as an Input to LCA studies in the Agricultural Sector. Int. J. LCA 2000, 5, 349–357. [Google Scholar] [CrossRef]
  33. Nemecek, T.; Kägi, T. Life Cycle Inventories of Agricultural Production Systems; Data v2.0; Ecoinvent Report No. 15; ART: Zurich & Dubendorf, Switzerland, 2007. [Google Scholar]
  34. Aminu, J. Pollution by 2-Stroke Engines. In The Nigerian Conference on Clean Air, Clean Fuels and Vehicles; National Automotive Council: Abuja, Nigeria, 2006. [Google Scholar]
  35. Environmental Protection Agency U.S. Stationary Internal Combustion Sources. In AP 42 Compilation of Air Pollutant Emission Factors, 5th ed.; Environmental Protection Agency U.S.: San Francisco, CA, USA, 2009. [Google Scholar]
  36. Notarnicola, B.; Tassielli, G.; Renzulli, P. Data Variability in the LCA of Olives Production. In Proceedings of the VII Conference of Italian LCA Network, Milan, Italy, 27–28 June 2013; Available online: http://www.enea.it/it/pubblicazioni/pdf-volumi/V2013Atti_LCA_2013.pdf (accessed on 18 April 2016). (In Italian)
Figure 1. Differentiation of cultivation methods according to plant density.
Sustainability 08 00825 g001
Figure 2. System boundaries and interaction between inputs and the system. PE-LD: Polyethylene, linear low density; PE-HD: Polyethylene, high density. BOD: Biological Oxygen Demand; COD: Chemical Oxygen Demand; NMVOC: Non-Methane Volatile Organic Compounds; PPP: Plant Protection Products.
Sustainability 08 00825 g002
Figure 3. Comparison of the environmental performances of Spanish, Italian, and Greek cultivation systems.
Sustainability 08 00825 g003
Figure 4. Ratio between the values of Scenario 2 and Base Scenario for each country for the impact categories Terrestrial Eutrophication (TE) and Marine Eutrophication (ME).
Sustainability 08 00825 g004
Figure 5. Scenario analysis: CO2-eq emissions.
Sustainability 08 00825 g005
Table 1. Structure of farms cultivating olives.
Farms:GREECESPAINITALY
Average size (ha)1.55.51.3
Annual turnover (M€)75020941700
Number of holdings531,000413,000776,000
Main producing areasPeloponnese, Central Greece, Crete, Lesbos, Halkidiki, Kavala, IslandsAndalusia (60%), Castile La Mancha (16%), Extremadura (10%), Catalonia (5%), Autonomous Community of Valencia (4%)Apulia (35%), Calabria (20%), Sicily (11%), Campania (10%)
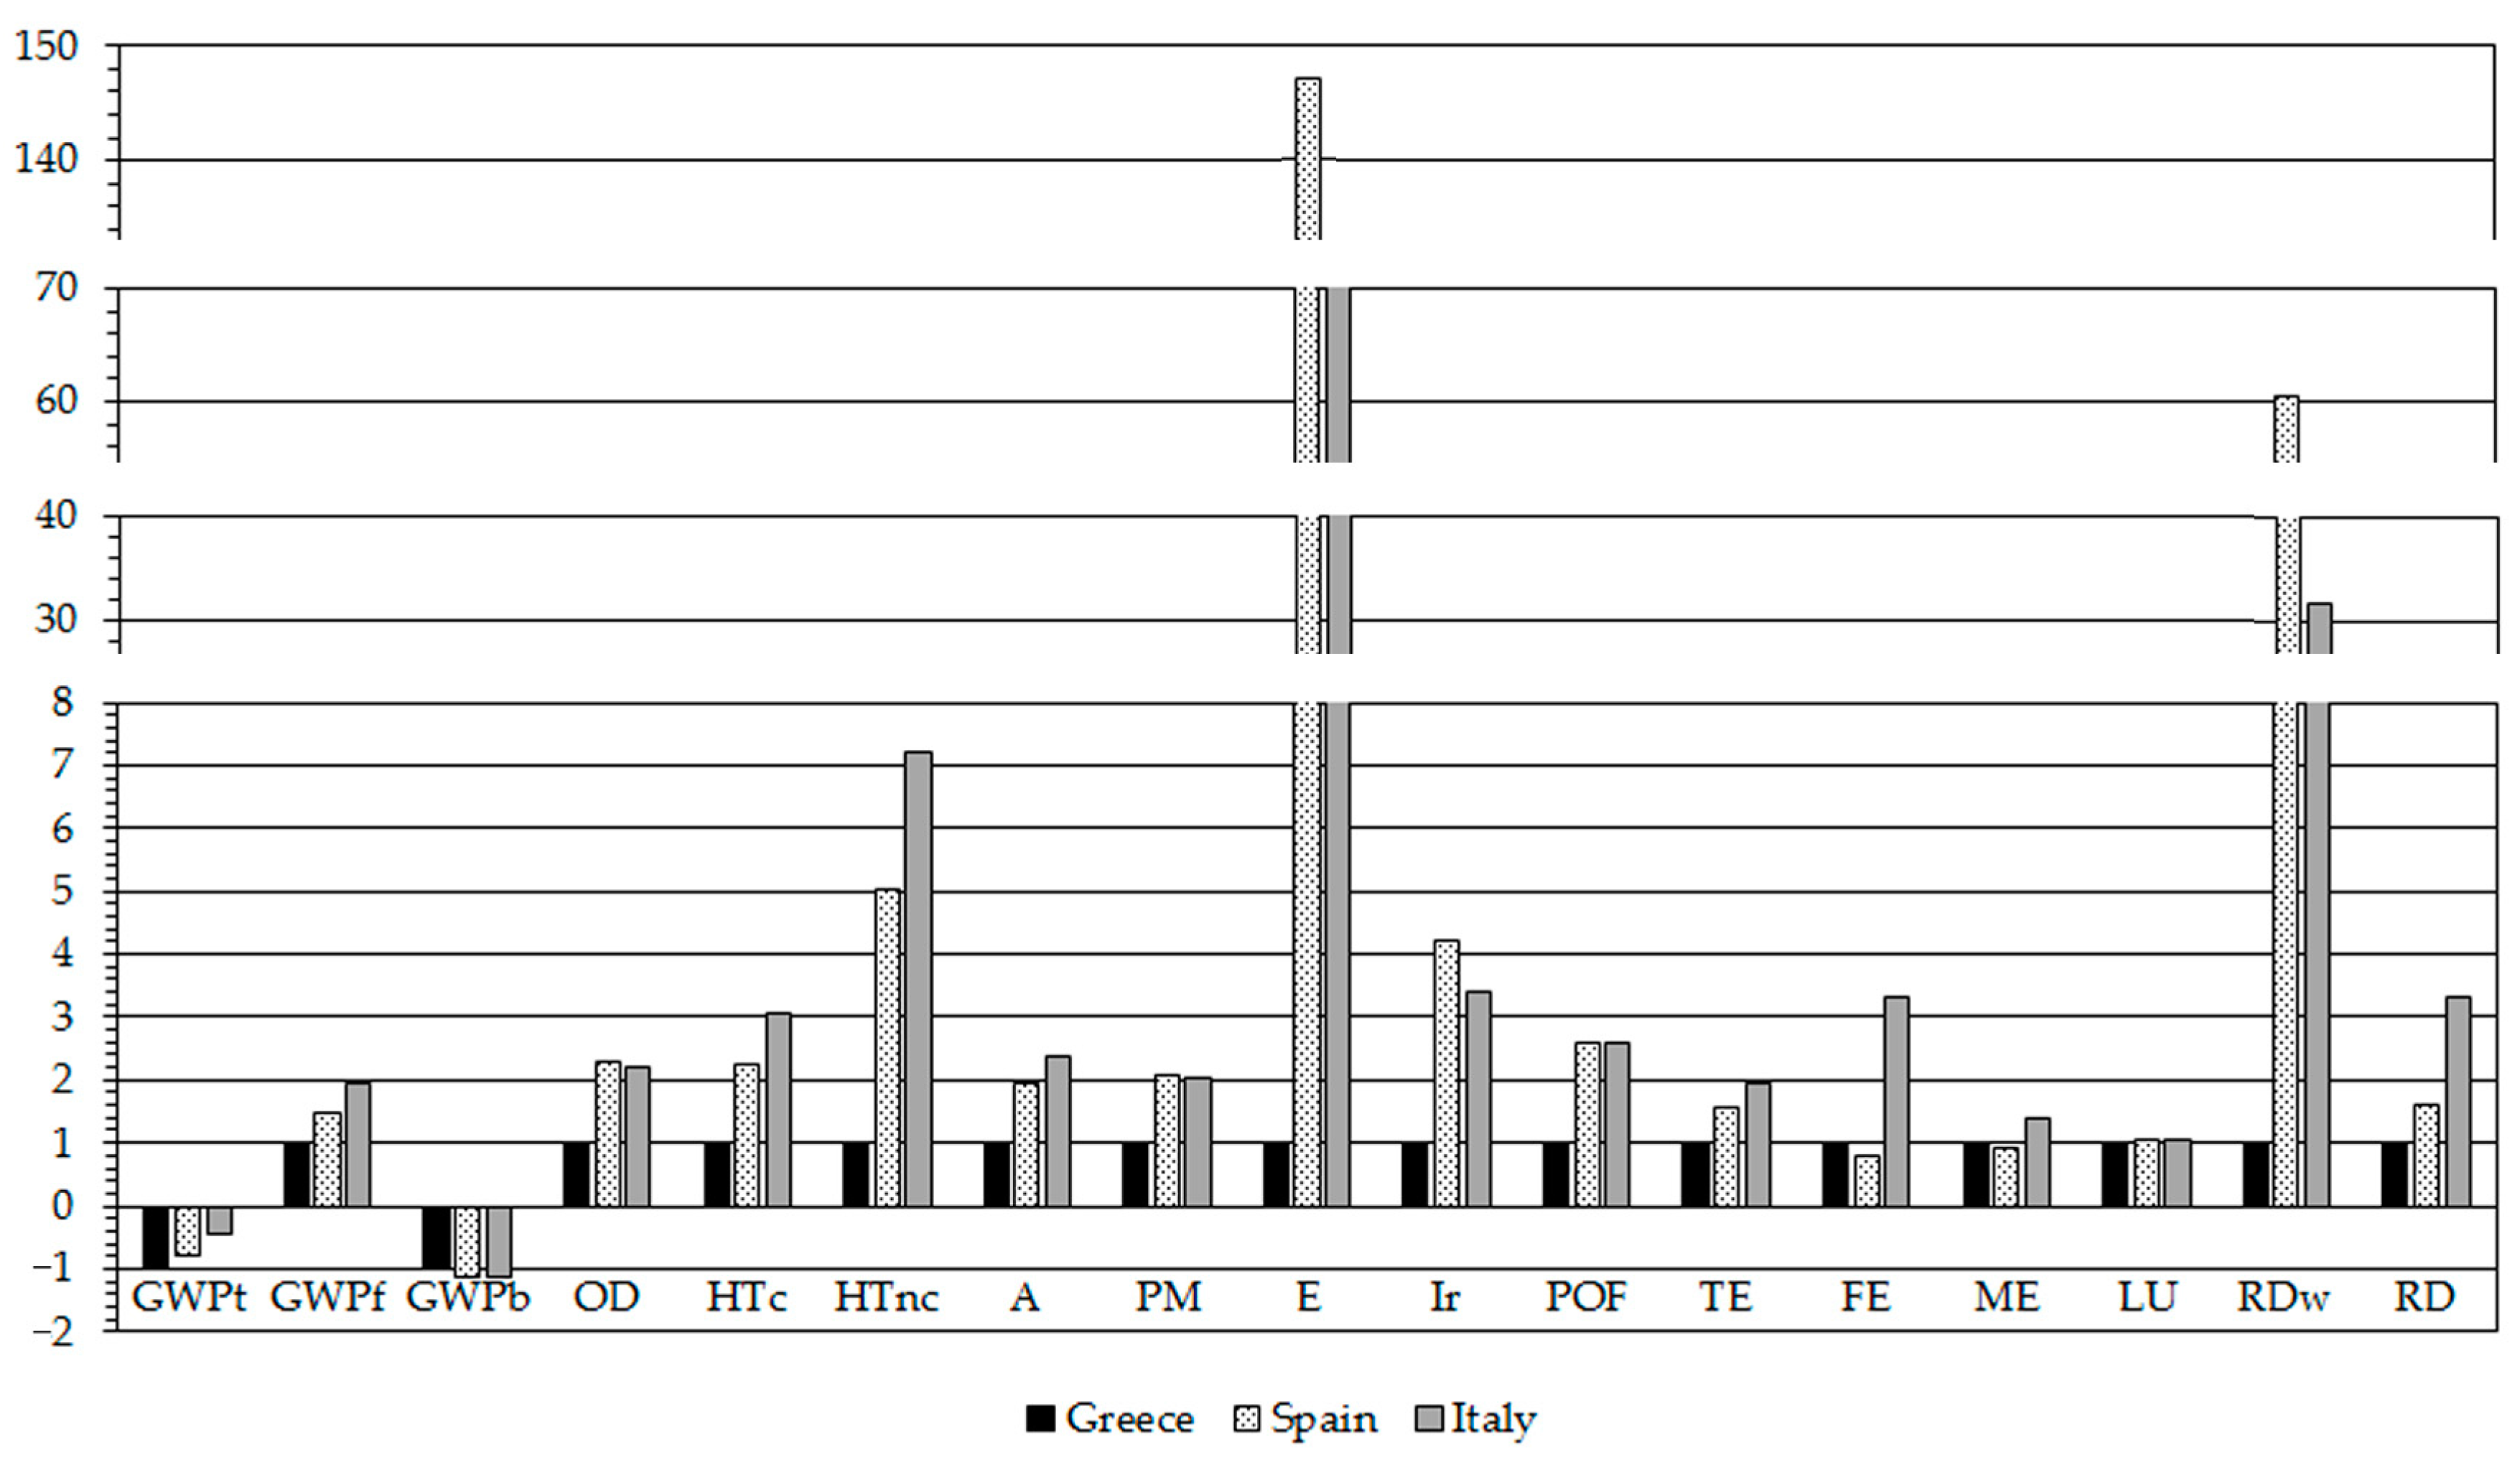
Source: EUROSTAT, 2014 [8].
Table 2. Impact categories.
Impact CategoryUnitAcronym
Climate change midpoint, excl. biogenic carbon (v1.06)kg CO2-eqGWPf
Climate change midpoint, incl. biogenic carbon (v1.06)kg CO2-eqGWPt = GWPf + GWPb
PEF-IPCC global warming (biogenic)kg CO2-eqGWPb
Ozone depletion, WMO model, ReCiPekg CFC-11-eqOD
Human toxicity cancer effects, USEtox (without long-term)CTUhHTc
Human toxicity non-canc. effects, USEtox (without long-term)CTUhHTnc
Acidification, accumulated exceedanceMole of H+-eqA
Particulate matter/Respiratory inorganics, RiskPollkg PM2.5-eqPM
Ecotoxicity for aquatic fresh water, USEtox (without long-term)CTUeE
Ionising radiation, human health effect model, ReCiPe (corrected)kg 235U-eqIr
Photochemical ozone formation, LOTOS-EUROS model, ReCiPekg NMVOCPOF
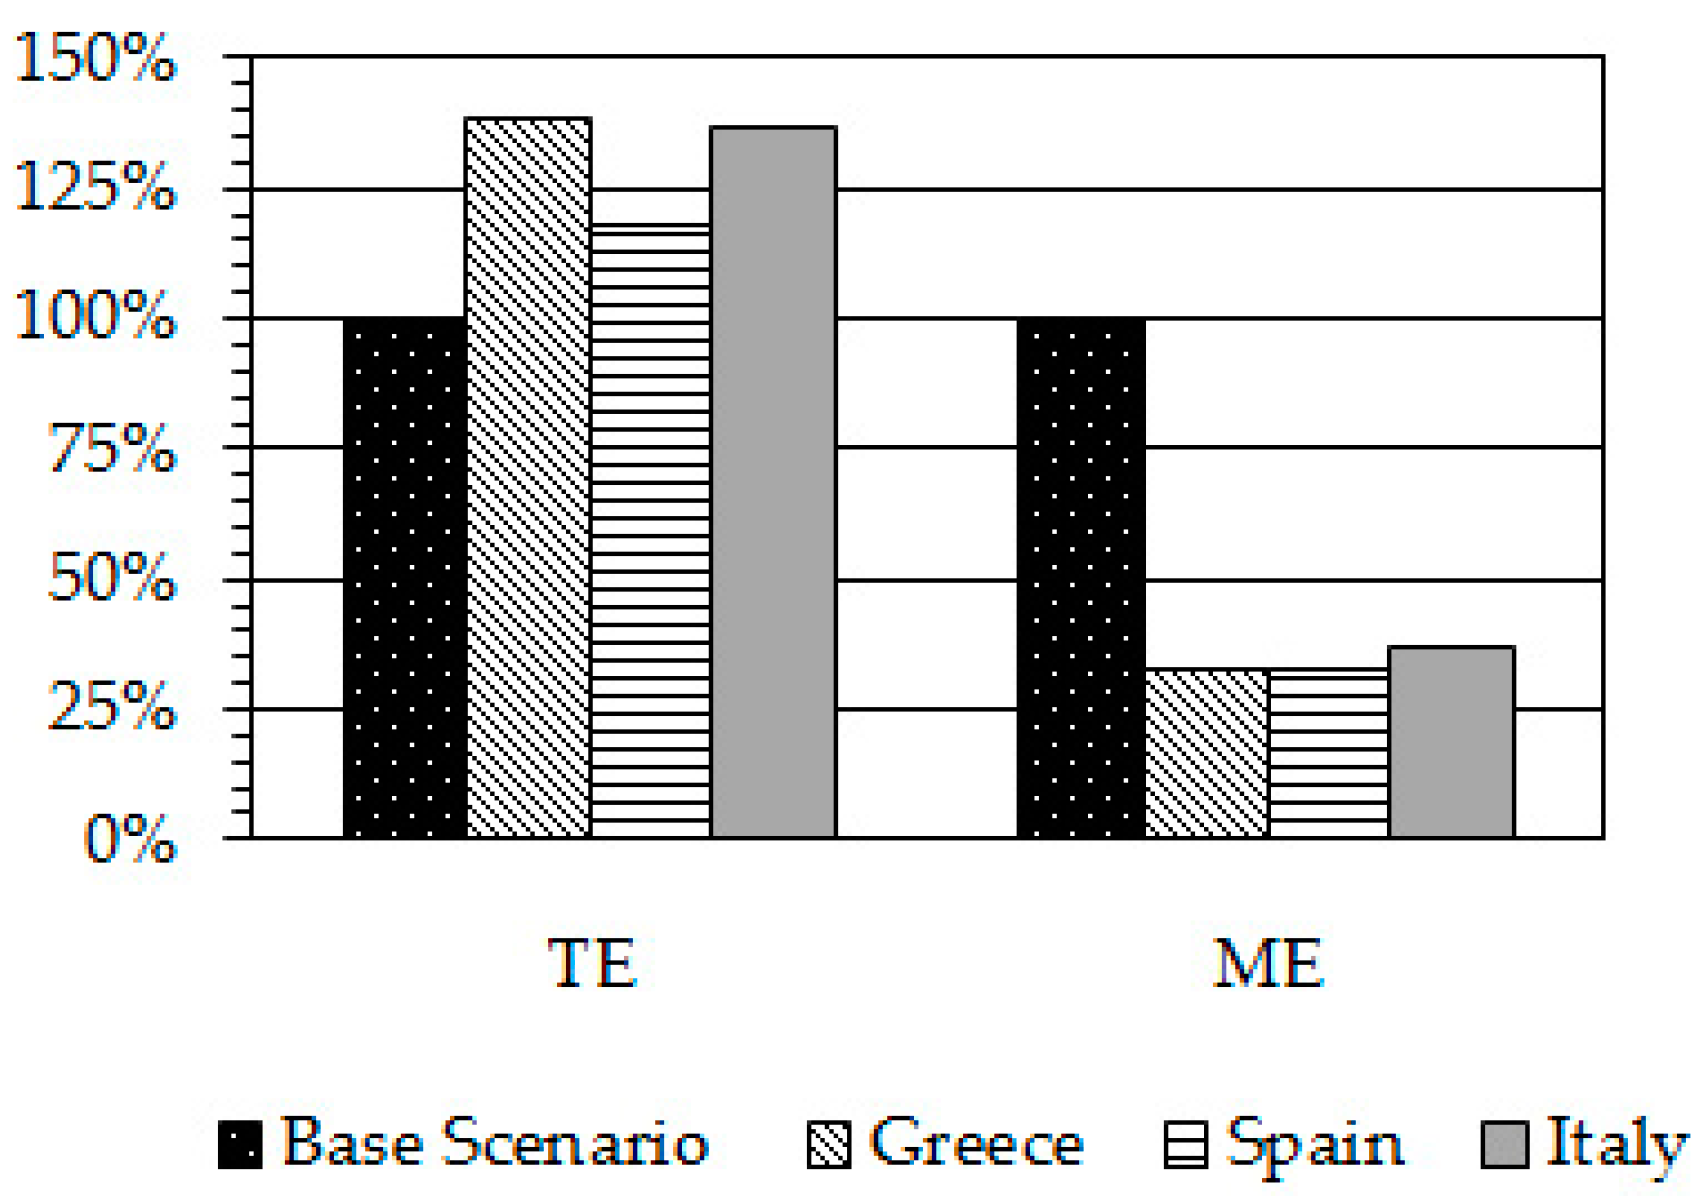
Terrestrial eutrophication, accumulated exceedanceMole of N-eqTE
Freshwater eutrophication, EUTREND model, ReCiPe (without long-term)kg P-eqFE
Marine eutrophication, EUTREND model, ReCiPekg N-eqME
Land use, Soil Organic Matter (SOM, Ecoinvent & Hemeroby—EMS—19 May 2015)kg C deficit-eqLU
Resource depletion water, midpoint, Swiss Ecoscarcity (v1.06—EMS—19 May 2015)m3-eq.RDw
Resource depletion, mineral, fossils and renewables, midpoint (v1.06)kg Sb-eqRD
Source: European Commission, 2015 [26]. PEF: Product Environmental Footprint; IPCC: Integrated Pollution Prevention and Control; WMO: World Meteorological Organization; CTUh: Comparative Toxic Unit for human.
Table 3. Input for each country considered, by distinguishing for sub-phase.
Harvesting
INPUTUnitSpainItalyGreece
Two-stroke fuel/oil mixturekg13.43 4.83
Polyethylene, linear low densitykg1.00
Yarn, jutekg1.001.00
Lubricating oilkg 0.400.08
Dieselkg 0.560.03
Irrigating
INPUTUnitSpainItalyGreece
ElectricityMJ10501050126.65
Polyethylene, linear low densitykg30.8530.85
Polyethylene, high densitykg8.768.76
Water (ground water)kg11021102164,000
Plant Protection Products and Herbicides Application
INPUTUnitSpainItalyGreece
Water (ground water)kg4181903362
Organophosphorus-compoundkg19.421.610.12
Glyphosatekg0.671.230.04
Pyrethroid-compoundkg0.01
Copper oxidekg 9.11
Insecticideskg 1.58
White oil (paraffin)kg 0.83
Cyclohexanonekg 0.17
Polyethylene, linear low densitykg 0.04
Dieselkg1.768.110.86
Soil Management
INPUTUnitSpainItalyGreece
Lubricating oilkg 1.491.49
Dieselkg45.2611.714.62
Pruning
INPUTUnitSpainItalyGreece
Lubricating oilkg1.471.471.85
Two-stroke fuel/oil mixturekg1.341.343.90
Dieselkg0.01 0.05
Fertilising
INPUTUnitSpainItalyGreece
Nitrogen fertiliser, as Nkg30.0075.7140.54
Potassium fertiliser, as K2Okg12.0069.8312.00
Phosphate fertiliser, as P2O5kg 34.6612.07
Borax, anhydrouskg2.74 0.46
Magnesium sulfatekg 5.42
Iron sulfatekg 0.39
Polyethylene, linear low densitykg 0.30
Zinc oxidekg 0.04
Dieselkg5.804.645.55
Table 4. Nitrogen emission scenarios (kg·ha−1).
N-EmissionBase ScenarioScenario 2
GreeceSpainItalyGreeceSpainItaly
NH4+ in air0.810.601.511.621.203.03
N2O in air0.510.380.951.010.751.89
NO3 in water150133207NegligibleNegligibleNegligible
NOx in air0.110.080.200.210.160.40

