Article

Impact of Carbon Quota Allocation Mechanism on Emissions Trading: An Agent-Based Simulation

1
School of Information and Safety Engineering, Zhongnan University of Economics and Law, Wuhan 430073, China
2
Economics and Management School, Wuhan University, Wuhan 430072, China
*
Author to whom correspondence should be addressed.
Sustainability 2016, 8(8), 826; https://0-doi-org.brum.beds.ac.uk/10.3390/su8080826
Submission received: 27 May 2016 / Revised: 30 July 2016 / Accepted: 11 August 2016 / Published: 22 August 2016
(This article belongs to the Section Economic and Business Aspects of Sustainability)

Abstract

:
This paper establishes an agent-based simulation system of the carbon emissions trading in accordance with the complex feature of the trading process. This system analyzes the impact of the carbon quota allocation mechanism on emissions trading for three different aspects including the amount of emissions reduction, the economic effect on the emitters, and the emissions reduction cost. Based on the data of the carbon emissions of different industries in China, several simulations were made. The results indicate that the emissions trading policy can effectively reduce carbon emissions in a perfectly competitive market. Moreover, by comparing separate quota allocation mechanisms, we obtain the result that the scheme with a small extent quota decrease in a comprehensive allocation mechanism can minimize the unit carbon emission cost. Implementing this scheme can also achieve minimal effects of carbon emissions limitation on the economy on the basis that the environment is not destroyed. However, excessive quota decrease cannot promote the emitters to reduce emission. Taking into account that several developing countries have the dual task of limiting carbon emissions and developing the economy, it is necessary to adopt a comprehensive allocation mechanism of the carbon quota and increase the initial proportion of free allocation.

1. Introduction

According to the fifth assessment report by the Intergovernmental Panel on Climate Change (IPCC), the excessive emissions of greenhouse gas cause the frequent occurrence of extreme weather on earth, which threatens the safety of human society and the natural system. Additionally, countries which exert an important impact on the world economy, such as China, usually have large amounts of carbon emissions. However, their energy structure is mainly composed of oil and coal with high carbon content. Consequently, it may threaten the economic development security of a country while decreasing the carbon emissions only by limiting the energy usage. Obviously, promoting carbon emissions reduction is the essential means of easing global warming and achieving sustainable development of human ecological and economic societies. In order to promote the carbon emissions reduction, the United Nations Climate Change Conference adopted the “Kyoto Protocol” [1] in 1997, which pointed out three effective ways to achieve the carbon emissions reduction, including “joint implementation”, “clean development mechanism”, and “emissions trading”. Emissions trading is a typical policy instrument based on the market environment. It limits the pollutant emissions of each emitter and allows the emitters to transact with each other to achieve the discharge standard by implementing the pollutant discharge permit system. The capital expenditure or income during the emissions trading process, in turn, shall encourage the emissions reduction behavior of the emitters. Currently, the EU, California, Montreal in Canada, and New South Wales in Australia have promoted the carbon emissions trading system. In China, there are also seven low carbon construction pilot regions of which the carbon emissions trading system has entered a substantive stage of operation.
The carbon quota trading system is implemented successfully in EU and U.S. [2] Technical innovation, such as using renewable energy sources, is essential in carbon emissions reduction [3]. In turn, carbon quota trading is helpful to the renewables deployment [4]. Ishikawa and Kiyono believe that domestic emission control may not reduce the world emissions, and that emission standards might be helpful to the industries which have intensive carbon emission [5]. There are many approaches for the government to control the carbon emission, such as implementing a carbon tax. The study by Greaker and Pade shows that governments should set a higher carbon tax if the technical innovation is driven by R&D, and lower if technical innovation is purely exogenous [6]. However, of all the approaches, the most important one is implementing the carbon quota [7]. Pang et al. believe that most developed countries should increase their carbon emissions quotas and that most less-developed countries need to reduce them [8]. Zhang et al. establish a Shapley value and believe that the regions with higher GDP or higher carbon outflow should be allocated with more carbon quotas [9]. Silva believes that the decentralized carbon quotas should be combined with centralized income transfers and fines [10]. Many pieces of research focus on the model of carbon quota allocation or transaction. Shaw et al. employed fuzzy multi-objective linear programming for supplier selection and carbon quota allocation [11]. Zhang and Xu investigated the multi-item production planning problem with a carbon cap and trade mechanism [12]. Strand studied the carbon quota pricing and the cap-and-trade scheme [13].
In Europe, one of the main carbon reduction policy instruments is carbon emissions trading. The companies which are active in specific sectors must be in the possession of carbon emissions rights to an amount which is equal to their carbon emissions [14]. The European Union Emissions Trading Scheme (EU ETS) is a prominent system for regulating carbon emissions [15]. Jong et al. verified that EU ETS is valued as a restriction on pollution [16]. They believe that the main impact on the share prices of firms arises from their carbon-intensive production. Oestreich et al. found firms that received free carbon emissions allowances on average significantly outperformed firms that did not during the first few years of the scheme, which suggests the “carbon premium” that can be explained by high cash flows due to the free allocation of carbon emissions allowances [17]. Based on examining the daily returns for 552 stocks, Bushnell et al. concluded that investors focus on product price impacts, rather than just compliance costs and the nominal value of pollution permits [18]. EU ETS has an efficient and effective market design in which risks are undermined by three interrelated problems: the approach to allocation, the absence of a credible commitment to the post-2012 continuation, and concerns about its impact on the international competitiveness of key sectors [19]. Moreover, the approach to scenario development in environmental decision-making is proposed in many studies [20]. Camporeale et al. proposed two innovative semantic services to manage EU ETS data and information on EU ETS scenarios [21].
According to the “World Bank Report on State and Trends of Carbon Pricing (2015)” [22], there are several methods to reduce the risk of carbon leakage and assist emissions-intensive trade-exposed industry sectors. For example, the EU has proposed the list of industries that will receive additional free allowances for the EU ETS; Korea has provided free of charge during the first phase; China’s national ETS distributes allocations for free. China is one of the largest emitters in the world, having seven pilot carbon markets, of which five had started operation by the end of 2013 [23]. Specifically, Shenzhen and Shanghai are both very successful pilots in carbon market innovation [24]. The Shenzhen ETS is the first urban-level “cap-and-trade” carbon emissions trading scheme to operate in China which attaches great importance to coordinate the dynamic relationships between economic growth, industrial transition, and emissions control [25]. Over the past years, China has focused on extending emissions trading beyond the seven pilot regions. The carbon emissions of different regions in China are characterized by club convergence, as the country’s gradient developing mode has enhanced the spatial agglomeration effects [26]. Moreover, the amount of Chinese offsets has been growing, which are mainly location-specific and restricted to the compliance market of the region. Carbon trading is a market mechanism and key instrument in the carbon emissions reduction [27]. Liao et al. employed benchmark, grandfathering, and the Shapley value to simulate the initial allocation of Shanghai carbon emissions trading [28]. Wang et al. developed a hybrid nonlinear grey-prediction and quota allocation model which have proved helpful to the carbon emissions reduction in China at both departmental and provincial levels [29]. Zhou et al. proposed an interprovincial emissions reduction quota trading scheme in China and proved the feasibility by simulating its economic performance [30].
The agent-based simulation system has proved to be valuable in the analysis of the carbon quota transaction mechanism. It can depict the details of the system operation, which can be utilized to analyze the impact of the carbon quota allocation mechanism on the carbon price and the corporate profits. It also can be employed to analyze many problems which cannot be solved by traditional analytic methods. For example, it is useful in examining the interaction of the carbon price and emissions reduction in the conditions of various carbon quota demands [31]. Moreover, researchers have obtained many original results by using the agent-based approach due to its significant advantage in the simulation. For example, Mizuta utilized the agent-based simulation system to certify that sellers manipulating carbon price would greatly affect the carbon quota transaction efficiency in the market [32]. Mizuta and Yamagata proposed an agent-based carbon quota transaction simulation system facing various world economies and successfully employed it to simulate the carbon quota transaction among 41 countries [33]. However, the agent-based simulation is seldom utilized to study the carbon quota transaction in China.
The efficiency of the carbon emissions trading system depends on the emission reduction effect of each emitter and the economic impact brought about by it. Consequently, this paper focuses on the carbon emissions trading system. It elaborates the carbon emissions transaction behavior and strategy of the emitters and utilizes an agent-based simulation model to analyze the operating mechanism of the system. Compared with the traditional analytical approach, the agent-based simulation can examine the parameters in greater detail. By simulating the carbon emissions transaction and reduction in various quota allocation cases, this paper studies effects of the carbon emission trading policy in various carbon quota allocation mechanisms for the following three aspects: the carbon emissions reduction, the economic impact on emitters, and the cost of emissions reduction.

2. Establishment of Agent-Based Carbon Emission Trading Simulation System

While establishing the agent-based carbon emissions trading simulation system, we can stipulate the interaction and action rule of the emitters by designing the carbon emissions trading mechanism. Therefore, it is possible for us to simulate the transaction strategy adopted by the emitters to fulfill the emissions restriction and, more importantly, the impact of each strategy. Additionally, we can obtain the current pollution treatment of the entire area by summarizing the operating results of various situations.

2.1. Selection of Agents

Industrial enterprises are the main part of the carbon emitters, while each enterprise belongs to a certain type of industry. Taking into account the availability of data, this paper regards an industry as an emission unit and collects the data of the carbon emissions of each industry. It focuses on the emissions trading behaviors among various agents (industries) in the perfectly competitive market and their impacts. Achieving the emission standard is the aim of emissions transaction and can be realized by the following two approaches: (1) technical transformation; and (2) purchasing additional carbon quota. By comparing the input of technical transformation and the cost of purchasing the carbon quota of each emitter, we are capable of choosing the optimal carbon emissions reduction strategy.

2.2. Design of Carbon Emission Trading Mechanism

The carbon emissions transaction in the market can be divided into two phases, which are carbon quota allocation and transaction. In the remaining part of this section, we will stipulate the rule of the quota allocation and transaction of the emitters.

2.2.1. Carbon Quota Allocation Rule

The carbon quota allocation involves the determination of the total carbon quota and its distribution in each industry.
(1) The total carbon quota
The total carbon quota is determined by the carbon emission reduction target of government and historical emissions. Provided that the carbon emission of the previous year is A; the quota coefficient of each year is kt; the carbon emissions reduction target of government is 1 − kt. We obtain the total carbon quota of the current year.
B = k t × A
The total carbon quota at the initial stage of the transaction market is determined by the carbon emissions reduction target proposed by the government, whereas at the latter stages the government would adjust the total carbon quota flexibly according to actual situations.
(2) The carbon quota distribution among the emitters
The carbon quota is allocated in terms of the historical allocation or economic contribution [34]. In practice, the historical-allocation-based approach is more beneficial to attract the emitters to participate in the carbon emissions transaction due to its equity. In addition, the allocation is realized by the following three methods: (1) the emitters can get carbon quota for free (“free mode” as follows); (2) the emitters should pay for the carbon quota (“paid mode” as follows); (3) part of the carbon quota is free while part of it should be purchased (“mixed mode” as follows).
Free distribution has a relatively small impact on the social economy and can be accepted and implemented with great ease. However, it has serious flaws in fairness and efficiency. Moreover, it may cause excessive carbon quota and an extremely high transaction price and therefore the carbon quota would not be allocated effectively. For instance, the European Union Emission Trading Scheme (EUETS) implemented free carbon quota allocation, which resulted in the failure of the carbon quota trading market [35].
Allocating carbon quota by auction is more equitable, efficient, and beneficial to exert the market’s mechanism. However, it is difficult to promote and may give rise to a monopolistic behavior of some strong industries and enterprises during the carbon quota auction process [36]. For example, the carbon quota auction approach of the Regional Greenhouse Gas Initiative (RGGI) in the U.S. can only attract the emitters who voluntarily participate in the carbon quota transaction. Therefore, it cannot control the carbon emissions in the whole region effectively.
The “mixed mode” integrates the advantages of the “free mode” and “paid mode” while avoiding their shortages. For instance, the Australian carbon emissions transaction market implements this “mixed mode”. By setting a fixed price of carbon quota, it achieves the paid allocation of the carbon quota. Fixing price helps avoid the excessive fluctuation of transaction price and, therefore, guides various resources utilized to reduce the carbon emissions.
There are seven districts in China which have been selected as the pilot cities of carbon quota allocation. Most of them have adopted the “free mode” since the initial period. The approach of paying for some carbon quota is also considered for future plans. For example, the percentage of paid carbon quota in Guangzhou province was only 3% in 2013–2014 and increased to 10% in 2015.
We assume that there are n emitters in the carbon trading market. The proportion of carbon quota of the nth industry is mn. Then, the carbon quota CQn of the nth industry can be demonstrated as
C Q n = m n × B
where m n = 1 . Consequently, we obtain the carbon quota cost of the nth emitter,
T C n = p 0 × m n × ( 1 a t ) × B
where at is the proportion of free carbon quota in the tth year, and p0 is the carbon quota price which is purchased by the emitter. If “at = 1” then 100% of the carbon quota is free allocated, so the carbon quota cost is zero in this case. When “at = 0” it suggests that 100% of the carbon quota should be paid. Otherwise, the carbon quota should be acquired by both free allocation and the public auction. In the initial period “p0” is fixed and then varies with the transaction price among the emitters. Based on this, we plan to compare the influence effect on carbon quota trading in the “free mode”, “paid mode”, and “mixed mode”.

2.2.2. Transaction Rule

In the stage of carbon quota transaction, each emitter should decide whether to participate in the carbon quota transaction based on its own business condition. First, the emitter compares its carbon quota with the expected carbon emissions until the delivery date and decide whether it needs to purchase extra carbon quota. Afterward, the emitter makes a decision on whether to purchase carbon quota or reduce carbon emissions by exerting technical transformation based on the cost of the two approaches. Provided that the emitter chooses to purchase carbon quota, it should search for sellers in the carbon quota transaction market. Otherwise, if it decides to make a technical transformation, it does not purchase carbon quota in the market but possibly sells its extra carbon quota due to the reduction of emissions.
During the process of carbon quota transaction, each emitter compares the carbon quota it owns by itself (CQn) and its actual emissions (CEn). As a consequence, there are two conditions as follows.
(1) Carbon quota is redundant (CEn < CQn)
In this case, the industry can obtain benefits by selling carbon quota. Consequently, the total revenue of each industry in carbon quota transaction should be the income of selling carbon quota minus the cost of buying the carbon quota, which implies
T R n = p 1 × ( C Q n C E n ) p 0 × m n × ( 1 a t ) × B
where p1 demonstrates the price of carbon quota, and p 1 × ( C Q n C E n ) demonstrates the income of the emitters selling carbon quota.
(2) Carbon quota is insufficient (CEn > CQn)
We first assume that the emitters can decrease the carbon emissions by technical transformation. In this case, an emitter should make a decision by comparing the cost of technical transformation and that of purchasing carbon quota. There are significant differences of the technical transformation costs among different industries due to the industrial technical variation. Provided that the marginal abatement cost increases progressively, we suppose that the marginal abatement cost varies with the emissions reductions of CO2 linearly, which is
M C = k q
where q is the carbon emissions reductions, and k reflects the changing speed of marginal abatement cost, which is closely related to the type of the emitter (hereinafter referred to as the “emitter character”). Based on this, we can obtain the technical transformation cost of each emitter by
T C 0 = 0 T Q k q d q = 1 2 k × T Q 2
Formula (5) suggests that if the emitter intends to achieve the emissions reduction (TQ), it should pay for the technical transformation cost of TC0. By comparing the technical transformation cost (TC0) and the cost of purchasing an equivalent carbon quota ( p × T Q ), we obtain the following situations.
(1) T C 0 < p × T Q
In this case, the cost of technical transformation is lower than that of purchasing carbon quota, which stimulates the emitters to reduce carbon emissions by technical transformation. As a consequence, the total cost of the emitters in carbon emissions reduction is
T R n = p 1 × ( C Q n C E n + T Q n ) p 0 × m n × ( 1 a t ) × B
If C E n T Q n < C Q n , the emitter can sell the redundant carbon quota; otherwise, the emitter should purchase the insufficient carbon quota.
(2) T C 0 p × T Q
In this case, the cost of purchasing carbon quota is lower than that of technical transformation, which prompts the emitters to reduce carbon emissions by purchasing the carbon quota. Therefore, we obtain the total cost of the emitters in carbon emissions reduction,
T R n = p 1 × ( C Q n C E n ) p 0 × m n × ( 1 a t ) × B

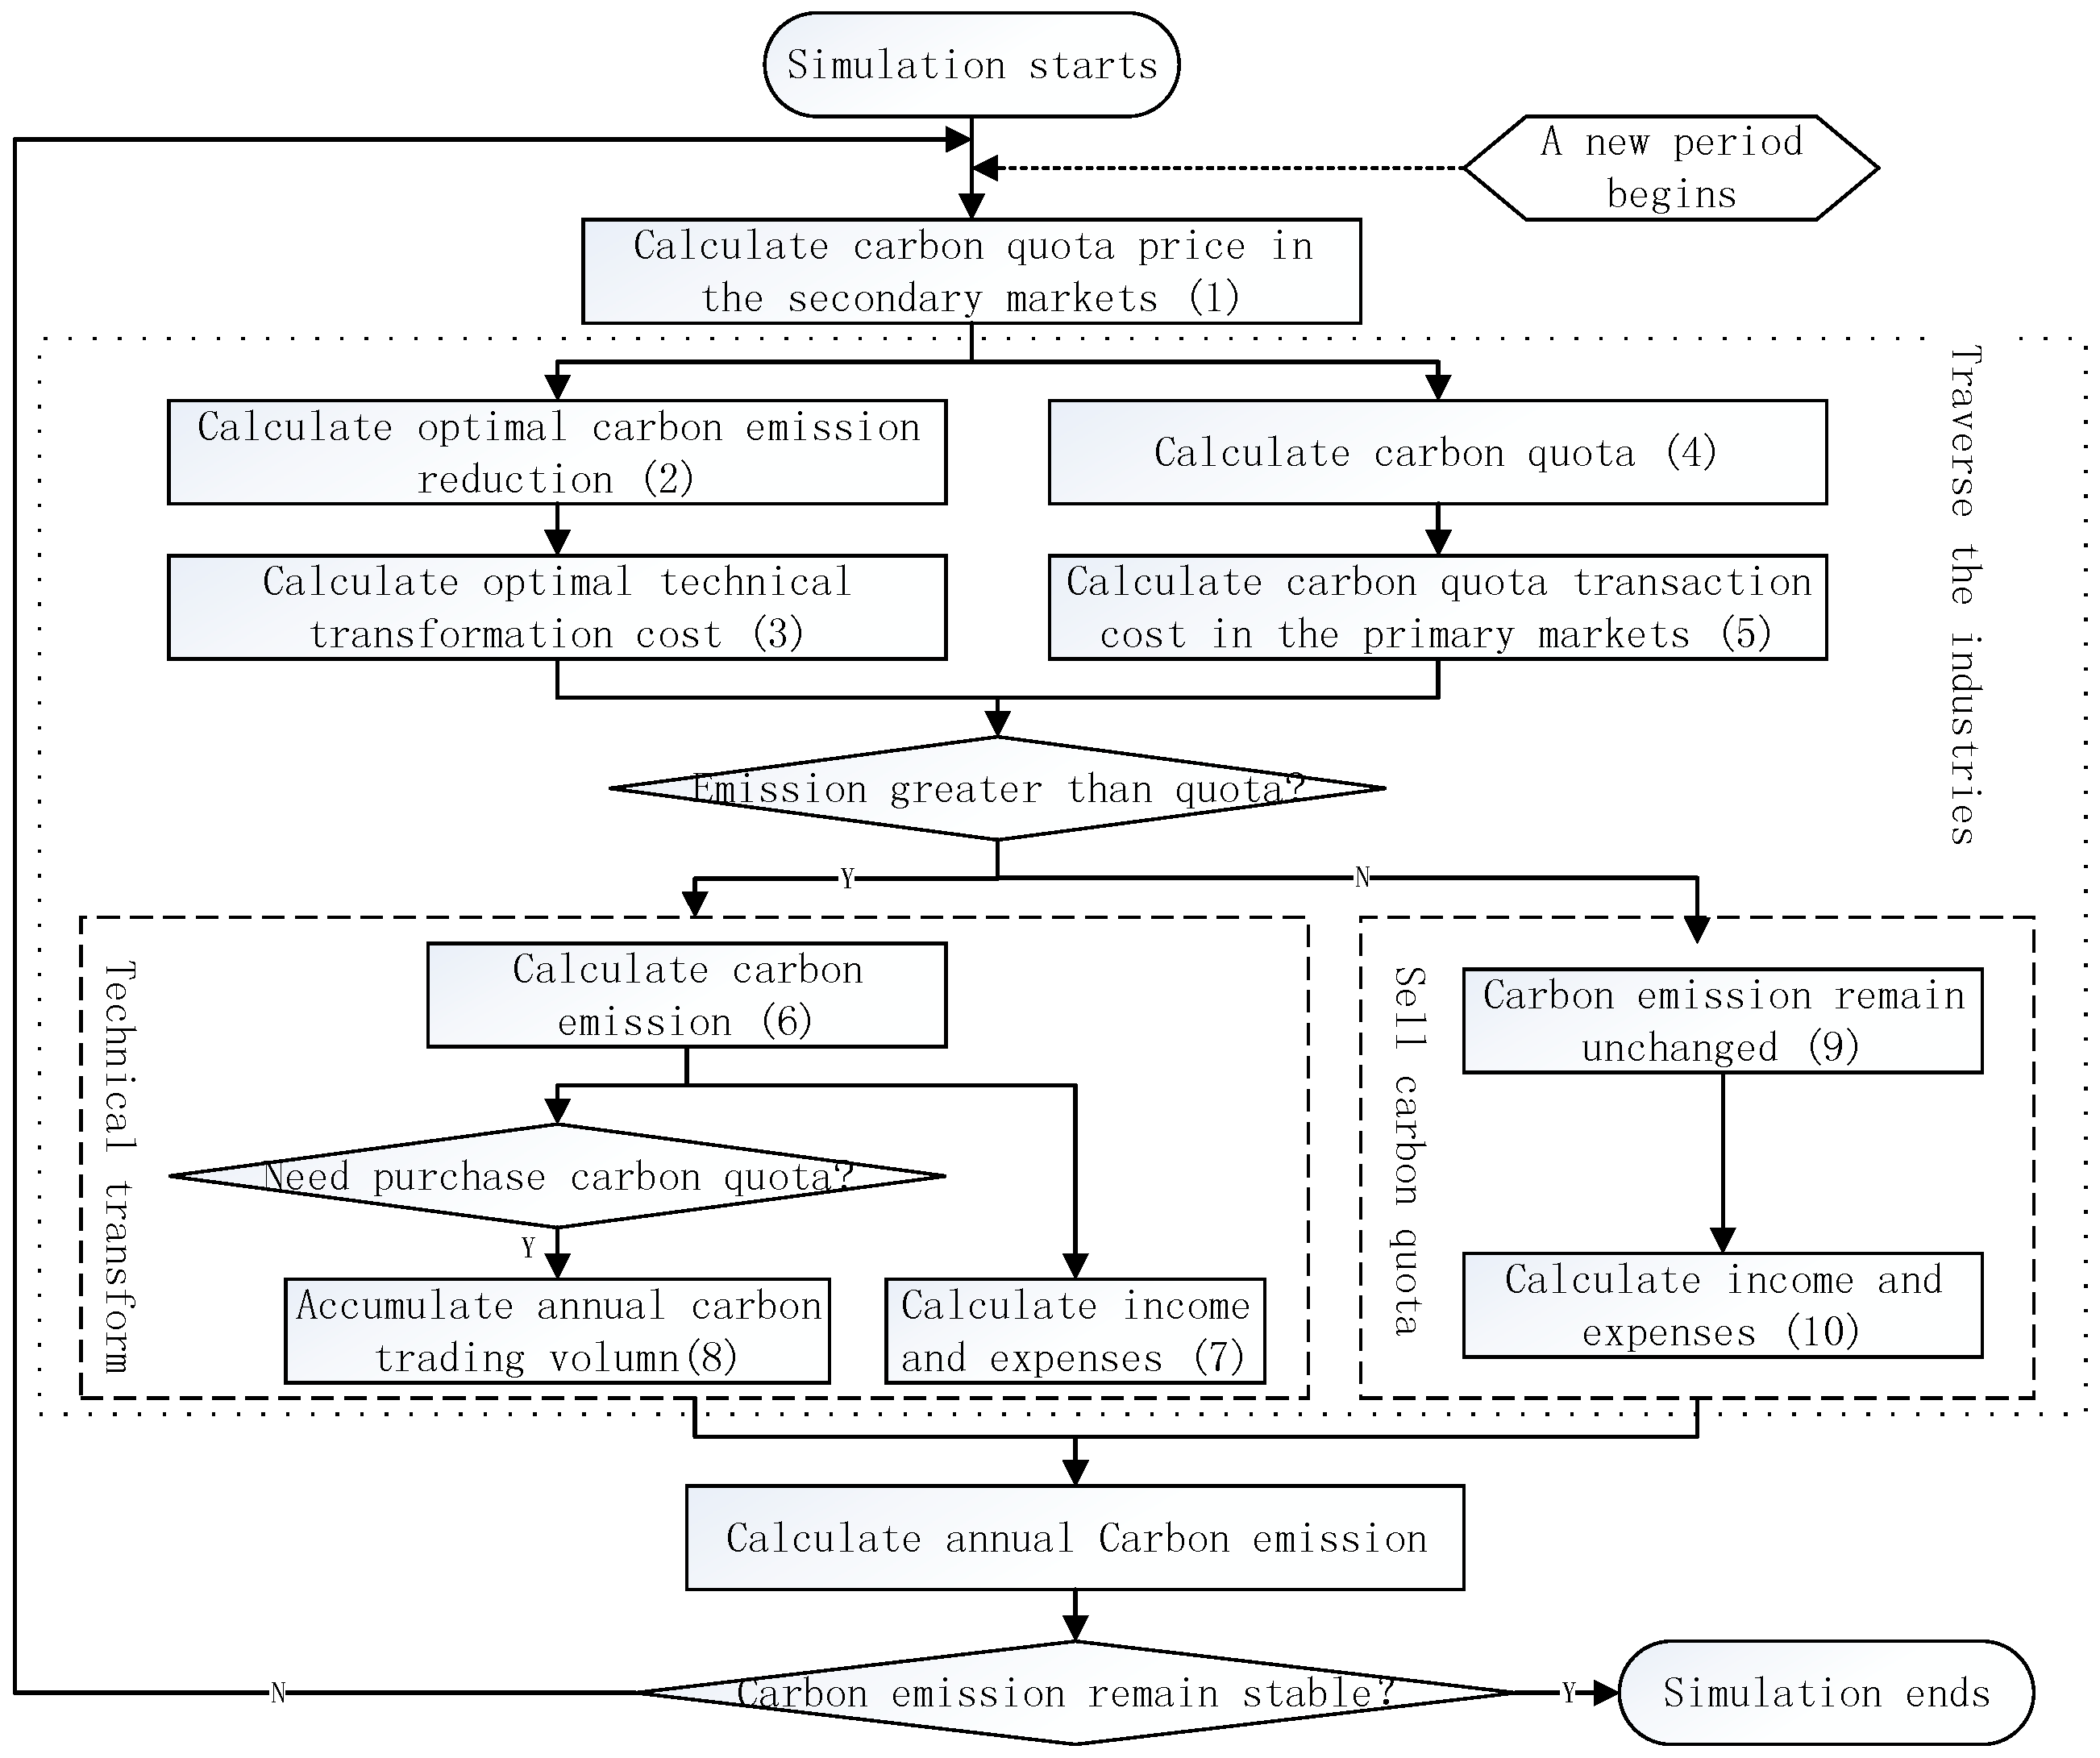
3. Simulation of Carbon Transaction among Industries

3.1. Simulation Environments and Basic Assumptions

We employed Matlab to establish the simulation system of the carbon quota transaction market. The simulation time period is limited to 2015–2030 and the unit transaction period is one year. In order to facilitate analysis, we propose the following assumptions:
(1)
The carbon quota transaction market is a perfectly competitive market. Therefore, the transaction prices of different emitters are the same in one transaction period. Consequently, the trading object chosen by the emitters should be random.
(2)
There are only two choices for an emitter in one transaction period. Specifically, an emitter either makes a technical transformation to reduce carbon emissions or purchases carbon quota to achieve the emissions target.
(3)
The carbon quota requirement of all the emitters can be satisfied. In other words, the overall supply of carbon quota is sufficient.
Based on the elaboration in the previous section, we established the simulation process shown in Figure 1.

3.2. Data Sources

Each indicator mainly contains the historical carbon emissions of each emitter, the carbon quota of each emitter, the price of the carbon quota, as well as the cost and income of technical transformation. For the reason that the carbon emissions data of a single Chinese enterprise cannot be acquired, this paper takes eight industries in China as research objects (emitters). In this paper, the primary market is the carbon quota allocation market between the market manager (government) and the market participant (agent). The secondary market is the carbon quota transaction market among the agents. In the secondary market, the agents make quota transaction freely, which is generally accepted quota trading market. The data sources are listed as follows.
(1) The actual carbon emissions
We estimate the carbon emission of each industry from 2000 to 2014 based on the industrial energy consumption data from “China Statistical Yearbook” [37] and “China Energy Statistical Yearbook” [38]. The carbon emission data of each type of energy are provided in “IPCC Guidelines for National Greenhouse Gas Inventories (2006)” [39].
(2) The carbon quota
We can conclude from the experience of the carbon quota trading in China that the carbon quota is allocated based on the historical carbon emissions of the emitters and the carbon emissions reduction target. This paper utilizes a similar approach which includes the weighted sum of the historical carbon emissions in the previous three years,
C Q n , t = α × C E n , t 1 + β × C E n , t 2 + γ × C E n , t 3
where α + β + γ is the variation strength of the carbon quota ( α + β + γ 1 ). The smaller α + β + γ is, the higher the pressure of carbon emissions reduction would be. The feature of various carbon quota distribution plans is shown in Table 1.
(3) The carbon quota price
There are five of seven newly-built carbon trading markets in China which set the initial carbon quota unit price as 20 RMB. Therefore, we assume that the carbon quota unit price is 20 RMB in the first year of carbon trading. In the perfectly competitive market, the price of the carbon quota should be decided by the supply and demand relationship. This paper analyzes 218 transaction data from 2014 to 2015 in Shenzhen’s carbon trading market. Then it makes regression between the carbon quota price and trading volume. By stepwise regression among the first-lagged trading volume, second-lagged trading volume, and the trading price, we obtain the optimal fitting equation
ln p i = 0.911 × ln p i 1 0.001 × ln q i 1 + 0.389
where pi is the current price, pi−1 is the previous price, and qi−1 is the previous trading volume. In this equation “i” is the time period (several days on average) from the former transaction to the current one. Utilizing Formula (9), the carbon quota trading price can be calculated.
(4) The cost and benefit of technical transformation
The previous section suggests that the cost of carbon emissions reduction TC0 is closely related to the emitter character k. Moreover, we can obtain the typical technical transformation cost of each industry and the annual carbon emissions reduction from the “National energy conservation technology promotion directory” [40] proposed by National Development and Reform Commission and the “Energy conservation, emissions reduction and low carbon technology achievements transformation promotion list” [41] proposed by Ministry of Science and Technology. Based on this, we obtain the carbon emissions reduction by unit technical transformation investment which can replace the aforementioned “k”. We suppose in this paper that the aim of technical transformation is only to reduce carbon emissions, so we omit the economic value of the technical transformation. The unit carbon emission reduction cost is listed in Table 2.

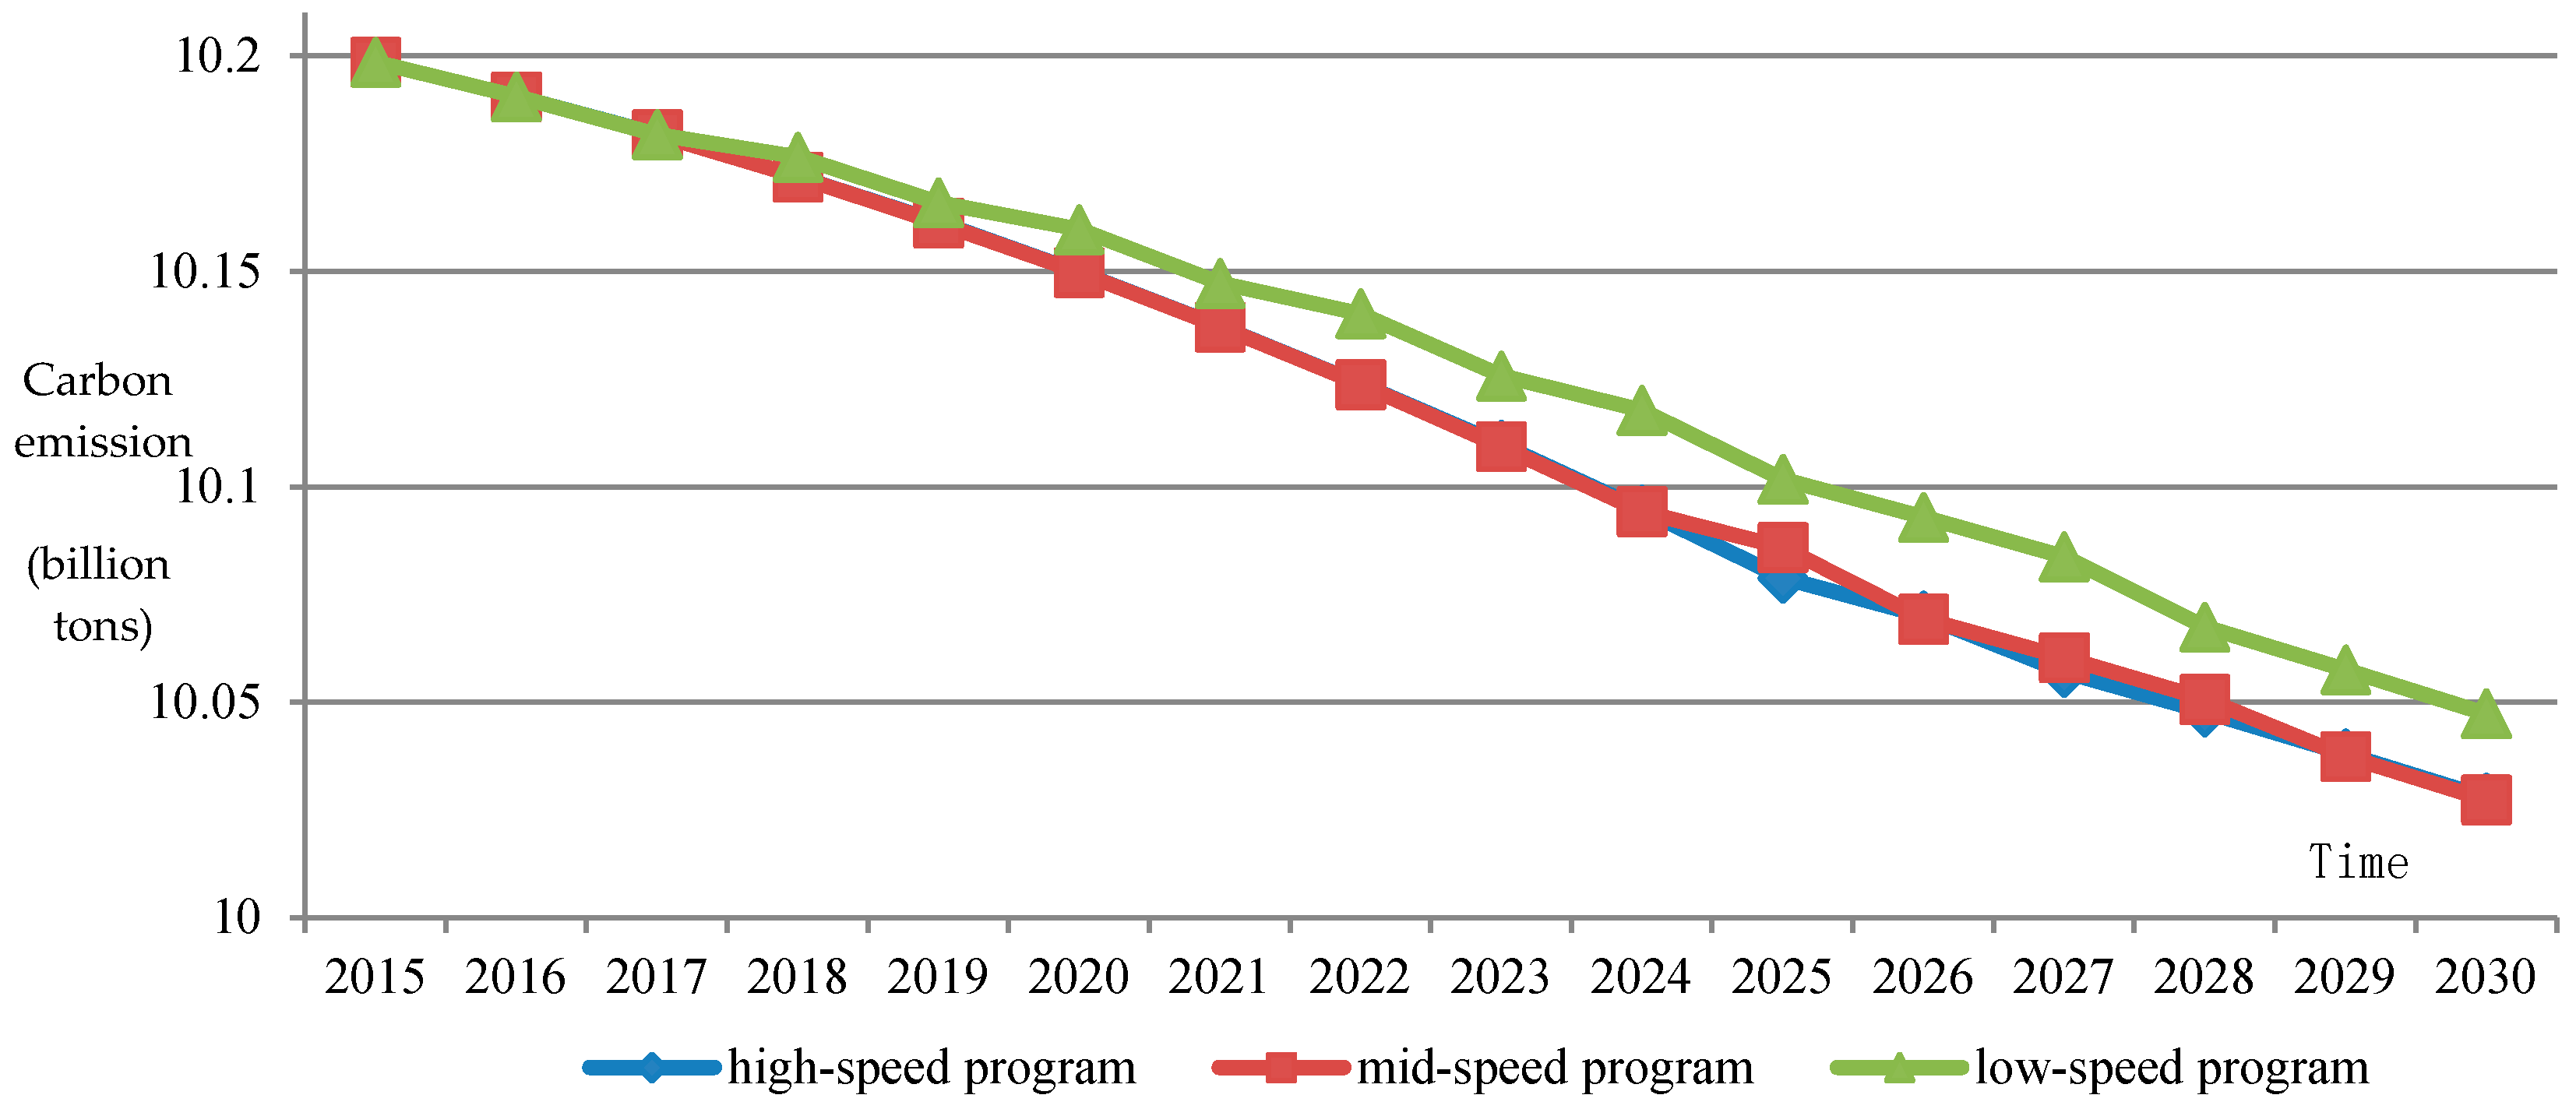
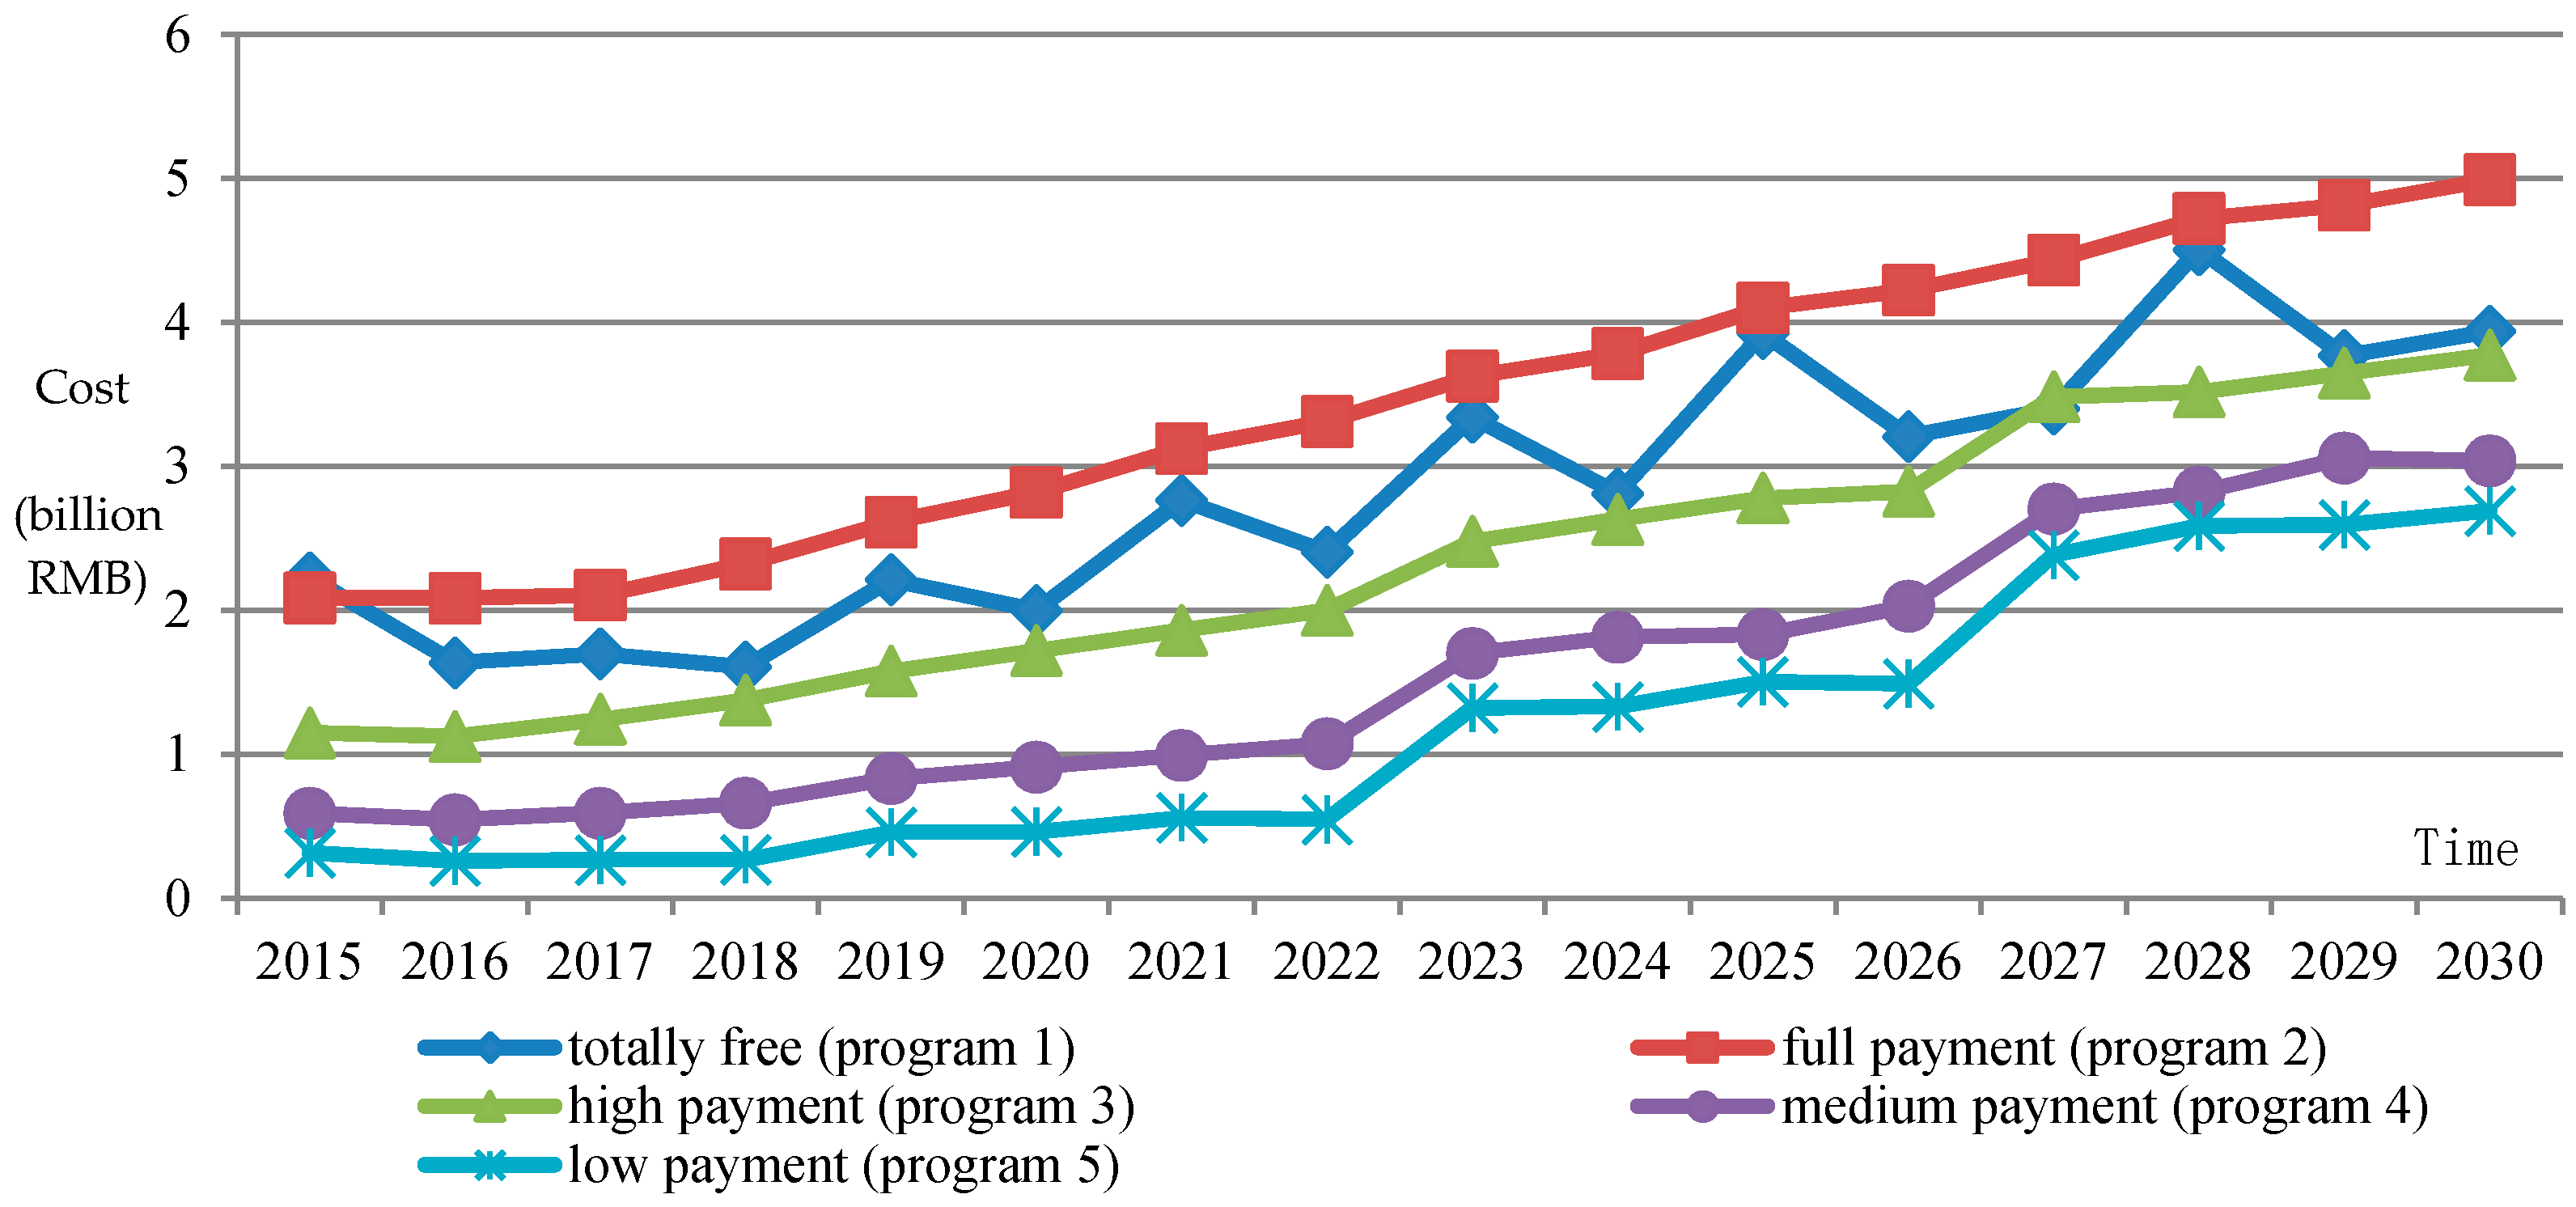
3.3. Simulation Results and Analysis

In this section, we simulate the carbon emissions reduction effects in different carbon quota allocation mechanisms including the “free mode”, “paid mode”, and “mixed mode”. By calculating in Matlab, we obtain the carbon quota transaction condition of eight Chinese industries from 2015 to 2030, which is described in Table 3.
Based on this, we can assess the effect of carbon emissions reduction policy in the following three aspects.
(1) Analysis of carbon emissions reduction performance
As is depicted in Figure 2, in the context of the total emissions control, the constraint of carbon quota transaction mechanism results in significant carbon emissions reduction in China. Because the carbon emissions in Program 1 and Program 2 equals that in Program 5, we take the case in program 5 as an example. By comparing the cases in different programs we can see that the total carbon emission reduces from 10.1986 in 2015 to 10.0279 in 2030 in the high-speed program, while it decreases to 10.0274 and 10.0474 in the mid-speed program and in the low-speed program, respectively. Apparently, the carbon emissions in the three programs are reduced by 0.1707, 0.1712, and 0.1512, respectively. Moreover, the reduction percent of the carbon emissions brought about by these three types of programs is 1.67%, 1.68%, and 1.48%, respectively. In addition, the average annual reduction of the low-speed program is less than 0.1%, while that of the mid-speed and high-speed programs is 0.1126% and 0.1129%, respectively. In general, the carbon emissions reduction in the low-speed program is relatively less than those in other two programs. However, by comparing the mid-speed program and high-speed program, we can see that the carbon emissions reduction in the former program is more than that in the latter program. This shows that the effect that promotes the carbon emissions reduction speed by decreasing the carbon quota is not obvious. Specifically, there is a threshold of the carbon quota reduction and, therefore, overly quick carbon quota reduction would result in the ineffectiveness of the carbon allocation policy on emitters.
(2) Analysis of the economic effect
We can obtain the cost of the carbon emissions reduction in various carbon quota allocation mechanisms, which is shown in Figure 3, based on the former assumptions. Generally speaking, the cost of carbon emissions reduction is increasing due to the annually descending carbon quota. Specifically, the policy of full payment of the carbon quota (Program 2) brings about the highest cost of carbon emissions reduction. As shown in Figure 3, the annual average cost is 3.449. Moreover, the cost of technical transformation to achieve the carbon emission standard from 2015 to 2030 in the policy of totally free of carbon quota (Program 1) is 2.842. Although the emitters need not pay for the carbon quota in this program, if we take into account the carbon emissions reduction of the whole society, the overall cost of this situation is higher than the mixed allocation policy (Programs 3, 4, and 5). The cost of carbon emissions reduction in the same period is 2.325, 1.576, and 1.191, respectively. This suggests that the policy of totally free carbon quota would decrease motivation of the emitters for implementing technological transformation. Therefore, the emitters which are expected to transform technology and sell extra carbon quota omits the technical transformation, which should result in the cost increase of carbon emissions reduction of the whole society.
(3) Analysis of unit carbon emissions reduction
Based on the analysis above, we can calculate the carbon emissions reduction and its cost in various carbon quota allocation mechanisms and requirements. Afterward, we obtain the descriptive statistic of the annual cost of unit carbon emissions reduction from 2015 to 2030 in several sample policies as shown is Table 4.
On the whole, the cost of unit carbon emissions reduction in mixed allocation policy is far less than that in totally free (Program 1) or full payment (Program 2) allocation policy. In addition, the carbon emissions in Program 1 equals that in Program 2, while the cost of carbon emissions reduction in Program 2 is higher than that in Program 1 due to the extra carbon quota purchase. Moreover, the carbon emissions in Program 1 is equal to that in Program 5, but the cost is significantly higher. Additionally, the average annual increase of the carbon emissions reduction cost (up to 15%) in Program 5 is the highest one of all the programs. This means that the cost of technical transformation to achieve the carbon emissions target and purchasing the carbon quota increases quickly. By comparing Programs 3, 4, and 5, we can conclude that the unit carbon emission cost sharply rises with the increase of the carbon quota reduction speed. As a consequence, it is of great necessity to control the unit carbon emission reduction cost by designing an appropriate carbon quota allocation policy to avoid the excessive economic pressure on the emitters.

4. Conclusions and Prospects

The carbon quota transaction mechanism based on the total carbon emissions control is an important policy instrument which promotes the emitters to reduce carbon emissions. This paper utilizes the agent-based simulation in which we consider each emitter as an agent and then set its properties and action rule. We study the carbon quota transaction and its economic impact on the industry in different carbon quota allocation mechanisms. Therefore, we come to the following conclusions:
(1)
In the assumption of the perfectly competitive market and zero transaction costs, the carbon quota transaction policy mechanism can significantly bring about carbon emissions reduction. Specifically, although the carbon quota allocation and transaction mechanism varies, the carbon emission decreases in the context of the total carbon emissions control. This means that the carbon quota transaction policy contributes to the carbon emissions reduction significantly.
(2)
Based on the comparison of different carbon quota allocation mechanisms, we conclude that the mechanisms are capable of promoting the carbon emissions reduction. Specifically, by considering both the carbon emissions reduction and its cost we obtain the result that the slow carbon quota reduction approach in the mixed allocation mechanism has the minimum cost of unit carbon emission. In other words, it realizes the minimal economic impact of the carbon emissions reduction on the premise that the carbon emissions achieve the target. On the other hand, the variation of the carbon quota has an interval threshold, which means that excessive quota decrease cannot promote the emitters to reduce emissions. For example, taking into account the requirement for both the carbon emissions reduction and economy development, it is of necessity for China to implement the mixed carbon quota allocation mechanism and ensure that the proportion of initial free quota is higher than the proportion which should be purchased by the emitters.
In summary, the agent-based simulation system established by this paper is of help to analyze the carbon quota transaction. However, we simplify the action rules of the emitters and omit the individual differences of the emitters due to the consideration of data availability and analysis facilitation. Moreover, the assumption of the linear marginal abatement cost function is simple and needs to be improved in further researches. Additionally, the technical transformation cost varies during the carbon transaction process which is influenced by many complex factors. As a consequence, the influence mechanism should be taken into account while focusing on specific industries or regions.

Acknowledgments

This research is supported by Natural Science Foundation of China (71601148) and China Postdoctoral Science Foundation (2016M592393).

Author Contributions

Wei Jiang proposed the idea and analyzed the data; Jia Liu made simulation program and wrote the manuscript; Xiang Liu collected the data and built mathematical models.

Conflicts of Interest

The authors declare no conflict of interest.

References

  1. Kyoto Protocol. Available online: http://unfccc.int/kyoto_protocol/items/2830.php (accessed on 10 August 2016).
  2. Mathys, N.A.; de Melo, J. Political Economy Aspects of Climate Change Mitigation Efforts. World Econ. 2011, 34, 1938–1954. [Google Scholar] [CrossRef]
  3. Verma, Y.P.; Kumar, A. Potential impacts of emission concerned policies on power system operation with renewable energy sources. Int. J. Electr. Power Energy Syst. 2013, 44, 520–529. [Google Scholar] [CrossRef]
  4. Nelson, H.T. Planning implications from the interactions between renewable energy programs and carbon regulation. J. Environ. Plan. Manag. 2008, 51, 581–596. [Google Scholar] [CrossRef]
  5. Ishikawa, J.; Kiyono, K. Greenhouse-gas emission controls in an open economy. Int. Econ. Rev. 2006, 47, 431–450. [Google Scholar] [CrossRef]
  6. Greaker, M.; Pade, L.L. Optimal carbon dioxide abatement and technological change: Should emission taxes start high in order to spur R&D? Clim. Chang. 2009, 96, 335–355. [Google Scholar]
  7. Green, R.; Yatchew, A. Support Schemes for Renewable Energy: An Economic Analysis. Econ. Energy Environ. Policy 2012, 1, 83–98. [Google Scholar] [CrossRef]
  8. Pang, R.Z.; Deng, Z.Q.; Chiu, Y.H. Pareto improvement through a reallocation of carbon emission quotas. Renew. Sustain. Energy Rev. 2015, 50, 419–430. [Google Scholar] [CrossRef]
  9. Zhang, Y.J.; Wang, A.D.; Da, Y.B. Regional allocation of carbon emission quotas in China: Evidence from the Shapley value method. Energy Policy 2014, 74, 454–464. [Google Scholar] [CrossRef]
  10. Silva, E.C.D.; Zhu, X. Global trading of carbon dioxide permits with noncompliant polluters. Int. Tax Public Financ. 2008, 15, 430–459. [Google Scholar] [CrossRef]
  11. Shaw, K.; Shankar, R.; Yadav, S.S.; Thakur, L.S. Supplier selection using fuzzy AHP and fuzzy multi-objective linear programming for developing low carbon supply chain. Expert Syst. Appl. 2012, 39, 8182–8192. [Google Scholar] [CrossRef]
  12. Zhang, B.; Xu, L. Multi-item production planning with carbon cap and trade mechanism. Int. J. Product. Econ. 2013, 114, 118–127. [Google Scholar] [CrossRef]
  13. Strand, J. Strategic climate policy with offsets and incomplete abatement: Carbon taxes versus cap-and-trade. J. Environ. Econ. Manag. 2013, 66, 202–218. [Google Scholar] [CrossRef]
  14. Chappin, E.J.L.; Dijkema, G.P.J. On the impact of CO2 emission-trading on power generation emissions. Technol. Forecast. Soc. Chang. 2009, 76, 358–370. [Google Scholar] [CrossRef]
  15. Stephan, N.; Bellassen, V.; Alberola, E. Use of Kyoto Credits by European Industrial Installations: From an Efficient Market to a Burst Bubble. Auto-Saisine. 2014. Available online: https://hal.archives-ouvertes.fr/hal-01123087/ (accessed on 10 August 2016).
  16. Jong, T.; Couwenberg, O.; Woerdman, E. Does EU Emissions Trading Bite? An Event Study. Energy Policy 2014, 69, 510–519. [Google Scholar] [CrossRef]
  17. Oestreich, A.M.; Tsiakas, I. Carbon emissions and stock returns: Evidence from the EU Emissions Trading Scheme. J. Bank. Financ. 2015, 58, 294–308. [Google Scholar] [CrossRef]
  18. Bushnell, J.B.; Chong, H.; Mansur, E.T. Profiting from Regulation: Evidence from the European Carbon Market. Am. Econ. J. Econ. Policy 2013, 5, 78–106. [Google Scholar] [CrossRef]
  19. Grubb, M.; Neuhoff, K. Allocation and competitiveness in the EU emissions trading scheme: Policy overview. Clim. Policy 2006, 6, 7–30. [Google Scholar] [CrossRef]
  20. Mahmoud, M.; Yuqiong, L.; Holly, H.; Steven, S.; Thorsten, W.; Darius, S.; Robert, S.; Hoshin, G.; Damian, D.; Francina, D.; et al. A formal framework for scenario development in support of environmental decision-making. Environ. Model. Softw. 2009, 24, 798–808. [Google Scholar] [CrossRef]
  21. Camporeale, C.; De Nicola, A.; Villani, M.L. Semantics-based services for a low carbon society: An application on emissions trading system data and scenarios management. Environ. Model. Softw. 2015, 64, 124–142. [Google Scholar] [CrossRef]
  22. World Bank Report on State and Trends of Carbon Pricing (2015). Available online: http://documents.worldbank.org/curated/en/636161467995665933/State-and-trends-of-carbon-pricing-2015 (accessed on 10 August 2016).
  23. Duan, M.S.; Tao, P.; Zhang, X.L. Review of Carbon Emissions Trading Pilots in China. Energy Environ. 2014, 25, 527–550. [Google Scholar]
  24. Wu, L.B.; Qian, H.Q.; Li, J. Advancing the experiment to reality: Perspectives on Shanghai pilot carbon emissions trading scheme. Energy Policy 2014, 75, 22–30. [Google Scholar] [CrossRef]
  25. Jiang, J.J.; Ye, B.; Ma, X.M. The construction of Shenzhen’s carbon emission trading scheme. Energy Policy 2014, 75, 17–21. [Google Scholar] [CrossRef]
  26. Huang, G.X.; Ouyang, X.L.; Yao, X. Dynamics of China’s regional carbon emissions under gradient economic development mode. Ecol. Indic. 2014, 51, 197–204. [Google Scholar] [CrossRef]
  27. Liu, L.W.; Chen, C.X.; Zhao, Y.F.; Zhao, E.D. China’s carbon-emissions trading: Overview, challenges and future. Renew. Sustain. Energy Rev. 2015, 49, 254–266. [Google Scholar] [CrossRef]
  28. Liao, Z.L.; Zhu, X.L.; Shi, J.R. Case study on initial allocation of Shanghai carbon emission trading based on Shapley value. J. Clean. Product. 2015, 103, 338–344. [Google Scholar] [CrossRef]
  29. Wang, X.W.; Cai, Y.P.; Xu, Y.; Zhao, H.Z.; Chen, J.J. Optimal strategies for carbon reduction at dual levels in China based on a hybrid nonlinear grey-prediction and quota-allocation model. J. Clean. Product. 2014, 83, 185–193. [Google Scholar] [CrossRef]
  30. Zhou, P.; Zhang, L.; Zhou, D.Q.; Xia, W.J. Modeling economic performance of interprovincial CO2 emission reduction quota trading in China. Appl. Energy 2013, 112, 1518–1528. [Google Scholar] [CrossRef]
  31. Fatma, M.; Nilgun, F. Agent based simulation of carbon emissions trading market. In Proceedings of the PICMET ’11: Technology Management in the Energy Smart World, Portland, OR, USA, 31 July–4 August 2011; pp. 867–876.
  32. Mizuta, H.; Kato, S.; Tai, H. Agent-based simulation of CO2 emissions trading and large-scale traffic flow. In Proceedings of the Sice Annual Conference, Tokyo, Japan, 20–22 August 2008; pp. 416–421.
  33. Mizuta, H.; Yamagata, Y. Agent-based simulation and greenhouse gas emissions trading. In Proceedings of the 2001 Winter Simulation Conference, Arlington, VA, USA, 9–12 December 2001; pp. 535–540.
  34. Zheng, W.; Rongda, C. The setting of initial allocation approaches of carbon emission permits. In Proceedings of the 2011 Fourth International Conference on Business Intelligence and Financial Engineering (BIFE), Wuhan, China, 17–18 October 2011; pp. 668–670.
  35. Creti, A.; Jouvet, P.; Mignon, V. Carbon price drivers: Phase I versus Phase II equilibrium. Energy Econ. 2012, 34, 327–334. [Google Scholar] [CrossRef]
  36. Cong, R.; Wei, Y. Experimental comparison of impact of auction format on carbon allowance market. Renew. Sustain. Energy Rev. 2012, 16, 4148–4156. [Google Scholar] [CrossRef]
  37. China Statistical Yearbook 2014. Available online: http://www.stats.gov.cn/tjsj/ndsj/2014/indexeh.htm (accessed on 10 August 2016).
  38. China Energy Statistical Yearbook. Available online: http://tongji.cnki.net/kns55/Navi/HomePage.aspx?id=N2010080088&name=YCXME&floor=1 (accessed on 10 August 2016).
  39. IPCC Guidelines for National Greenhouse Gas Inventories (2006). Available online: http://www.ipcc-nggip.iges.or.jp/public/2006gl/ (accessed on 10 August 2016).
  40. National Energy Conservation Technology Promotion Directory. Available online: http://www.sdpc.gov.cn/zcfb/zcfbgg/201401/t20140110_575362.html (accessed on 10 August 2016).
  41. Energy Conservation, Emissions Reduction and Low Carbon Technology Achievements Transformation Promotion List. Available online: http://www.most.gov.cn/mostinfo/xinxifenlei/fgzc/gfxwj/gfxwj2014/201403/t20140320_112354.htm (accessed on 10 August 2016).
Figure 1. Simulation process.
Sustainability 08 00826 g001
Figure 2. Carbon emissions reduction in various programs.
Sustainability 08 00826 g002
Figure 3. Carbon emissions reduction cost in various quota allocation mechanisms.
Sustainability 08 00826 g003
Table 1. Feature of various carbon quota distribution plans.
PlanCarbon Quota Variation Ratio ( k t )Carbon Quota Distribution Mode ( a t )
Free mode (Program 1) k t = 0.95 a t = 1
Paid mode (Program 2) k t = 0.95 a t = 0
Mixed modeHigh carbon quota decrease rate (Program 3) k t = α + β + γ = 0.6 { a t = 0.05 , t ( 2015 , 2018 ) a t = 0.1 , t ( 2019 , 2022 ) a t = 0.3 , t ( 2023 , 2026 ) a t = 0.5 , t ( 2027 , 2030 )
Medium carbon quota decrease rate (Program 4) k t = α + β + γ = 0.8
Low carbon quota decrease rate (Program 5) k t = α + β + γ = 0.95
Table 2. Unit carbon emission reduction cost of various industries.
EmitterTechnical Transformation Cost (10,000 RMB*/Ton)Annual Carbon Emission Reduction (Ton)
Agriculture, forestry, animal husbandry, fisheries and water conservancy741.85415,606
Mining161.412,749
Manufacturing98.42164.8
Electric Power, Gas and Hydraulic Production and Supply117525,692
Construction56776
Transportation, warehousing and postal service94,7782,000,000
Wholesale, retail, hotel and restaurants303.2956.8
Others56776
* China Yuan (CNY).
Table 3. Description of carbon quota transaction programs.
Program 1Program 2Program 3Program 4Program 5
Carbon emission reductionAmount0.15120.15120.17070.17120.1512
Ratio1.48%1.48%1.67%1.68%1.48%
Annual average0.0996%0.0996%0.1126%0.1129%0.0996%
Carbon emission reduction costMinimum1.6102.0861.1240.5470.260
Maximum4.5084.9933.7753.0602.693
Average2.8423.4492.3251.5761.191
Standard deviation0.9191.0330.9420.9280.933
Annual average3.87%5.99%8.25%11.53%15.36%
Table 4. Descriptive statistic of annual cost of unit carbon emissions reduction.
Average (RMB/Ton)MaximumMinimumStandard DeviationAnnual Average Increase
Program 128.1044.7815.829.200.04
Program 234.1049.6920.4710.370.06
Program 323.0437.6411.039.460.08
Program 415.6330.485.369.280.12
Program 511.8026.802.559.280.15

