1. Introduction
Under the stimulus of AlphaGo, Google’s DeepMind artificial intelligence program and IBM’s Watson, a question-answering computer system, the “fourth industrial revolution” has become of great interest to the South Korean government and industry sectors. For South Korea, it represents a strategic breakthrough due to its manufacturing industry-leading, export-oriented, economic structure. In this context, we have an interest in developing strategic ways to strengthen South Korea’s industrial output.
Many governments and global companies strive for sustainable growth and improved global competitiveness in a rapidly changing business environment [
1]. South Korea’s government is faced with a difficult situation due to the increasing number of elderly people and challenges to tax revenues caused by recession. The increasing rate of public research and development (R&D) investment is slowing [
2]. A new approach is needed for sustainable growth and enhanced competitiveness in the scenario of available resources. The “open innovation” concept, introduced by Chesbrough [
3], has received much attention [
4,
5,
6,
7,
8,
9]; this concept, in short, refers to the use of outer as well as inner knowledge to improve internal innovation.
Data envelopment analysis (DEA) has been widely used for the analysis of efficiency and productivity. Yang and Anderson noted that the open innovation approach is not a single, unique strategy to enable firms to succeed [
10]; they studied 18 global companies’ open innovation strategies using the DEA method and the companies’ R&D investments, patents, revenues, market capitalizations, intangible assets, and goodwill, as published in the corporate annual reports. However, the study did not establish the efficiencies of the companies with respect to open innovation. It is difficult to find studies that have explored both open innovation and DEA for the analysis of efficiency or strategy. We presume that such a combined approach is challenging because the term “open innovation” is a practical strategy, while DEA is an analytical method. Therefore, we have restricted the scope of our study to using DEA to identify strategies that would strengthen the industrial output of South Korea.
Patents have been widely used as a surrogate variable in the study of the measurement of output, technological innovation activity, or the strategy of technology management [
11,
12,
13,
14,
15]. We also use patents as a surrogate variable of output or endeavor of technological innovation. There are broadly two types of patents: applied and registered. When we analyze technological innovation or the output of R&D, the statistics of patent applications are more appropriate than the registered ones [
16,
17]. This is because the elapsed time between R&D and a patent application is shorter than for patent registration [
16]. Therefore, we focused on patent applications in our study.
Patents have some limitations, although they have been used widely as a means to measure technological innovation. However, they are not equally relevant in every economic sector. They are usually more important and filed much more often in high-tech industries than in lower-tech industries. Business method patents can only be obtained when they use information and communication technology [
18]. In some special sectors, know-how or confidential business information may be preferred to protection by patents. Lanjouw et al. also pointed out that patent counts are an imperfect measure of innovative output [
1]. They argued that the values of the innovations protected by patents differed. In another study by Lanjouw et al., quality-adjusted patent counts could be more closely correlated with R&D investment than patent counts per se [
19].
There are large differences across Korean industries in terms of patent application filings, which is the starting point of our study. We studied this difference by comparing the ratio of the number of patents according to industry. Finally, we developed several strategies to improve the use of patent applications by South Korean industries. We adopted the DEA methodology for this purpose, because there it makes no assumption about functional relationships among variables.
2. Research Background
2.1. Data Envelopment Analysis (DEA)
DEA is a non-parametric method used in economics and industrial engineering to estimate relative efficiencies among entities, such as firms or countries. These entities are usually described as decision-making units (DMUs). DMU efficiency is defined as “the ratio of the sum of its weighted outputs to the sum of its weighted inputs” [
20]. The DEA method was developed by Charnes, Cooper, and Rhodes [
21] for evaluating a United States federal government program. The method, also commonly called the “CCR” model, after the authors, assumed constant returns to scale (CRS) and had an input orientation that indicates how much an entity should decrease its inputs for given outputs to improve its efficiency. The DEA method identifies best practices, which are typically called efficiency frontiers or peers; these have an efficiency score of 1 (or 100%). After calculating an efficiency score and identifying the best practices or frontiers, the DEA method enables one to judge whether an entity is efficient and determines what inputs or outputs are required to improve its efficiency. The DEA method, because it is a non-parametric approach, has the advantage of not assuming a functional relationship among inputs and outputs. This characteristic has resulted in the method being used widely in benchmarking and efficiency studies of entities. Banker, Charnes, and Cooper proposed a variation on the CCR model, commonly referred to as the “BCC” model, after the authors, which assumes variable returns to scale (VRS) [
22]. In economics, the term returns to scale indicates “the behavior of the rate of increase in output relative to the associated increase in inputs in the long run” [
23]. If the output changes at the same rate of change as the input, then the case is referred to as a constant return to scale (CRS). However, if the output changes at a rate that is different than that of the inputs, then the case is called a variable return to scale (VRS). There are two forms of VRS: decreasing returns to scale (DRS) and increasing returns to scale (IRS). The CRS model is appropriate when all entities are operating at an optimal scale, i.e., when all entities “evolve in a perfectly competitive environment, which is seldom the case” [
23]. The VRS model is more appropriate when all the entities are not operating at an optimal scale; that is, when all entities “face imperfect competition, government regulations, etc”. [
23]. Thus, the VRS model is more realistic than the CRS model. The CRS and VRS methods have been used widely, while many variations of the DEA method have been developed. As a result, we adopted an input-oriented VRS model of the DEA method.
The technical efficiency (TE) can be described using Equation (1) [
20]:
where
is the technical efficiency of entity
k using
m inputs to obtain
s outputs,
is the quantity of output
r obtained by entity
k,
is the quantity of input
i consumed by entity
k,
is the weight of output
r,
is the weight of input
i,
s is the number of outputs, and
m is the number of inputs.
Generally, the DEA method has the purpose of maximizing efficiency of entity
k. The primal equation or multiplier form for the input-oriented VRS model is presented below [
20]:
where
is the variable axis for entity
k [
20].
Duality is often used in linear programming [
24] and it can also be used in the formulation of DEA. The dual form, also known as the envelopment form, is preferable because “it contains only
s + m constraints rather than
n + 1 constraints in the multiplier form” [
20]. The envelopment form of the input-oriented VRS model is presented below:
where
represents the technical efficiency of entity
k, and
represents the associated weighting of outputs and inputs of entity
j.
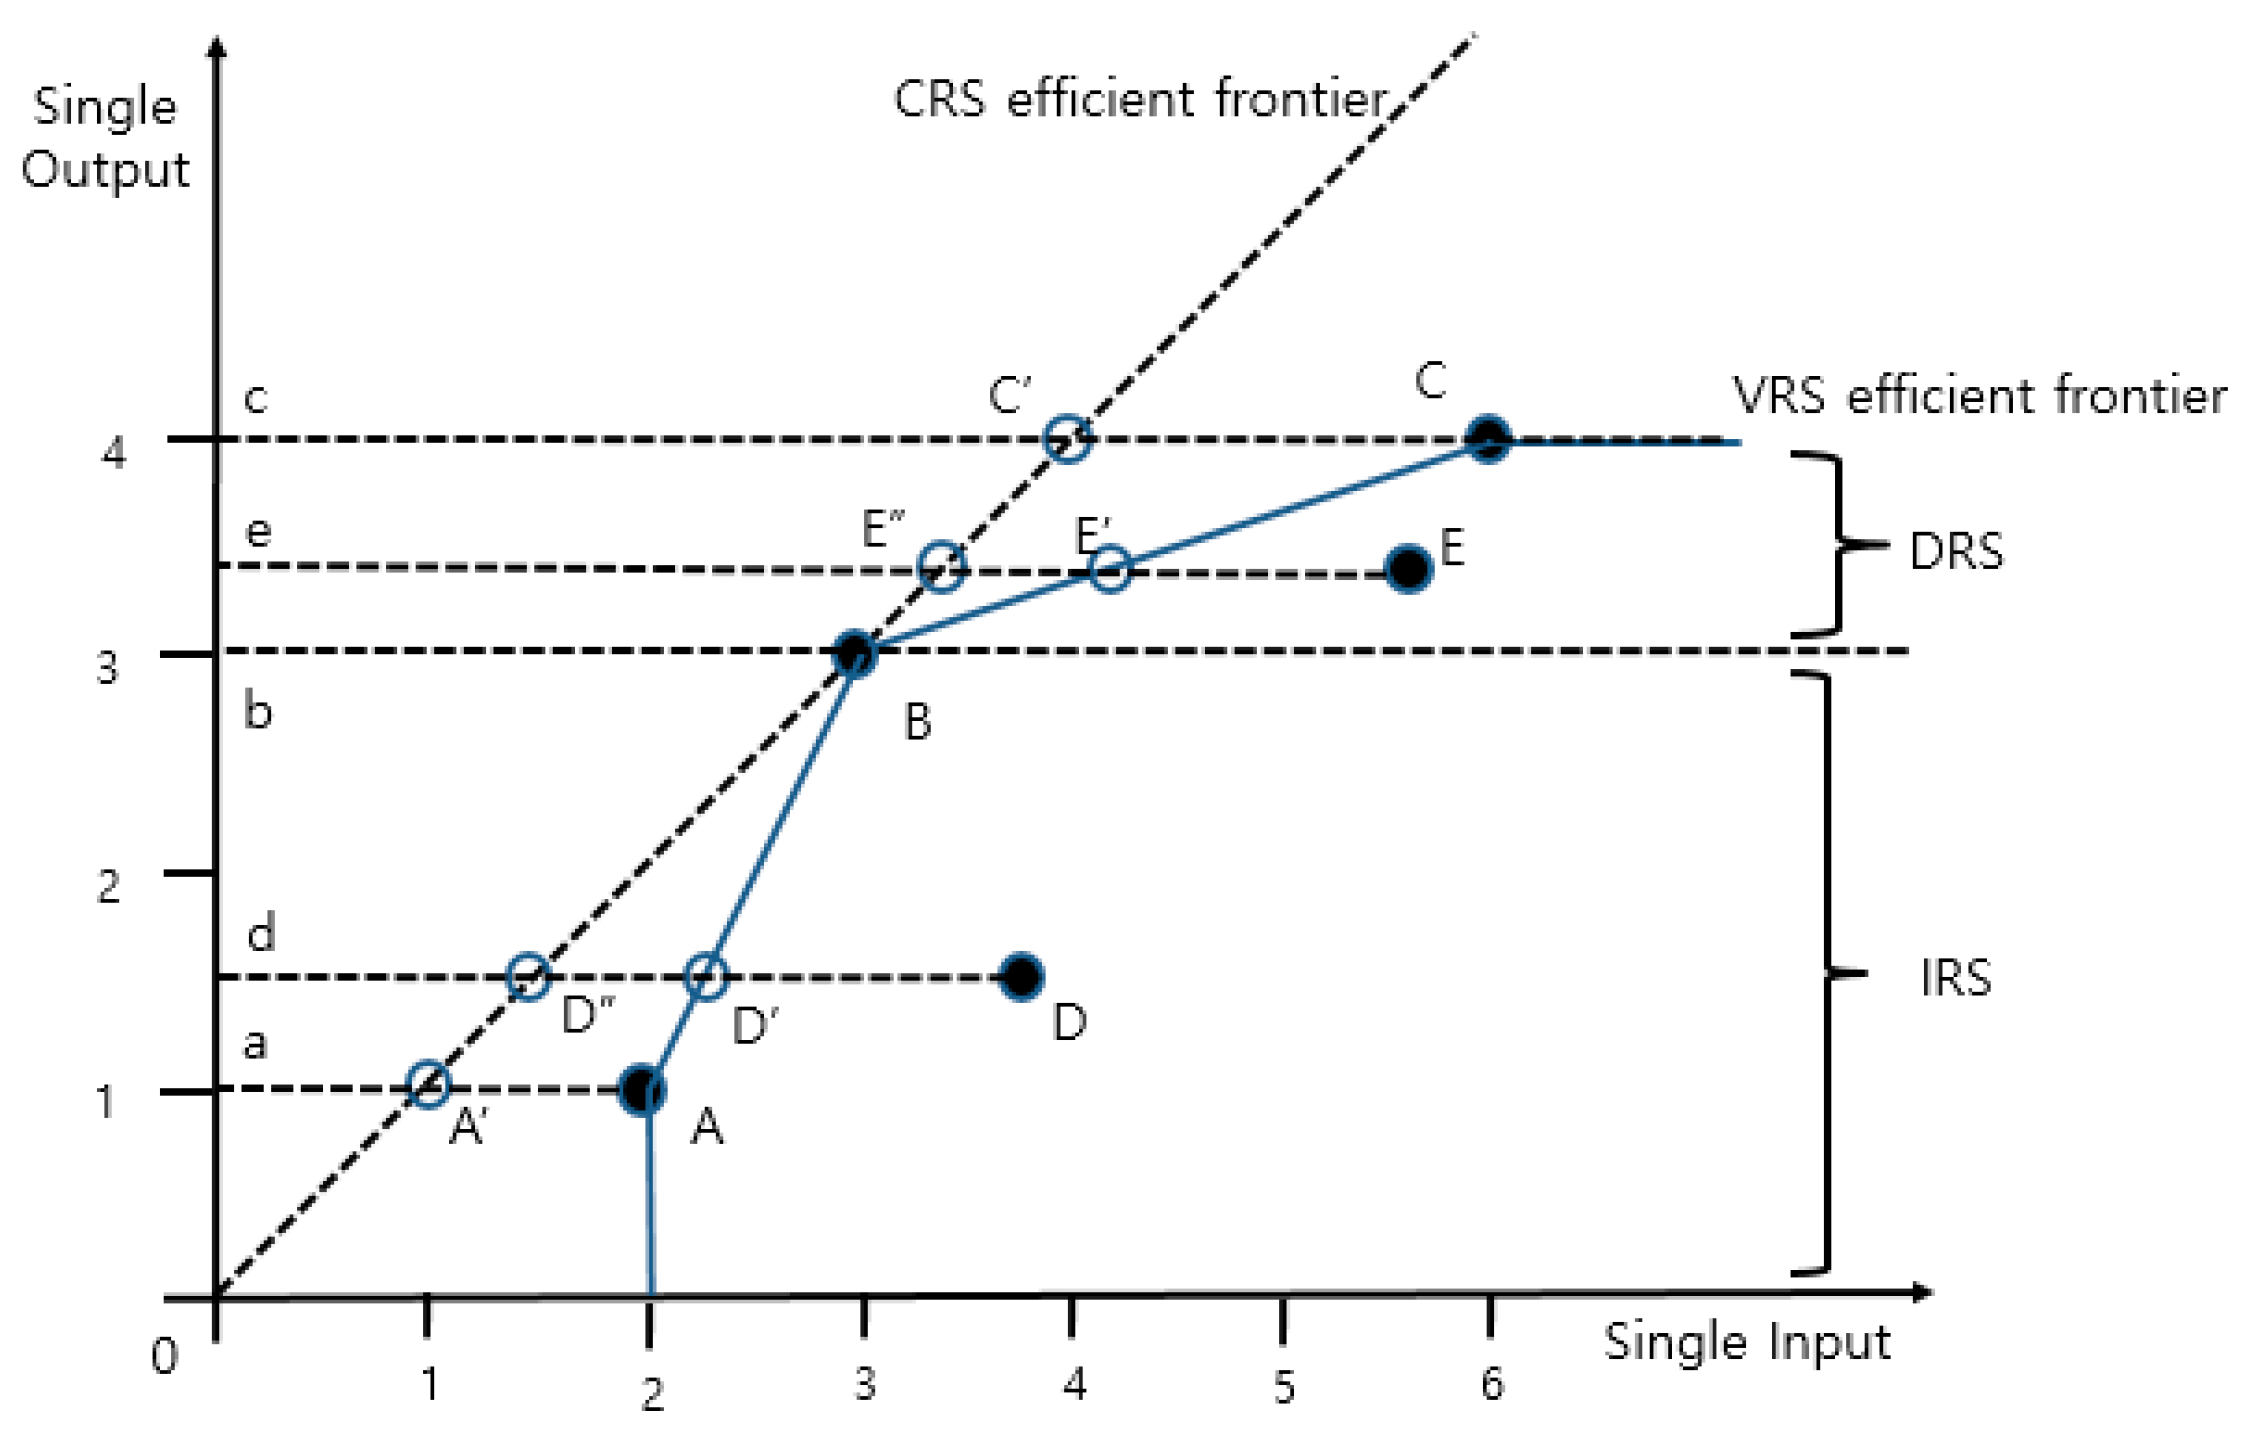
Figure 1 helps clarify the concept of technical and scale efficiency and the differences between the CRS and VRS models by showing a simple example with single input and output. The diagonal dashed line represents the CRS efficient frontier and the solid line, composed of A, B, and C, represents the VRS efficient frontier. B is totally efficient under the CRS and VRS models. If A and C are to be efficient under the CRS assumption, they should move to A’ and C’, respectively, while they are 100% efficient under the VRS model. D and E are inefficient under the models. The technical efficiency of D under the CRS model is dD″/dD, while that of D under the VRS model is dD’/dD [
20]. Scale efficiency is defined as the ratio of the technical efficiency under the CRS model to the technical efficiency under the VRS model. The distance D′D″ is associated with the scale efficiency. More specifically, the scale efficiency of D is dD″/dD′. The slope of the VRS efficient frontier or productivity can be helpful in understanding the nature of the return to scale. Productivity is usually expressed as the ratio of output to input. The productivities of A, B, and C are 0.5 (1/2), 1 (3/3), and 0.67 (4/6), respectively. If A moves to B, the productivity will increase from 0.5 to 1. This is a case of an increasing return of scale, IRS. Similarly, if B moves to C, the productivity will decrease, from 1 to 0.67. This is the case of a decreasing return to scale, DRS. The return to scale is used as an assistant measure to clarify and interpret the efficiency of an entity.
2.2. Selection of Input and Output Variables
The DEA method needs input and output variables. This section explains the selection process of these variables. The scope of our study is limited to developing a strategy to enhance patent applications; that is, to increase the number of patent applications filed by industry. Thus, the number of patent applications was selected as the output variable. The input variables of DEA were selected based on a literature review. For this, we reviewed papers discussing reasons for patent applications, determinants of patent applications, or “patent production functions”. However, there were few data available, so selecting a good candidate input variable may be problematic. Thus, the variables available at the industry level were selected as input variables.
The patent system provides a set of exclusive rights to the assignee or inventor for a limited time in exchange for public disclosure of the invention [
17,
25]. Therefore, the system has the conflicting function of exclusion and diffusion of knowledge [
26]. There are various reasons why an inventor or assignee applies for a patent under the above-mentioned patent system. Exclusive right is not the sole reason; reasons can also include the following: (1) technical monopoly; (2) intangible property, gaining of property about technology; (3) set-up or boosting of technological development; (4) resolution of a patent dispute; (5) return on investment; (6) expectation of government assistance; (7) method of sales or contracts; and (8) commercialization of technology. Grimaldi et al. described the strategic positioning of a patent in four ways: competitive, business, defensive, and not essential [
27]. Some studies have investigated the determinants of patent applications [
28,
29]. Pakes and Griliches developed an equation for patent production activities where the independent variables were R&D investment, time, and the difference between research productivity and tendency to patent among firms; the dependent variable was patent production [
28].
Jeong [
29] used a modification of the Pakes–Griliches model. Specifically, the determinants of Korean patent applications at the firm level were examined. The R&D investments, sales as the surrogate variable of the firm’s size, depreciable assets divided by the number of employees as the surrogate variable of capital intensity, a changing patent system, and the highest three-firm concentration ratio (CR3) for the market structure were examined. Sales was the most influencing variable for patent applications; R&D investment, capital intensity, and changes to the patent system were also significant variables, while CR3 was not an explanatory variable for patent applications [
29]. Meanwhile, in economics, CRk, which means the market share of the
k largest firms, is frequently used to measure market intensity. Statistics Korea uses CR3 in its published index [
30].
Park and Sung estimated the science and technology knowledge production function using a principal components regression model and solved the multicollinearity among multiple variables [
31]. Their study started from the following hypothesis: “Three independent variables: the patent stock, R&D stock, and number of researchers, have a positive effect on patent production”. They argued that most of the technological innovation of the present year was the result of accumulated knowledge and experience. Therefore, they argued, knowledge or the capability for technological innovation of a country, industry, or firm can be expressed by the entity’s stock of knowledge and experience. They used a cumulative sum function from time series data of paper, patent, and R&D investments for paper stock, patent stock, and R&D stock, respectively. They concluded that “the principal components regression model was useful to estimate the effect of highly correlative production factors and showed that the number of researchers, R&D stock, paper or patent stock all had positive effects on the production of papers or patents”.
Meanwhile, Acemoglu and Linn developed a simple relationship between innovation and potential market size [
32]. They argued that “a key determinant of innovation is the potential market size of users”. Especially, they gave the following concrete example: “A 1 percent increase in the potential market size for a drug category leads to approximately 4 to 7.5 percent growth in the entry of new drugs approved by the Food and Drug Administration”. They, however, explained that their result might be non-representative “especially because the pharmaceutical industry may be more research-oriented than other industries”. Kortum investigated the decline of the patent-to-R&D ratio over the past three decades until the late 1980s [
33]. He concluded that the reasons for the decline were as follows: (1) decreased technological opportunities; (2) increased economic value of inventions due to growth in the size of markets; and (3) increased cost of dealing with the patent system.
We found from a literature review that there were many variables that could affect patent production, and that the variables could be cross-related. Therefore, we needed to consider diverse variables affecting patent production. We particularly focused on Jeong’s [
29] and Acemoglu and Linn’s results [
32]. Jeong found that the most influencing variable for patent applications was the surrogate variable of the firm’s size. Acemoglu and Linn found that the potential market size was a key determinant of innovation. Moreover, as we noted earlier, most of the reasons for patent applications are attributable to business opportunities, where the market size could be used as a surrogate variable. Consequently, variables related to size and market size were adopted as important input variables in our analysis. Especially for the analysis by industry, our study adopted the number of businesses, employees, researchers, and research institutions as size variables. This is because we agree with Jeong’s result that the size variable is the most important variable influencing patent applications. R&D investment was also adopted as an input variable because most of the researchers in our review study consider it to be an important variable in patent production. However, we excluded some variables that have previously been reported as positively correlated with patent production, for various reasons. For example, research productivity is defined by the ratio of patents to R&D investment; here, the numerator and the denominator in the definition were already adopted as output and input variables, respectively. Thus, it was excluded to avoid duplication of variables. Capital intensity and sales are used as important variables in firm-level analyses, but we decided they were not suitable for industry level analyses. In particular, sales is less appropriate than market size as a surrogate variable for economic activity in our analyses. More details are provided in
Section 3.1. Patent stock is secondary data and impossible to obtain as “official” data. To summarize, we adopted six input variables: market size, R&D investment, and the numbers of businesses, employees, researchers, and research institutions.
3. Data: Research & Business Development Infrastructure in South Korea
3.1. Domestic Market Size: Surrogate Variable for Economic Activity
In our study, market size and the number of patent applications were the most important variables. We considered the number of patent applications relative to the market size as a function of industry in South Korea. Gross domestic product (GDP) or the total sales by an industry are also frequently used to measure economic activity. Therefore, we briefly examined the relationship between market size and the other two variables and why the market size variable was preferred in this study.
Figure 2 reveals a relationship among the three variables but a clear definition of the variables is not evident. The total sales target refers to domestic companies; total sales are composed of domestic sales, exports, and import-and-domestic sales by these companies. GDP is the monetary value of all final goods and services produced within a country’s borders over a specific period (yearly or quarterly). It is not a complete measure of economic activity because it only accounts for the final output, with the exception of transactions in the intermediate stages of production. Broadly, GDP is composed of domestic sales, exports, and stock. Domestic market size is the total size of the consumption market and is composed of import and domestic sales.
Three different statistics are published by South Korean organizations related to the total sales of different industries. The first is the economic census conducted every five years by Statistics Korea; the target of the census is all companies (about 3,300,000 of them) [
30]. The second is the business activity survey performed annually by Statistics Korea [
30]; the target of the survey is about 13,000 companies, each having more than 50 employees and a gross capital of over 300,000,000 won (about $300,000 USD (dollars)). The last is the national tax statistics published by the National Tax Service [
34]; this statistic does not disclose the total sales by detailed industry classification. GDP statistics can also be found in the economic statistics system of the Bank of Korea [
35]. The targets of this variable are all of the economic entities such as households, companies, and governments that are engaged in economic activities. The domestic market size statistics for South Korea can be found in the inter-industry table published by the Bank of Korea, which targets all South Korean companies [
30]. We have estimated the domestic market size of South Korea using Equation (4) proposed by the Korean Institute for Industrial Economics & Trade [
36].
The exclusive rights, given by the Intellectual Property Office of a nation to the assignee of the invention, are restricted to the nation. Therefore, the business opportunities leading from patent applications granted by the Korean Intellectual Property Office are also limited by the market size of South Korea. Anyone who has an interest in the Korean market can seek a patent application from the Korean Intellectual Property Office. According to the official announcement, there were 204,589 patent applications issued in South Korea in 2013. Among them, the number of applications by foreigners and South Koreans were 44,611 (22%) and 159,978 (78%), respectively [
37]. The market of one nation is also shared by all players who have an interest in the market. For example, foreign car exporters such as BMW, Ford, General Motors Group, and Volkswagen sell their cars in the South Korean car market.
Summarizing, anyone can apply for a patent at the local patent office but the exclusive rights of a patent are limited to and valid in the specific nation where the patent is applied for and obtained. The domestic market size variable meets the characteristics of the patent system. The GDP statistic does not reflect the entire economic activity but it also satisfies the two conditions. The total sales variable produced by the government does not meet either of the two conditions. Consequently, we argue, the domestic market size variable is more appropriate than the other two variables for our study to compare the number of patent applications as a function of industry in South Korea.
3.2. Statistics of R&BD Infrastructure by Industry
We were interested in comparing the R&BD infrastructure as a function of industry in South Korea for the purpose of verifying what industry sector produced many patents considering its own input factors. We required the R&BD infrastructure statistics to identify appropriate strategies for strengthening the patent output of South Korean industries. Therefore, we examined many statistics variables related to the R&BD infrastructure and segmented them according to the Korean Standard Industrial Classification [
38]. Many variables related to the determinant factors of a patent application, discussed in the Introduction section of this paper, were not used in our study because they could not be categorized in accordance with the Korean Standard Industrial Classification, which is the unit of our analysis. In the same manner, it was difficult to gather R&BD infrastructure data according to the detailed classification.
Table 1 shows the classification codes and their explanations used in our study; it covers all of the industries classified by the Korean Standard Industrial Classification. The manufacturing industry is important to the South Korean economy; it produced about 87% of all of the patent applications in 2013 [
37]. Therefore, we gathered and analyzed the statistics of the manufacturing industry in greater detail. There are 44 targeted classifications listed in
Table 1, among which 33 codes fall within the manufacturing industry.
Table 2 provides the statistics concerning R&BD infrastructure as a function of South Korean industry for 2013. The data of
Table 2 was obtained from various government offices. The statistics of the number of businesses and number of employees are published in the Census on Establishments of Statistics Korea [
30]. The statistics concerning R&D investment, number of full-time equivalent researchers, and the number of research institutions can be obtained from the National Science & Technology Information Service (NTIS) operated by the Ministry of Science, ICT and Future Planning [
2]. The statistics of domestic market size can be calculated from the input–output table base price of the inter-industry relation table published by the Bank of Korea [
30]. Lastly, statistics on the number of patent applications can be obtained from the Korean Intellectual Property Office [
37].
Table 2 can be used to establish what R&BD resource is concentrated in which industry. For example, the number of businesses had the largest value (960,388/3,676,876 = 26.1%) in the industry of “Wholesale and Retail Trade” (G). In the same way, the number of employees and the domestic market size showed the largest value in the same industry category. R&D investment, the number of FTE-R and the number of patent applications were greatest in the industry of “Manufacture of Electronic Components, Computer, Radio, Television and Communication Equipment and Apparatuses” (C26). Lastly, the number of research institutions showed the largest value in the industry of “Manufacture of Other Machinery and Equipment” (C29).
4. Relationship between Patent Applications and R&BD Infrastructure
In this section, we distinguish strong patent industries from weak ones by comparing two ratios: the patent applications ratio and the domestic market size ratio. In addition to the domestic market size, the other R&BD infrastructure variables are also worthwhile to compare with patent applications. We adopted a simple method to compare the patent applications variable with other R&BD infrastructure variables by industry (Equation (5)). The term “Relative intensity of patent applications compared to R&BD infrastructure” was developed because it represents how intensively patent applications are concentrated within each industry for the various R&BD infrastructure values.
Table 3 lists the relative intensities of patent applications measured by Equation (5). It is sorted by the last column (domestic market size), which was an important variable in our study. The relative intensity of patent applications compared to the domestic market size can be described by Equation (6):
We classified all of the industries into three categories according to their relative intensity value shown in the last column (domestic market size) of
Table 3, which was calculated using Equation (6). The first category is the “strong-patent industry”, which has a relative intensity value exceeding unity. The first two industries of this category were “Manufacture of Medical, Precision and Optical Instruments, Watches and Clocks” (C27) and “Manufacture of Pharmaceuticals, Medicinal Chemicals and Botanical Products” (C21). The second category is the “weak-patent industry” which shows a relative intensity value below unity. The two sample industries of this category having the smallest relative intensities were “Mining and Quarrying” (B) and “Manufacture of Coke, Hard-coal and Lignite Fuel Briquettes and Refined Petroleum Products” (C19). The last category is the “no-patent industry”, which does not produce patent applications. The industries of this category can be easily identified in
Table 2 and
Table 4. The ratio of the domestic market size for the three categories was calculated and is summarized in
Table 4. The analysis showed that the strong-, weak-, and no-patent industries divided the Korean domestic market size by 29.3%, 33.0%, and 37.7%, respectively.
Meanwhile, using the ratio of the number of businesses or employees, the relative intensity of patent applications had the largest value in “Manufacture of Pharmaceuticals, Medicinal Chemicals, and Botanical Products” (C21). Next, using the ratio of R&D investment or number of R-FTE, the highest relative intensity was found for “Agriculture, Forestry, and Fishing” (A). Lastly, using the ratio of the number of research institutions, “Manufacture of Tobacco Products” (C12) was the most important.
5. DEA Analysis
5.1. Summary of the DEA Analysis
The input variables of the DEA analysis in our study were the six R&BD infrastructure variables listed in
Table 2; the output variable was the number of patent applications, and the decision making unit was 30 industries categorized by the Korean Standard Industrial Classification code. DEA analysis was performed using DEAP freeware for envelopment analysis [
39]; the results are summarized in
Table 5. The three types of calculated efficiencies, and their meanings, are as follows: CRS TE for technical efficiency from the CRS DEA, VRS TE for technical efficiency from the VRS DEA, and SE for scale efficiency. On average, the pure technical efficiency of industries was 0.670, which meant that a better reorganization of the industries could reduce input resources by 33.0%. In other words, the Korean economy needs to be significantly reorganized for strong-patent industries. Similarly, there is the possibility of reducing input resources from the viewpoint of scale. If an industry shows a pattern of DRS, then it faces decreasing returns to scale. On the contrary, if an industry shows a pattern of IRS, then it faces increasing returns to scale. The cause of inefficiency was determined as follows:
If the cause of inefficiency of an industry is scale, then the industry should improve its efficiency by adjusting scale. If the cause of inefficiency is pure technology, then the industry should improve its efficiency solely by adjusting technical factors. Best practices or peers in which the VRS TE is equal to unity build up the efficiency frontiers.
Table 5 identifies 13 efficient industries. The other industries (i.e., DMUs) have room for further improvement in terms of efficiency.
5.2. Strategies for Improving Efficiency
DEAP software can identify the efficiency point or “projected value” for an industry. For an industry to be efficient, the input resources of the industry should be changed to the efficiency frontier, where the projected value is located. There are two types of change: “radial movement” and “slack movement”. The former refers to “the movement an inefficient DMU has to take in order to be located on the frontier” [
20]. Slack movement represents “the additional movement a DMU located on a segment of the frontier running parallel to the axis has to take in order to become efficient” [
20]. The projected value or target value considers both movements. We can develop a strategy for an industry to be efficient using the projected value and the original values of the input resources. The input resources should be reduced by the difference between the projected value and the original one by each input resource. The ratio of reduction is represented in Equation (7).
Table 6 lists the reduction ratio, or inefficiency, for each input resource. For example, “Manufacture of Food Products” (C10) had a very low technical efficiency of 0.289. For it to become more efficient in terms of patent applications, it should reduce the number of businesses, number of employees, R&D investment, number of R-FTE, number of research institutions, and domestic market size by 88.6%, 75.7%, 71.1%, 75.4%, 71.1%, and 71.1%, respectively. Meanwhile, under the input orientation, the input resources should always be changed or reduced for a DMU to become efficient. This method does not indicate the required amount of increase of the input resources, which is a key limitation of the method. Therefore, it is commonly used when there is a lack of resources.
An industry should first identify the best practices, benchmarks or peers to improve its efficiency. Peers are indicated as benchmarks in the DEAP software, and the peer weights are called “lambda weights”.
Table 7 lists the peers and their peer weights according to industry code. For instance, to improve its efficiency, the “Manufacture of Food Products” (C10) industry should look to a “virtual” industry comprising “Manufacture of Pharmaceuticals, Medicinal Chemicals, and Botanical Products” (C21), “Agriculture, Forestry, and Fishing” (A), “Manufacture of Medical, Precision and Optical Instruments, Watches and Clocks” (C27) and “Sewerage, Waste Management, Materials Recovery, and Remediation Activities” (E) with peer weights of 2.7%, 21.3%, 7.2% and 68.7%, respectively. However, because the virtual industry does not exist in reality, the focus necessarily falls to the peer with the highest peer weight. For the example of “Manufacture of Food Products” (C10), the “Sewerage, Waste Management, Materials Recovery, and Remediation Activities” (E) industry had the highest peer weight and therefore should be intensively analyzed.
Meanwhile, “Sewerage, Waste Management, Materials Recovery, and Remediation Activities” (E) is listed 12 times as a peer and so achieved the first rank as a benchmark. The “Manufacture of Tobacco Products” (C12) and “Manufacture of Medical, Precision and Optical Instruments, Watches and Clocks” (C27) industries are each listed 11 times as a peer.
6. Discussion
Our literature review established that the determinants of patent applications are diverse, complicated, and mutually correlated. Our study did not consider which variables were more determinate than the others. However, we started from the assumption that the business opportunity or domestic market size of a country can be one of the main determinants for patent applications. Then, considering the domestic market size of each industry, we ranked the industries according to their numbers of patent applications.
The industry with the most patent applications was the “Manufacture of Electronic Components, Computer, Radio, Television and Communication Equipment and Apparatuses” (C26), which achieved the first rank in R&D investment and number of R-FTE while taking the fourth rank in the domestic market size among 30 industries, except for the no-patent ones. The above simple fact tells us that patent applications are important in the R&D-intensive industries and that the domestic market size is not the most deterministic factor for patent applications. Nevertheless, we argue that it is important to compare patent applications with domestic market size because a patent does essentially have business opportunities in mind. Our study classified all of the industries into the three categories of strong-, weak-, and no-patent industries. Notably, the representative strong-patent industry includes the pharmaceutical or medical one. It implies that those industries are R&D-intensive, while their domestic market sizes are smaller than other examples of well-developed industries in South Korea.
Meanwhile, this study aimed to identify some patent-strengthening strategies for inefficient industries using the DEA method. In
Table 4, strong-, weak-, and no-patent industries were categorized based on the relative intensities of patent applications compared to domestic market sizes. However, it is difficult to state that the domestic market size is the most dominant variable for patent applications. As mentioned earlier in this paper, what variable is dominant to patent applications is not at the center of our attention, but rather what strategies can be devised to enhance the number of patent applications. Therefore, it is more realistic to establish some strategies to enhance patent applications using diverse variables that affect patent applications. The DEA method proposes that an inefficient entity, industries in our study, can be made efficient via benchmarking the frontiers or peers that have efficiency scores of 100%. Our DEA discovered 13 peers, eight of which were used as benchmarks. Three of the eight industries belonged to the weak-patent sector, while five belonged to the strong-patent industry. Let us examine why those three industries belonged to the weak-patent industry, leaving the other five industries aside because it is reasonable for them to have belonged to the strong-patent industry. The three industries were as follows: (1) “Manufacture of Tobacco Products” (C12); (2) “Agriculture, Forestry, and Fishing” (A); and (3) “Manufacture of Wood Products of Wood and Cork; Except Furniture” (C16). We identified that the relative intensities of the “Manufacture of Tobacco Products” (C12) industry compared to the number of businesses and research institutions were number two and number one among the 30 industries, respectively. Likewise, R&D investment and number of R-FTEs ranked the highest for the “Agriculture, Forestry, and Fishing” (A) industry. Lastly, the “Manufacture of Wood Products of Wood and Cork; Except Furniture” (C16) industry ranked fourth in relative intensity compared with R&D investment. However, when normalized against the domestic market sizes of the three industries, the relative intensities were located within the upper ranks of the weak-patent industries.
Strategies developed through DEA can be helpful in adjusting the R&BD infrastructure to change a weak-patent industry into a strong one. However, this analytical method has an input orientation, which leads to a focus on decreasing input resources. Input-oriented DEA is popular with a government sector facing a lack of economic resources. However, it is a weakness from the viewpoint of research methodology. Our study considered only the data produced within the year 2013 and was composed of statistical variables available through the Korean Standard Industrial Classification. Furthermore, some of the weak-patent industries, we surmise, do not need to have strong relationships with patent applications, i.e., a company belonging to the weak-patent industry may have no difficulty in doing business without a patent. Therefore, it is impractical to generalize and apply our results to all cases. In conclusion, we believe that our study will be helpful to those industries where protection by patents is an important aspect of their businesses. By the way, a pilot analysis with different data [
40] and the main results [
41] of this paper were previously reported.
7. Conclusions
This paper introduces a practical framework to support academics and practitioners. For academics, the concept of the relative intensity of patent applications can be helpful in measuring technology innovation. We exemplified the classification of Korean industries into three categories, strong-, weak-, and no-patent industries, using the relative intensity of patent applications. Moreover, we emphasize that patents, according to the nature of the patent system, are essentially more associated with domestic market size rather than sales or GDP. For practitioners, this paper offers a benchmarking method to increase industry output, especially in terms of patent applications, at the industry level. This framework can be helpful especially to policy practitioners facing a lack of economic resources and difficulty in the distribution of resources.
The DEA results also provide some policy implications. In manufacturing, there is no no-patent industry. Thus, it seems patents are an important factor in all manufacturing industries. Nevertheless, there are some industries having very low technological efficiency, below 0.3, among manufacturing. The seven industries we identified are “Manufacture of Food Products” (C10), “Manufacture of Textiles, Except Apparel” (C13), “Manufacture of Wearing Apparel, Clothing Accessories, and Fur Articles” (C14), “Manufacture of Coke, Hard-coal, and Lignite Fuel Briquettes, and Refined Petroleum Products” (C19), “Manufacture of Basic Metal Products” (C24), “Manufacture of Fabricated Metal Products, Except Machinery and Furniture” (C25), and “Manufacture of Motor Vehicles, Trailers, and Semitrailers” (C30). We suggest that these industries need active patent-enhancing strategies and this paper will be helpful in that regard.


 ,
, 


