Article

A Self-Evaluation System of Quality Planning for Tourist Attractions in Taiwan: An Integrated AHP-Delphi Approach from Career Professionals

1
Department of Civil Engineering, National Chiao Tung University, 1001 University Road, Hsinchu 300, Taiwan
2
School of Management and Enterprise, University of Southern Queensland, Toowoomba, QLD 4350, Australia
3
Graduate Institute of Environmental Education, National Taiwan Normal University, Taipei 116, Taiwan
*
Author to whom correspondence should be addressed.
Sustainability 2017, 9(10), 1751; https://0-doi-org.brum.beds.ac.uk/10.3390/su9101751
Submission received: 28 July 2017 / Revised: 19 September 2017 / Accepted: 25 September 2017 / Published: 28 September 2017
(This article belongs to the Special Issue Tourism Planning and Sustainable Development)

Abstract

:
This study seeks to identify a set of key indicators along with weightings for tourist attractions in Taiwan, and develop a quality management self-evaluation mechanism for tourism businesses, using an advanced integrated Analytic Hierarchy Process and Delphi (AHP-Delphi) approach derived from the supply side perspective. This research study comprises two phases: (1) Delphi method analysis that involves 17 experts, providing confirmation about the evaluation criteria; and (2) Analytical Hierarchical Process (AHP) method which aims to allocate weightings to the evaluation criteria from the experts. Findings from the Delphi method analysis revealed the acceptance of two dimensions, six sub-dimensions and 17 indicators as key evaluation criteria. The AHP method analysis indicated that the most significant dimension was managing quality, with tourism services and public sector facilities being the most important sub-dimension and indicator respectively. The self-evaluation mechanism proposed in this planning perspectives can assist tourism businesses and national/regional Destination Management Organization to identify quality management problems and possible ways of enhancing quality tourism, so that tourism experience, and tourist’s satisfaction can be further improved effectively between the conflicting views by career professionals.

1. Introduction

The tourism industry has evolved and modernized considerably over the years but at the same time has also become highly competitive due to the effects of globalization. With the rapid growth and increasing competition in the global tourism industry, tourism businesses are exploring ways to enhance their competitive advantage. As a result, many tourism businesses have recognized the provision of quality tourism as one of the key sources of competitive advantage that can enable them to maintain a competitive, and sustainable position in the industry. Quality tourism has emerged as an increasingly important competitive component that has been influenced by three key factors: (1) highly intense competition in the tourism industry at both national and international levels [1,2]; (2) expanded consumerism on quality issues in the tourism sector [3,4]; and (3) increasingly sophisticated tourism markets that have moved from price conscious to quality focus [5,6].
Although quality tourism has been a key agenda for various public and private organizations, the ongoing number of dissatisfied tourists suggests that quality improvement in tourism needs further attention. This leads to the importance of understanding current quality problems and possible ways of quality enhancement in tourism. Empirical studies in recent years have analyzed quality by assessing the level of customer satisfaction in various tourism sub-sectors, such as airlines [7,8], hotels [9,10], travel agencies [11,12], restaurants [13,14], and tourist destinations [15,16]. Other studies have also analyzed quality enhancement by assessing the implementation of total quality management (TQM) in service organizations [17,18], education sector [19,20], healthcare environment [21,22], and manufacturing industry [23,24]. However, there are limited studies that identified key indicators along with weightings that can be used by tourism businesses to self-evaluate and measure the level of quality tourism they provide.
Despite the ongoing global financial and economic crisis, the tourism industry worldwide has continued to grow throughout 2012 with a total of 6.8 billion trips taken place, which accounted for an increase of approximately 2.5% from previous year, and this trend is expected to continue to grow by 2–3% in 2013 [25]. The Asia Pacific region has proven to be popular amongst tourists and this was supported by a strong growth of a 7% increase (i.e., 15 million more international tourist) in arrivals to this region in 2012 [26]. While there are different reasons (e.g., business, visiting friends and relatives) for traveling, majority (52%) of the international tourist arrivals in 2012 was for the purpose of leisure, recreation, and holidays [26]. This gives rise to the importance of tourist attractions, which plays a significant role in catering the fundamentals towards this specific travel purpose. Tourist attractions represent a complex element within the tourism industry and are the catalytic focus for the development of tourism infrastructures and services, and products of a destination [27,28,29]. Tourist attractions are also often regarded as the primary driver for the tourism system in which they can stimulate interest in travel to a destination and improve visitor satisfaction, and therefore play an important role in influencing a tourist’s choice of travel products and destinations [30].
This phenomenon is important to Taiwan as the country attempts to make tourism development a major policy with initiatives to explore tourism as an emerging new export market [31]. In fact, tourism has been identified by the government as one of the few industries targeted for development assistance and promotional campaigns were launched to stimulate the development of international tourism and also to enhance the quality of domestic tourism facilities and attractions [32]. Their efforts have been relatively successful with the number of visiting international tourists increased by about 20% in 2012 [26]. Accordingly, over 7.3 million international tourists visited Taiwan in 2012, of which 64% (i.e., 4.7 million) were for the purpose of leisure, recreation, and holidays [33]. This increasing number of international tourists had also resulted in a contribution of approximately US$11.7 billion to the economy [26]. In order to capitalize this important growing trend, the Tourism Bureau has initiated the publishing of information materials that will enhance the ease and enjoyment of international tourists, and at the same time encouraging tourism businesses to ensure their provision of quality tourism [32].
Therefore, the key purpose of this study is to identify a set of key indicators along with weightings for tourist attractions in Taiwan that can be used by tourism businesses for quality self-evaluation. This is important to tourism businesses to identify and solve quality problems, and possible ways of quality enhancement in tourism. Through this, a regular and systematic analysis of the evaluation results can assist tourism businesses, and national/regional Destination Management Organization (DMO) to gain a better understanding of the gaps between the quality tourism provided, and the perceived quality by the tourists/consumers. Furthermore, the quality self-evaluation can also contribute towards the overall strategic planning process by identifying improvement in activities and enhance competitiveness in quality management with the help of benchmarking, so that tourism experience, and tourist’s satisfaction can be further improved [34,35,36].
This paper begins by reviewing the literature relevant to the research issue and then discusses the methodology including the data collection techniques used in researching this issue. Next, the analysis of data is described and then the findings presented. These will be followed by the conclusions drawn from the research together with the implications, and suggestions for future research.

2. Literature Review

2.1. Quality Management

According to the International Organization for Standardization (ISO), quality management involves any activities related to the overall management function that contribute to the determination of quality policies, objectives, responsibilities, and implementation through appropriate planning, control, assurance, and improvement within the quality system [37]. The fundamentals of quality management are to seek continuous improvements through evolving activities, and tasks that are implemented to achieve quality enhancement [38,39]. It is also imperative that an evaluation process is put in place, to assess the delivery of the quality standards, and as a quality assurance mechanism [40].
Although there are many national and international standards set out to standardized management systems that aim to systematize various business functions, the quality management standards (e.g., ISO 9001:2015, ISO 9004:2009, ISO 19011:2011) issued by the International Organization for Standardization (2016) are widely practiced and accepted in various industries, including the tourism sector [41]. Quality management has become a major interest for businesses to remain competitive in the global environment, and the establishment of a quality framework is therefore essential to enhance the quality of service production and delivery that meet customers’ needs and expectations. In the tourism industry, this is evident through the emphasis to match tourist experiences and needs with destination features, and private sector and public sector quality management practices [42,43].
Quality assurance is an important part of the quality management system whereby businesses are confident that their planned and systematic activities directed towards the provision of quality products and services will meet consumers’ requirements and expectations. Quality assurance is dependent on two key aspects: (1) the design of products and services; and (2) the control of quality during the execution of product and service delivery which is often supported by some form of measurement, inspection and evaluation activities [44,45]. Within the tourism sector, tourism businesses are often aware of the importance to design products and services that cater to the needs and wants of the tourists/consumers, but the literature revealed limited understanding on the forms of measurement, inspection, and evaluation activities that are put in place to help ensure quality standards being met. A regular and systematic quality self-evaluation is critical for tourism businesses to identify improvement in activities that can provide them with ongoing competitiveness, and sustainability. This calls for a better understanding of the quality self-evaluation mechanism that can be used to assess, and determine the gaps between the quality tourism provided, and the perceived quality by the tourists/consumers.

2.2. Tourism and Tourist Attractions

Tourism can be defined as a social, cultural and economic phenomenon which involves people moving to countries or places outside their usual environment for the purpose of conducting personal or business/professional activities [46]. On the other hand, tourist attractions are a collection of many different places of interest in which travelers intend to visit and are often central to the decision to take the trip [27,46]. Tourist attractions also play a critical role in the development of tourist destinations, and operate on a much broader level such as agents of change, foci for social and cultural exchange, generators of income, and employment [27]. While the classification of tourist attractions is diverse, they can generally be categorized into the following: (1) natural attractions where tourists can enjoy the nature, getting relief from both physical and psychological pressure, and being inspired by beautiful scenery [47,48]; (2) cultural attractions such as archaeological sites, museums, and galleries that enable tourists to learn more about a different culture and civilization [49,50,51]; (3) recreational attractions that offer tourists recreational activities (e.g., farm stay, skiing, cycling) [52,53]; (4) events such as religious events, business exhibitions [54,55]; and (5) entertainment attractions such as theme parks, shopping facilities, and casino [56,57,58].
The significance of tourist attractions to the development of tourist destinations, and the tourism industry as a whole has seen several studies investigated the different themes of tourist attractions, such as classifications of tourist attractions [59,60], human resource aspects of attractions [61,62], components that comprise an attraction [63,64], and managing visitors, exploring visitor characteristics, perceptions, and reactions to components of attractions [65,66,67]. Although studies [68,69] had been conducted on evaluating tourist attractions in general, and mainly from a tourist’s perspective, however, very few studies have been carried out from the supply side to identify the key indicators along with weightings that focus on quality management for the purpose of self-evaluation by tourism businesses on the level of quality tourism they provide in the area of tourist attractions, which is the key focus of this study.
While there is no one single agreed set of evaluation criteria for quality management in terms of tourist attractions, but they can generally be classified into the following two major dimensions: (1) managing quality; and (2) service quality. Each of these dimensions, and the relevant components within the dimensions, will be addressed in turn.

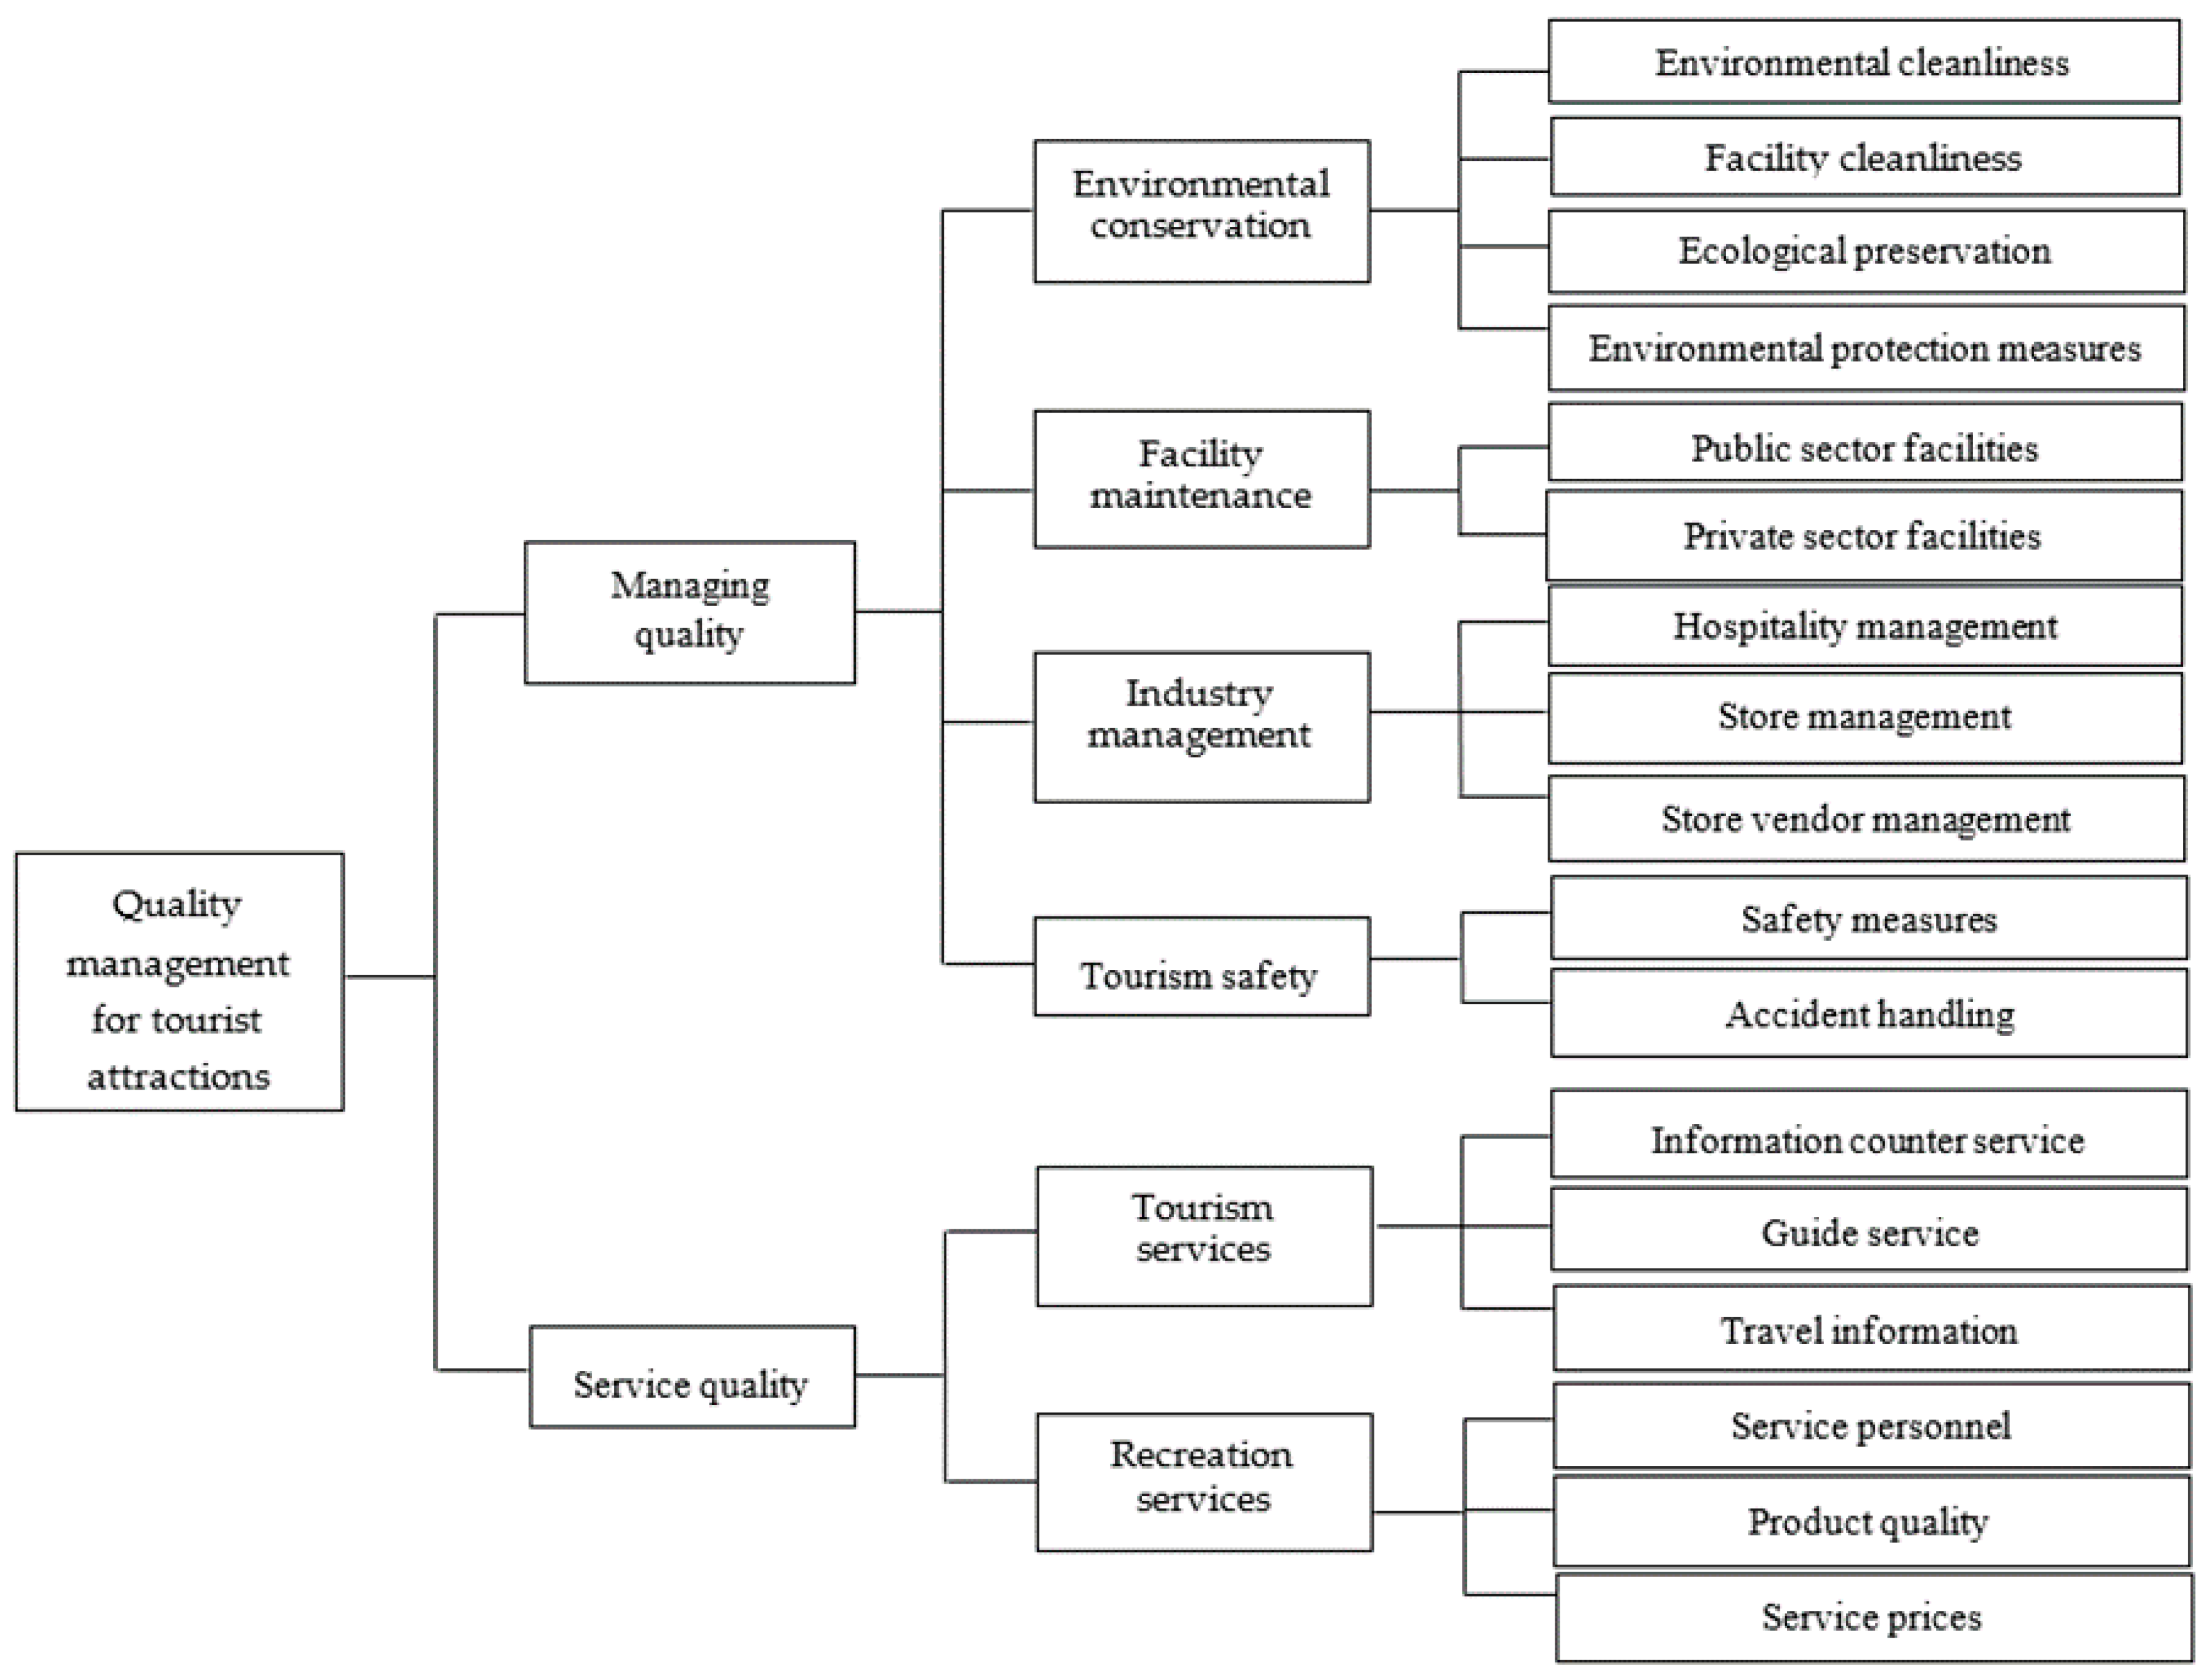
2.3. Managing Quality

The first dimension that has an impact on the quality management of tourist attractions is managing quality. The managing of the environment, facilities, and safety quality standards at the tourist attractions plays an important role in developing a competitive, and sustainable tourism industry. There were extensive studies conducted on managing quality in the tourism sector in various areas such as tourist destination management [70,71], transportation [72,73], environmental quality [74,75], management structure [76,77], and tourism development [78,79]. The literature revealed four key sub-dimensions in managing quality that can influence the quality of tourist attractions, which include: (1) environmental conservation; (2) facility maintenance; (3) industry management; and (4) tourism safety. Environmental conservation refers to the overall environmental and resource maintenance management at the tourist attractions, which involves environmental cleanliness, facility cleanliness, ecological preservation, and environmental protection measures. For example, Bauer and Chan [80] indicate that noise levels in the streets, the cleanliness of streets, air quality, and other environmental conditions are of concern to visitors towards their impressions on quality tourist attractions. In another study by Hu and Wall [81], the findings suggest that the competitiveness of tourist attractions can be enhanced through sound environmental management practices. Facility maintenance involves the ongoing operation, and maintenance of both public and private owned hardware and software facilities at the tourist attractions. For example, a study by Fallon and Kriwoken [82] reveal that the construction of new facilities and their ongoing maintenance are regarded as crucial to supporting sustainable visitor attractions. The findings from Butler’s study [83] also argues that the provision of adequate facilities will help increase the number of visitors and their awareness to the tourist attractions. Industry management refers to the management of tourism related industries at the tourist attractions such as hospitality (e.g., restaurants and hotels), store, and vendor management. For example, the findings of a study by Sparks, Bowen and Klag [84] reveal support for restaurants as an important attribute of a tourist destination. In line with this, Williams [85] indicates the importance of innovative experience design that seeks to go beyond service excellence, and leading to the creation of value in the tourism sector. Tourism safety encompasses the various protection measures adopted by the managing unit at the tourist attractions to ensure the safety of tourists, which include indicators such as safety measures and accident handling [86,87]. For example, Cavlek [86] argues that individual tourists’ decision to visit a country or tourist attraction can be significantly influenced by safety and security risks. Another study by Yüksel and Yüksel [87] also indicate that the perceived and/or actual safety risks at the tourist attractions can have a major effect on their decisions to visit. The importance of tourism safety is increasingly evident with the recent terrorist attacks at tourism destinations such as the one happened at Barcelona’s La Ramblas in 2017.

2.4. Service Quality

The second dimension, service quality, is considered to have an effect on the quality management of tourist attractions as it can determine the level of satisfaction that the tourists will have on their visit. In this dimension, it generally looks at a variety of tourism related services, and their quality standards provided by both public and private owned entities at the tourist attractions. Literature reviewed has indicated broad investigation into different themes of service quality in the tourism industry and they include: tourist satisfaction [88,89], human resources [90,91], destination competitiveness [92,93], organizational and financial performance [94,95], and measurement [96,97]. Accordingly, service quality can be evaluated through two broad sub-dimensions: (1) tourism services; and (2) recreation services. Tourism services refer to the various travel related information and enquiry services provided by the relevant managing unit at the tourist attractions, and these services include: information counter service, guide service, and travel information. For example, Watson et al. [98] reveal that a more cohesive and integrated approach towards the provision of travel information and services should enhance the tourist’s experience when planning, touring, and reminiscing tourist attractions. On the other hand, recreation services are facilities and services provided by commercial businesses at the tourist attractions, and can be evaluated with factors such as service personnel, product quality, and service prices. For example, the findings from a study by Tian-Cole and Cromption [99] suggest that the relationship between visitor satisfaction and service quality is evident and the central components are recognition of the distinction between quality of performance and quality of experience.
These prior studies have generally identified and investigated the key dimensions in managing quality, and service quality that can affect the quality of tourist attractions, but lack specific weightings on the dimensions, and the evaluating indicators that enable measurable outcomes. Furthermore, these previous studies focused mainly on the tourist perspective, and very little is known from a provider/tourism business viewpoint. Therefore, this study seeks to address the identified gaps in the extant literature by exploring the key dimensions, sub-dimensions, and indicators with specific weightings of importance, in which tourism businesses can use to self-evaluate their level of quality product/service provided to the tourists. This will also provide further insights to the scare understanding of quality tourist attractions in the provider/tourism business context, and seek to offer evidences to complement previous studies [65,68] conducted from the tourist perspective that may unveil any discrepancies between the perceived (from tourism businesses) and actual (from tourists) quality product/service provided.

3. Methods

This study was conducted in two stages: Delphi method (Stage 1), and Analytic Hierarchy Process (AHP) method (Stage 2). The key purpose of Stage 1 was to establish an evaluation system using the Delphi method, while the use of the AHP method in Stage 2 was to determine the level of importance on the weightings for the evaluation items. The research method adopted in this study was the use of the advanced innovative AHP-Delphi approaches that select representative experts from academics, professionals, and decision makers in both the public and private sectors [100]. This study aimed to develop a primarily evaluation system for quality management in tourist attractions that includes the different aspects of evaluation criteria, sub-dimensions of each aspect, and indicators of each element through extant literature reviews and studies [101]. The self-evaluation system for quality management in tourist attractions was first investigated with the Delphi method where questionnaire survey was sent to 17 experts and professionals, to determine their level of agreement and acceptance on the various evaluation criteria as proposed in the system. These experts and professionals were then required to allocate weighting to each aspect, element, and indicator as proposed in the self-evaluation system using the AHP approach, in order to ascertain the level of importance of these evaluation criteria [102,103].
This study had sought participation from 17 experts, including government officials, academics in related fields, and professional tourism managers who have expertise in a range of different fields. Table 1 briefly outlined the profiles of these 17 experts. The duration to complete the various questionnaire surveys was approximately three months.

3.1. Delphi Method

This study has adopted the Delphi method, which uses experts-level analysis beyond partial errors on criteria selection [104,105]. The main purpose of the Delphi method was to obtain reliable, and consistent opinions from experts without bias. According to the Delphi method analysis process, the first step was to form an expert group of between 10 and 15 people, to carry out the studies on a specific question [106]. The viewpoints gathered from experts in different fields will enable a greater level of in-depth understanding on their opinions, and through self-reflection by the experts, a collective consensus about their opinions could be attained [107,108].
The success of the Delphi method is primarily dependent on the level of efforts put into the planning communication procedures, methodical bases, and interactive forecasting methods by the experts [100,109]. Therefore, it was critical to select a group of experts who were well informed of the key purposes of the study, and had also provided assurance to commit towards the research. In addition, this study had also sought to collect more information related to the research issues, and to seek further clarifications on these issues with follow-up questionnaires to the experts [105,110].
The Delphi method aims to examine if the experts’ recognition degree reach consensus difference index [105]. It uses the measure scale (O, S) to analyze the average, and the standard deviation of each category, and determines if the experts’ responses were consistent by evaluating the coefficient of variance during the process. The lower the Coefficient of Variance (CV), the fewer differences existed between each category, and it indicates that the experts are more likely to reach a consensus. The research applied standard CV to examine the consensus among the experts towards the evaluative elements. When the CV ≤ 0.3, it implies that the experts agree with one another as it shows in the Formula (1).
C V j t = S j t X ¯ j t   ,   j , t
On the other hand, the lower the value of the Consensus Deviation Index (CDI), the higher the Degree of Consensus (DC) it will be. CDI value is the largest average when the target/standard deviation of benchmark is divided by the same class of targets/benchmarks measurement, which is shown in Formula (2), while Formula (3) indicates that the DC consensus degree is 1—CDI.
C D I j t = C V j t X ¯ j t max ( X ¯ j t ) , j , t
D C j t = 1 C D I j t , j , t
This study has set the threshold of consensus difference as ε ≤ 0.2. As long as the CDI values are less than the ε value, it indicates that the investigation into the experts’ responses have reached a consensus, using the evaluative standards.

3.2. AHP Method

The AHP method is also known as the level analysis method, which seeks to deconstruct a problem into a dendritic structure level, and establish a class structure level with a mutual influence, allowing more accurate decisions to be made on complex issues [111]. This method permits the comparison between two items at each level with different measurements, and the setting up of the comparative matrixes in pairs to calculate the featured vector quantity, which represents the priority of the significant elements at a particular level of a certain structure [112]. The featured value is then calculated, which forms an evaluative basis to judge the level of consistency as well as the extent of influence on each comparative matrix. The process involved in the AHP method is generally determined based on the judgment of major decision makers or the experts, which includes:
  • Problem description and definition
  • Impact factor analysis
  • Evaluation system establishment
  • Questionnaire design
  • Questionnaire fills in
  • Judgment and test of pair comparisons
  • Consistency index
  • CI Comprehensive value at all levels, as shown in Formula (4)
C I   = λ max n n 1
As long as the consistency index equals zero, it represents that the experts’ judgments remain consistent before and after the process was completed. Under the same matrix, the ratio of C.I. value and R.I. value is known as consistency ratio which is shown in Formula (5).
C.R. = C.I./R.I.

3.3. Questionnaire Survey

The first questionnaire survey had adopted the use of the Delphi method, the purpose of which was to determine if any of the elements and/or dimensions within the evaluation system should be removed or added based on the experts’ opinions. On the other hand, the second questionnaire survey was aimed to allow the experts to self-reflect on their respective viewpoints based on the overall statistics, and responses gathered from the first questionnaire. The level analysis questionnaire using the AHP method was adopted for the third questionnaire survey in order to make comparison between two element indicators. The three major applications used for the AHP analysis method were Expert Choice, Auto Man, and HIPRE. The features and capabilities of Expert Choice were considered to be more superior to AutoMan, and HIPRE, and had advantages in multi-attribute decision questions [113,114]. Thus, Expert Choice was used for analyzing those returned questionnaires. The results of these questionnaires were then consolidated using the geometric mean method as suggested by Saaty [112].
This two-stage study followed the various steps and procedures as outlined briefly below.
Stage 1: There were five steps involved in the Delphi questionnaire survey: (1) the establishment of the different aspects of information needed, and the expert group of 17 members; (2) dissemination of the first questionnaire survey to the experts; (3) the collection of the first questionnaire survey, consolidation, and analysis of the experts’ responses; (4) dissemination of the second questionnaire survey to the experts; and (5) the collection of the second questionnaire survey, consolidation and analysis of the experts’ responses.
Stage 2: The four steps for AHP method process: (1) finalization of the evaluation criteria system; (2) questionnaire evaluation; (3) allocation of weighting and consistency clarification; and (4) calculation of the weighted values of each evaluation.

4. Results

4.1. Delphi Analysis

Seventeen questionnaires were sent out in the first stage of the survey with 100% response rate. Based on the feedback provided on the evaluation items in the first stage of the survey, the second questionnaire was modified accordingly. In addition, feedbacks on the substandard evaluation items were also provided to the experts in the second questionnaire survey. Although 17 questionnaires were sent out to the experts in the second stage of the survey, only 16 were returned and regarded as valid, as one expert failed to respond. The findings revealed that there were two dimensions, and six sub-dimensions regarded as acceptable, of which the “Managing Quality” dimension, and the “Environmental Conservation” sub-dimension received 100% consensus (i.e., Consensus Index DC = 1) from the experts. This could be supported by the growing awareness of environmental protection as well as the understanding of the need for resources to enhance, and provide ongoing maintenance for protecting the environment [115,116]. On the other hand, two evaluation elements, public facilities and industrial facilities, were amended to public sector facilities and private sector facilities, respectively, to provide a more consistent and accurate descriptions of the intended evaluation criteria. Overall, there were 17 indicators investigated and all were accepted. Based on the consensus derived from the experts in the second questionnaire survey, a set of self-evaluation criteria along with weightings for quality management in tourist attractions was developed, which consisted of two dimensions at level 1; six sub-dimensions at level 2; and 17 indicators at level 3 (as shown in Figure 1).

4.2. AHP Analysis

4.2.1. Consistency Checking

Sixteen AHP questionnaire surveys were sent to the experts, of which 15 were returned. For consistency ratio checking, these AHP questionnaires included: a set of dimensions, two sets of sub-dimensions, and six sets of indicators. Consistency would only be considered reliable when C.R. < 0.1 [112]. The consistency check had resulted in the removal of one questionnaire (i.e., failed on consistency), and thus only 14 questionnaires were valid and useable.

4.2.2. Weight Allocation of Evaluation Items

Managing quality was the highest weighted (0.583) dimension at level 1, and this was followed by service quality (0.417). For those sub-dimensions at level 2, tourism services were weighted the highest (0.625) with the remaining sub-dimensions as follow: environmental conservation (0.46), recreation services (0.375), tourism safety (0.27), facilities maintenance (0.165), and industry management (0.105). As for the indicators at level 3, their weightings were presented in accordance to the respective six sub-dimensions as follow: Tourism services—information counter services (0.404), travel information (0.324), and guide services (0.272); Environmental conservation—environmental cleanliness (0.377), ecological preservation (0.311), facilities cleanliness (0.177), and environmental protection measures (0.136); Recreation services—service personnel (0.544), product quality (0.263) and service prices (0.193); Tourism safety—safety measures (0.613), and accident handling (0.387); Facilities maintenance—public sector facilities (0.766), and private sector facilities (0.234); and Industry management—hospitality management (0.522), vendor management (0.277), and store management (0.201). Table 2 below provides a detailed weighting allocation for all the dimensions, sub-dimensions, and indicators as discussed above.
In order to monitor and measure the identified indicators above, a list of key evaluation criteria has been developed and ratings (as shown in Table 3) are established against these criteria. Through the assessment of these evaluation criteria, tourism businesses will be able to regularly conduct their own quality self-evaluation, and determine the level of quality service/product provided. This enables tourism businesses to better understand the areas in which they have performed well, and areas that require further improvements. As a result, sustainable high-quality standards can be achieved through appropriate planning and implementation of the quality management self-evaluation system.

5. Conclusions, Implications and Future Research

In conclusion, this study has identified a set of key indicators along with weightings for tourist attractions in Taiwan, which can be used as a self-evaluation tool by tourism businesses to assess the quality standards of their products/services provided to the tourists. The research findings revealed that there were two major dimensions, six sub-dimensions, and 17 indicators that formed the basis for quality self-evaluation on tourist attractions by tourism businesses. The most significant dimension was managing quality, and this was followed by service quality. On the other hand, tourism services were identified as the most important sub-dimension with environmental conservation, recreation services, tourism safety, facilities maintenance, and industry management forming the remaining. The most crucial indicator was information counter service within the tourism services sub-dimension, whilst store management under the sub-dimension of industry management was considered the least important. Other indicators included: environmental cleanliness, safety measures, service personnel, travel information, ecological preservation, public sector facilities, guide service, accidental handling, facilities cleanliness, product quality, environmental protection measures, hospitality management, service prices, private sector facilities, vendor management, and store management.
The findings have extended the existing literature about tourist attractions, specifically with the identification of key dimensions, sub-dimensions, and indicators in which tourism businesses could use to self-evaluate their level of quality product/service provided to the tourist. In addition, new insights to the literature have been added with the establishment of specific weightings to a set of key indicators that can be used as a measurement tool for quality tourism. The findings have also highlighted several practical implications, including the provision of key quality management information to tourism businesses that can assist in solving quality problems, and possible ways of quality enhancement in tourism. With this, a regular and systematic analysis of the evaluation results can assist tourism businesses, and national/regional Destination Management Organization (DMO) to gain a better understanding, and narrow the gaps (if any) between the quality tourism provided, and the perceived quality by the tourists/consumers. In addition, the quality self-evaluation mechanism can also contribute towards the overall strategic planning process with the identification of potential improvements in activities, and enhance competitiveness in quality management, so that positive tourism experience can be achieved, and thus improving tourists’ satisfaction.
Since this is an empirical study conducted to establish a list of key dimensions, sub-dimensions, and indicators for tourist attractions from the supply side (tourism businesses) perspective, further conclusive explanatory research is required to test these indicators, and the weightings developed. The key indicators of quality management for tourist attractions developed in this research are based on the expert opinions provided in the Taiwanese context. Therefore, studies can be conducted with experts from other countries, giving different perspectives that can have significant comparative outcomes, which in turn contribute to the development of a more comprehensive self-evaluation mechanism with a focus on the interaction between planning, sustainability, conservation, and tourism. Furthermore, cultural factors have not been considered in this study, and thus it is suggested that future studies to be conducted to explore the potential influence of cultural factors on quality tourism attractions.

Acknowledgments

This work was supported by grants from the Ministry of Science and Technology (MOST 103-2511-S-237-003; MOST 105-2511-S-003-021-MY3 to W.-T.F.). This article was also subsidized by the National Taiwan Normal University (NTNU), Taiwan, ROC. The useful suggestions from anonymous reviewers were incorporated into the manuscript.

Author Contributions

Luan Chen coordinated this research project as well as designed the questionnaire. Luan Chen carried out this survey. Wei-Ta Fang and Luan Chen analyzed the data. Luan Chen, Wei-Ta Fang, Shyh-Chang Huang, and Eric Ng contributed in the discussion of results. Luan Chen, Wei-Ta Fang and Eric Ng wrote the paper.

Conflicts of Interest

The authors declare no conflict of interest.

References

  1. Navickas, V.; Malakauskaite, A. The possibilities for the identification and evaluation of tourism sector competitiveness factors. Eng. Econ. 2009, 61, 37–44. [Google Scholar]
  2. Tsiotras, G.D.; Tsiotras, P.G.; Fotiadis, T.A. Enabling quality in the tourism industry: An evaluation of business excellence in Greek hotels. Glob. Bus. Organ. Excell. 2016, 35, 44–57. [Google Scholar] [CrossRef]
  3. De Lara, R.A.A.; Thöny, A. Responsible Tourism in Asia. In Responsible Management in Asia; Williams, G., Ed.; Palgrave Macmillan: London, UK, 2011; pp. 146–160. [Google Scholar]
  4. Hall, C.M. Consumerism, Tourism and voluntary simplicity: We all have to consume, but do we really have to travel so much to be happy? Tour. Recreat. Res. 2011, 36, 298–303. [Google Scholar] [CrossRef]
  5. Andergassen, R.; Candela, G.; Figini, P. An economic model for tourism destinations: Product sophistication and price coordination. Tour. Manag. 2013, 37, 86–98. [Google Scholar] [CrossRef]
  6. Von Bergner, N.M.; Lohmann, M. Future challenges for global tourism A Delphi survey. J. Travel Res. 2014, 53, 420–432. [Google Scholar] [CrossRef]
  7. Baker, D.M.A. Service quality and customer satisfaction in the airline industry: A comparison between legacy airlines and low-cost airlines. Am. J. Tour. Res. 2013, 2, 67–77. [Google Scholar] [CrossRef]
  8. Namukasa, J. The influence of airline service quality on passenger satisfaction and loyalty: The case of Uganda airline industry. TQM J. 2013, 25, 520–532. [Google Scholar] [CrossRef]
  9. Bastič, M.; Gojčič, S. Measurement scale for eco-component of hotel service quality. Int. J. Hosp. Manag. 2012, 31, 1012–1020. [Google Scholar] [CrossRef]
  10. Torres, E.N.; Kline, S. From customer satisfaction to customer delight: Creating a new standard of service for the hotel industry. Int. J. Contemp. Hosp. Manag. 2013, 25, 642–659. [Google Scholar] [CrossRef]
  11. Chen, C.-F.; Kao, Y.-L. Relationships between process quality, outcome quality, satisfaction, and behavioural intentions for online travel agencies—Evidence from Taiwan. Serv. Ind. J. 2010, 30, 2081–2092. [Google Scholar] [CrossRef]
  12. Shahin, A.; Janatyan, N. Estimation of customer dissatisfaction based on service quality gaps by correlation and regression analysis in a travel agency. Int. J. Bus. Manag. 2011, 6, 99–108. [Google Scholar] [CrossRef]
  13. Hwang, J.; Zhao, J. Factors influencing customer satisfaction or dissatisfaction in the restaurant business using AnswerTree methodology. J. Qual. Assur. Hosp. Tour. 2010, 11, 93–110. [Google Scholar] [CrossRef]
  14. Ryu, K.; Lee, H.-R.; Kim, W.G. The influence of the quality of the physical environment, food, and service on restaurant image, customer perceived value, customer satisfaction, and behavioral intentions. Int. J. Contemp. Hosp. Manag. 2012, 24, 200–223. [Google Scholar] [CrossRef]
  15. Alegre, J.; Garau, J. Tourist satisfaction and dissatisfaction. Ann. Tour. Res. 2010, 37, 52–73. [Google Scholar] [CrossRef]
  16. Žabkar, V.; Brenčič, M.M.; Dmitrović, T. Modelling perceived quality, visitor satisfaction and behavioural intentions at the destination level. Tour. Manag. 2010, 31, 537–546. [Google Scholar] [CrossRef]
  17. Ooi, K.-B.; Lin, B.; Tan, B.-I.; Chong, Y.-L.A. Are TQM practices supporting customer satisfaction and service quality? J. Serv. Mark. 2011, 25, 410–419. [Google Scholar] [CrossRef]
  18. Talib, F.; Rahman, Z.; Qureshi, M.N. Analysis of interaction among the barriers to total quality management implementation using interpretive structural modeling approach. Benchmark. Int. J. 2011, 18, 563–587. [Google Scholar] [CrossRef]
  19. Ali, M.; Shastri, R.K. Implementation of total quality management in higher education. Asian J. Bus. Manag. 2010, 2, 9–16. [Google Scholar]
  20. O’Mahony, K.; Garavan, T.N. Implementing a quality management framework in a higher education organisation: A case study. Qual. Assur. Educ. 2012, 20, 184–200. [Google Scholar] [CrossRef]
  21. Carman, J.M.; Shortell, S.M.; Foster, R.W.; Hughes, E.F.X.; Boerstler, H.; O’Brien, J.L.; O’Connor, E.J. Keys for successful implementation of total quality management in hospitals. Health Care Manag. Rev. 2010, 35, 283–293. [Google Scholar] [CrossRef] [PubMed]
  22. Dahlgaard, J.J.; Pettersen, J.; Dahlgaard-Park, S.M. Quality and lean health care: A system for assessing and improving the health of healthcare organisations. Total Qual. Manag. Bus. Excell. 2011, 22, 673–689. [Google Scholar] [CrossRef]
  23. Das, A.; Kumar, V.; Kumar, U. The role of leadership competencies for implementing TQM: An empirical study in Thai manufacturing industry. Int. J. Qual. Reliab. Manag. 2011, 28, 195–219. [Google Scholar] [CrossRef]
  24. Khanna, H.K.; Sharma, D.D.; Laroiya, S.C. Identifying and ranking critical success factors for implementation of total quality management in the Indian manufacturing industry using TOPSIS. Asian J. Qual. 2011, 12, 124–138. [Google Scholar] [CrossRef]
  25. IPK International. ITB World Travel Trends Report 2012/2013. Available online: http://www.itb-berlin.de/media/itbk/itbk_media/itbk_pdf/WTTR_Report_2013_web.pdf (accessed on 18 August 2017).
  26. World Tourism Organization. UNWTO Tourism Highlights—2013 Edition. 2013. Available online: http://dtxtq4w60xqpw.cloudfront.net/sites/all/files/pdf/unwto_highlights13_en_lr_0.pdf (accessed on 18 August 2017).
  27. Goeldner, C.R.; Ritchie, J.B. Tourism: Principles, Practices, Philosophies; John Wiley and Sons: Hoboken, NJ, USA, 2009. [Google Scholar]
  28. Levary, R.R. Multiple-criteria approach to ranking medical tourism destinations. Thunderbird Int. Bus. Rev. 2011, 53, 529–537. [Google Scholar] [CrossRef]
  29. Zhang, H.; Gu, C.-L.; Gu, L.-W.; Zhang, Y. The evaluation of tourism destination competitiveness by TOPSIS & information entropy—A case in the Yangtze River Delta of China. Tour. Manag. 2011, 32, 443–451. [Google Scholar]
  30. Richards, G. Tourism attraction systems: Exploring cultural behavior. Ann. Tour. Res. 2002, 29, 1048–1064. [Google Scholar] [CrossRef]
  31. Office of Information Services, Executive Yuan. Economy. 2013. Available online: http://www.ey.gov.tw/en/cp.aspx?n=A132EDB16DD62808 (accessed on 18 August 2017).
  32. Office of Information Services, Executive Yuan. Tourism. 2013. Available online: http://www.ey.gov.tw/en/cp.aspx?n=8F2ED729DFF90295 (accessed on 18 August 2017).
  33. Tourism Bureau. Visitor Arrivals by Purpose of Visit. 2012. Available online: http://admin.taiwan.net.tw/upload/statistic/20130219/a028dd14-290f-44f0-9784-517cfef63d14.xls (accessed on 18 August 2017).
  34. Brewer, P.D.; Brewer, V.L.; Hawksley, M. Strategic planning for continuous improvement in a college of business. Mid-Atl. J. Bus. 2000, 36, 123–132. [Google Scholar]
  35. Buchanan, S.; Cousins, F. Evaluating the strategic plans of public libraries: An inspection-based approach. Libr. Inf. Sci. Res. 2012, 34, 125–130. [Google Scholar] [CrossRef] [Green Version]
  36. Suttapong, K.; Tian, Z. Performance Benchmarking for Building Best Practice in Small and Medium Enterprises (SMEs). Int. J. Bus. Commer. 2012, 1, 46–60. [Google Scholar]
  37. Joint Technical Committee QR/8; International Organization for Standardization; Standards Association of Australia; Standards New Zealand. Quality Management and Quality Assurance-Vocabulary; Revised Edition; Standards Australia & Standards New Zealand: North Sydney, Australia, 1994. [Google Scholar]
  38. European Commission. Towards Quality Coastal Tourism—Integrated Quality Management (IQM) of Coastal Tourist Destinations; Office for Official Publications of the European Communities: Luxembourg, 2000. [Google Scholar]
  39. Weckenmann, A.; Akkasoglu, G.; Werner, T. Quality management—History and trends. TQM J. 2015, 27, 281–293. [Google Scholar] [CrossRef]
  40. Huang, S.; Weiler, B. A review and evaluation of China’s quality assurance system for tour guiding. J. Sustain. Tour. 2010, 18, 845–860. [Google Scholar] [CrossRef]
  41. International Organization for Standardization. ISO 9000—Quality Management. 2016. Available online: http://www.iso.org/iso/home/standards/management-standards/iso_9000.htm (accessed on 18 August 2017).
  42. Casadesus, M.; Marimon, F.; Alonso, M. The future of standardised quality management in tourism: Evidence from the Spanish tourist sector. Serv. Ind. J. 2010, 30, 2457–2474. [Google Scholar] [CrossRef]
  43. Mendes, J.; Coelho, L.; Mendes, J. Excellence in Tourism Destinations. In Achieving Competitive Advantage through Quality Management; Peris-Ortiz, M., Álvarez-García, J., Rueda-Armengot, C., Eds.; Springer International Publishing: Cham, Switzerland, 2015; pp. 33–48. [Google Scholar]
  44. Naveh, E.; Marcus, A.A. When does the ISO 9000 quality assurance standard lead to performance improvement? Assimilation and going beyond. IEEE Trans. Eng. Manag. 2004, 51, 352–363. [Google Scholar] [CrossRef]
  45. Nwankwo, S. Quality assurance in small business organisations: Myths and realities. Int. J. Qual. Reliab. Manag. 2000, 17, 82–99. [Google Scholar] [CrossRef]
  46. World Tourism Organization. Understanding Tourism: Basic Glossary. 2013. Available online: http://media.unwto.org/en/content/understanding-tourism-basic-glossary (accessed on 20 August 2017).
  47. Hartmann, P.; Apaolaza-Ibáñez, V. Beyond savanna: An evolutionary and environmental psychology approach to behavioral effects of nature scenery in green advertising. J. Environ. Psychol. 2010, 30, 119–128. [Google Scholar] [CrossRef]
  48. Hudson, S.; Wang, Y.; Gil, S.M. The influence of a film on destination image and the desire to travel: A cross-cultural comparison. Int. J. Tour. Res. 2011, 13, 177–190. [Google Scholar] [CrossRef]
  49. Landorf, C. Managing for sustainable tourism: A review of six cultural World Heritage Sites. J. Sustain. Tour. 2009, 17, 53–70. [Google Scholar] [CrossRef]
  50. Stylianou-Lambert, T. Gazing from home: Cultural tourism and art museums. Ann. Tour. Res. 2011, 38, 403–421. [Google Scholar] [CrossRef]
  51. Yang, C.-H.; Lin, H.-L.; Han, C.-C. Analysis of international tourist arrivals in China: The role of World Heritage Sites. Tour. Manag. 2010, 31, 827–837. [Google Scholar] [CrossRef]
  52. Buckley, C.; van Rensburg, T.M.; Hynes, S. Recreational demand for farm commonage in Ireland: A contingent valuation assessment. Land Use Policy 2009, 26, 846–854. [Google Scholar] [CrossRef]
  53. Williams, A.M.; Shaw, G. Future play: Tourism, recreation and land use. Land Use Policy 2009, 26, S326–S335. [Google Scholar] [CrossRef] [Green Version]
  54. Camarero, C.; Garrido, M.J.; Vicente, E. Components of art exhibition brand equity for internal and external visitors. Tour. Manag. 2010, 31, 495–504. [Google Scholar] [CrossRef]
  55. Canali, S.; d’Angella, F. Managing cultural events and meetings activities in European urban destinations. Int. J. Arts Manag. 2009, 11, 59–72. [Google Scholar]
  56. Milman, A. The global theme park industry. Worldw. Hosp. Tour. Themes 2010, 2, 220–237. [Google Scholar] [CrossRef]
  57. Slåtten, T.; Krogh, C.; Connolley, S. Make it memorable: Customer experiences in winter amusement parks. Int. J. Cult. Tour. Hosp. Res. 2011, 5, 80–91. [Google Scholar] [CrossRef]
  58. Wong, I.K.A.; Rosenbaum, M.S. Beyond hardcore gambling understanding why mainland Chinese visit casinos in Macau. J. Hosp. Tour. Res. 2012, 36, 32–51. [Google Scholar] [CrossRef]
  59. Grun, C.; Werthner, H.; Proll, B.; Retschitzegger, W.; Schwinger, W. Assisting tourists on the move—An evaluation of mobile tourist guides. In Proceedings of the 7th International Conference on Mobile Business (ICMB ’08), Barcelona, Spain, 7–8 July 2008. [Google Scholar]
  60. McKercher, B. Towards a classification of cultural tourists. Int. J. Tour. Res. 2002, 4, 29–38. [Google Scholar] [CrossRef]
  61. Baum, T.; Szivas, E. HRD in tourism: A role for government? Tour. Manag. 2008, 29, 783–794. [Google Scholar] [CrossRef]
  62. Deng, J.; King, B.; Bauer, T. Evaluating natural attractions for tourism. Ann. Tour. Res. 2002, 29, 422–438. [Google Scholar] [CrossRef]
  63. Beerli, A.; Martı́n, J.D. Tourists’ characteristics and the perceived image of tourist destinations: A quantitative analysis—A case study of Lanzarote, Spain. Tour. Manag. 2004, 25, 623–636. [Google Scholar] [CrossRef]
  64. Cracolici, M.F.; Nijkamp, P. The attractiveness and competitiveness of tourist destinations: A study of Southern Italian regions. Tour. Manag. 2009, 30, 336–344. [Google Scholar] [CrossRef]
  65. Buhalis, D. Marketing the competitive destination of the future. Tour. Manag. 2000, 21, 97–116. [Google Scholar] [CrossRef] [Green Version]
  66. Leask, A. Progress in visitor attraction research: Towards more effective management. Tour. Manag. 2010, 31, 155–166. [Google Scholar] [CrossRef]
  67. Torbidoni, E.I.F.; Grau, H.R.; Camps, A. Trail preferences and visitor characteristics in Aigüestortes i Estany de Sant Maurici National park, Spain. Mt. Res. Dev. 2005, 25, 51–59. [Google Scholar] [CrossRef]
  68. Hsu, T.-K.; Tsai, Y.-F.; Wu, H.-H. The preference analysis for tourist choice of destination: A case study of Taiwan. Tour. Manag. 2009, 30, 288–297. [Google Scholar] [CrossRef]
  69. Lawton, L.J. Resident perceptions of tourist attractions on the Gold Coast of Australia. J. Travel Res. 2005, 44, 188–200. [Google Scholar] [CrossRef]
  70. Go, F.M.; Govers, R. Integrated quality management for tourist destinations: A European perspective on achieving competitiveness. Tour. Manag. 2000, 21, 79–88. [Google Scholar] [CrossRef]
  71. Pearce, D.G.; Schänzel, H.A. Destination management: The tourists’ perspective. J. Destin. Mark. Manag. 2013, 2, 137–145. [Google Scholar] [CrossRef]
  72. Carreira, R.; Patrício, L.; Jorge, R.N.; Magee, C.; Hommes, Q.V.E. Towards a holistic approach to the travel experience: A qualitative study of bus transportation. Transp. Policy 2013, 25, 233–243. [Google Scholar] [CrossRef]
  73. Khadaroo, J.; Seetanah, B. The role of transport infrastructure in international tourism development: A gravity model approach. Tour. Manag. 2008, 29, 831–840. [Google Scholar] [CrossRef]
  74. Ioppolo, G.; Saija, G.; Salomone, R. From coastal management to environmental management: The sustainable eco-tourism program for the mid-western coast of Sardinia (Italy). Land Use Policy 2013, 31, 460–471. [Google Scholar] [CrossRef]
  75. Nara, P.; Mao, G.; Yen, T. Applying Environmental Management Policy for Sustainable Development of Coastal Tourism in Thailand. Int. J. Environ. Prot. Policy 2014, 1, 19–23. [Google Scholar] [CrossRef]
  76. Eagles, P.F.J. Trends in park tourism: Economics, finance and management. J. Sustain. Tour. 2002, 10, 132–153. [Google Scholar] [CrossRef]
  77. Muskat, B.; Muskat, M.; Blackman, D. Understanding the cultural antecedents of quality management in tourism. Manag. Serv. Qual. Int. J. 2013, 23, 131–148. [Google Scholar] [CrossRef]
  78. Iordache, C. Shapes and Tourism Development Strategies of Urban area. Manag. Mark. J. 2013, 11, 115–122. [Google Scholar]
  79. Sharpley, R.; Forster, G. The implications of hotel employee attitudes for the development of quality tourism: The case of Cyprus. Tour. Manag. 2003, 24, 687–697. [Google Scholar] [CrossRef]
  80. Bauer, T.G.; Chan, A. Does the environment matter? Experiences, attitudes, and revisit intentions of international visitors to Hong Kong. Pac. Tour. Rev. 2001, 5, 75–82. [Google Scholar]
  81. Hu, W.; Wall, G. Environmental management, environmental image and the competitive tourist attraction. J. Sustain. Tour. 2005, 13, 617–635. [Google Scholar] [CrossRef]
  82. Fallon, L.D.; Kriwoken, L.K. Community involvement in tourism infrastructure—The case of the Strahan Visitor Centre, Tasmania. Tour. Manag. 2003, 24, 289–308. [Google Scholar] [CrossRef]
  83. Butler, R.W. The concept of a tourist area cycle of evolution: Implications for management of resources. Can. Geogr. 1980, 24, 5–12. [Google Scholar] [CrossRef]
  84. Sparks, B.; Bowen, J.; Klag, S. Restaurants and the tourist market. Int. J. Contemp. Hosp. Manag. 2003, 15, 6–13. [Google Scholar] [CrossRef]
  85. Williams, A. Tourism and hospitality marketing: Fantasy, feeling and fun. Int. J. Contemp. Hosp. Manag. 2006, 18, 482–495. [Google Scholar] [CrossRef]
  86. Cavlek, N. Tour operators and destination safety. Ann. Tour. Res. 2002, 29, 478–496. [Google Scholar] [CrossRef]
  87. Yüksel, A.; Yüksel, F. Shopping risk perceptions: Effects on tourists’ emotions, satisfaction and expressed loyalty intentions. Tour. Manag. 2007, 28, 703–713. [Google Scholar] [CrossRef]
  88. Bruwer, J. Service quality perception and satisfaction: Buying behaviour prediction in an Australian festivalscape. Int. J. Tour. Res. 2014, 16, 76–86. [Google Scholar] [CrossRef]
  89. Padma, P. Strategic quadrants and service quality: Tourist satisfaction in Portugal. Qual. Manag. J. 2016, 23, 57–70. [Google Scholar]
  90. Dhar, R.L. Service quality and the training of employees: The mediating role of organizational commitment. Tour. Manag. 2015, 46, 419–430. [Google Scholar] [CrossRef]
  91. Herman, S. Management of human resources in tourism. Interdiscip. Manag. Res. 2015, 11, 180–188. [Google Scholar]
  92. Dwyer, L.; Mellor, R.; Livaic, Z.; Edwards, D.; Kim, C. Attributes of destination competitiveness: A factor analysis. Tour. Anal. 2004, 9, 91–101. [Google Scholar] [CrossRef]
  93. Tosun, C.; Dedeoğlu, B.B.; Fyall, A. Destination service quality, affective image and revisit intention: The moderating role of past experience. J. Destin. Mark. Manag. 2015, 4, 222–234. [Google Scholar] [CrossRef]
  94. Bhat, M.A. Tourism service quality: A dimension-specific assessment of SERVQUAL. Glob. Bus. Rev. 2012, 13, 327–337. [Google Scholar] [CrossRef]
  95. Dong, K.Y.; Jeong, A.P. Perceived service quality: Analyzing relationships among employees, customers, and financial performance. Int. J. Qual. Reliab. Manag. 2007, 24, 908–926. [Google Scholar]
  96. Han, S.; Ham, S.S.; Yang, I.; Baek, S. Passengers’ perceptions of airline lounges: Importance of attributes that determine usage and service quality measurement. Tour. Manag. 2012, 33, 1103–1111. [Google Scholar] [CrossRef]
  97. Tsang, N.K.F.; Lee, L.Y.-S.; Qu, H. Service quality research on China’s hospitality and tourism industry. Int. J. Contemp. Hosp. Manag. 2015, 27, 473–497. [Google Scholar] [CrossRef]
  98. Watson, R.; Akselsen, S.; Monod, E.; Pitt, L. The open tourism consortium: Laying the foundations for the future of tourism. Eur. Manag. J. 2004, 22, 315–326. [Google Scholar] [CrossRef]
  99. Tian-Cole, S.; Cromption, J. A conceptualization of the relationships between service quality and visitor satisfaction, and their links to destination selection. Leis. Stud. 2003, 22, 65–80. [Google Scholar] [CrossRef]
  100. García-Melón, M.; Gómez-Navarro, T.; Acuña-Dutra, S. A combined ANP-Delphi approach to evaluate sustainable tourism. Environ. Impact Assess. Rev. 2012, 34, 41–50. [Google Scholar] [CrossRef]
  101. Lu, J.; Nepal, S.K. Sustainable tourism research: An analysis of papers published in the Journal of Sustainable Tourism. J. Sustain. Tour. 2009, 17, 5–16. [Google Scholar] [CrossRef]
  102. Büyüközkan, G.; Çifçi, G.; Güleryüz, S. Strategic analysis of healthcare service quality using fuzzy AHP methodology. Expert Syst. Appl. 2011, 38, 9407–9424. [Google Scholar] [CrossRef]
  103. Gao, L.; Hailu, A. Ranking management strategies with complex outcomes: An AHP-fuzzy evaluation of recreational fishing using an integrated agent-based model of a coral reef ecosystem. Environ. Model. Softw. 2012, 31, 3–18. [Google Scholar] [CrossRef]
  104. Hsu, C.-C.; Sandford, B.A. The Delphi technique: Making sense of consensus. Pract. Assess. Res. Eval. 2007, 12, 1–8. [Google Scholar]
  105. Yousuf, M.I. Using experts’ opinions through Delphi technique. Pract. Assess. Res. Eval. 2007, 12, 1–8. [Google Scholar]
  106. Wang, X.; Gao, Z.; Guo, H. Delphi method for estimating uncertainty distributions. Inf. Int. Interdiscip. J. 2012, 15, 449–460. [Google Scholar]
  107. Landeta, J. Current validity of the Delphi method in social sciences. Technol. Forecast. Soc. Chang. 2006, 73, 467–482. [Google Scholar] [CrossRef]
  108. Okoli, C.; Pawlowski, S.D. The Delphi method as a research tool: An example, design considerations and applications. Inf. Manag. 2004, 42, 15–29. [Google Scholar] [CrossRef] [Green Version]
  109. Kaynak, E.; Cavlek, N. Measurement of tourism market potential of Croatia by use of Delphi qualitative research technique. J. East-West Bus. 2007, 12, 105–123. [Google Scholar] [CrossRef]
  110. Miller, G. The development of indicators for sustainable tourism: Results of a Delphi survey of tourism researchers. Tour. Manag. 2001, 22, 351–362. [Google Scholar] [CrossRef]
  111. Crouch, G.I.; Ritchie, J.B. Application of the analytic hierarchy process to tourism choice and decision making: A review and illustration applied to destination competitiveness. Tour. Anal. 2005, 10, 17–25. [Google Scholar] [CrossRef]
  112. Saaty, T.L. Decision making with the analytic hierarchy process. Int. J. Serv. Sci. 2008, 1, 83–98. [Google Scholar] [CrossRef]
  113. Ho, W.; Xu, X.; Dey, P.K. Multi-criteria decision making approaches for supplier evaluation and selection: A literature review. Eur. J. Oper. Res. 2010, 202, 16–24. [Google Scholar] [CrossRef]
  114. Power, D.J.; Sharda, R. Model-driven decision support systems: Concepts and research directions. Decis. Support Syst. 2007, 43, 1044–1061. [Google Scholar] [CrossRef]
  115. Dunlap, R.E. The new environmental paradigm scale: From marginality to worldwide use. J. Environ. Educ. 2008, 40, 3–18. [Google Scholar] [CrossRef]
  116. Zhang, K.M.; Wen, Z.-G. Review and challenges of policies of environmental protection and sustainable development in China. J. Environ. Manag. 2008, 88, 1249–1261. [Google Scholar] [CrossRef] [PubMed]
Figure 1. A self-evaluation system of quality management for tourist attractions.
Sustainability 09 01751 g001
Table 1. Profiles of experts from Taiwan.
Experts & ScholarsYears of Tourism ExperienceJob TitleExpertise
Expert A37AcademicTourism policy and evaluation, Tourism resources planning
Expert B26Travel agency—General managerTravel business operations and management, Manager and tour guide’s practice, Tourism resources and its geographic, Tourism marketing, Hospitality services to foreign tourists
Expert C23National Park—DirectorNatural resource planning and management, Construction management, National Park planning and management, Architectural planning and design, Landscape planning and design
Expert D17Council of Agriculture—Team leaderResource evaluation and planning, Recreation area planning and construction, Operation management, Trail system development
Expert E18National Park—DirectorTourism and leisure resource planning, Operation and management
Expert F30Travel agency—Senior managerTravel business management, Tourism resources, Tourism geography, Environment introduction, Tour guide practice
Expert G25Tourism Bureau—DirectorTourism and leisure resources planning, Scenic area construction and operation management
Expert H18Tourism Bureau—DirectorTourism resources planning, Operation and management
Expert K21Travel agency—General managerTour planning and cost analysis, Airline agent, Tour guide and manager, Traveling business operation and management
Expert L11Tourism Bureau—Team leaderTourism resources survey and planning issues
Expert M14AcademicTourism marketing, Travel business management, Leisure business management, Eco-tourism, Leisure industry performance evaluation
Expert N25AcademicEcological planning, Landscape planning and design, Cultural landscape preservation, Eco-tourism in national parks planning
Expert P30Tourism association—DirectorGuiding skills, Guide personnel service skills and mindsets, Domestic tourism business practice
Expert S25Travel agency—Deputy general managerTour guide’s practice, Tourism marketing, Tourism disputes handling, Leisure Introduction
Expert T18AcademicTourism and leisure resources planning, Scenic area construction and operation management
Expert U20AcademicTourism administration and regulations, Scenic area management, Tourism marketing
Expert W37Tourism Bureau—DirectorTourism marketing and management
Table 2. A self-evaluation system of quality management for tourism attractions—Key dimensions, sub-dimensions, indicators, and weightings.
Target LevelDimension Level 1Level WeightSortSub-Dimension Level 2Level WeightSortOverall WeightIndicators Level 3Level WeightSortOverall WeightOverall Sort
Evaluation criteria establishmentManaging quality0.5831Environmental conservation0.46020.268Environmental cleanliness0.37710.1012
Facilities cleanliness0.17730.04710
Ecological preservation0.31120.0836
Environmental Protection measures0.13640.03612
Facilities maintenance0.16550.096Public sector facilities0.76610.0747
Private sector facilities0.23420.02315
Industry management0.10560.061Hospitality management0.52210.03213
Store management0.20130.01217
Vendor management0.27720.01716
Tourism safety0.27040.158Safety measures0.61310.0973
Accident handling0.38720.0619
Service quality0.4172Tourism services0.62510.261Information counter Service0.40410.1051
Guide service0.27230.0718
Travel information0.32420.0854
Recreation services0.37530.156Service personnel0.54410.0854
Product quality0.26320.04111
Service prices0.19330.03014
Table 3. Quality management for tourist attractions—Key evaluation criteria and ratings.
DimensionSub-DimensionIndicatorEvaluation CriteriaEvaluation Ratings
Managing qualityEnvironmental conservationEnvironmental cleanlinessManagement measures(A) have 4 or more cleanliness measurements in place; (B) have 3 cleanliness measurements in place; (C) have 2 cleanliness measurements in place; (D) have 1 cleanliness measurement in place; (E) have no cleanliness measurement in place
Maintenance condition(A) Excellent; (B) Good; (C) Average; (D) Below average; (E) Poor
Facilities cleanlinessManagement measures(A) have 4 or more cleanliness measurements in place; (B) have 3 cleanliness measurements in place; (C) have 2 cleanliness measurements in place; (D) have 1 cleanliness measurement in place; (E) have no cleanliness measurement in place
Maintenance condition(A) Excellent; (B) Good; (C) Average; (D) Below average; (E) Poor
Ecological preservationNaturalness(A) Very well preserved; (B) Well preserved; (C) Moderately preserved; (D) Partially preserved (E) None preserved
Environmental harmony(A) Very harmonious; (B) Harmonious; (C) Neutral; (D) Somewhat harmonious; (E) Not harmonious
Visual appreciation suitability(A) All suitable; (B) Mostly suitable; (C) Moderately suitable; (D) Partially suitable; (E) Not suitable
Environmental protection measuresManagement measures(A) have 4 or more protection measurements in place; (B) have 3 protection measurements in place; (C) have 2 protection measurements in place; (D) have 1 protection measurement in place; (E) have no protection measurement in place
Protection status(A) Excellent; (B) Good; (C) Average; (D) Below average; (E) Poor
Facilities maintenancePublic sector facilitiesManagement measures(A) have 4 or more facility measurements in place; (B) have 3 facility measurements in place; (C) have 2 facility measurements in place; (D) have 1 facility measurement in place; (E) have no facility measurement in place
Preservation condition(A) Excellent; (B) Good; (C) Average; (D) Below average; (E) Poor
Private sector facilitiesManagement measures(A) have 4 or more facility measurements in place; (B) have 3 facility measurements in place; (C) have 2 facility measurements in place; (D) have 1 facility measurement in place; (E) have no facility measurement in place
Preservation condition(A) Excellent; (B) Good; (C) Average; (D) Below average; (E) Poor
Industry managementHospitality managementManagement measures(A) have 4 or more hospitality measurements in place; (B) have 3 hospitality measurements in place; (C) have 2 hospitality measurements in place; (D) have 1 hospitality measurement in place; (E) have no hospitality measurement in place
Hospitality settings(A) Excellent; (B) Good; (C) Average; (D) Below average; (E) Poor
Store managementManagement measures(A) have 4 or more store measurements in place; (B) have 3 store measurements in place; (C) have 2 store measurements in place; (D) have 1 store measurement in place; (E) have no store measurement in place
Store settings(A) Excellent; (B) Good; (C) Average; (D) Below average; (E) Poor
Vendor managementManagement measures(A) have 4 or more vendor measurements in place; (B) have 3 vendor measurements in place; (C) have 2 vendor measurements in place; (D) have 1 vendor measurement in place; (E) have no vendor measurement in place
Vendor settings(A) Excellent; (B) Good; (C) Average; (D) Below average; (E) Poor
Tourism safetySafety measuresManagement measures(A) have 4 or more safety measurements in place; (B) have 3 safety measurements in place; (C) have 2 safety measurements in place; (D) have 1 safety measurement in place; (E) have no safety measurement in place
Facility maintenance(A) Excellent; (B) Good; (C) Average; (D) Below average; (E) Poor
Accident handlingManagement measures(A) have 4 or more accident handling measurements in place; (B) have 3 accident handling measurements in place; (C) have 2 accident handling measurements in place; (D) have 1 accident handling measurement in place; (E) have no accident handling measurement in place
Handling mechanisms(A) Excellent; (B) Good; (C) Average; (D) Below average; (E) Poor
Service qualityTourism servicesInformation counter serviceService measures(A) have 4 or more service measurements in place; (B) have 3 service measurements in place; (C) have 2 service measurements in place; (D) have 1 service measurement in place; (E) have no service measurement in place
Satisfaction(A) Excellent; (B) Good; (C) Average; (D) Below average; (E) Poor
Guide serviceService measures(A) have 4 or more service measurements in place; (B) have 3 service measurements in place; (C) have 2 service measurements in place; (D) have 1 service measurement in place; (E) have no service measurement in place
Satisfaction(A) Excellent; (B) Good; (C) Average; (D) Below average; (E) Poor
Travel informationService measures(A) have 4 or more service measurements in place; (B) have 3 service measurements in place; (C) have 2 service measurements in place; (D) have 1 service measurement in place; (E) have no service measurement in place
Satisfaction(A) Excellent; (B) Good; (C) Average; (D) Below average; (E) Poor
Recreation servicesService personnelService measures(A) have 4 or more service measurements in place; (B) have 3 service measurements in place; (C) have 2 service measurements in place; (D) have 1 service measurement in place; (E) have no service measurement in place
Satisfaction(A) Excellent; (B) Good; (C) Average; (D) Below average; (E) Poor
Product qualityService measures(A) have 4 or more service measurements in place; (B) have 3 service measurements in place; (C) have 2 service measurements in place; (D) have 1 service measurement in place; (E) have no service measurement in place
Satisfaction(A) Excellent; (B) Good; (C) Average; (D) Below average; (E) Poor
Service pricesService measures(A) have 4 or more service measurements in place; (B) have 3 service measurements in place; (C) have 2 service measurements in place; (D) have 1 service measurement in place; (E) have no service measurement in place
Satisfaction(A) Excellent; (B) Good; (C) Average; (D) Below average; (E) Poor

