Does Driving Range of Electric Vehicles Influence Electric Vehicle Adoption?


1
Graduate School of Management of Technology, Korea University, 145 Anam-ro, Seongbuk-gu, Seoul 02841, South Korea
2
Technology Appraisal Department, Korea Technology Finance Corporation, 33 Munhyeon Geumyung-ro, Nam-gu, Busan 48400, South Korea
3
School of Industrial Management Engineering, Korea University, 145 Anam-ro, Seongbuk-gu, Seoul 02841, South Korea
*
Author to whom correspondence should be addressed.
Sustainability 2017, 9(10), 1783; https://0-doi-org.brum.beds.ac.uk/10.3390/su9101783
Submission received: 19 August 2017
/
Revised: 17 September 2017
/
Accepted: 29 September 2017
/
Published: 1 October 2017
(This article belongs to the Section Economic and Business Aspects of Sustainability)
Abstract
:This study aims to determine the influential factors on the market share of electric vehicles through panel data analysis based on time series data from 2011 to 2015 in 31 countries. We selected five significant independent variables that are expected to affect electric vehicle adoption based on literature review. The econometric model in this study suggests that the relative price of electric vehicle compared to internal combustion engine vehicle, driving range, and number of models available in markets are correlated to the market share of electric vehicles. On the other hand, relationship between recharging infrastructure—an important factor for electric vehicle adoption in many studies—and market share of electric vehicles turned out to be insignificant in this study. From a political point of view, we argue that policy makers need to allocate more resources to research and development in order to extend driving range at the early stage of electric vehicle deployment in the markets.
1. Introduction
As concerns about global warming arise, many countries around the world are setting regulations and policies to mitigate climate change. In the transportation sector, governments are introducing market-pull and technology-push policies to have car manufacturers develop eco-friendlier vehicles as one of the eco-innovation initiatives. The objectives of promoting eco-friendly vehicles are to reduce oil consumption and air pollution, and stake out an industrial leadership position in advanced technologies [1,2].
Car manufacturers pursue eco-innovation to comply with regulations set by governments as technology-push policies. Car manufacturers develop fuel-efficient technologies for internal combustion engine vehicles (ICEVs) as incremental innovation solutions for the short- and mid-term. On the other hand, they also develop alternative fuel vehicles (AFV) including hybrid electric vehicles (HEV), plug-in electric vehicles (PHEV), electric vehicles (EV) and fuel cell electric vehicles (FCEV). They invest a huge amount of funds in research and development in order to benefit from the effect of mitigating the stringency in terms of corporate average fuel economy by selling those products in the market. Nevertheless, there is an issue that the electrification through the diffusion of EVs collaborating with the generation of cleaner electricity is regarded as a promising pathway to mitigate air pollution from on-road vehicles and energy dependency [3].
In the early 1990s, there was an attempt to penetrate the mainstream automotive market with EVs. The American state of California led a technology-push regulation to introduce zero emissions vehicles (ZEVs) in the US during that period [4]. The California Air Resources Board (CARB) was eager to set strict regulations to make the air clean in its area provoked by vehicles’ tailpipe emissions. Coincidentally, General Motors introduced an EV concept car in the LA Auto Show (later marketed as the EV1), and it might have signaled to the CARB that EVs were ready for serial production. CARB adopted the signal into its standard and intended to initiate further R&D and sales of EVs [4]. In contrast, the European Union made it difficult to adopt a similar regulation to CARB’s ZEV mandate because there was an obvious consensus among policymakers that using incentives was more effective way of promoting eco-friendly cars than using disincentives, meanwhile national or local governments could impose a ZEV mandate [5]. After solar vehicles and lightweight EVs were displayed to the public in Europe, these eco-friendly vehicles motivated policy makers to promote mass production and commercialization [6]. This led to the support of R&D programs in Europe [4]. In the end of the attempts by the biggest automotive markets (US and EU), EVs could not penetrate ICEVs market because of its inferior functionalities compared to ICEVs and market demand uncertainty as a disruptive innovation in spite of eco-friendliness.
Disruptive technologies such as EVs face barriers in the market because they frequently compare inferiorly to existing dominant designs like ICEVs in terms of price and product functionalities [7]. For that reason, the early adopters of a disruptive innovation often pay a premium or comply with poor product function in order to enjoy the state-of-the-art technology [8]. Majority of the total population known as early or late majority adopters are far more risk-averse, and are not willing to buy an innovative product so different from the dominant design [8]. It is vital for disruptive technology products to attract enough innovators or early adopters to secure a viable market niche [9]. Eventually, car manufactures failed to achieve great success with EVs—an eco-innovation with inferior functionalities to ICEVs—in main automotive markets in the 1990s.
However, there was new momentum for transition toward electrification developed from the second half of 2000s in the transportation sector. Firstly, government regulation on the automotive industry had grown from urban air quality to concerns over climate change, which is important for sustainability and now encompasses a broader sustainability topic with attention given from production process to disposal [10]. These movements influenced policy makers to enact regulations and market instruments framework to secure substantial performance in environmental protection [11]. The Electric Vehicles Initiative (EVI) is a multi-government policy forum founded in 2009 under the Clean Energy Ministerial (CEM) which is dedicated to accelerating EVs adoption among consumers worldwide with an ambitious goal of accumulated 20 million EVs sales by 2020 [12].
Secondly, governments invest more in R&D and the provision of electric vehicle supply equipment (EVSE) than in the 1990s. In the period 2010–2011 compared to in the 1990s, thousands of projects with a far larger budget were implemented. These are significant numbers compared to the number of projects on-going in the 1990s [4]. In regard with the latter, large number of organizations including Swiss Energie, Oregon’s Portland General Electric, San Diego’s Gas and Electric Tokyo Electric Power Company are making efforts in various ways to invest in recharging infrastructure and their involvement led to gain momentum in 2010s [13].
Lastly, battery performance has improved. Major barriers for consumers’ EV adoption like expensive price of EVs and driving range anxiety are related to EV batteries directly. Once EVs production becomes large-scale, the cost differences between EVs and ICEVs may decline to below 10% of the total vehicle cost [12], making them increasingly competitive. Some researchers even suggest that EV costs may reach the level of competing ICEV within a decade [12]. Recent developments provide encouraging signs based on the financial and technological support from governments, as well as huge investment from car manufacturers and suppliers. With regard to products’ attractiveness, increasing numbers of car manufacturers have displayed various types of EV models in auto shows and have launched EVs equipped with improved battery performance. Nissan was more aggressive with its EV Leaf in making efforts to better commercialize from 2005. By 2012, consumers are able to choose between the four EV models of Renault, and the Leaf of Nissan. Especially, the Renault–Nissan alliance cooperated with Better Place and introduced new business models including the concept of swapping batteries to mitigate EV driver’s driving range anxiety even though the service is no longer available. In addition to this, Tesla Inc. (Palo Alto, California, USA) is taking a huge part of EV market share with Model S and X, featuring a longer driving range than any other EVs as a new entrant in automotive industry. Battery performance for vehicles was stimulated by EV development competition and the mass commercialization of EVs from the middle of 2000s.
With these favorable factors influencing EV penetration, EVs account for just a small fraction of the vehicle stocks (only 0.1% of cars running on the road) for all transport modes worldwide [12]. Governments face the issue of how they can efficiently allocate resources to make EVs penetrate the ICEVs market for the purpose of air quality improvement. EV penetration is regarded as being very limited without stimulation from influential factors like emissions regulations, financial incentives, and rising oil prices [14,15].
To date, however, little attention has been given to empirical research determining the influential factors on consumers’ EV adoption because of insufficient sales data in the market. Especially, the effect of battery performance on EV sales remains largely unstudied with real market data, even though an empirical study found that financial incentives, EVSEs, and the local presence of production sites were positively correlated with EV penetration [16].
This paper aims to contribute to the literature by examining to what extent battery performance accounts for consumers’ EV adoption compared to incentives, infrastructure and available models in the market.
2. Literature Review
2.1. Incentives
Influential factors in consumers’ EV adoption can be categorized into three main sets of elements: incentives, EV characteristics, and customer characteristics. Governments play a pivotal role in technological transitions such as EVs’ penetration into ICEV markets [9,17,18]. These researchers foresee a role of governments in moderating the innovation activities of the various factors involved—in particular through the creation of niche market in which systemic innovations are protected in their early stages; for example, through financial incentives or rebates [18,19]. As shown in Table 1, each country makes decisions to provide financial incentives such as purchase rebate, registration tax benefit and ownership tax benefit, and non-financial incentives including free parking, bus lane use, reserved parking spot, and other benefits. This reflects the distribution of competences on tax-related instruments [12].
2.2. EV Characteristics
Despite various government supports aimed at promoting car manufacturers’ innovation and consumer demand, a remarkable transition has not yet happened in the automotive market [20]. Kemp et al. [18] claimed that car manufacturers in the automotive industry tend to have a vested interest and defend their competitive current positions by forming barriers to change because they would like to keep their market shares. However, these incumbents acknowledge the need to come up with EVs in order to survive in the long term. This is reflected in a dramatic increase in EV sales in recent years [12]. Regardless of the tangible motivation for car makers to invest, the question remains how they can make EVs, which are based on potential disruptive technology, attractive to mainstream customers [21].
Therefore, the technological and commercial characteristics of EVs are the second set of elements. In this regard, battery performance and cost of EVs are the main factors in the success of EVs’ penetration [4]. Driving range limitation, recharging time, acceleration, and driving cost savings are related with battery performance, whereas the price of EVs is significantly dependent on battery price. Out of the EV characteristics, driving range limitation and battery price are identified as the primary barriers to make EVs successful in the market.
Hidrue at al. [22] insisted that consumers’ main concerns about EVs are long recharging time, driving range limitation, and high price. In a recent working paper [12], EVs offer much lower ownership costs than comparable ICEVs powered by gasoline or diesel thanks to continually increasing efficiency as time goes by: with current taxation instruments and electricity, a 100-kilometer (km) trip would cost about 20% to 25% of the cost of ICEVs in Europe, and roughly half in the US. Therefore, the study claims that driving range limitation and vehicle costs—both of which can be caused by the high cost of battery—were major obstacles for higher adoption of EVs over the past years. Consumers rarely make purchasing decisions based on careful economic calculations with respect to driving cost [23,24]. Regarding acceleration and top speed of EVs, Christiansen [21] pointed out driving range is the main performance of EVs which is improving by 2 to 4 percent per year. The functionalities that are discussed in this section are crucial for EVs to penetrate mainstream automotive market.
2.3. Consumer Characteristics
The third set of elements is consumer characteristics. Survey studies are able to include socio-demographic factors, while empirical studies face difficulties in collecting suitable ex-post data from actual purchasers. Hidrue et al [22] calculated the willingness to pay for attributes of vehicles including socio-demographic factors as well as the first and second set of elements to estimate EV demand. They also found that a person’s propensity increases with age, education, and belief that gas prices will rise in the future when purchasing an EV; meanwhile, income and multiple car ownership were turned out to be insignificant. It was also identified that consumers were driven more by fuel savings than by the wish to be an environmentalist [23]. Besides, they confirmed that recharger installation at home is regarded as one of the variables increasing a consumer’s EV-orientation.
Regarding environmentalism, researchers [24,25,26,27] found that people were willing to spend a significant amount of money to reduce toxic emissions and save on gas. Green et al. [28] claimed EV early adopters are typically interested in EVs due to environmental performance and efficiency rather than product technology, styling, or other features. The lack of awareness or confidence in the technology are identified as a negative factor influencing EVs adoption [12]. From a consumer behavior perspective, consumers hardly make purchasing decisions based on careful economic calculations [23,24,29]. Therefore, car manufacturers will have to provide a more compelling value package to offset initial technological limitations [30]. According to Sierzchula et al. [16], socio-demographic factors such as income, education, environmentalism, and urban density that the literature had anticipated to be influential [31,32] are not affecting EV adoption. In addition to that, fuel price was not significant in predicting EV penetration in spite of its positive correlation to HEV adoption in other studies [32,33] based on their empirical research. Varieties of socio-demographic factors depend on the research, and the results are not in line with each other. Therefore, consumer characteristics are not included in this study in order to more focus on incentives and EV characteristics. We summarized different factors considered in previous studies in Table 2 based on the literature review.
Our analysis follows that of Sierzchula et al. [16] by using more recent data, adding EV driving range as a technology-focused factor, and eliminating less influential factors based on literature review. The factors and sources which are used in this study are descripted in Table 3. We normalize distribution of variables with logit transformation for EV (EV in this study includes only battery electric vehicles (BEVs) which need to be charged by recharging equipment and excludes plug-in hybrid vehicles (PHEVs), which are not mandatorily required to charge with EVSE) market share and z-normalization for number of fast and slow EVSE, and driving range, respectively.
3. Econometric Analysis and Results
In this section, we describe the research method and empirical dataset used in this study to analyze factors influencing EV penetration. Section 3.1 introduces the collected data. In the following sections, we describe the panel data analysis model employed in this study and discuss the results from the analysis.
3.1. Data Collection
There are few studies based on empirical data compared to survey studies [45] because EVs were started selling in a wide range of the consumer market only recently in 2010, and EV market volume was still low as of 2012 [35]. Currently, by contrast, EV sales from 2013 have been rising dramatically and new registrations of EVs increased by 70% between 2014 and 2015, with over 550,000 vehicles being sold worldwide in 2015 [12]. As EVs are being sold in many countries with meaningful volume, many researchers and institutions described in Table 3 started to provide relevant data and researches. Consequently, we could collect a dataset consisting of 31 countries with the time frame from 2011 to 2015 around the world, and our empirical study has the value of analyzing actual consumer behaviors (revealed preferences). Our statistical analysis uses the data from as many countries as possible, which are the following: Austria, Belgium, China, Croatia, Czech, Denmark, Estonia, Finland, France, Germany, Greece, Hungary, Iceland, Ireland, Italy, Japan, Korea, Latvia, Lithuania, Luxembourg, the Netherlands, Norway, Poland, Portugal, Slovakia, Slovenia, Spain, Sweden, Switzerland, the United Kingdom, and the United States, even though the eight major countries’ EV sales accounting for 90% of EV sales took place in 2015. Regarding the scope of the study, many researchers conducted their studies including EVs and PHEVs because both cars require EVSEs to recharge. We, however, embrace only EVs to focus on investigation of single charging distance of EVs excluding PHEVs, which can run without battery charging in extreme cases.
3.2. Panel Data Analysis Methodology
We employ the panel data analysis, which has more variability and allows the study of more issues than time series or cross-sectional data analysis alone [46]. Estimating dynamic models with panel data has recently been revitalized in order to analyze long-run growth in large panel countries [47,48]. This methodology is one of the statistical methods that are broadly used from social science to econometrics. The data are collected over time and over the panel consisting of countries in this study. The typical panel data analysis regression model looks like the following:
where y denotes the dependent variable and x is the independent variable. and are coefficients and represents error term while i and t are indices for individuals of panel and time. In this methodology, is significant because the assumptions for the error are determined to decide the analysis result between random effects and fixed effects. It is assumed that the error term is diverse stochastically over i or t in a random effects model. In the meantime, it is assumed that the error term is diverse non-stochastically over i or t in a fixed effects model. However, OLS (ordinary least squares) regression makes more efficient and consistent parameters than fixed or random effects models in cases where the individual effect is not valid. There are three steps to examine which test is the most appropriate for the model. F-test, Housman specification test, and Breusch–Pagan LM test have been conducted step by step to determine the best methodology for this study, and the result is described in Section 3.3. Z values explain the practical significance of coefficients and p values account for the statistical significance of coefficients.
We employed STATA/MP 14.2 (StataCorp LLC, College Station, TX, USA) to analyze the data in this study and follow the practical guidelines of the methodology provided in a prior study [39].
3.3. Analysis Results and Discussion
The all relevant variables from Table 3 were incorporated into the panel data analysis with logit transformation of EV market share, the dependent variable. The model specification to conduct panel data analysis is given as following.
where i = 1, 2, …, N represents each country and t = 1, 2, …, N denotes to the time period. and are the fixed effects for each country and deterministic trends, respectively. The parameters , , , and represent the estimates with respect to Relative Price, Fast EVSE, Slow EVSE, Range, and Availability, which are described in Table 3. The task is to estimate the parameters in model (1) and conduct panel tests on the causality relationships among the five variables (The co-integration tests and panel unit root conducted in the study are based on the analysis tool for a smaller cross-section than time span. The results gained from this study should be interpreted with a limitation because our data set involves a smaller time span than that of a cross-section [49]). The results of pooled OLS, fixed effect, and random effect model analysis are shown in Table 4.
F-test results propose fixed effect analysis because the p-value is small enough at the 0.00 level to reject the null hypothesis (H0). It was identified that random effect analysis fits with the data better than pooled OLS through Breusch–Pagan LM test result rejecting H0 at the 0.00 level. For the final stage of our analysis, we conducted a Hausman specification test to compare fixed effect and random effect models. The result showed that the random effect model fits better to the data set than fixed effect model at the 0.59 level.
Table 5 shows the results of the random effect analysis. According to the results, Relative Price and Fast EVSE are expected to decrease EV market share, whereas Slow EVSE, Range, and Availability are positively related to the market share.
3.3.1. Relative Price
As demonstrated in various studies, our results also support that Relative Price is a significant factor in increasing EV market share. Relative Price in Table 5 displays a negative relationship, meaning that market share of EV increases as relative price of EV drops, at the 0.001 level.
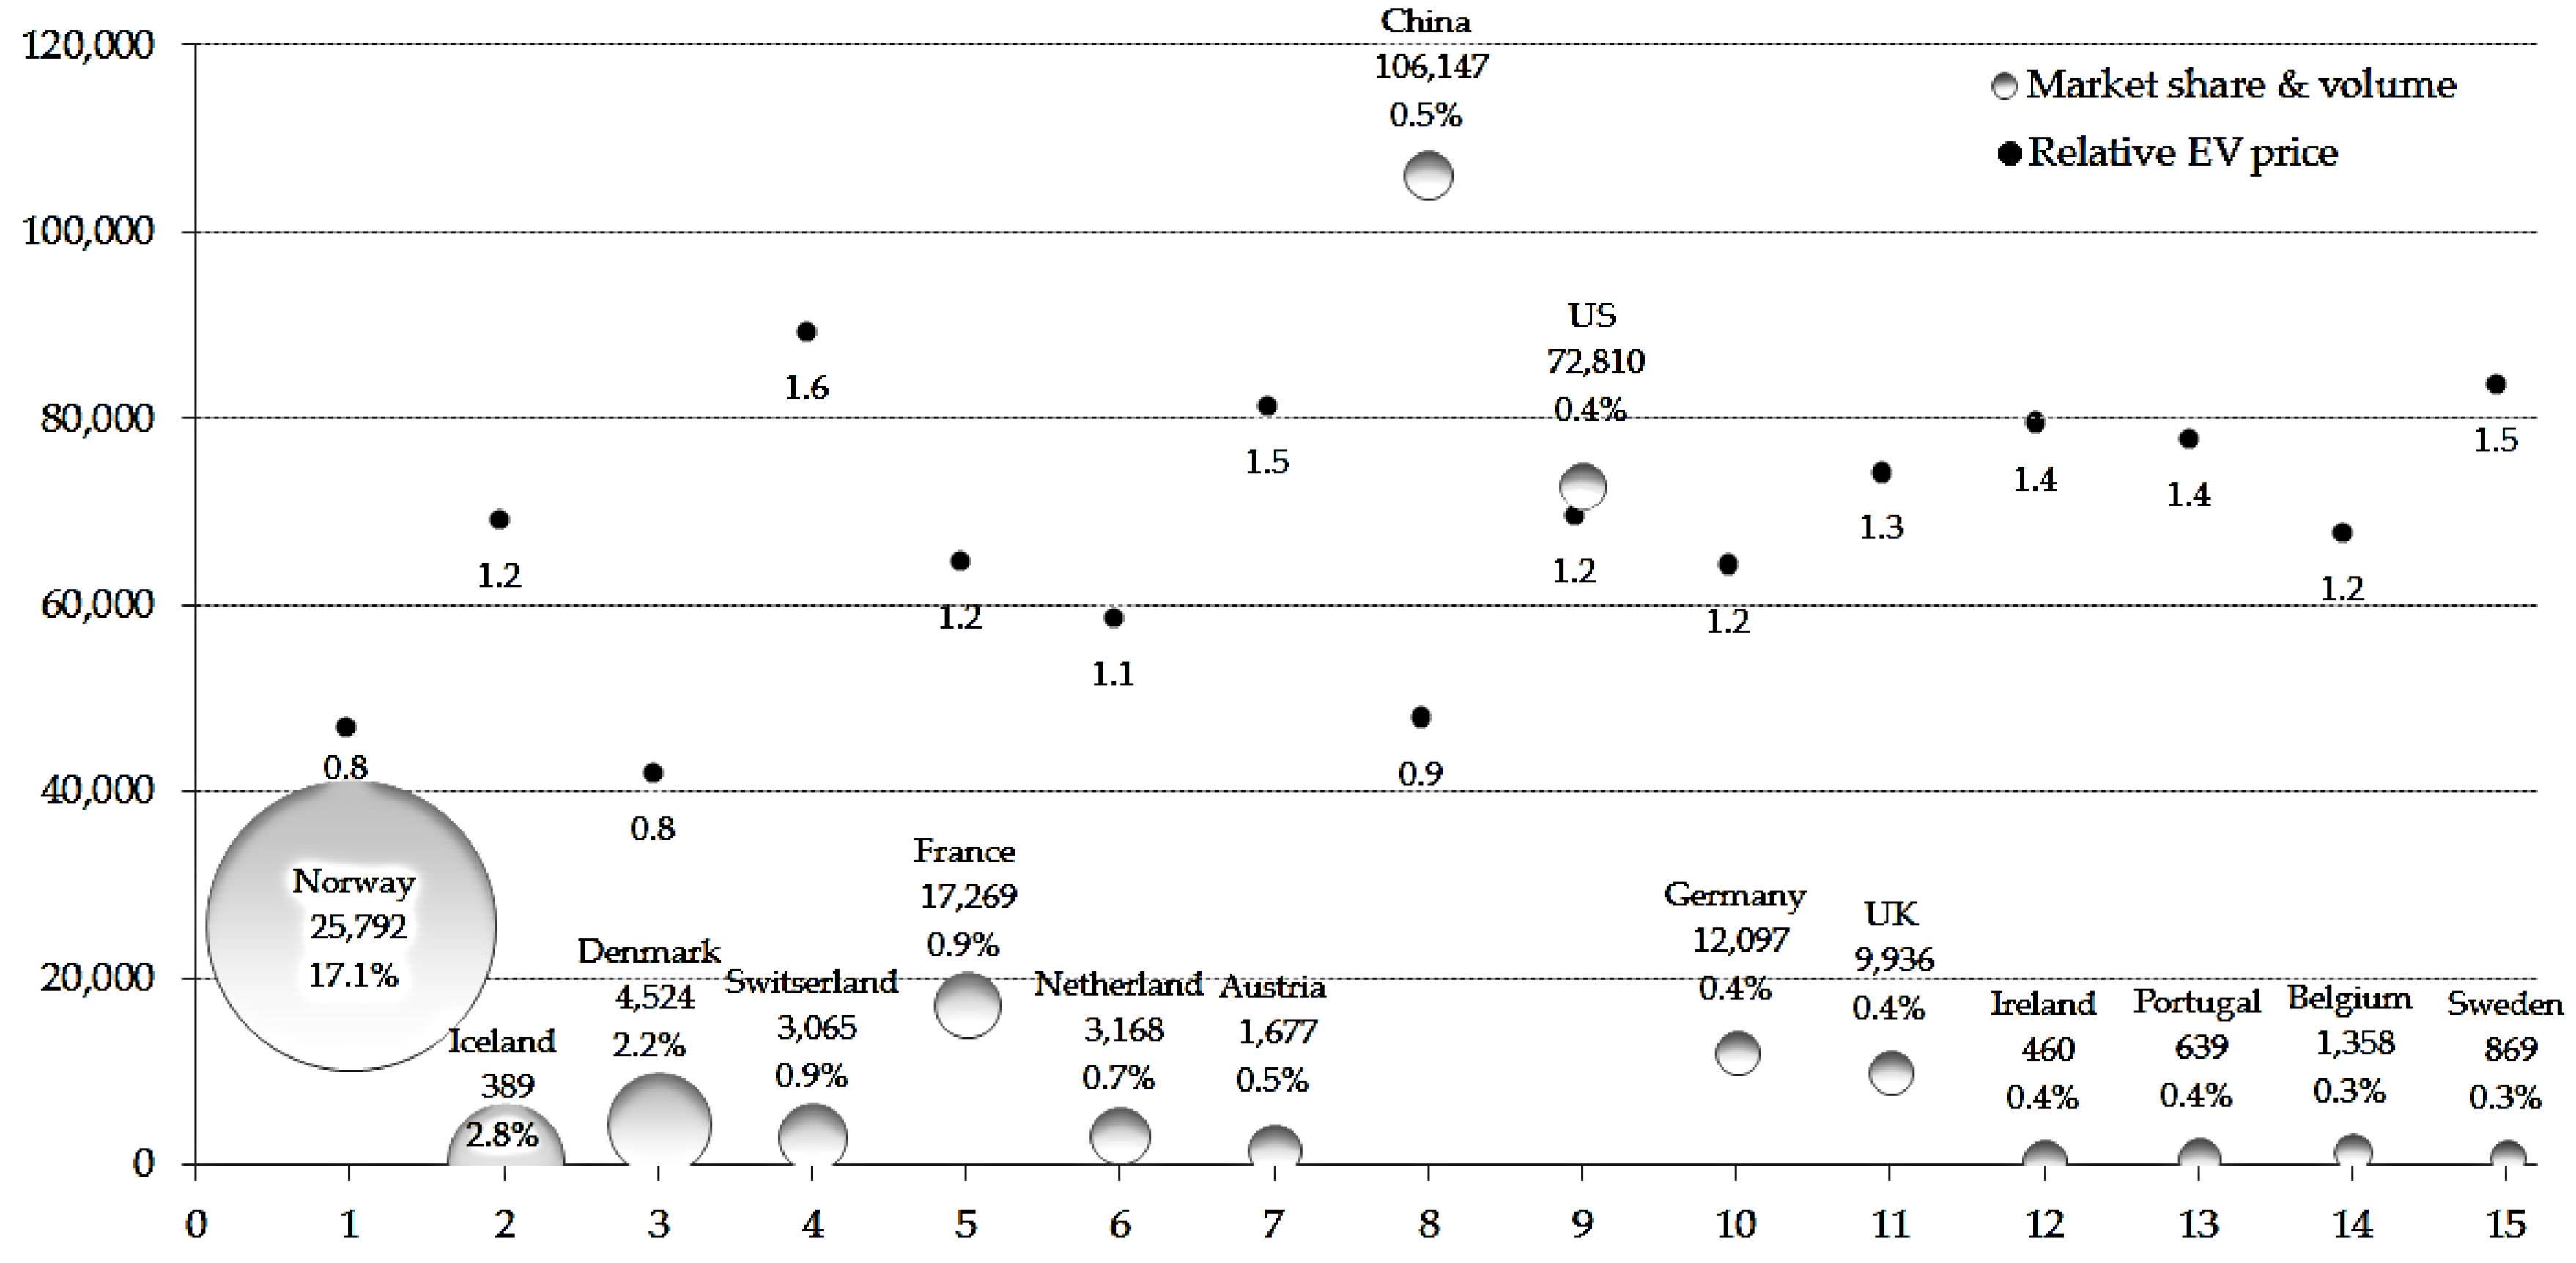
Sierzchula et al. [16] pointed out the disadvantage of its model that its empirical research model does not account for the heterogeneity of countries. Nevertheless, our model incorporates panel data analysis reflecting panel heterogeneity, this study also supports that there is a significant correlation between Relative Price and market share of EVs. Figure 1 exhibits relative EV price along with market share and sales volume in each country in 2015. As for market share and sales volume bubbles, the size represents market share and the height in y-axis shows EV sales volume in 2015 as an example. As shown in Figure 1, relative prices of EVs in China, Denmark, and Norway were lower than ICEVs thanks to the financial incentives as well as tax reductions which incentivized EV users for a few years. Meanwhile, in some countries, a certain amount of EVs were sold without any financial incentives because it was a public purchase for governments’ demonstration programs. Although our model eliminates much of the country’s heterogeneity through panel data analysis, the following important factors are worth further discussion.
First of all, the rebate’s recipients vary by country. Fleet purchasers were identified as being very important early adopters through the purchase of a majority of EVs through 2012 [50]. However, financial incentives in countries like Belgium were specifically directed toward general consumers, so they may have missed engaging fleet purchasers. Secondly, the types of financial incentives and implementations vary by country. Four types of incentives are implemented around the world: direct vehicle purchase rebate, on-time vehicle tax reduction/exemption, annual vehicle tax reduction/exemption, and income tax credit at the end of fiscal year. The rebate is the most common type of incentive for EVs, with programs in almost all countries. Thirdly, financial incentive schemes are differently organized based on EV specifications such as weight, CO2 emission, driving range, and battery specifications. For example, in order to receive rebates in China, EVs must have a range of at least 80 km and at least 50 km for PHEVs. Those country-specific heterogeneities could not be reflected in previous studies. In this study, however, we conducted panel data analysis to eliminate heterogeneities by country.
In addition to the country-specific heterogeneity, it is found that the timing of incentive payment is also regarded as an influential factor in EV adoption [51]. They claim that incentives need to be moved up front to the vehicle purchase time in order to make the EV market grow further. We were not able to include the timing of incentive payment in our model, and Relative Price was calculated simply by deducting all kinds of incentives from the original retail price. To consider monetary value of various financial incentives, we used 3-year payback period and 30% discount rate based on [16].
3.3.2. EVSE
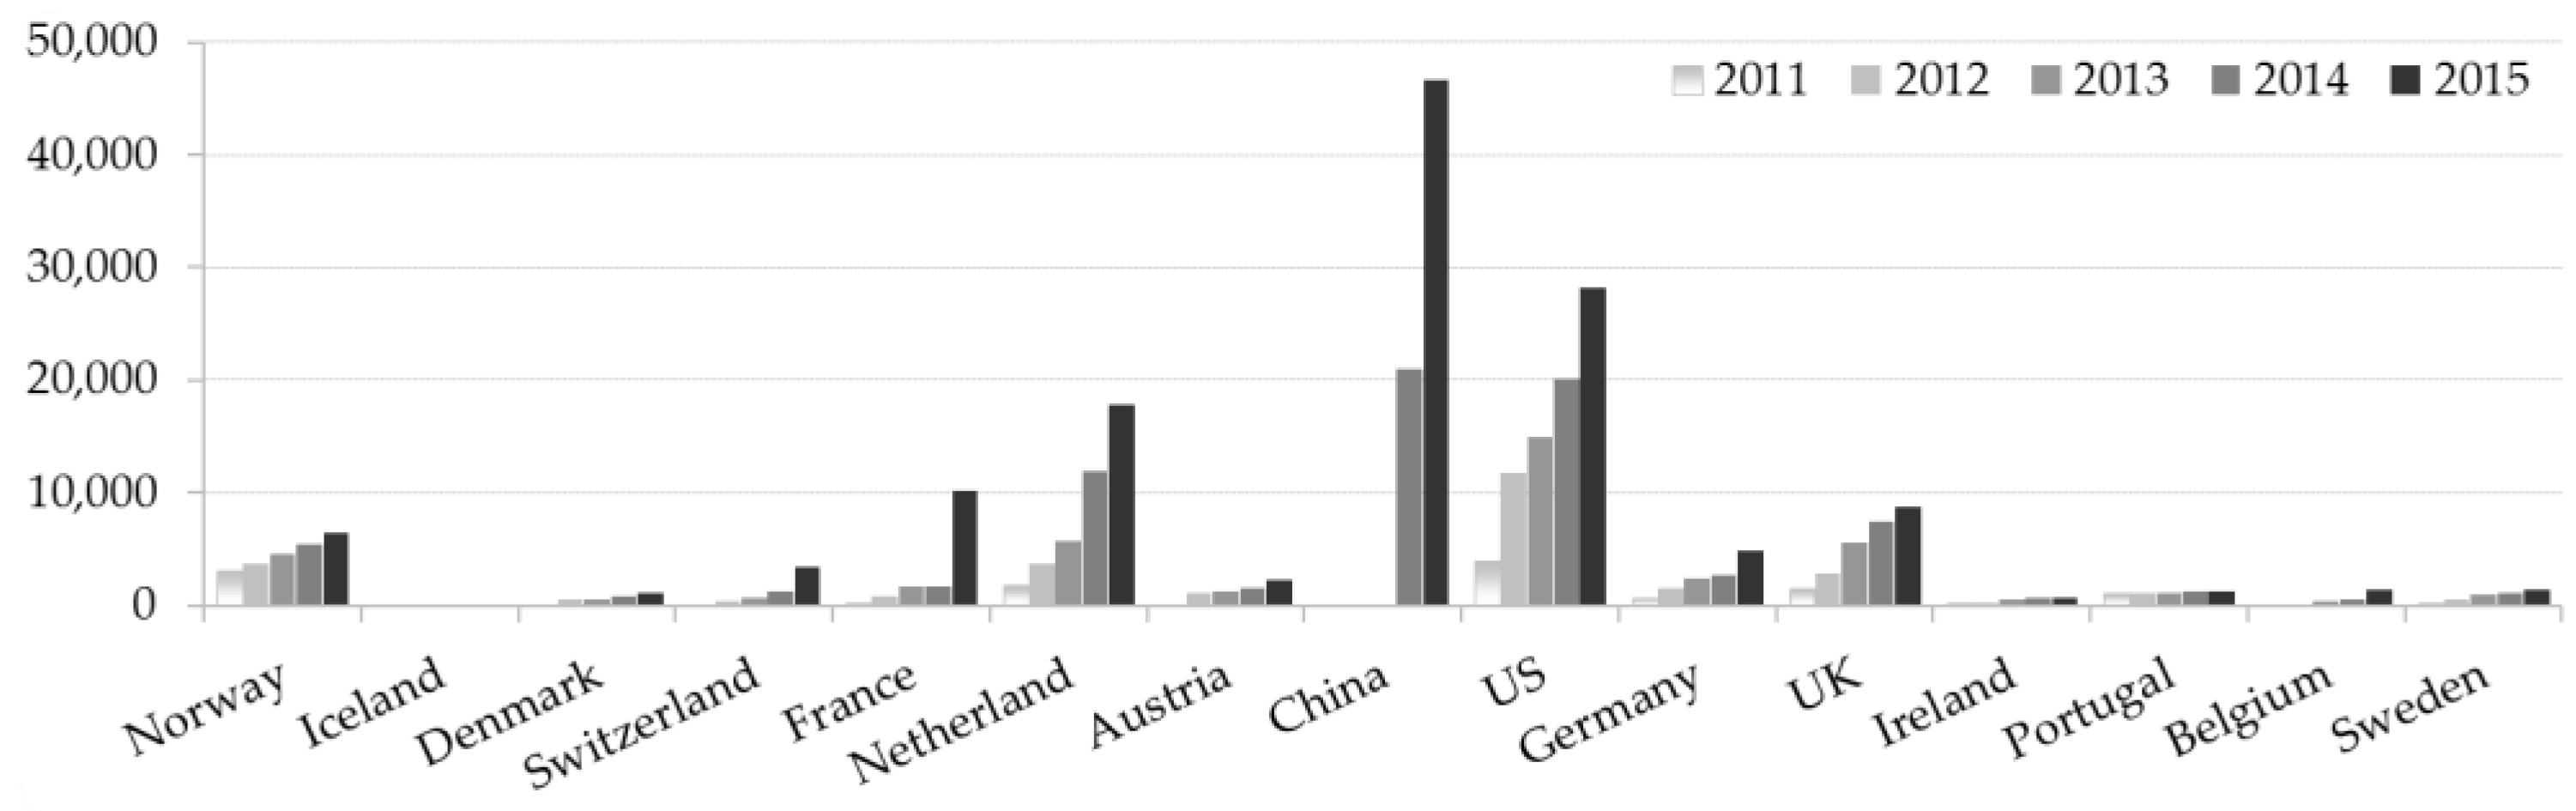
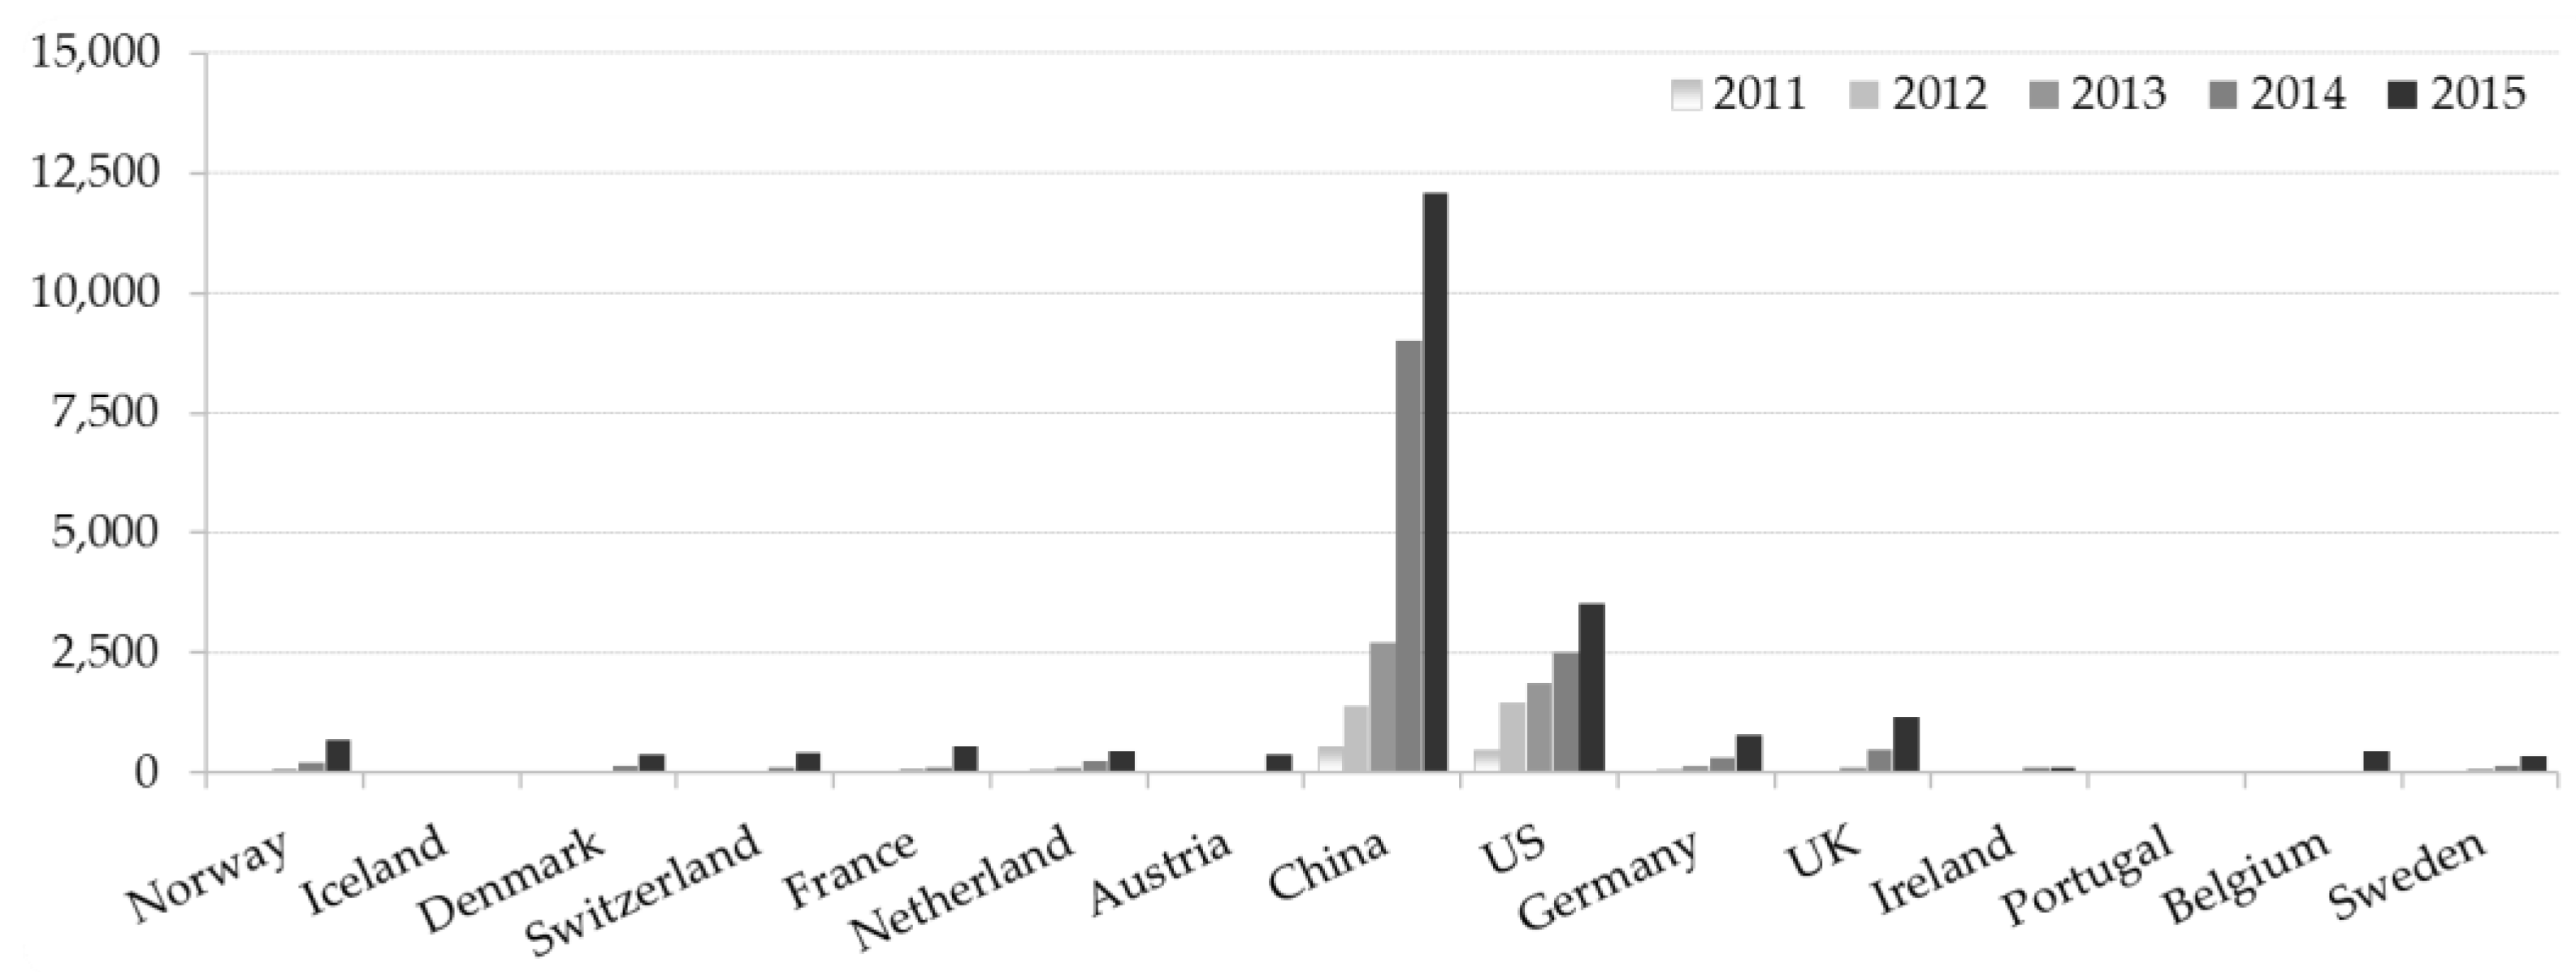
Figure 2 and Figure 3 exhibit the number of Slow and Fast EVSEs installed in each country from 2011 to 2015 which are collected in dataset for this study. As shown, the number of installed Slow EVSEs is much less than Fast EVSEs. Out of the sample countries, there are diverse heterogeneity in the number of installed EVSEs year by year in each country, and it is likely that EVSE footprint relates to all sets of political frameworks for incentives and the infrastructures of each country.
The results of panel data analysis in Table 5 exhibit a positive relationship (p-value of 0.245) between Slow EVSE and EV market share; meanwhile, there exists a negative relationship (p-value of 0.005) between Fast EVSE and EV deployment. This is interesting because EVSE infrastructure—regardless of the type—is considered as an important factor for EV adoption in many existing studies [3,15,28]. On the other hand, some researchers have a negative view of the impact of the EVSE on EV deployment. Ref. [52] identified that public EVSE is rarely used from pilot programs in Europe, and insisted that “range anxiety” is more psychological than physical. Especially, Fast EVSEs are used less than four times per day on average [52,53].
Therefore, it is better to look at Fast EVSE as auxiliary equipment for long-distance driving or urgent charging rather than essential equipment. Range anxiety may be a determinant of a consumer’s decision to purchase an EV in many surveys, but in reality consumers may want to have Slow EVSE at home or work place to resolve range anxiety rather than having Fast EVSEs in public places. It can be interpreted that the demand for long distance driving is small in the early market formation due to the driving range limitation of EVs. On the other hand, the situation may change into requiring more Fast EVSEs if consumer demand for long distance driving rises as the driving range of EVs increases.
The ratio of EV users in the U.S. charging in their garage or carport at home is 84% [34]. This also supports that consumers are heavily dependent on home charging. In addition, most daily driving range can be covered with slow home charging. In the early stage of the growth cycle of the EV market, it may be more efficient to expand Slow EVSE at home and work place rather than Fast EVSEs. Therefore, investments in public EVSE may offer marginal value in the realization of EV adoption benefit.
3.3.3. Driving Range
Previous research addressing driving range on a single charge has mainly been based on surveys. Our empirical data-based study exhibits a positive relationship (p-value of 0.0015) between driving range and EV market share. Range influences the EV market share as much as 0.3117 at the 0.01 level, and it is more than both types of EVSEs according to the Pearson correlation coefficients which are shown in Table 6.
Weighted average driving range of EVs sold in sample countries have increased from 123 km in 2011 and 258 km in 2013 to 310 km in 2015. The example of the top 15 EV market share countries out of all sample countries is exhibited in Figure 4. As one of the key EV characteristics, Range affects EV market share significantly. As [54] identified, the vast majority of daily average mileage driven by gasoline vehicle users for a 50-day experiment in the U.S. was below 100 miles, which can be converted into 161 km. It is interesting that global EV sales rose significantly from 2012, which had a driving range of 150 km.
It is well known that there is a tradeoff between battery price and capacity which is deterministic on driving range. Our empirical data and panel data analysis supports this, as shown in Table 6. Increasing the battery capacity and vehicle range of EVs will provide abilities to mitigate the demand for public Fast EVSEs and EVSEs at workplaces. Enhanced EVSE facilities around the nation will further increase the functional daily driving range of EVs and also reduce drivers’ anxiety in using the expanded EV driving range [1,55].
In fact, it has already been shown that EVSE investments are less cost-effective than increased PHEV and EV driving range, viewed in the context of reduced petroleum consumption [56]. Therefore, policy makers need to consider allocating resources more to R&D to increase battery performance for driving range extension.
3.3.4. Availability
Our analysis also confirms that there is a significant positive correlation between a country’s EV market share and the number of models available in the market at the 0.000 level. Availability also had a significant correlation with a dependent variable as well as with all other independent variables, as shown in Table 6.
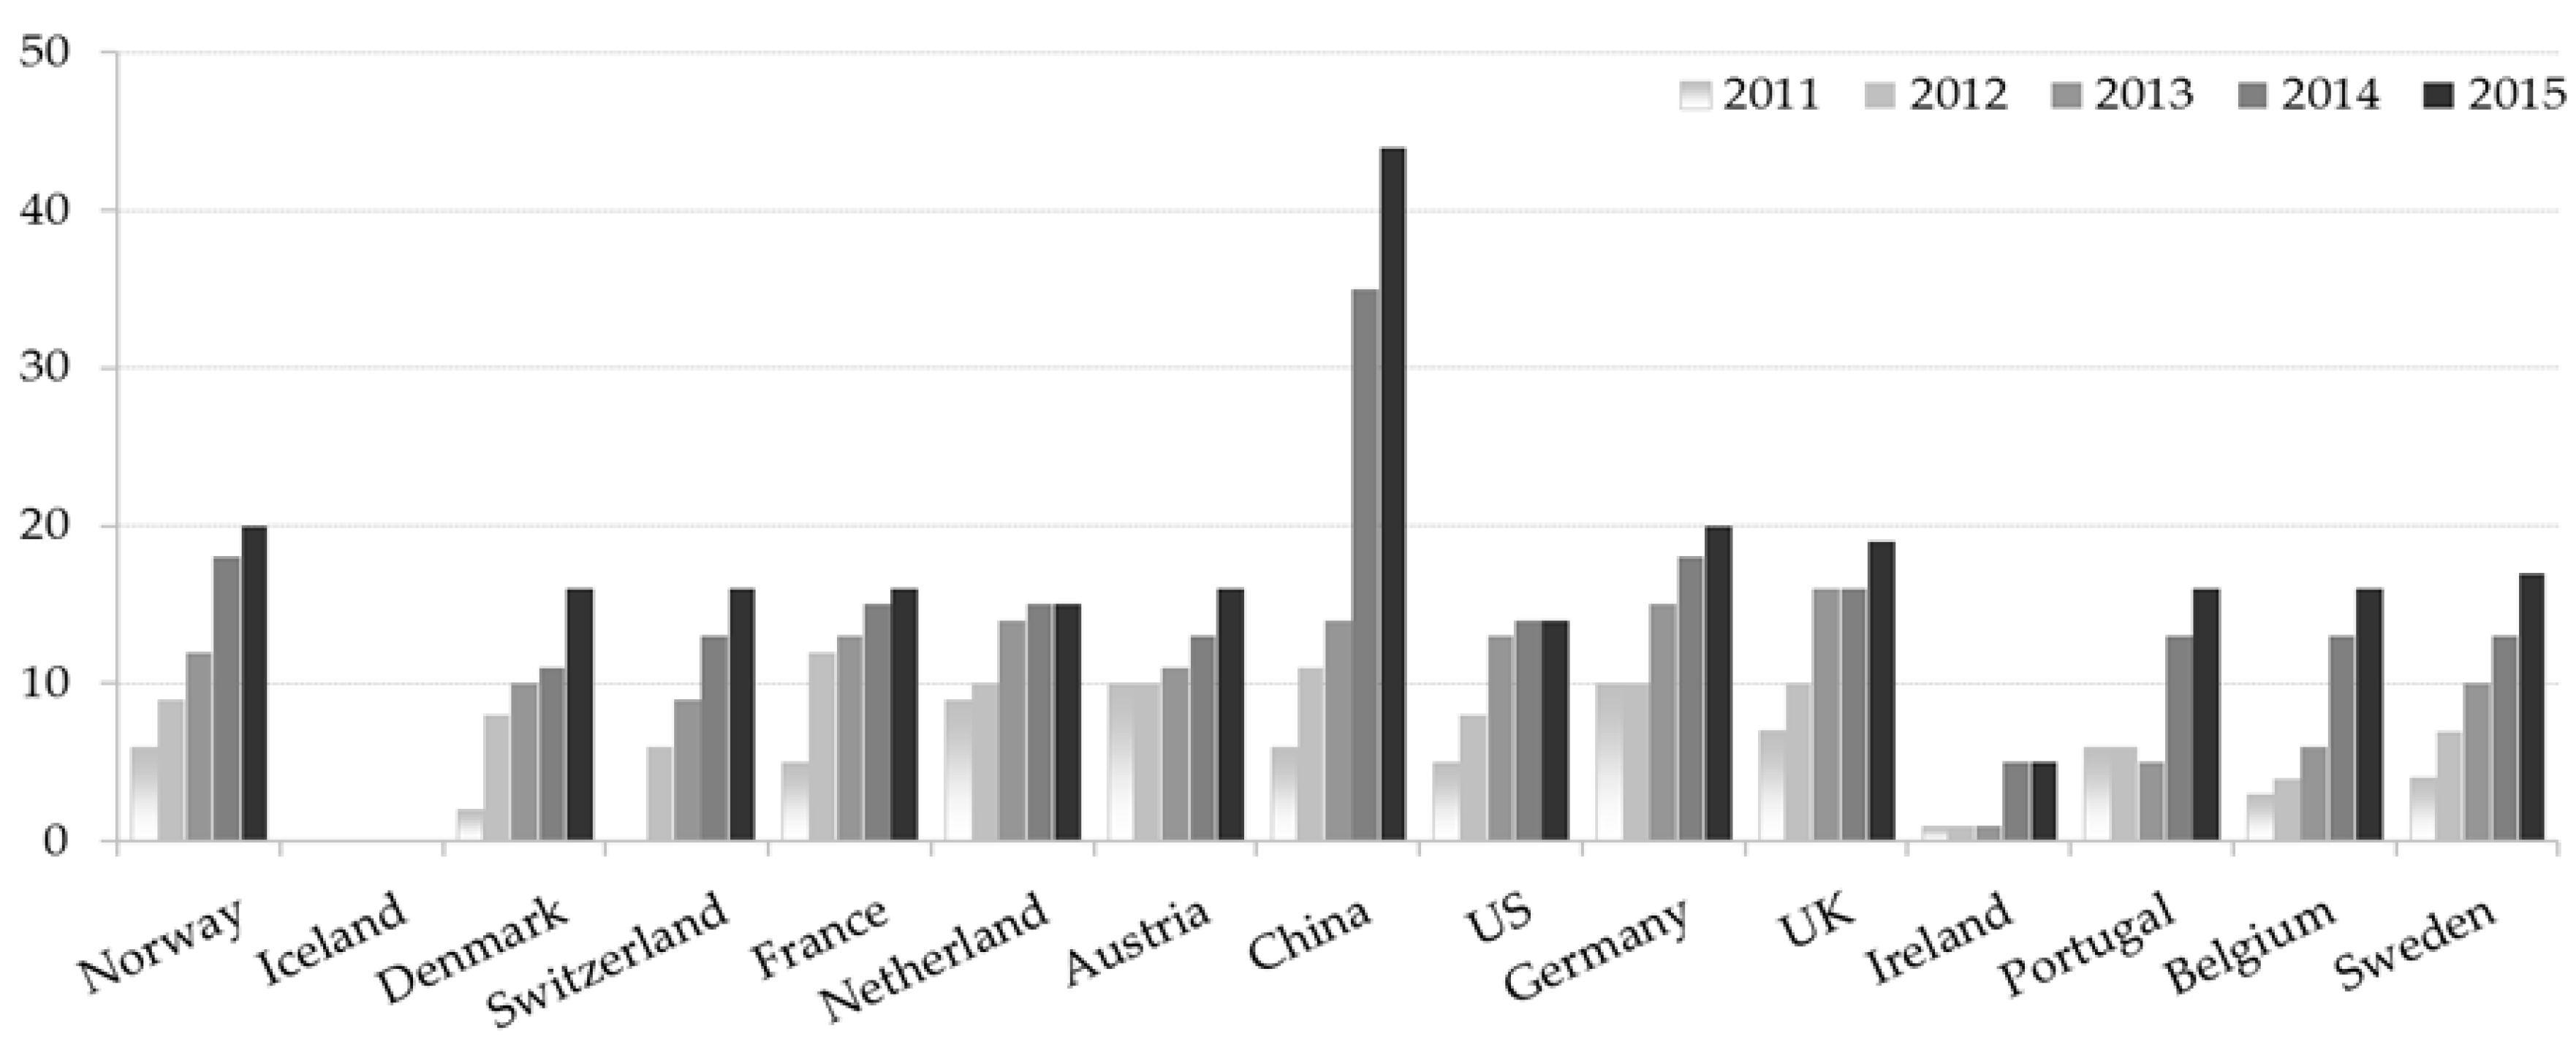
More than 60 types of EVs were available in 2015 across the countries, and the availability by country is shown in Figure 5. The BMW i3 is the only EV which was sold in all countries, and none of EVs produced in China sold in any other country except for China in 2015. In many cases, EV manufacturers are trying to experiment with the marketability of EV models with limited production before going aboard depending on incentive programs in each country [16]. In addition to the factors to consider when launching ICEVs, EV manufacturers determine whether or not to sell the vehicle considering the variety of incentive programs and the EVSE installation footprint.
As described in Table 1, types of incentives vary country by country and there are various conditions and application cases to incentivize consumers. Most countries focus on reinforcing incentive programs such as lowering the Relative Price of EVs and increasing the number of EVSEs. The results from panel data analysis and Pearson correlation coefficients show that Availability increases as the government incentive programs advance.
This suggests that more EVs are sold as the range of consumption choices in the market widens and the number of models relaxing range anxiety increases.
4. Conclusions
This study began with the question of how the technical performance of EVs—an important factor of eco-innovation product penetration in the market—has a significant impact on demand. Electric vehicle adoption began to expand in Norway, the Netherlands, and France from 2013 onwards since going on sale in earnest from 2010. Therefore, this study was conducted through panel data analysis on the factors affecting EV sales using time series data from 2011 to 2015.
This study is distinct from other studies in three dimensions. The first is that this is an empirical analysis using time series data from 2011 to 2015 when EVs started to have meaningful sales in markets. The second is that more accurate data analysis is performed by eliminating heterogeneity by country through panel data analysis. Lastly, driving range which was omitted in the previous empirical study is reflected as an independent variable.
Eco-innovation products based on clean technology require government intervention until they reach a growth phase in their product life cycle. Government incentive programs encourage the participation of product or service providers and induce competition, which helps to bring more competitive products to market. From this point of view, we can once again confirm that the incentives and the diversity of models in this study affect the demand increase of EVs positively. Meanwhile, EVSE—another resource demander for governments—turned out to not be very influential. There was a weak negative correlation in the Fast EVSE at a statistically significant level, and there was no correlation with Slow EVSE. This is interesting because it is a result contradictory to the fact that EVSE is considered an important factor for EV adoption in many existing studies. Range anxiety may be a determinant of a consumer’s decision to purchase an EV, but it does not appear to be an important parameter in the early EV market. We suggest two possible reasons that the demand for long distance driving is small in the early EV market and consumers are heavily dependent on recharging at home. In this study, we did not consider various types of EVSE standards and geographical EVSE installation heterogeneity, which might be important factors for EV recharging. In addition to this, there may be a time lag effect that remains largely unstudied. For this reason, it is difficult to conclude that EV market share and the amount of EVSEs in a country are not important factors.
When it comes to driving range, many researchers conducted survey-based studies and pointed at driving range as one of the largest obstacles to EV adoption [57]. In this study, it was identified that EV market share increased as driving range extended based on empirical data analysis. However it is found that there is a “functional threshold” for disruptive technology that satisfies customers’ minimum functional requirement [58]. Daily driving range can be regarded as reference data for the functional threshold of EV with respect to driving range [45]. According to data used in this study, the driving range on a single charge of EVs sold worldwide in 2015 was 310 km, and it is possible for marketers to target the mainstream segment because the driving range is far longer than the average daily driving range, 100 miles, in the US [45]. A compromise between increasing cost and extending driving range of EVs is decisive in which EV market grow further because there is decreasing marginal utility to increases in driving range [53]. Taking this perspective into account in future research would be meaningful for EV marketers.
Increasing battery efficiency and economies of scale become more significant in determining EV price as more and more car manufacturers make EVs. Governments need to efficiently allocate resources such as R&D support, incentive payments, and infrastructure investment to promote EVs further. R&D support is often adapted in a country when the national economy is highly dependent on the automobile industry (e.g., Germany) [53]. We propose future research focusing on the question of which part will become more efficient investment by exploring the relationship between R&D support for battery technology developments and investment in EVSE footprint expansion. This study supports the result that investment in EVSE is a less cost-effective approach than investment in increasing EV battery range [47] and we propose that policy makers reconsider the importance of R&D in terms of efficient resources allocation when establishing countermeasures to promote and sell EVs. Of course, it is pointed out that R&D support is a factor for reducing private sector R&D investment. Nevertheless, it is clear that the government’s willingness to support R&D leads to the development of related technologies by promoting the investment of other firms and institutions. Especially, it is more important to consider of the ripple effects on the national economic development in countries with high reliance on the automobile industry.
How long financial incentives to promote EVs might be prolonged? How might the incentives be incrementally reduced over time? Research answering those questions would be highly recommended in the future, because governments will face budget limitations as the EV market grows. When the battery technology level reaches a certain level, it is necessary to consider whether to reduce financial incentives.
Acknowledgments
This work was supported by under the framework of international cooperation program managed by National Research Foundation of Korea (NRF-2016K2A9A2A11938449).
Author Contributions
Chulung Lee came up with the research ideas and implemented the research project as a corresponding author. Seiho Kim conducted panel data analysis with collected data by Jaesik Lee such as policy in each country, vehicle specification and sales figures in each country. Seiho Kim wrote the paper based on advices from Chulung Lee and Jaesik Lee.
Conflicts of Interest
The authors declare no conflict of interest.
References
- Lutsey, N. Transition to a Global Zero-Emission Vehicle Fleet: A Collaborative Agenda for Governments. Available online: http://www.theicct.org/transition-global-zero-emission-vehicle-fleet-collaborative-agenda-governments (accessed on 29 September 2017).
- Zhang, X.; Xie, J.; Rao, R.; Liang, Y. Policy Incentives for the Adoption of Electric Vehicles across Countries. Sustainability 2014, 6, 8056–8078. [Google Scholar] [CrossRef]
- Li, S.; Tong, L.; Xing, J.; Zhou, Y. The Market for Electric Vehicles: Indirect Network Effects and Policy Design. J. Assoc. Environ. Resour. Econ. 2017, 4, 89–133. [Google Scholar] [CrossRef]
- Dijk, M.; Orsato, R.J.; Kemp, R. The emergence of an electric mobility trajectory. Energy Policy 2013, 52, 135–145. [Google Scholar] [CrossRef]
- Nieuwenhuis, P.; Wells, P. The Death of Motoring. Car Making and Automobility in the 21st Century; Wiley: Hoboken, NJ, USA, 1997. [Google Scholar]
- Hoogma, R. Exploiting Technological Niches: Strategies for Experimental Introduction of Electric Vehicles; Twente University Press: Enschede, The Netherlands, 2000. [Google Scholar]
- Adner, R. When are technologies disruptive? A demand-based view of the emergence of competition. Strateg. Manag. J. 2002, 23, 667–688. [Google Scholar] [CrossRef]
- Rogers, E.M. Diffusion of Innovations: Modifications of a Model for Telecommunications; Springer: Berlin/Heidelberg, Germany, 1995; pp. 25–38. [Google Scholar]
- Geels, F.W. Technological transitions as evolutionary reconfiguration processes: A multi-level perspective and a case-study. Res. Policy 2002, 31, 1257–1274. [Google Scholar] [CrossRef]
- Nieuwenhuis, P.; Wells, P.; Vergragt, P.J. Technological change and regulation in the car industry: Introduction. Greener Manag. Int. 2004, 5–12. [Google Scholar] [CrossRef]
- Orsato, R.J. What are Sustainability Strategies? Springer: New York, NY, USA, 2009; pp. 23–42. [Google Scholar]
- Global, E.V. Outlook 2016, Beyond One Million Electric Cars; International Energy Agency: Paris, France, 2016. [Google Scholar]
- Yarime, M. Public coordination for escaping from technological lock-in: Its possibilities and limits in replacing diesel vehicles with compressed natural gas vehicles in Tokyo. J. Clean. Prod. 2009, 17, 1281–1288. [Google Scholar] [CrossRef]
- Eppstein, M.J.; Grover, D.K.; Marshall, J.S.; Rizzo, D.M. An agent-based model to study market penetration of plug-in hybrid electric vehicles. Energy Policy 2011, 39, 3789–3802. [Google Scholar] [CrossRef]
- Shafiei, E.; Thorkelsson, H.; Ásgeirsson, E.I.; Davidsdottir, B.; Raberto, M.; Stefansson, H. An agent-based modeling approach to predict the evolution of market share of electric vehicles: A case study from Iceland. Technol. Forecast. Soc. Chang. 2012, 79, 1638–1653. [Google Scholar] [CrossRef]
- Sierzchula, W.; Bakker, S.; Maat, K.; van Wee, B. The influence of financial incentives and other socio-economic factors on electric vehicle adoption. Energy Policy 2014, 68, 183–194. [Google Scholar] [CrossRef]
- Geels, F.W. From sectoral systems of innovation to socio-technical systems: Insights about dynamics and change from sociology and institutional theory. Res. Policy 2004, 33, 897–920. [Google Scholar] [CrossRef]
- Kemp, R.; Schot, J.; Hoogma, R. Regime shifts to sustainability through processes of niche formation: The approach of strategic niche management. Technol. Anal. Strateg. Manag. 1998, 10, 175–198. [Google Scholar] [CrossRef]
- Smith, A.; Raven, R. What is protective space? Reconsidering niches in transitions to sustainability. Res. Policy 2012, 41, 1025–1036. [Google Scholar] [CrossRef]
- Pinkse, J.; Bohnsack, R.; Kolk, A. The Role of Public and Private Protection in Disruptive Innovation: The Automotive Industry and the Emergence of Low-Emission Vehicles. J. Prod. Innov. Manag. 2014, 31, 43–60. [Google Scholar] [CrossRef]
- Christiansen, C. The Innovator’s Dilemma; Harvard Business School Press: Boston, MA, USA, 1997. [Google Scholar]
- Hidrue, M.K.; Parsons, G.R.; Kempton, W.; Gardner, M.P. Willingness to pay for electric vehicles and their attributes. Resour. Energy Econ. 2011, 33, 686–705. [Google Scholar] [CrossRef]
- Heffner, R.R.; Turrentine, T.; Kurani, K.S. A Primer on Automobile Semiotics; Institute of Transportation Studies: Berkeley, CA, USA, 2006. [Google Scholar]
- Turrentine, T.S.; Kurani, K.S. Car buyers and fuel economy? Energy Policy 2007, 35, 1213–1223. [Google Scholar] [CrossRef]
- Brownstone, D.; Bunch, D.S.; Train, K. Joint mixed logit models of stated and revealed preferences for alternative-fuel vehicles. Transp. Res. Part B Methodol. 2000, 34, 315–338. [Google Scholar] [CrossRef]
- Bunch, D.S.; Bradley, M.; Golob, T.F.; Kitamura, R.; Occhiuzzo, G.P. Demand for clean-fuel vehicles in California: A discrete-choice stated preference pilot project. Transp. Res. Part A 1993, 27, 237–253. [Google Scholar] [CrossRef]
- Ewing, G.O.; Sarigöllü, E. Car fuel-type choice under travel demand management and economic incentives. Transp. Res. Part D 1998, 3, 429–444. [Google Scholar] [CrossRef]
- Green, E.H.; Skerlos, S.J.; Winebrake, J.J. Increasing electric vehicle policy efficiency and effectiveness by reducing mainstream market bias. Energy Policy 2014, 65, 562–566. [Google Scholar] [CrossRef]
- Heffner, R.R.; Kurani, K.S.; Turrentine, T.S. Symbolism in California’s early market for hybrid electric vehicles. Transp. Res. Part D 2007, 12, 396–413. [Google Scholar] [CrossRef]
- Barkenbus, J. Our electric automotive future: CO2 savings through a disruptive technology. Policy Soc. 2009, 27, 399–410. [Google Scholar] [CrossRef]
- Egbue, O.; Long, S. Barriers to widespread adoption of electric vehicles: An analysis of consumer attitudes and perceptions. Energy Policy 2012, 48, 717–729. [Google Scholar] [CrossRef]
- Gallagher, K.S.; Muehlegger, E. Giving green to get green? Incentives and consumer adoption of hybrid vehicle technology. J. Environ. Econ. Manag. 2011, 61, 1–15. [Google Scholar] [CrossRef]
- Beresteanu, A.; Li, S. Gasoline prices, government support, and the demand for hybrid vehicles in the United States. Int. Econ. Rev. 2011, 52, 161–182. [Google Scholar] [CrossRef]
- Tal, G.; Nicholas, M.A.; Woodjack, J.; Scrivano, D. Who Is Buying Electric Cars in California? Exploring Household and Vehicle Fleet Characteristics of New Plug-In Vehicle Owners. Available online: https://merritt.cdlib.org/d/ark:%252F13030%252Fm56692z3/1/producer%252F2013-UCD-ITS-RR-13-02.pdf (accessed on 29 September 2017).
- Stark, J.; Link, C. Modeling the Future Demand for Electric Cars—Assessing the Influence of Information and Awareness of Survey Respondents on the Model Results. Available online: http://abstracts.aetransport.org/paper/index/id/3999/confid/18 (accessed on 29 September 2017).
- Link, C.; Raich, U.; Sammer, G.; Stark, J. Modeling demand for electric cars-a methodical approach. Procedia-Soc. Behav. Sci. 2012, 48, 1958–1970. [Google Scholar] [CrossRef]
- Kveiborg, O.; Christensen, L.; Mabit, S.L. The Market for Elecric Vehicles—What Do Potential Users Want. Presented at 12th World Conference on Transportation Research, Lisbon, Portugal, 11–15 July 2010; pp. 1–25. [Google Scholar]
- European Alternative Fuels Observatory. Available online: http://www.eafo.eu/ (accessed on 29 September 2017).
- IHS Markit. Available online: https://www.ihs.com/btp/polk.html (accessed on 29 September 2017).
- European Automobile Manufacturers’ Association. Available online: http://www.acea.be/ (accessed on 29 September 2017).
- JATO Dynamics Limited. Available online: http://www.jato.com/ (accessed on 29 September 2017).
- Automotive Industry Portal. Available online: https://www.marklines.com/portal_top_en.html (accessed on 29 September 2017).
- Regulation (EC) No 595/2009 of The European Parliament and of The Council of 18 June 2009. Available online: http://eur-lex.europa.eu/legal-content/EN/TXT/PDF/?uri=CELEX:32009R0595&rid=1 (accessed on 17 September 2017).
- Greenhouse Gas Emission Standards for Light-Duty Vehicles. Available online: https://nepis.epa.gov/Exe/ZyPDF.cgi/P100PKP1.PDF?Dockey=P100PKP1.PDF (accessed on 17 September 2017).
- Sierzchula, W. Factors influencing fleet manager adoption of electric vehicles. Transp. Res. Part D 2014, 31, 126–134. [Google Scholar] [CrossRef]
- Park, H.M. Practical Guides to Panel Data Modeling: A Step by Step Analysis Using Stata; Graduate School of International Relations, International University of Japan: Minamiuonuma, Japan, 2011; pp. 1–53. [Google Scholar]
- Mankiw, N.G.; Romer, D.; Weil, D.N. A contribution to the empirics of economic growth. Q. J. Econ. 1992, 107, 407–437. [Google Scholar] [CrossRef]
- King, R.G.; Levine, R. Finance, entrepreneurship and growth. J. Monet. Econ. 1993, 32, 513–542. [Google Scholar] [CrossRef]
- Wang, S.S.; Zhou, D.Q.; Zhou, P.; Wang, Q.W. CO2 emissions, energy consumption and economic growth in China A panel data analysis. Energy Policy 2011, 39, 4870–4875. [Google Scholar] [CrossRef]
- Global, E.V. Outlook 2013, Understanding the Electric Vehicle Landscape to 2020; International Energy Agency: Paris, France, 2013. [Google Scholar]
- Yang, Z.; Slowik, P.; Lutsey, N.; Searle, S. Principles for Effective Electric Vehicle Incentive Design. Available online: http://www.theicct.org/sites/default/files/publications/ICCT_IZEV-incentives-comp_201606.pdf (accessed on 29 September 2017).
- Kley, F.; Lerch, C.; Dallinger, D. New business models for electric cars: A holistic approach. Energy Policy 2010, 1–28. [Google Scholar] [CrossRef]
- Smart, J.; Powell, W.; Schey, S. Extended Range Electric Vehicle Driving and Charging Behavior Observed Early in the EV Project; SAE International: Warrendale, PA, USA, 2013; Volume 1. [Google Scholar] [CrossRef]
- Pearre, N.S.; Kempton, W.; Guensler, R.L.; Elango, V.V. Electric vehicles: How much range is required for a day’s driving? Transp. Res. Part C 2011, 19, 1171–1184. [Google Scholar] [CrossRef]
- Bonges, H.A., III; Lusk, A.C. Addressing electric vehicle (EV) sales and range anxiety through parking layout, policy and regulation. Transp. Res. Part A 2016, 83, 63–73. [Google Scholar]
- Peterson, S.B.; Michalek, J.J. Cost-effectiveness of plug-in hybrid electric vehicle battery capacity and charging infrastructure investment for reducing US gasoline consumption. Energy Policy 2013, 52, 429–438. [Google Scholar] [CrossRef]
- Krupa, J.S.; Rizzo, D.M.; Eppstein, M.J.; Lanute, D.B.; Gaalema, D.E.; Lakkaraju, K.; Warrender, C.E. Analysis of a consumer survey on plug-in hybrid electric vehicles. Transp. Res. Part A 2014, 64, 14–31. [Google Scholar] [CrossRef]
- Adner, R.; Levinthal, D. Demand heterogeneity and technology evolution: Implications for product and process innovation. Manag. Sci. 2001, 47, 611–628. [Google Scholar] [CrossRef]
Figure 1.
EV price and sales volume of top 15 EV market share countries in 2015. The unit for Y axis is number of vehicles and the numbers in X axis indicate the rank of EV market share.
Figure 1.
EV price and sales volume of top 15 EV market share countries in 2015. The unit for Y axis is number of vehicles and the numbers in X axis indicate the rank of EV market share.

Figure 2.
Number of Slow EVSEs (Y axis) of the top 15 EV market share countries.

Figure 3.
Number of Fast EVSEs (Y-axis) of the top 15 EV market share countries.

Figure 4.
Average driving range in kilometer of EVs (Y axis) sold in each market from 2011 to 2015.
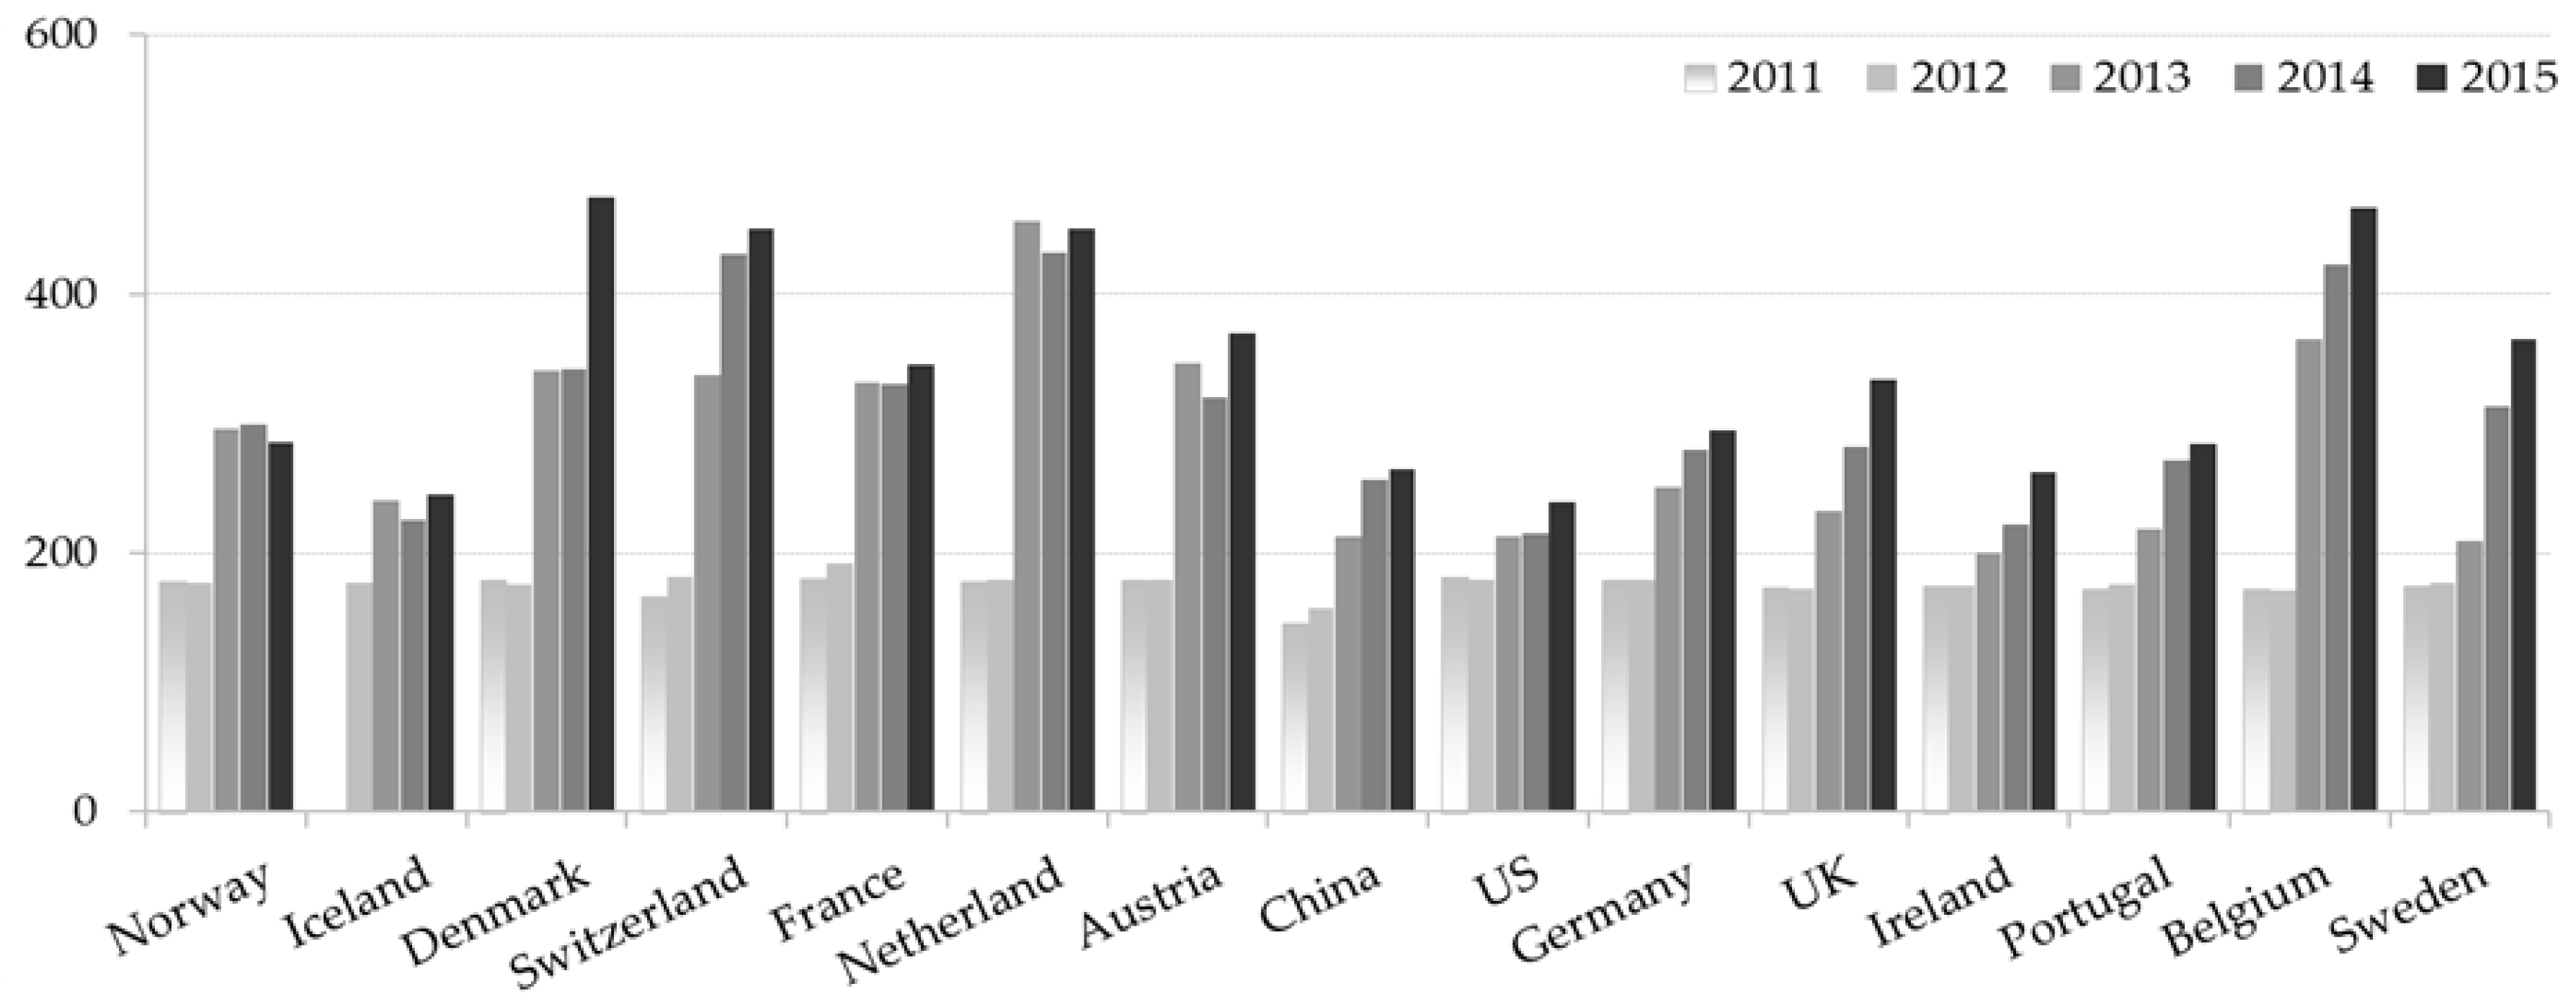
Figure 5.
Number of models (Y-axis) sold in each market from 2011 to 2015.

Table 1.
Summary of policy support mechanisms for EVs in 2015.
| Country | Purchase Rebate | Registration Tax Benefit | Ownership Tax Benefit | Non-Financial |
|---|---|---|---|---|
| Austria | O | O | O | O |
| Belgium | O | O | O | |
| China | O | O | O | O |
| Croatia | O | |||
| Czech | O | O | O | |
| Denmark | O | O | ||
| Estonia | ||||
| Finland | O | O | ||
| France | O | O | O | |
| Germany | O | O | ||
| Greece | O | O | ||
| Hungary | O | O | ||
| Iceland | O | O | O | |
| Ireland | O | O | O | O |
| Italy | O | O | O | |
| Japan | O | O | O | O |
| Korea | O | O | O | |
| Latvia | O | O | ||
| Lithuania | O | |||
| Luxembourg | O | O | ||
| Netherlands | O | O | ||
| Norway | O | O | O | |
| Poland | ||||
| Portugal | O | O | O | O |
| Slovakia | ||||
| Slovenia | O | O | O | |
| Spain | O | O | O | O |
| Sweden | O | O | ||
| Switzerland | O | |||
| The US | O | O | O | O |
| The UK | O | O | O | O |
Note: O represents the availability of respective incentive in the market.
Table 2.
Factors reviewed in past major studies. EVSE: electric vehicle supply equipment; HEV: hybrid electric vehicle.
Table 2.
Factors reviewed in past major studies. EVSE: electric vehicle supply equipment; HEV: hybrid electric vehicle.
| Study | Factors Reviewed |
|---|---|
| [16] | financial incentives, urban density, education level, environmentalism, income, fuel price, EV price, presence of production facilities, per capita vehicles, EV model availability, EV introduction date, recharging infrastructure, electricity price |
| [34] | income, EVSE at home, house ownership, mileage traveled, level of hybrid ownership, tendency to buy more new cars, ownership rate of solar panels |
| [35,36] | purchase price, range, CO2 emission performance, engine power, time for charging/refueling, and running costs |
| [37] | price, running cost, driving range, acceleration, accessibility to recharging, |
| [22] | price, driving range, charging time, acceleration, fuel cost, pollution emitted, age, education, gasoline price change expectation, environmental sensitivity, preference to HEV, preference to small and mid-sized car, charger at home, innovation acceptance tendency |
| [25] | price, range, home refueling time, home refueling cost, service station refueling time, service station refueling cost, service station availability, acceleration, top speed, tailpipe emission, vehicle size, body type, luggage space |
| [27] | price, fuel cost, repair and maintenance cost, commuting time, acceleration, range, charging time |
| [26] | price, fuel cost, range, acceleration, fuel availability, emission reduction |
Table 3.
Factors and sources.
| Factor | Description | Source |
|---|---|---|
| SoM_logit | Logit value of EV market share in each country | [38,39,40] |
| Relative Price | Relative EV a price including financial incentives and tax reductions/exemptions effect to price of internal combustion vehicles in a given country | [38,40,41] |
| Fast EVSE | The number of EVSE b at fast speed in a country | [12,38] |
| Slow EVSE | The number of EVSE b at low speed in a country | [12,38] |
| Range | Weighted average driving range c with single charge of EVs sold in each market | [38,41,42] |
| Availability | Number of EV models available in a country | [38,39] |
a Nissan Leaf was compared with Nissan Sentra or similar cars in a similar car segment. In case different taxation and incentive policies are applicable by local government, average value is applied to country; b One EVSE with multiple outlets is counted as one; c The driving range offered by New European Driving Cycle (NEDC) [43] of EU used in the data. In case that NEDC value for a centain EV is not available, Environmental Protection Agency(EPA) test cylcle [44] value is used muliplying 1.38 that is the average range difference of 13 vehicles having both of EPA and NEDC values;
Table 4.
Panel data analysis result.
| Pooled OLS | Fixed Effect | Random Effect | ||||
|---|---|---|---|---|---|---|
| Coef. | Std. Err. | Coef. | Std. Err. | Coef. | Std. Err. | |
| Relative Price | −0.5091 * | 0.2818 | −0.7146 ** | 0.2748 | −0.6383 *** | 0.1935 |
| Fast EVSE | −0.3166 | 0.2143 | −0.2903 *** | 0.1100 | −0.2674 *** | 0.0963 |
| Slow EVSE | 0.2045 | 0.2538 | 0.0994 | 0.0950 | 0.1006 | 0.0865 |
| Range | −0.1430 | 0.2517 | 0.1143 ** | 0.0557 | 0.1272 ** | 0.0522 |
| Availability | 0.0361 | 0.0260 | 0.0754 *** | 0.0118 | 0.0686 *** | 0.0106 |
| _cons | −2.5046 *** | 0.4179 | −2.5907 *** | 0.3816 | −2.6392 *** | 0.2894 |
Note: p value: 0.01—***; 0.05—**; 0.1—*. OLS: ordinary least squares.
Table 5.
Random effect analysis result.
| Independent Variable | Estimate | Z-Value | p-Value |
|---|---|---|---|
| Relative Price | −6.383 × 10⁻¹ | −3.30 | 0.001 (***) |
| Fast EVSE | −2.674 × 10⁻¹ | −2.78 | 0.005 (***) |
| Slow EVSE | 1.006 × 10⁻¹ | 1.16 | 0.245 |
| Range | 1.272 × 10⁻¹ | 2.44 | 0.015 (**) |
| Availability | 6.859 × 10⁻² | 6.49 | 0.000 (***) |
Note: p value: 0.01—***; 0.05—**; 0.1—*, R2 value (within): 0.5670.
Table 6.
Pearson correlation coefficients.
| SoM_Logit | Relative Price | Fast EVSE | Slow EVSE | Range | Availability | |
|---|---|---|---|---|---|---|
| SoM_Logit | 1.0000 | |||||
| Relative Price | −0.3346 *** | 1.0000 | ||||
| Fast EVSE | 0.1223 | −0.0566 | 1.0000 | |||
| Slow EVSE | 0.2660 *** | −0.0527 | 0.8366 *** | 1.0000 | ||
| Range | 0.3117 *** | 0.4566 *** | 0.0709 | 0.1769 | 1.0000 | |
| Availability | 0.4227 *** | 0.1937 ** | 0.5803 *** | 0.6444 *** | 0.4777 *** | 1.0000 |
Note: p value: 0.01—***; 0.05—**; 0.1—*.
© 2017 by the authors. Licensee MDPI, Basel, Switzerland. This article is an open access article distributed under the terms and conditions of the Creative Commons Attribution (CC BY) license (http://creativecommons.org/licenses/by/4.0/).
Share and Cite
MDPI and ACS Style
Kim, S.; Lee, J.; Lee, C. Does Driving Range of Electric Vehicles Influence Electric Vehicle Adoption? Sustainability 2017, 9, 1783. https://0-doi-org.brum.beds.ac.uk/10.3390/su9101783
AMA Style
Kim S, Lee J, Lee C. Does Driving Range of Electric Vehicles Influence Electric Vehicle Adoption? Sustainability. 2017; 9(10):1783. https://0-doi-org.brum.beds.ac.uk/10.3390/su9101783
Chicago/Turabian StyleKim, Seiho, Jaesik Lee, and Chulung Lee. 2017. "Does Driving Range of Electric Vehicles Influence Electric Vehicle Adoption?" Sustainability 9, no. 10: 1783. https://0-doi-org.brum.beds.ac.uk/10.3390/su9101783
Note that from the first issue of 2016, this journal uses article numbers instead of page numbers. See further details here.