R&D Project Selection Incorporating Customer-Perceived Value and Technology Potential: The Case of the Automobile Industry


Abstract
:1. Introduction
2. Background
2.1. R&D Project Evaluation
2.2. Characteristics of R&D Project Evaluation in the Automobile Industry
2.3. Customer-Perceived Value
3. Overall Research Framework
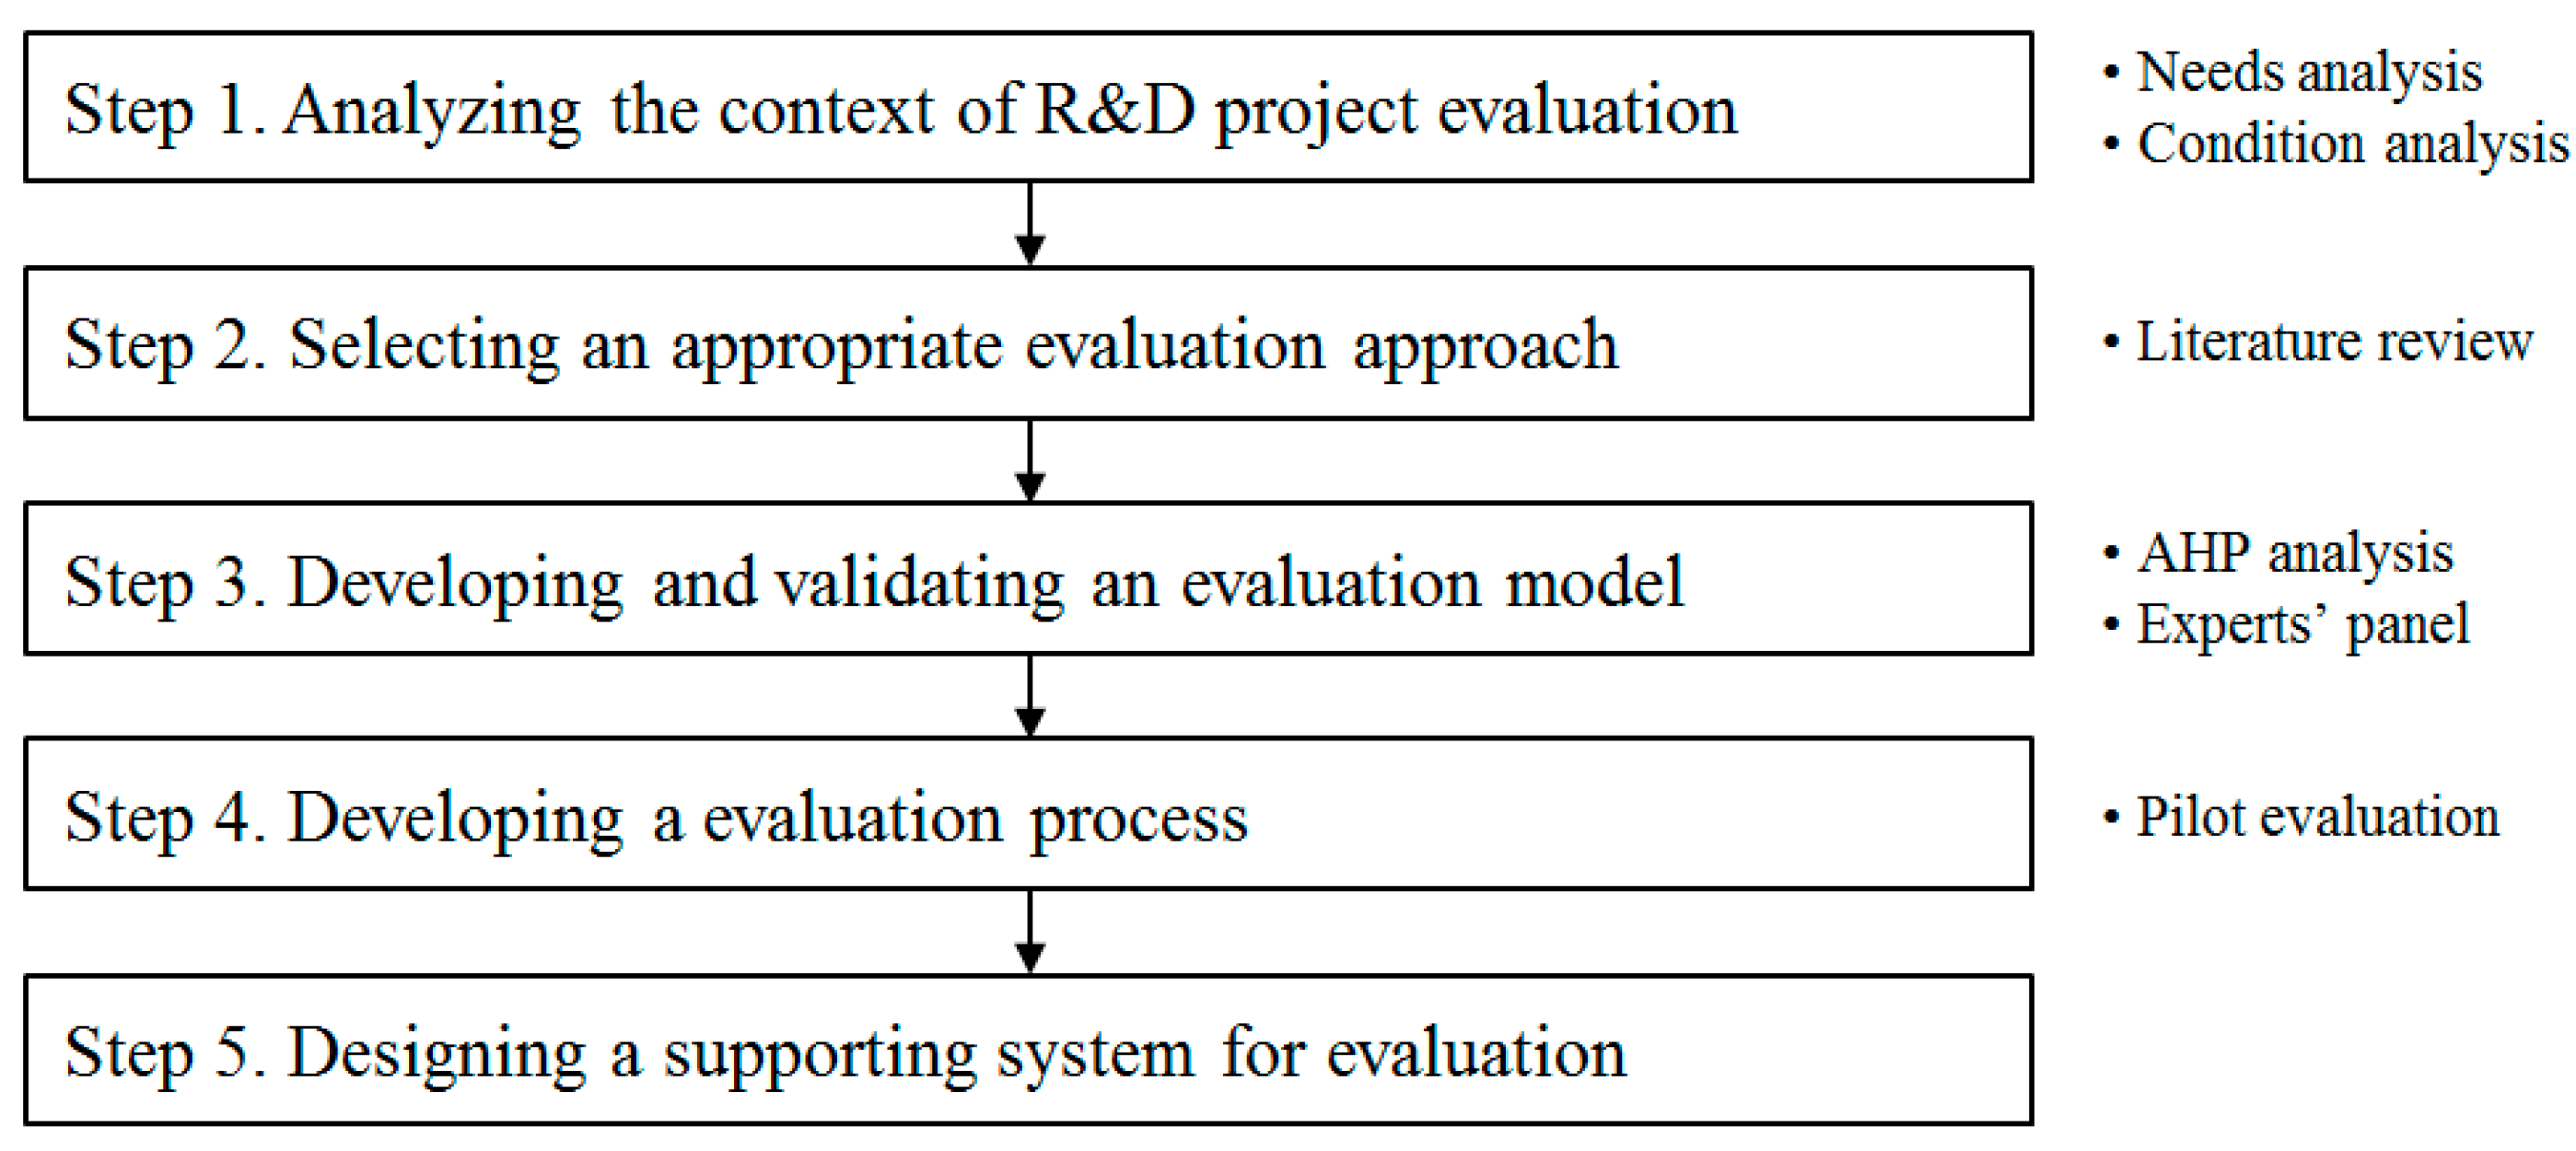
3.1. Research Process
3.2. Detailed Procedures
3.2.1. Step 1. Analyzing the Context of R&D Project Evaluation
3.2.2. Step 2. Selecting an Appropriate Evaluation Approach
- Evaluation model: financial models, scoring models, and so on.
- Participants: internal expert panels, external expert panels, customers, and so on.
- Data type for evaluation: quantitative data, qualitative data, and so on.
- Methods for evaluation: absolute value, relative value, checklist, guided scoring, and so on.
3.2.3. Step 3. Developing and Validating an Evaluation Model
3.2.4. Step 4. Developing an Evaluation Process
3.2.5. Step 5. Designing a Supporting System for Evaluation
4. R&D Project Evaluation Method
4.1. Developing and Validating an Evaluation Model
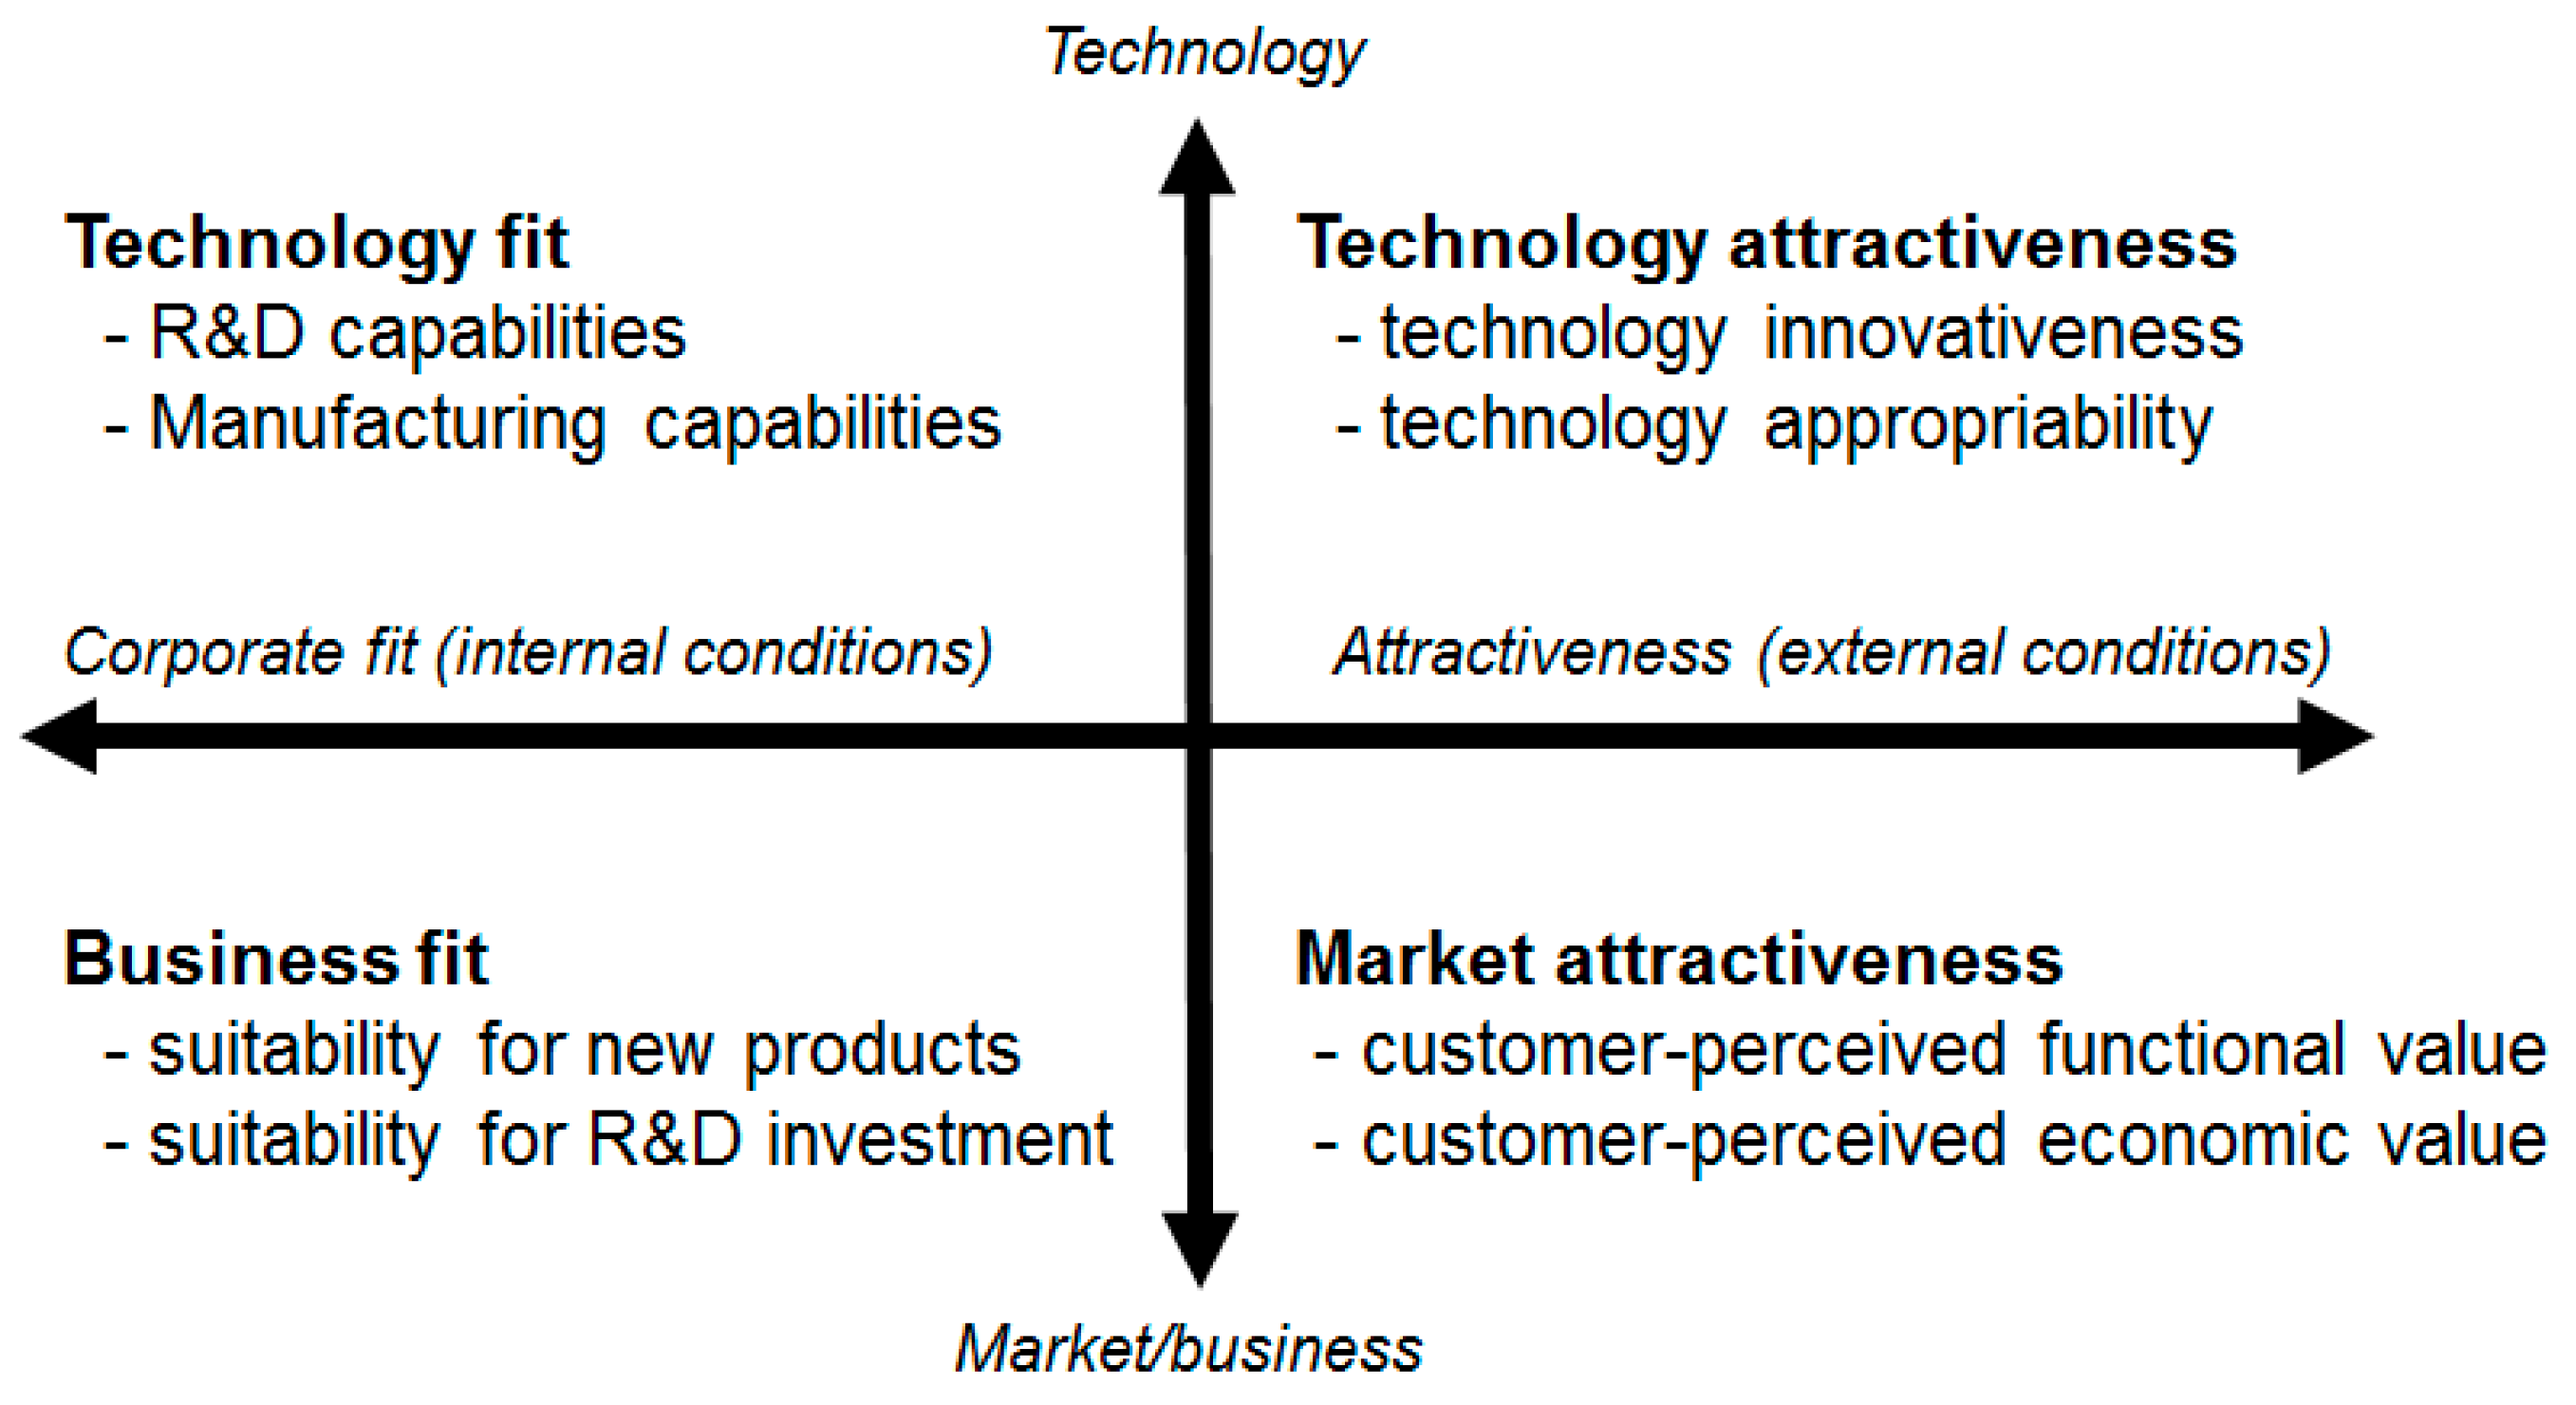
4.1.1. Evaluation Perspectives, Criteria, and Indexes
4.1.2. Verification of Evaluation Perspectives, Criteria, and Indexes
4.1.3. Weights of Evaluation Perspectives, Criteria, and Indexes
4.1.4. Pilot Test Results
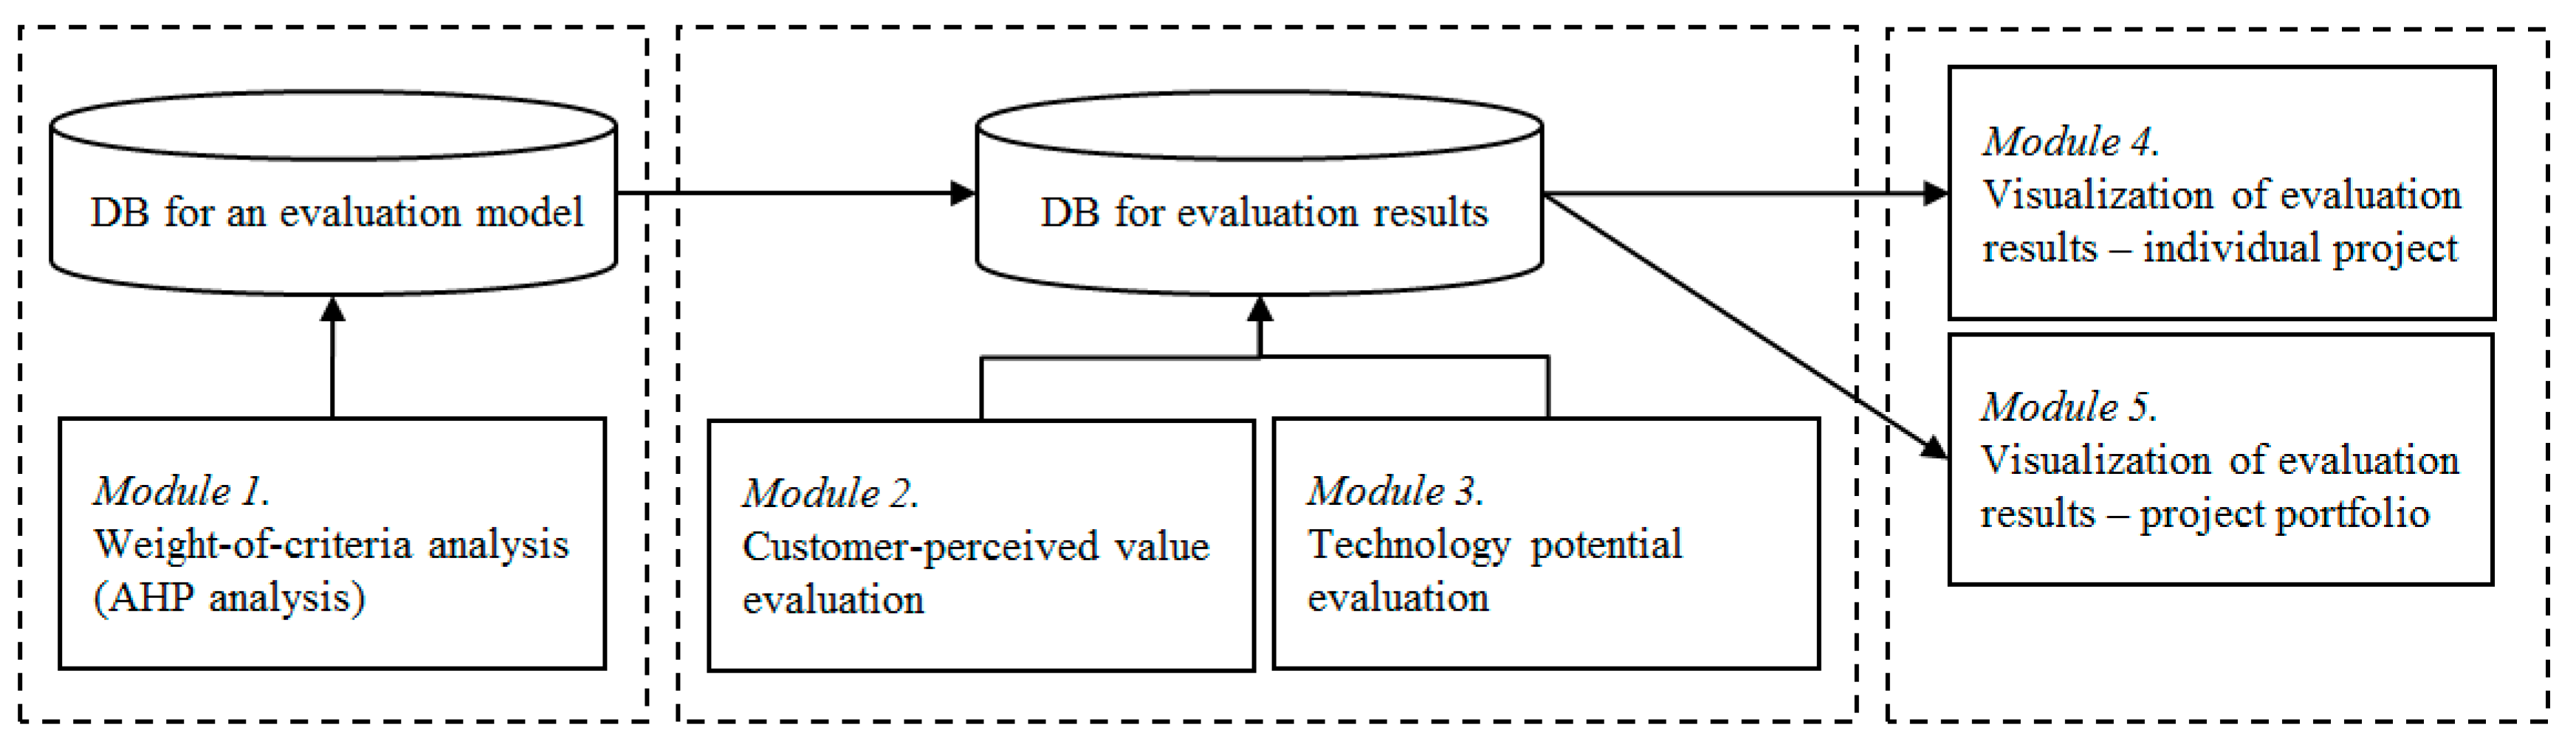
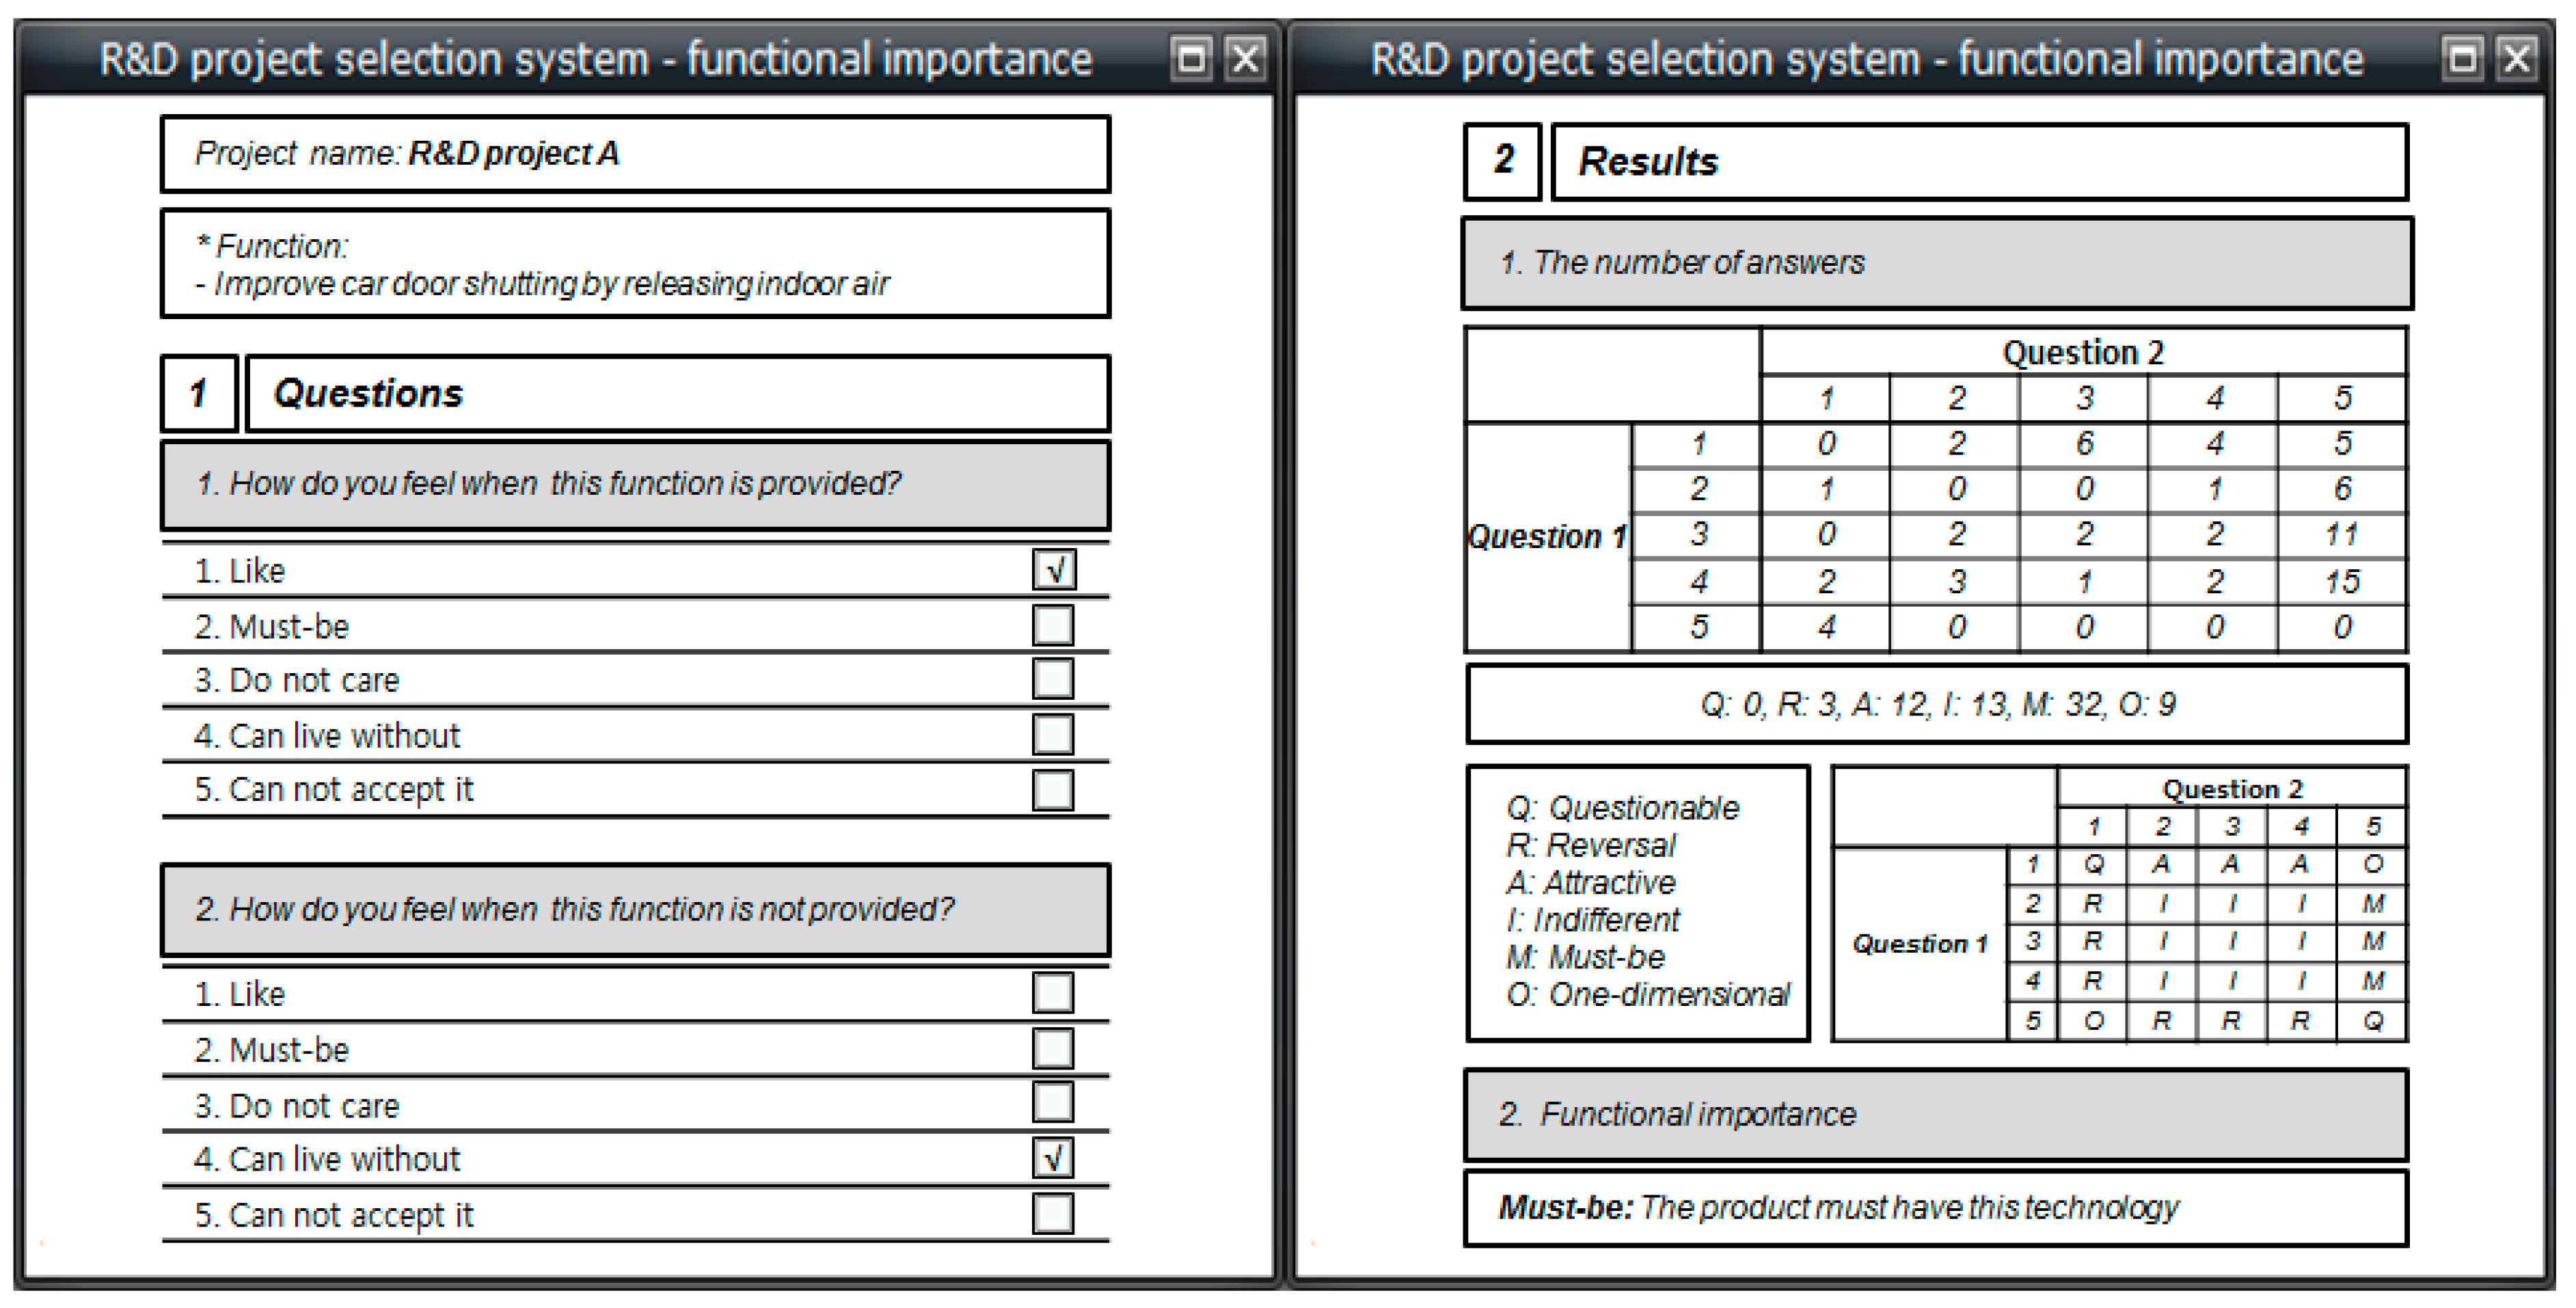
4.2. Designing a Supporting System for Evaluation
4.3. Discussions
4.4. Implications
5. Conclusions
Acknowledgments
Author Contributions
Conflicts of Interest
References
- Lawson, C.P.; Longhurst, P.J.; Ivey, P.C. The application of a new research and development project selection model in SMEs. Technovation 2006, 26, 242–250. [Google Scholar] [CrossRef] [Green Version]
- Cooper, R.G.; Edgett, S.J.; Kleinschmidt, E.J. New problems, new solutions: Making portfolio management more effective. Res. Technol. Manag. 2000, 43, 18–33. [Google Scholar]
- Wei, C.; Chang, H. A new approach for selecting portfolio of new product development projects. Expert Syst. Appl. 2011, 38, 429–434. [Google Scholar] [CrossRef]
- Chiang, T.; Che, Z.H. A fuzzy robust evaluation model for selecting and ranking NPD projects using Bayesian belief network and weight-restricted DEA. Expert Syst. Appl. 2010, 37, 7408–7418. [Google Scholar] [CrossRef]
- Oh, J.; Yang, J.; Lee, S. Managing uncertainty to improve decision-making in NPD portfolio management with a fuzzy expert system. Expert Syst. Appl. 2012, 39, 9868–9885. [Google Scholar] [CrossRef]
- Chien, C. A portfolio evaluation framework for selecting R&D projects. R&D Manag. 2002, 32, 359–368. [Google Scholar]
- Golmohammadi, A.; Pajoutan, M. Meta heuristics for dependent portfolio selection problem considering risk. Expert Syst. Appl. 2011, 38, 5642–5649. [Google Scholar] [CrossRef]
- Liberatore, M.J.; Stylianou, A.C. Expert support systems for new product development decision-making: A modeling framework and applications. Manag. Sci. 1995, 41, 1296–1316. [Google Scholar] [CrossRef]
- Schmidt, R.L.; Freeland, J.R. Recent progress in modelling R&D project-selection processes. IEEE Trans. Eng. Manag. 1992, 39, 189–201. [Google Scholar]
- Cooper, R.G.; Edgett, S.J.; Kleinschmidt, E.J. Portfolio management for new product development: Results of an industry practices study. R&D Manag. 2001, 31, 361–380. [Google Scholar]
- Henriksen, A.D.; Traynor, A.J. A practical R&D project-selection scoring tool. IEEE Trans. Eng. Manag. 1999, 46, 158–170. [Google Scholar]
- Oliveira, M.G.; Rozenfeld, H.; Phaal, R.; Probert, D. Decision making at the front end of innovation: The hidden influence of knowledge and decision criteria. R&D Manag. 2015, 45, 161–180. [Google Scholar]
- Zeithaml, V.A. Consumer perceptions of price, quality, and value: A means-end model and synthesis of evidence. J. Mark. 1988, 52, 2–22. [Google Scholar] [CrossRef]
- Woodruff, R.B. Customer value: The next source for competitive advantage. J. Acad. Mark. Sci. 1997, 25, 139–153. [Google Scholar] [CrossRef]
- Patterson, P.G.; Spreng, R.A. Including ambivalence as a basis for benefit segmentation: A study of convenience food in Norway. Eur. J. Mark. 1997, 43, 763–783. [Google Scholar]
- Tian, Q.; Ma, J.; Liang, J.; Kwok, R.; Liu, O. An organizational decision support system for effective R&D project selection. Decis. Support Syst. 2005, 39, 403–413. [Google Scholar]
- Azzone, G.; Manzini, R. Quick and dirty technology assessment: The case of an Italian Research Centre. Technol. Forecast. Soc. Chang. 2008, 75, 1324–1338. [Google Scholar] [CrossRef]
- Daim, T.U.; Intarode, N. A framework for technology assessment: Case of a Thai building material manufacturer. Energy Sustain. Dev. 2009, 13, 280–286. [Google Scholar] [CrossRef]
- Klapka, J.; Piňos, P. Decision support system for multi criterial R&D and information systems projects selection. Eur. J. Oper. Res. 2002, 140, 434–446. [Google Scholar]
- Miyazaki, K.; Kijima, K. Complexity in technology management: Theoretical analysis and case study of automobile sector in Japan. Technol. Forecast. Soc. Chang. 2000, 64, 39–54. [Google Scholar] [CrossRef]
- Pretorius, M.W.; de Wet, G. A model for the assessment of new technology for the manufacturing enterprise. Technovation 2000, 20, 3–10. [Google Scholar] [CrossRef]
- Assefa, G.; Björklund, A.; Eriksson, O.; Frostell, B. ORWARE: An aid to environmental technology chain assessment. J. Clean. Prod. 2005, 13, 265–274. [Google Scholar] [CrossRef]
- Kalbar, P.P.; Karmakar, S.; Asolekar, S.R. Selection of an appropriate wastewater treatment technology: A scenario-based multiple-attribute decision-making approach. J. Environ. Manag. 2012, 113, 158–169. [Google Scholar] [CrossRef] [PubMed]
- Meade, L.M.; Presley, A. R&D project selection using the analytic network process. IEEE Trans. Eng. Manag. 2002, 49, 59–66. [Google Scholar]
- Eilat, H.; Golany, B.; Shtub, A. R&D project evaluation: An integrated DEA and balanced scorecard approach. Omega 2008, 36, 895–912. [Google Scholar]
- Shen, Y.C.; Lin, G.T.; Tzeng, G.H. Combined DEMATEL techniques with novel MCDM for the organic light emitting diode technology selection. Expert Syst. Appl. 2011, 38, 1468–1481. [Google Scholar] [CrossRef]
- Mohanty, R.P.; Agarwal, R.; Choudhury, A.K.; Tiwari, M.K. A fuzzy ANP-based approach to R&D project selection: A case study. Int. J. Prod. Res. 2005, 43, 5199–5216. [Google Scholar]
- Altuntas, S.; Dereli, T. A novel approach based on DEMATEL method and patent citation analysis for prioritizing a portfolio of investment projects. Expert Syst. Appl. 2015, 42, 1003–1012. [Google Scholar] [CrossRef]
- Kőhler, J.; Wietschel, M.; Whitmarsh, L.; Keles, D.; Schade, W. Infrastructure investment for a transition to hydrogen automobiles. Technol. Forecast. Soc. Chang. 2010, 77, 1237–1248. [Google Scholar] [CrossRef]
- Dechezleprêtre, A.; Neumayer, E.; Perkins, R. Environmental regulation and the cross-border diffusion of new technology: Evidence from automobile patents. Res. Policy 2015, 44, 244–257. [Google Scholar] [CrossRef]
- Flood, R.; Carson, E. Dealing with Complexity; Plenum Press: New York, NY, USA, 1988. [Google Scholar]
- Berry, L.; Yadav, M. Capture and communicate value in the pricing of services. MIT Sloan Manag. Rev. 1996, 37, 41–51. [Google Scholar]
- Slater, S.F.; Narver, J.C. Intelligence generation and superior customer value. J. Acad. Mark. Sci. 2000, 28, 120–127. [Google Scholar] [CrossRef]
- Vera, J.; Trujillo, A. Service quality dimensions and superior customer perceived value in retail banks: An empirical study on Mexican consumers. J. Retail. Consum. Serv. 2013, 20, 579–586. [Google Scholar] [CrossRef]
- Walter, A.; Ritter, T.; Geműnden, H. Value creation in buyer-seller relationships. Ind. Mark. Manag. 2001, 30, 365–377. [Google Scholar] [CrossRef]
- Helander, N.; Ulkuniemi, P. Customer perceived value in the software business. J. High-Technol. Manag. Res. 2012, 23, 26–35. [Google Scholar] [CrossRef]
- García-Acebrón, C.; Vázquez-Casielles, R.; Iglesias, V. The effect of perceived value and switching barriers on customer price tolerance in industrial energy markets. J. Bus. Bus. Mark. 2010, 17, 317–335. [Google Scholar] [CrossRef]
- Parry, M.; Dawid, A.P.; Lauritzen, S. Proper local scoring rules. Ann. Stat. 2012, 40, 561–592. [Google Scholar] [CrossRef]
- Babin, B.J.; Babin, L. Seeking something different? A model of schema typicality, consumer affect, purchase intentions and perceived shopping value. J. Bus. Res. 2001, 54, 89–96. [Google Scholar] [CrossRef]
- Petrick, J.F. Development of a multi-dimensional scale for measuring the perceived value of a service. J. Leisure Res. 2002, 34, 119–134. [Google Scholar]
- Floh, A.; Zauner, A.; Koller, M.; Rusch, T. Customer segmentation using unobserved heterogeneity in the perceived-value-loyalty-intentions link. J. Bus. Res. 2014, 67, 974–982. [Google Scholar] [CrossRef] [Green Version]
- Prior, D.D. Supplier representative activities and customer perceived value in complex industrial solutions. Ind. Mark. Manag. 2013, 41, 1192–1201. [Google Scholar] [CrossRef]
- Sánchez-Fernández, R.; Iniesta-Bonillo, M.; Holbrook, M. The conceptualisation and measurement of consumer value in services. Int. J. Mark. Res. 2009, 51, 93–113. [Google Scholar] [CrossRef]
- Saaty, T.L. Fundamentals of Decision Making and Priority Theory with the AHP; RWS Publications: Pittsburgh, PA, USA, 1994. [Google Scholar]
- Mgbeoji, I. Patents and traditional knowledge of the uses of plants: Is a communal patent regime part of the solution to the scourge of bio piracy? Indiana J. Glob. Leg. Stud. 2001, 9, 163–186. [Google Scholar]
- Schilling, M.A. Protecting or diffusing a technology platform: Tradeoffs in appropriability, network externalities, and architectural control. Chapters 2009. [Google Scholar] [CrossRef]
- Farrukh, C.; Dissel, M.; Jackson, K.; Phaal, R.; Probert, D.R. Valuing technology along a timeline of technological maturity. Int. J. Technol. Manag. 2009, 48, 42–55. [Google Scholar] [CrossRef]
- Merrifield, D.B. New business incubators. J. Bus. Ventur. 1987, 2, 277–284. [Google Scholar] [CrossRef]
- Lee, S.; Park, Y. Customization of technology roadmaps according to roadmapping purposes: Overall process and detailed modules. Technol. Forecast. Soc. Chang. 2005, 72, 567–583. [Google Scholar] [CrossRef]
- Jiang, J.J.; Klein, G. Project selection criteria by strategic orientation. Inf. Manag. 1999, 36, 63–75. [Google Scholar] [CrossRef]
- Jasiński, D.; Meredith, J.; Kirwan, K. A comprehensive framework for automotive sustainability assessment. J. Clean. Prod. 2016, 135, 1034–1044. [Google Scholar] [CrossRef]
- Sachs, I. Social sustainability and whole development: Exploring the dimensions of sustainable development. In Sustainability and the Social Sciences: A Cross-Disciplinary Approach to Integrating Environmental Considerations into Theoretical Reorientation; Zed Books: London, UK, 1999; pp. 25–36. [Google Scholar]


| Perspectives | Criteria | Indexes | Description | References |
|---|---|---|---|---|
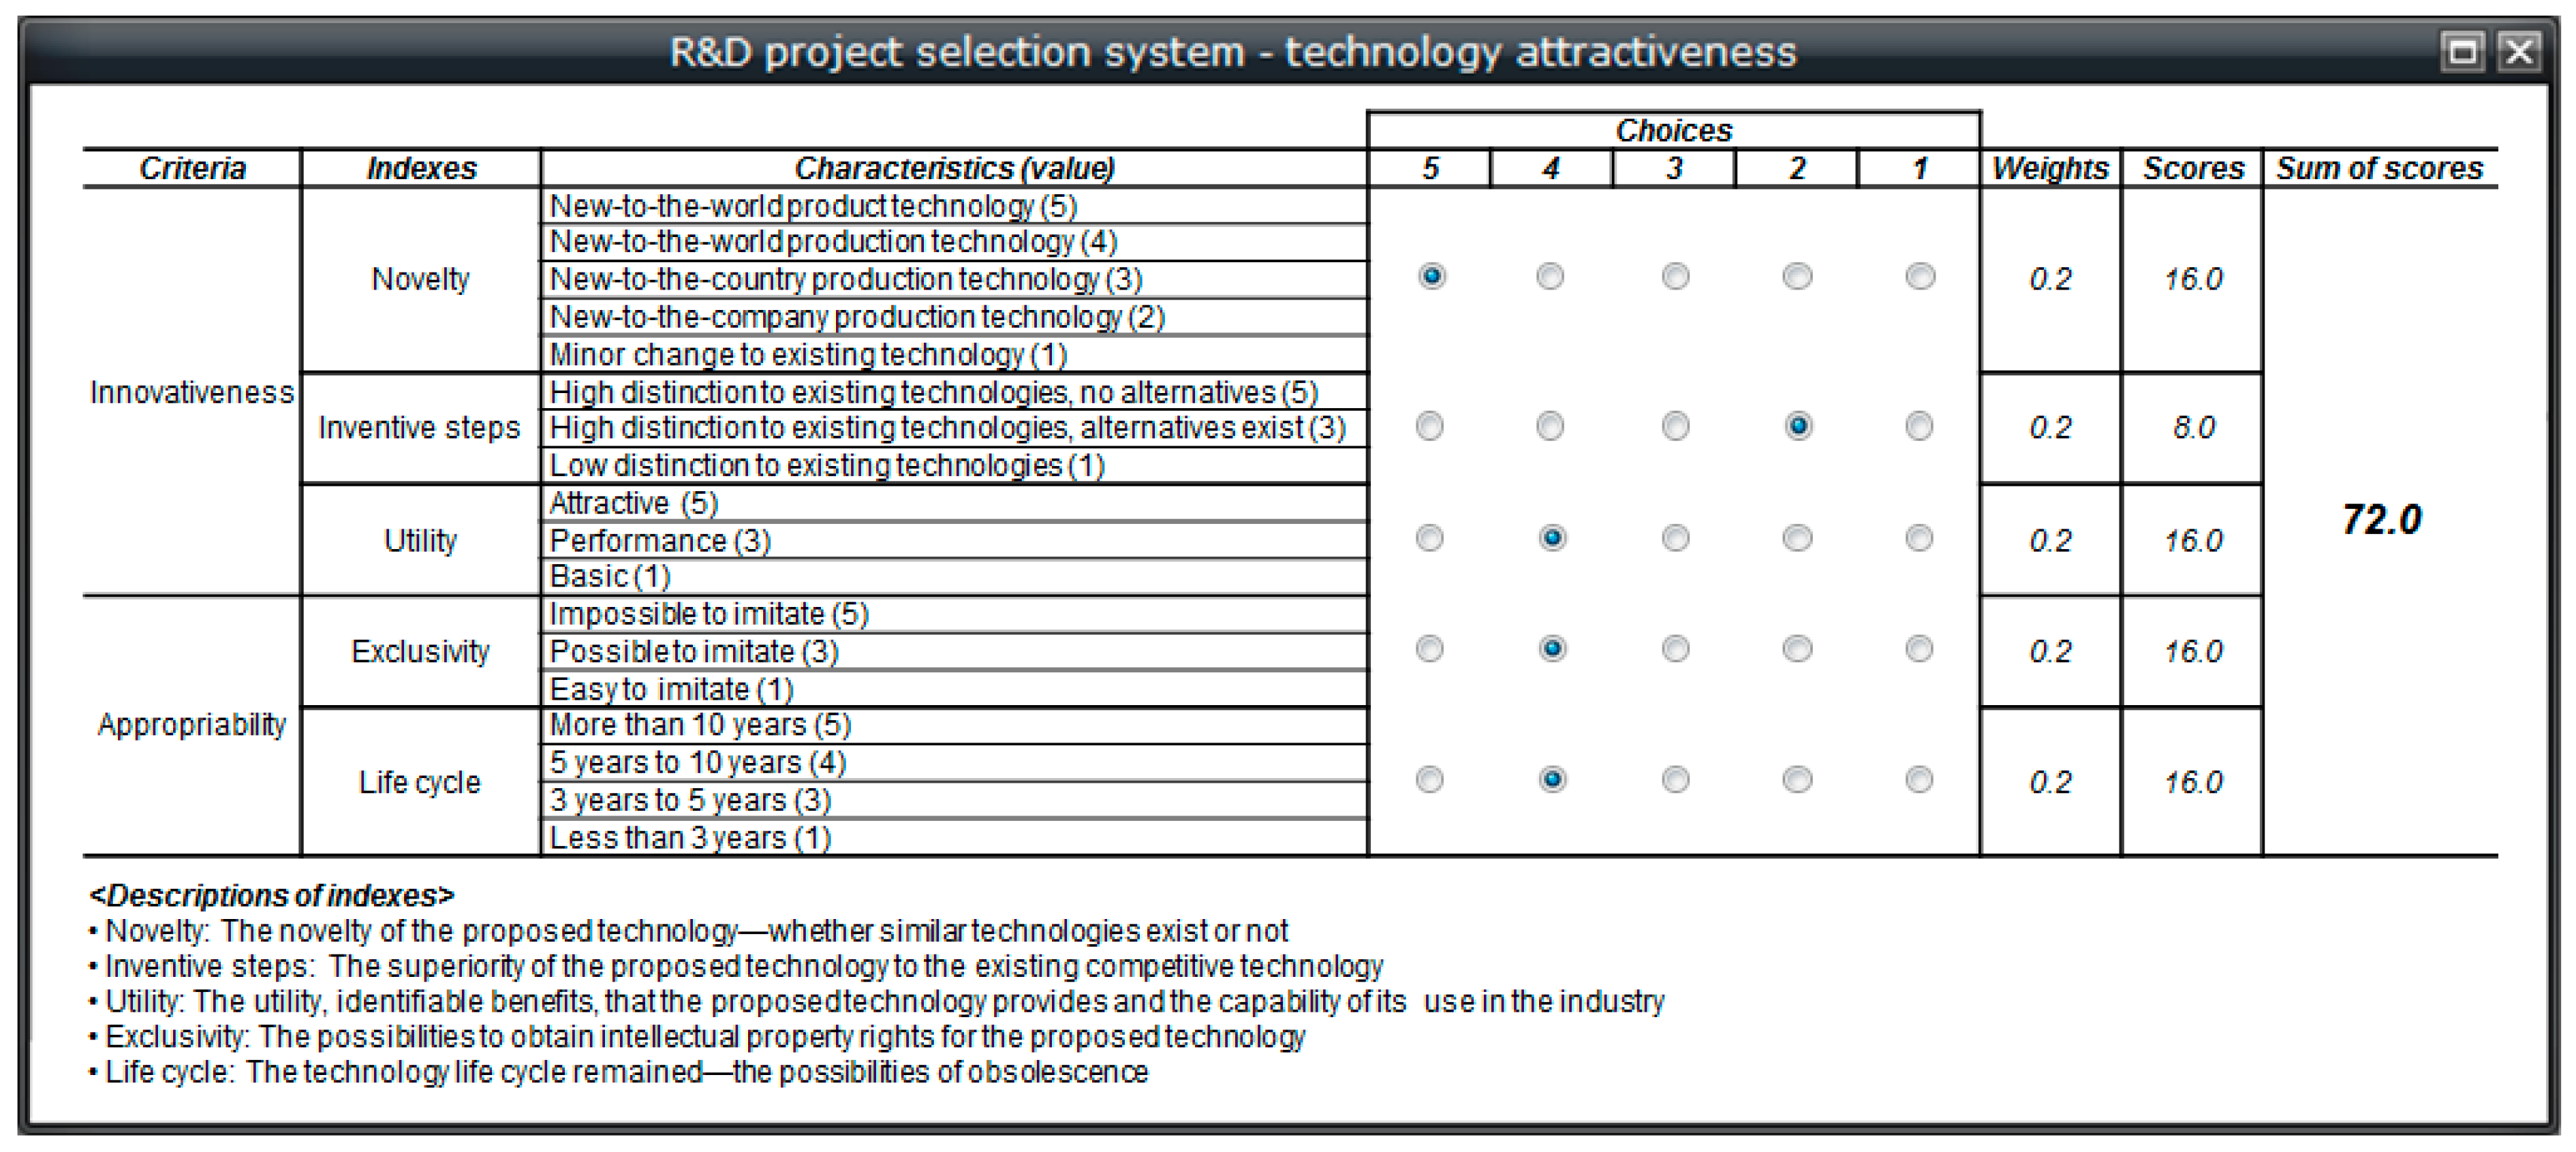
| Technology attractiveness | Innovativeness | Novelty | The novelty of the proposed technology—whether similar technologies exist or not | Patentability requirements [45] |
| Inventive steps | The superiority of the proposed technology to the existing competitive technology | |||
| Utility | The utility, identifiable benefits, that the proposed technology provides and the capability of its use in the industry | |||
| Appropriability | Exclusivity | The possibilities to obtain intellectual property rights for the proposed technology | Technology valuation [46,47] | |
| Life cycle | The technology life cycle remained—the possibilities of obsolescence | |||
| Technology fit | R&D capabilities | R&D difficulties | The difficulties in developing the proposed technology | BMO—technology capabilities [48] |
| R&D risk | Technical risk to R&D project completion (e.g., patent infringement risk, technology complexity, resource limits) | |||
| Application domain | The range of products or services to which the proposed technology can be applied—product range, growth potential, synergy with other products/processes | |||
| Manufacturing capabilities | Additional cost for manufacturing | Additional cost required to commercialize the proposed technology in new products or services—ability to implement production or service offering process (e.g., the availability of existing facilities, the size and complexity of new facilities) | BMO—manufacturing capabilities [48] | |
| Additional time for manufacturing | Additional time required to commercialize the proposed technology in new products or services | |||
| Market attractiveness | Perceived functional value | Functional awareness | The degree of recognition for the function offered by the proposed technology—the ease of awareness by users | Perceived value—functional [42] |
| Functional importance | The degree of perceived importance for the function offered by the proposed technology | |||
| Perceived economic value | Brand awareness | The possibilities of improving brand awareness through the proposed technology | Perceived value—economic [42] | |
| Intention to pay | The possibilities of directly pricing the function offered by the proposed technology | |||
| Price to cost | The ratio of price to cost for the function offered by the proposed technology | |||
| Business fit | Fit with product plan | Applicability | The applicability of the proposed technology to new products or services that are planning to be introduced | Impacts of R&D [49,50] |
| Impacts on performance | The negative or positive impacts of inserting the proposed technology to products or services on their core performance | |||
| Fit with R&D plan | Investment cost | Availability of investment costs | Validity of R&D [24] | |
| ROI | The level of expected ROI | |||
| Time and human resources | Suitability of project schedule and human resources planning |
| Value | Characteristics | Detailed description |
|---|---|---|
| 5 | New-to-the-world product technology | The proposed technology has never been developed anywhere in the world; no relevant patents are found for the proposed technology. |
| 4 | New-to-the-world production technology | The proposed technology has been presented in a conference or an exhibition but has not yet been applied to production; there are a few relevant patents but still room for further patent applications on production technologies. |
| 3 | New-to-the-country production technology | The proposed technology has been applied to production in other countries but has not yet been applied in the native country; there are a few relevant patents and there is room for further patent applications on applied production technologies. |
| 2 | New-to-the-company production technology | The proposed technology has been adopted by competitors in the native country as well as other countries but has not been applied to production in the company. |
| 1 | Minor change to existing technology | The proposed technology is simply a minor upgrade to the technology the company already has. |
| Perspectives (Weighs) | Criteria (Weights) | Indexes | Weights | Rankings |
|---|---|---|---|---|
| Technology attractiveness (0.274) | Innovativeness (0.098) | Novelty | 0.028 | 14 |
| Inventive steps | 0.031 | 13 | ||
| Utility | 0.039 | 12 | ||
| Appropriability (0.176) | Exclusivity | 0.079 | 5 | |
| Life cycle | 0.097 | 3 | ||
| Technology fit (0.100) | R&D capabilities (0.029) | R&D difficulties | 0.007 | 19 |
| R&D risk | 0.004 | 20 | ||
| Application domain | 0.018 | 17 | ||
| Manufacturing capabilities (0.071) | Additional cost for manufacturing | 0.026 | 15 | |
| Additional time for manufacturing | 0.045 | 10 | ||
| Market attractiveness (0.400) | Perceived functional value (0.207) | Functional awareness | 0.064 | 6 |
| Functional importance | 0.143 | 1 | ||
| Perceived economic value (0.193) | Brand awareness | 0.048 | 8 | |
| Intention to pay | 0.063 | 7 | ||
| Price to cost | 0.082 | 4 | ||
| Business fit (0.227) | Fit with product plan (0.149) | Applicability | 0.046 | 9 |
| Impacts on performance | 0.103 | 2 | ||
| Fit with R&D plan (0.078) | Investment cost | 0.014 | 18 | |
| ROI | 0.022 | 16 | ||
| Time and human resources | 0.042 | 11 |
| Perspectives | Project A | Project B | ||||||||
|---|---|---|---|---|---|---|---|---|---|---|
| Evaluator 1 | Evaluator 2 | Evaluator 3 | Mean | Max-Min | Evaluator 1 | Evaluator 2 | Evaluator 3 | Mean | Max-Min | |
| Technology attractiveness | 17 | 17 | 18 | 17.34 | 1 | 17 | 16 | 16 | 16.33 | 1 |
| Technology fit | 15 | 14 | 12 | 13.66 | 3 | 18 | 17 | 17 | 17.33 | 1 |
| Market attractiveness | 14 | 10 | 14 | 12.68 | 4 | 11 | 14 | 13 | 12.67 | 3 |
| Business fit | 17 | 18 | 20 | 18.34 | 3 | 22 | 22 | 22 | 22.00 | 0 |
| Total scores | 63 | 59 | 64 | 62.02 | 5 | 68 | 69 | 68 | 68.33 | 1 |
| Perspectives | Criteria | Indexes | Internal Evaluators | External Evaluators | ||
|---|---|---|---|---|---|---|
| Engineering Departments | Other Departments | Technological Experts | Potential Customers | |||
| Technology attractiveness | Innovativeness | Novelty | ■ | □ | ||
| Inventive steps | ■ | □ | ||||
| Utility | ■ | □ | ||||
| Appropriability | Exclusivity | ■ | ||||
| Life cycle | ■ | |||||
| Technology fit | R&D capabilities | R&D difficulties | ■ | |||
| R&D risk | ■ | □ | ||||
| Application domain | ■ | □ | ||||
| Manufacturing capabilities | Additional cost for manufacturing | ■ | □ | |||
| Additional time for manufacturing | ■ | □ | ||||
| Market attractiveness | Perceived functional value | Functional awareness | ■ | |||
| Functional importance | ■ | |||||
| Perceived economic value | Brand awareness | □ | ■ | |||
| Intention to pay | ■ | |||||
| Price to cost | □ | ■ | ||||
| Business fit | Fit with product plan | Applicability | ■ | □ | ||
| Impacts on performance | ■ | □ | ||||
| Fit with R&D plan | Investment cost | ■ | ||||
| ROI | ■ | □ | ||||
| Time and human resources | ■ | |||||
© 2017 by the authors. Licensee MDPI, Basel, Switzerland. This article is an open access article distributed under the terms and conditions of the Creative Commons Attribution (CC BY) license (http://creativecommons.org/licenses/by/4.0/).
Share and Cite
Lee, S.; Cho, C.; Choi, J.; Yoon, B. R&D Project Selection Incorporating Customer-Perceived Value and Technology Potential: The Case of the Automobile Industry. Sustainability 2017, 9, 1918. https://0-doi-org.brum.beds.ac.uk/10.3390/su9101918
Lee S, Cho C, Choi J, Yoon B. R&D Project Selection Incorporating Customer-Perceived Value and Technology Potential: The Case of the Automobile Industry. Sustainability. 2017; 9(10):1918. https://0-doi-org.brum.beds.ac.uk/10.3390/su9101918
Chicago/Turabian StyleLee, Sungjoo, Chanwoo Cho, Jaehong Choi, and Byungun Yoon. 2017. "R&D Project Selection Incorporating Customer-Perceived Value and Technology Potential: The Case of the Automobile Industry" Sustainability 9, no. 10: 1918. https://0-doi-org.brum.beds.ac.uk/10.3390/su9101918