Article

Attitudes in Korea toward Introducing Smart Policing Technologies: Differences between the General Public and Police Officers

1
Technology Management, Economics, and Policy Program, College of Engineering, Seoul National University, 1 Gwanakro, Sillim-dong, Kwnank-gu, Seoul 08826, Korea
2
Department of Marine Police, Chonnam National University, 50 Daehak-ro, Yeosu, Jeonnam 59626, Korea
*
Author to whom correspondence should be addressed.
Sustainability 2017, 9(10), 1921; https://0-doi-org.brum.beds.ac.uk/10.3390/su9101921
Submission received: 31 August 2017 / Revised: 20 October 2017 / Accepted: 21 October 2017 / Published: 24 October 2017
(This article belongs to the Section Sustainable Engineering and Science)

Abstract

:
This study analyzes different attitudes toward introduction of smart policing technologies in cybercrime policing among the Korean public and police. Policing is essential for a sustainable community. Technological advances in policing have both positive and negative aspects, making it essential to investigate perceptions of both public and police when introducing smart policing technologies. A discrete choice experiment was undertaken to survey preferences of the public and police toward introduction of such technologies and conduct simulation analysis to compare changes in the acceptance of various scenarios. The study divides cybercrime policing into prevention and investigation. The sample included 500 members of the public and 161 police officers. The results show that the public thinks an increase in yearly taxes and invasion of privacy are the most important factors. Conversely, the police think factors enhancing the efficiency of policing are most important. Moreover, when smart policing technologies are introduced, the public and police perceive more utility in the prevention and investigation of cybercrime, respectively. Few studies in this field separate the prevention and investigation of crimes, or compare perceptions of the public and police toward the introduction of smart policing technologies. This study’s quantitative analysis provides insights lacking in previous literature.

1. Introduction

Policing contributes to the sustainability of a community because it ensures public safety so that various social activities and sustainable development can take place [1,2,3]. However, along with recent technological advances in information and communications technology (ICT), criminals are becoming more intelligent and sophisticated. Therefore, crime prevention and arrests of criminals to ensure a safe and sustainable community are becoming more difficult. For example, South Korea had a high crime clearance rate of over 90% in the 1990s, but due to dramatic ICT advances and economic growth, the clearance rate steadily decreased, reaching 78.3% by 2014. The main contributor to this trend is intellectual crime, with a clearance rate of 68.3%, which is 10% lower than the average [4]. In 2014, the rate of intellectual crime in South Korea was 16.8%, which is larger than that of violent crimes (16.3%) or theft (15.0%). Among intelligent crimes, crimes in the cyber space damage our society in a new way, as the public experiences a new type of insecurity, that in the cyber space, which is different from insecurity in the physical world [5,6].
To cope with these crimes, the necessity for smart policing technologies has steadily increased, and many state-of-the-art technologies are already being utilized in policing activities, such as biometrics, digital imaging, and monitoring technologies. Some examples of these smart policing technologies are deoxyribonucleic acid (DNA) testing, face and action recognition, location tracing, censorship of electronic devices, video monitoring, and fingerprint and footprint imaging [7]. Due to technological advances, electronic devices are being increasingly miniaturized. Moreover, big data and machine learning technologies provide the ability to produce real-time responses to crime. These technologies can be specifically applied to crime forecasting systems using big data (the IBM “i2 COPLINK”), target identification systems using real-time video monitoring (the Microsoft and New York Police Department’s [NYPD] “Domain Awareness System”), police cars equipped with an infrared monitor (NYPD’s “smart car”), and portable DNA testing machines (NEC Corporation’s “Portable DNA Analyzer”). For a review of current and emerging smart policing technologies, refer to [8].
The use of smart policing technologies to prevent crime and enhance the clearance rate can reduce damage to the public and companies and contribute to sustainable development of the community [9,10,11,12]. However, many of these technologies, especially those coping with cyber-crime, are data-driven. To make use of these technologies, digital surveillance and collection as well as saving of the public’s private information are needed, which make these technologies controversial as regards to privacy [13,14,15,16,17,18,19,20,21]. Moreover, due to the public nature of policing, research and development (R&D) for policing technologies are usually led by the central government (e.g., the National Institute of Justice in the United States, National Policing Improvement Agency in the United Kingdom, National Research Institute of Police Science in Japan, and the China Research Center). Therefore, an increase in R&D investment leads to an increase in taxes. Moreover, these technologies may incur a tremendous introduction cost, which may also lead to an increase in taxes. Thus, legislation and regulations based on an understanding of these factors are important, since R&D for smart policing technologies is very costly, in terms of both money and privacy. In addition, since smart policing technologies are mainly used by the police, the beneficiaries and actual users of the technology are different. Therefore, policy direction regarding these legislations and regulations should be designed with a thorough understanding of people’s attitudes toward the smart policing technology.
The police, who are the actual users of the technology, may want to introduce and make full use of these technologies to effectively and efficiently cope with crimes. On the other hand, the public, who are the beneficiaries and cost bearers of the technology, may resist its introduction for various reasons, such as anxiety regarding private information leakage or an increase in tax burden. In case of South Korea, people are extremely passive about providing their private information, which may be because of repeated incidents of information leakage since 2008 from various types of companies (e.g., online shopping mall, internet service provider, online game company, broadcasting company, and bank) [22]. Thus, there are efforts to design appropriate policies and regulations regarding private information [23].
Accordingly, some type of reconciliation between the police and public is needed. By understanding the difference in their attitudes toward the introduction of smart policing technologies, appropriate alignment between security and privacy may be achieved [5]. Moreover, attitudes about the introduction of such technologies may differ because of other reasons, such as reduction in labor force or prioritization of the prevention or investigation of the crime.
Therefore, this study empirically analyzes different attitudes of both the public and police toward the introduction of smart policing technologies in cybercrime policing. Additionally, cybercrime policing is divided into prevention and investigation, and their differences are analyzed. Ultimately, this study provides policymakers with implications that can enhance acceptance of the smart policing technologies. To this end, a discrete choice experiment is used to obtain knowledge on the preferences of the public and police toward the introduction of these technologies, and a simulation analysis compares the changes in acceptance in various scenarios. A cost-benefit analysis is also conducted for the introduction of smart policing technologies.
The remainder of this article is organized as follows. Section 2 reviews the previous literature, exploring the perceptions of both the public and police toward policing, and outlines the contributions of this study. Section 3 describes the research framework and the mixed logit model used for analysis. Section 4 presents the estimation results for the preferences of the public and police toward the introduction of smart policing technologies, as well as the findings of the simulation analysis and their implications. Section 5 discusses the key results of the study. Section 6 summarizes the study and provides conclusions and policy implications with directions for future research.

2. Literature Review

Much of the previous literature on attitudes toward policing explored the general public’s perceptions of the role of police or analyzed perceptions on the development of smart policing technologies. The literature exploring public perceptions of the role of police usually focused on identifying the determinants of perception [24,25,26,27,28,29,30]. Correia et al. [24] analyzed public satisfaction levels for the Washington state police, considering demographic variables such as age, gender, education level, and housing (own versus rent), along with personal experiences related to the police, such as receiving a warning or citation. On the other hand, Weitzer and Tuch [25] analyzed the effect of the perception of public safety and the likelihood of civic participation on policing policies proposed by the police. Reisig and Giacomazzi [26] categorized perceptions of the police concerning officer demeanor, citizen-police relations, problem-solving orientation, and crime control responsibility, and analyzed the relationship between these perceptions and both demographic characteristics and personal experiences with crime. Tyler [27] analyzed the cases of policing in the United States and Europe to examine the issues of trust and legitimacy.
Numerous recent studies have focused on the relationship between the media and perceptions of the police. Dowler and Zawilski [28] analyzed how public perceptions of police misconduct and discriminatory police practices are affected by police-related TV shows (e.g., police dramas, crime solving, and police reality shows), TV news, and demographic variables. In their analysis, factors such as the perception of crime and police-related experiences were controlled. Further, Callanan and Rosenberger [29] analyzed how media coverage affects trust in police, and the results show that watching TV news or crime-based reality programs enhances this trust.
Moreover, some studies analyzed the differences between various groups of people. Dimc and Dobovsek [31] compared people’s perception of cybercrime in Slovenia and the United States. The results suggest that Slovenian people feel safer than people in the United States in the virtual environment. Nasi et al. [32] conducted a multi-national study in Finland, the United States, Germany, and the United Kingdom on the victimization of young people through cybercrime. The results show that the country in which the people resided did not affect their victimization, while factors such as gender, whether their parents were born abroad, and whether they lived with their parents did. Different attitudes toward the use of private information in Asian countries are presented in [23]. Some studies analyzed the attitude of police toward certain groups of people. Williams [33] analyzed the attitude of police toward immigrants in the United States. The results showed that many police departments try to develop a “welcoming” attitude toward immigrants, which, in turn, results in deeper commitments in community policing.
Another recent research trend for perceptions of policing is perception analysis on the introduction of smart policing technologies. As state-of-the-art technologies are applied in policing, issues such as rights, liberties, accountability, integrity, ethics, and effectiveness are emerging [34], because the introduction of smart policing technologies can increase the probability of invading an individual’s privacy, rights, and freedom, since many of these technologies collect, trade, and save individual private information. Additionally, significant investment is needed to develop these technologies further. Therefore, the honesty of police organizations, which are in control of this information, and the technology’s effectiveness in policing compared with its investment cost, are essential issues to be considered [35,36]. Moreover, some studies analyzed the role of other factors, such as the political environment [37].
Numerous studies focusing on perceptions toward the introduction of smart policing technologies also analyzed perceptions toward surveillance technologies. For instance, Pavone and Degli Esposti [38] used survey data to analyze the trade-off between security and privacy regarding the introduction of surveillance-oriented security technologies. They divided the general public into two groups, those who trust smart policing technologies and those who are concerned about them, and showed that perceptions toward security and privacy are different between these two groups. Additionally, Strickland and Hunt [39] analyzed perceptions toward radio frequency identification (RFID) technologies for policing and business purposes. Their results showed that even those with substantive knowledge of these technologies are anxious regarding the collection of private information and skeptical about whether the information is safely protected. Moreover, even individuals who endorse RFID technologies for policing believe the government should enhance its regulations on smart policing technologies. Further studies like those of Valkenburg [40] and Friedewald et al. [41] also analyzed the public’s trade-off between privacy and security.
As such, most extant studies focused on the perceptions of the general public, but some [42,43,44] analyzed the acceptance of technology by police officers, who are the actual users.
The development and use of smart policing technologies clearly affect both the general public (which is the beneficiary and cost bearer) and police officers (who are the actual users). However, previous studies usually analyzed the perception of only one of these two groups. Moreover, since policing activity can be divided into two categories—prevention and investigation of crimes—the effect of smart policing technologies may differ between these. However, few previous studies separated these categories for analysis. Therefore, this study identifies and compares the perceptions of both the general public and police officers toward the introduction of smart policing technologies for the prevention and investigation of crime. By quantitatively analyzing the attitudes of these two groups, this investigation expects to provide implications that previous studies did not.

3. Methodology

Smart policing technologies are not widely adopted yet, which makes the response or preference data of the public and police very limited or non-existent. Therefore, we use the choice experiment method, which requires respondents to choose their preference from among scientifically designed hypothetical alternatives to obtain knowledge about their preference structure. Then, using data collected from the choice experiment, we use the econometric model to analyze preferences about the introduction of smart policing technologies of both the public and police [45].

3.1. Choice Experiment Design

First, a choice experiment is conducted to quantitatively analyze the perceptions of the general public and police officers toward the introduction of smart policing technologies. A choice experiment is appropriate in this case, since it can quantitatively analyze the invisible value of the subject. In such an experiment, a set of hypothetical alternatives is provided, which is a combination of the effects of the introduction of smart policing technologies [46]. For this, attributes that can represent the effect of introducing smart policing technologies in cybercrime prevention and investigation are generated.
First, for cybercrime prevention, five attributes are assumed: increase in taxes, privacy invasion, decrease in workforce needed, decrease in hacking crimes, and auto-blocking of harmful content. For the attribute level of increase in taxes, the police’s R&D budget is considered, as well as the expected increased budget, and three levels are set at 500 KRW/year, 1500 KRW/year, and 2000 KRW/year. According to the National Police Agency, the R&D budget for the National Police in 2016 was about KRW 5 billion. If this is divided by the 21,241,538 households in South Korea [47], the cost per household is about 240 KRW/year. However, since R&D activities for policing are also being conducted at the supreme prosecutor’s office and by a national forensics service, and the R&D budget is expected to increase, the abovementioned increase in tax levels is assumed. Three levels are set for the attribute of privacy invasion: no, low, and high risk of invasion. No risk of invasion means that no private information is collected; low risk of invasion means that only information such as that of sign-up logs, identification, internet protocol (IP) addresses, and visit logs is collected; and, finally, high risk of invasion means that information such as that of sign-up logs, identification, IP addresses, visit logs, accessing regions, media access control (MAC) addresses, trading information, and real names is collected. Next, for the decrease in workforce needed, it is noted that there was workforce reduction of 8%, or 3000 police officers, in 2011 through the operations of the NYPD Real Time Crime Center [48]. The levels of this attribute are set as current, 15% decrease, and 30% decrease. Similarly, for the decrease in hacking crimes, the levels are also set as current, 15% decrease, and 30% decrease. Finally, regarding the auto-blocking of harmful content, such as illegal pornography, gambling, defamation, and discriminatory content, the levels are set as current, 15% increase, and 30% increase. The attributes and attribute levels for introducing smart policing technologies in the prevention of cybercrime are illustrated in Table 1.
Next, for cybercrime investigation, five attributes are assumed: increase in taxes, privacy invasion, decrease in time spent on investigation, increase in clearance rate, and decrease in police misconduct. The attribute levels for the increase in taxes and privacy invasion are the same as those for prevention. For the decrease in the time spent on investigation, reference is made to the fact that the NYPD decreased the time spent on investigation by 30% by introducing the Real Time Crime Center, and the levels are set as current, 25% decrease, and 50% decrease. For the increase in clearance rate, the attribute levels are assumed as current, 10% increase, and 20% increase. Finally, regarding the decrease in police misconduct, the levels are assumed as current and decrease in police misconduct. The attributes and attribute levels for introducing smart policing technologies in the investigation of cybercrime are illustrated in Table 2.
By setting the introduction effects of smart policing technologies, as discussed above, the total number of available alternatives is 274 for cybercrime prevention and 162 for cybercrime investigation. Of course, it would be inappropriate to suggest all these alternatives to respondents. As such, this study utilizes a fractional factorial design and selects 18 orthogonal alternatives. Subsequently, these alternatives are combined into six choice sets, and respondents are asked to choose their most preferred alternative among the three in the choice set. Examples of the choice experiments for cybercrime prevention and investigation are illustrated in Figure 1 and Figure 2, respectively.

3.2. Model Specification

Data collected in the choice experiment can be used to estimate the parameters for each attribute using the mixed logit model. In the basic logit model, indirect utility U n j that consumer n feels from alternative j can be separated into deterministic utility V n j and probabilistic utility ε n j . Each consumer then selects the alternative with the highest utility. Therefore, the probability of consumer n selecting alternative j is the probability that the utility from choosing alternative j is larger than that of choosing other alternatives [45,49]. This can be represented as per Equation (1):
P n j = Pr ( U n j > U n i , i j ) = Pr ( V n j + ε n j > V n i + ε n i , i j ) = ε I ( ε n i ε n j < V n j V n i , i j ) f ( ε n ) d ε n
However, the basic logit model cannot incorporate the preference heterogeneity of respondents and the problem of independence of irrelevant alternatives [45]. To overcome this problem, a researcher may consider using a latent class logit model [50,51] or mixed logit model [52,53]. In this study, we used the mixed logit model, since it can analyze the preference heterogeneity of respondents using various types of distributions [45]. Moreover, since a latent class logit model divides the sample into finite number of classes and our sample is quite small (especially for the police officers), we concluded that the use of a mixed logit model is better than that of a latent class model.
A mixed logit model is utilized to incorporate heterogeneity between consumers. In the basic logit model, such as in Equation (2), a consumer’s deterministic utility systematically changes according to attribute coefficient β n when attributes of the alternative x j t change by one unit. In the mixed logit model, the value a consumer places on an attribute β n is assumed to follow a specific probability distribution f ( β ) to incorporate heterogeneity:
U n j    =    V n j + ε n j    =    β n x n j + ε n j
Here, ε n j is defined as a random disturbance, which has independent and identically distributed extreme value distributions. The choice probability of a mixed logit model can be written as in Equation (3) [45]:
P n j    =    ( e β n x n j i e β n x n i ) f ( β ) d β
The distribution of f ( β ) is generally assumed to be normal, but this can sometimes be inappropriate for attributes for which all consumers have the same direction of preference. For these attributes, other distributions should be assumed [54]. For example, since everyone prefers a lower price for a good or service, it is appropriate to assume the distribution of the coefficient for the price attribute as log-normal.
Moreover, to obtain the economic implications using estimated coefficient values from the mixed logit model, one must be able to calculate the marginal willingness to pay (MWTP). The MWTP is the maximum additional price a consumer is willing to pay when the quantity or quality of an attribute changes by one unit, and it can be calculated using Equation (4):
M W T P x j k    =       U n j / x j k U n j / x j , p r i c e    =       β k β p r i c e
Here, x j k and β k are the attribute value and estimated coefficient of the attributes excluding the price attribute, respectively; and x j , p r i c e and β j , p r i c e are the attribute value and estimated coefficient of the price attribute, respectively.
Moreover, since the relative importance of each attribute in decision making is different, the part worth of each attribute is calculated. The relative importance of an attribute K ( R I K ) can be calculated using Equation (5):
R I K    =    p a r t w o r t h K k p a r t w o r t h k    ×    100
Here, the part worth of attribute k can be calculated by multiplying the estimated coefficient β k by the difference in the minimum and maximum values of attribute k .

4. Results and Discussion

4.1. Data

Surveys are used for data collection, being conducted by a professional survey company (Gallup Korea) using face-to-face interviews with a structured questionnaire. The survey of the general public was conducted from 19 January to 5 February 2016, with 500 people between the ages of 20 and 59, living in South Korea’s major cities. The survey of police officers was conducted from 22 February to 3 March 2016, with 161 on-duty officers nationwide. For sampling, a purposive quota-sampling method was used to represent the population appropriately. For the general public, gender, age, and region were considered, while for police officers, position and specific duties were captured. The descriptive statistics of the respondents are illustrated in Table 3.

4.2. Results: Estimation and Willingness to Pay

First, the estimation results for the introduction of smart policing technologies in cybercrime prevention for the general public and police officers are illustrated in Table 4 and Table 5, respectively.
The results show that the signs of the estimated parameters are the same for both the public and police. Both groups do not prefer an increase in taxes and privacy invasion. On the other hand, both groups prefer decreases in needed workforce and hacking crimes, as well as increased auto-blocking of harmful content.
However, when considering the extent to which each group prefers or does not prefer each attribute, a distinct difference between the public and police can be observed by looking at the relative importance estimates. Compared with the police, the public thought an increase in tax and invasion of privacy were more important and a decrease in manpower was less important. The police considered a decrease in manpower quite important. This may be because prevention of cybercrime is mainly about monitoring the cyber space, which is quite time consuming and stressful for police officers without the use of smart policing technologies. Also, this may imply that introduction of smart policing technologies do not threat police about maintaining their job. Finally, the police considered auto-blocking of harmful content more important than the public. This may be because some members of the public believe that auto-blocking of content is a type of censorship.
Next, if we look at the MWTP estimates, the police, who are the actual users, are less sensitive to an increase in taxes due to the introduction of smart policing technologies for cybercrime prevention, which causes the police’s MWTP to be relatively larger than that of the public. In introducing smart policing technologies for cybercrime prevention, police officers are willing to pay about 30% more to avoid privacy invasion, and about three times more to decrease the workforce needed by 10%.
The results of the introduction of smart policing technologies in cybercrime investigation for the general public and police officers are illustrated in Table 6 and Table 7, respectively.
Similar to the case of cybercrime prevention, the signs of coefficients are the same for significant coefficients of both the public and police. Both groups want to avoid an increase in taxes and privacy invasion and prefer an increase in the clearance rate. For the decrease in time spent for investigation, the estimates for both groups are not significant. This may be because both groups believe the investigation of a crime should be conducted carefully and that the time spent for this is not that important. The big difference between the public and police was as regards police misconduct. The public preferred a decrease in police misconduct, whereas this attribute was not significant for the police. This may represent the general public’s distrust in the police.
Next, by looking at the relative importance of the attributes, we can observe the differences between the two groups in more detail. The most significant difference is regarding the increase in tax. The police thought an increase in tax was less important than the public did for the prevention of crime, but the difference is quite significant than in the previous case. Increase in tax did have a significant effect on the police, but its magnitude was very small. This may imply that the police want to solve crimes while placing very low priority on the cost. Other than this, the relative importance of attributes significant to both groups was quite similar between the groups.
Next, when comparing the MWTP of the public and police officers, MWTP of the latter is exceptionally higher. For example, police officers are willing to pay 124,568 KRW/year to avoid privacy invasion, which is more than 80 times higher than that of the public (1505 KRW/year). As mentioned above, this is probably because police officers are extremely insensitive to increase in taxes when it comes to investigating crimes.
Finally, results for the prevention and investigation of cybercrime were considered by comparing the same attribute for an increase in taxes and for privacy invasion. Regarding the public, the sum of the relative importance of an increase in taxes and privacy invasion is 57.8% for investigation and 49.5% for prevention, which implies that the public considers that these two cost attributes of smart policing are more important in the investigation of cybercrime, meaning that the benefits of smart policing are more important for cybercrime prevention. On the other hand, regarding police officers, the sum of the relative importance of an increase in taxes and privacy invasion is 30.2% for investigation and 31.8% for prevention, which implies that police officers consider that the benefits of smart policing are more important in the investigation of cybercrime.
The abovementioned results stem from different perceptions toward policing activity between the two groups. The public would, of course, prefer more efficient investigation activity for cybercrime. Nonetheless, it benefits most from crime prevention. On the other hand, since the responsibility of police officers focuses on investigation, they consider efficient investigation activity to be more important than prevention.

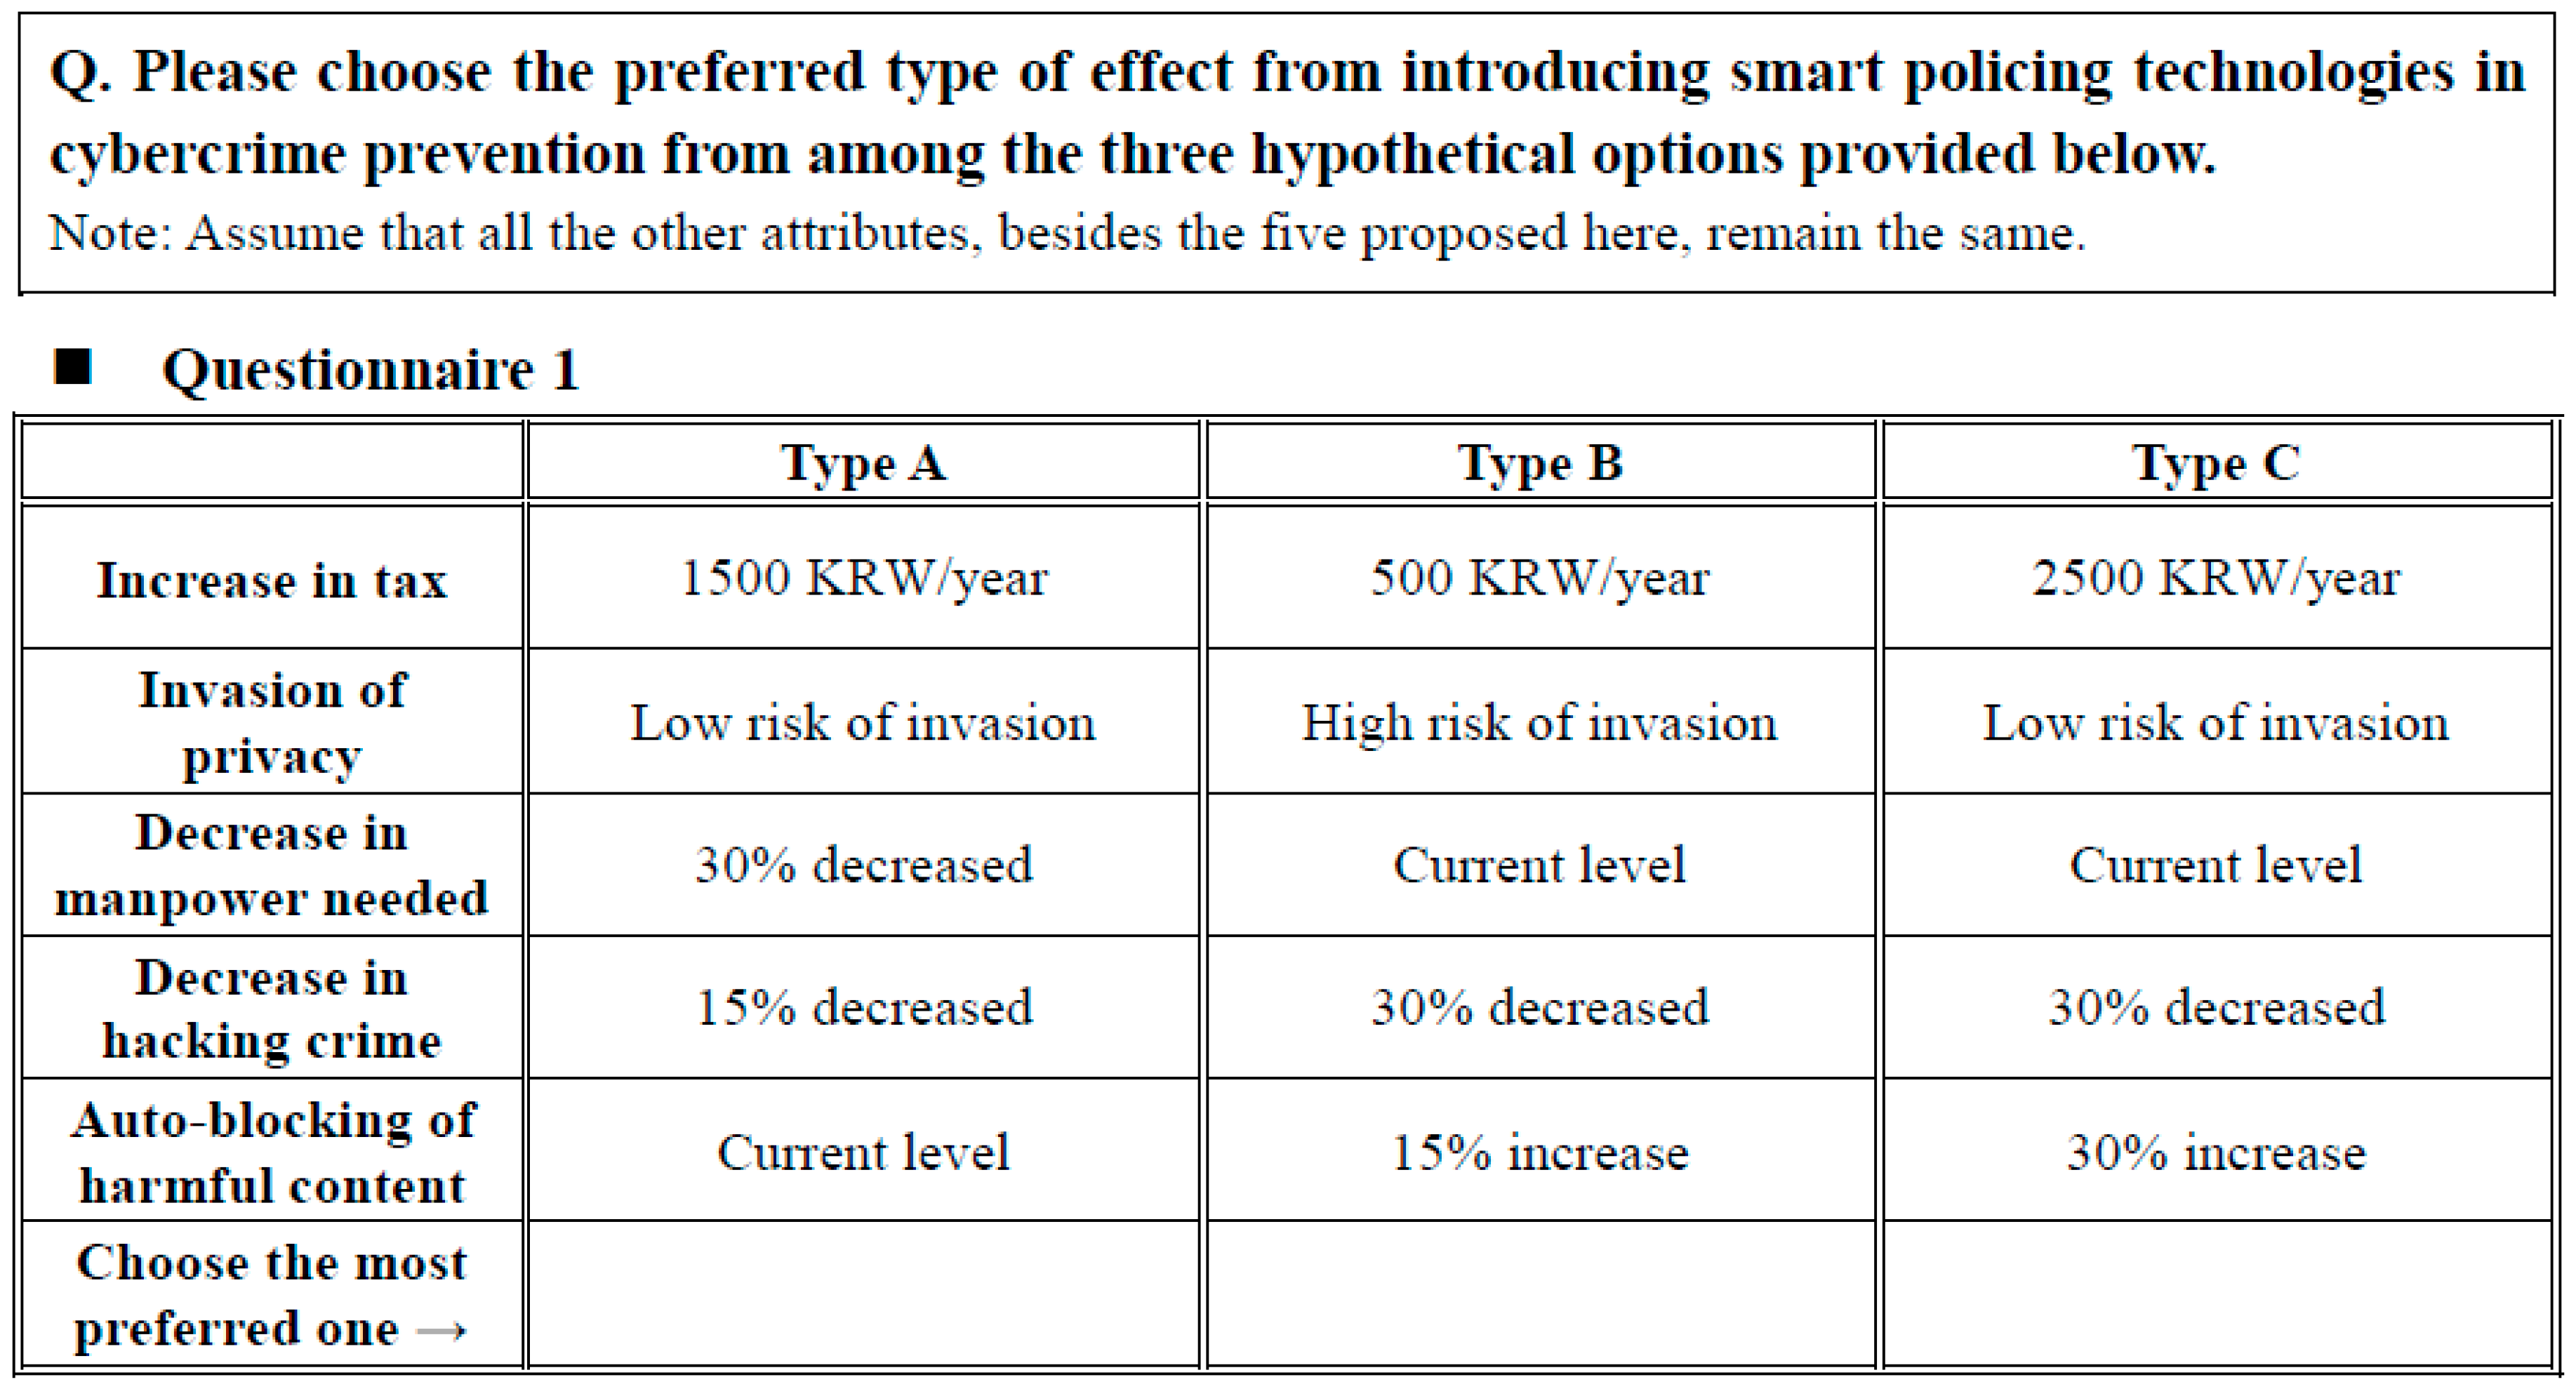
4.3. Results: Simulations

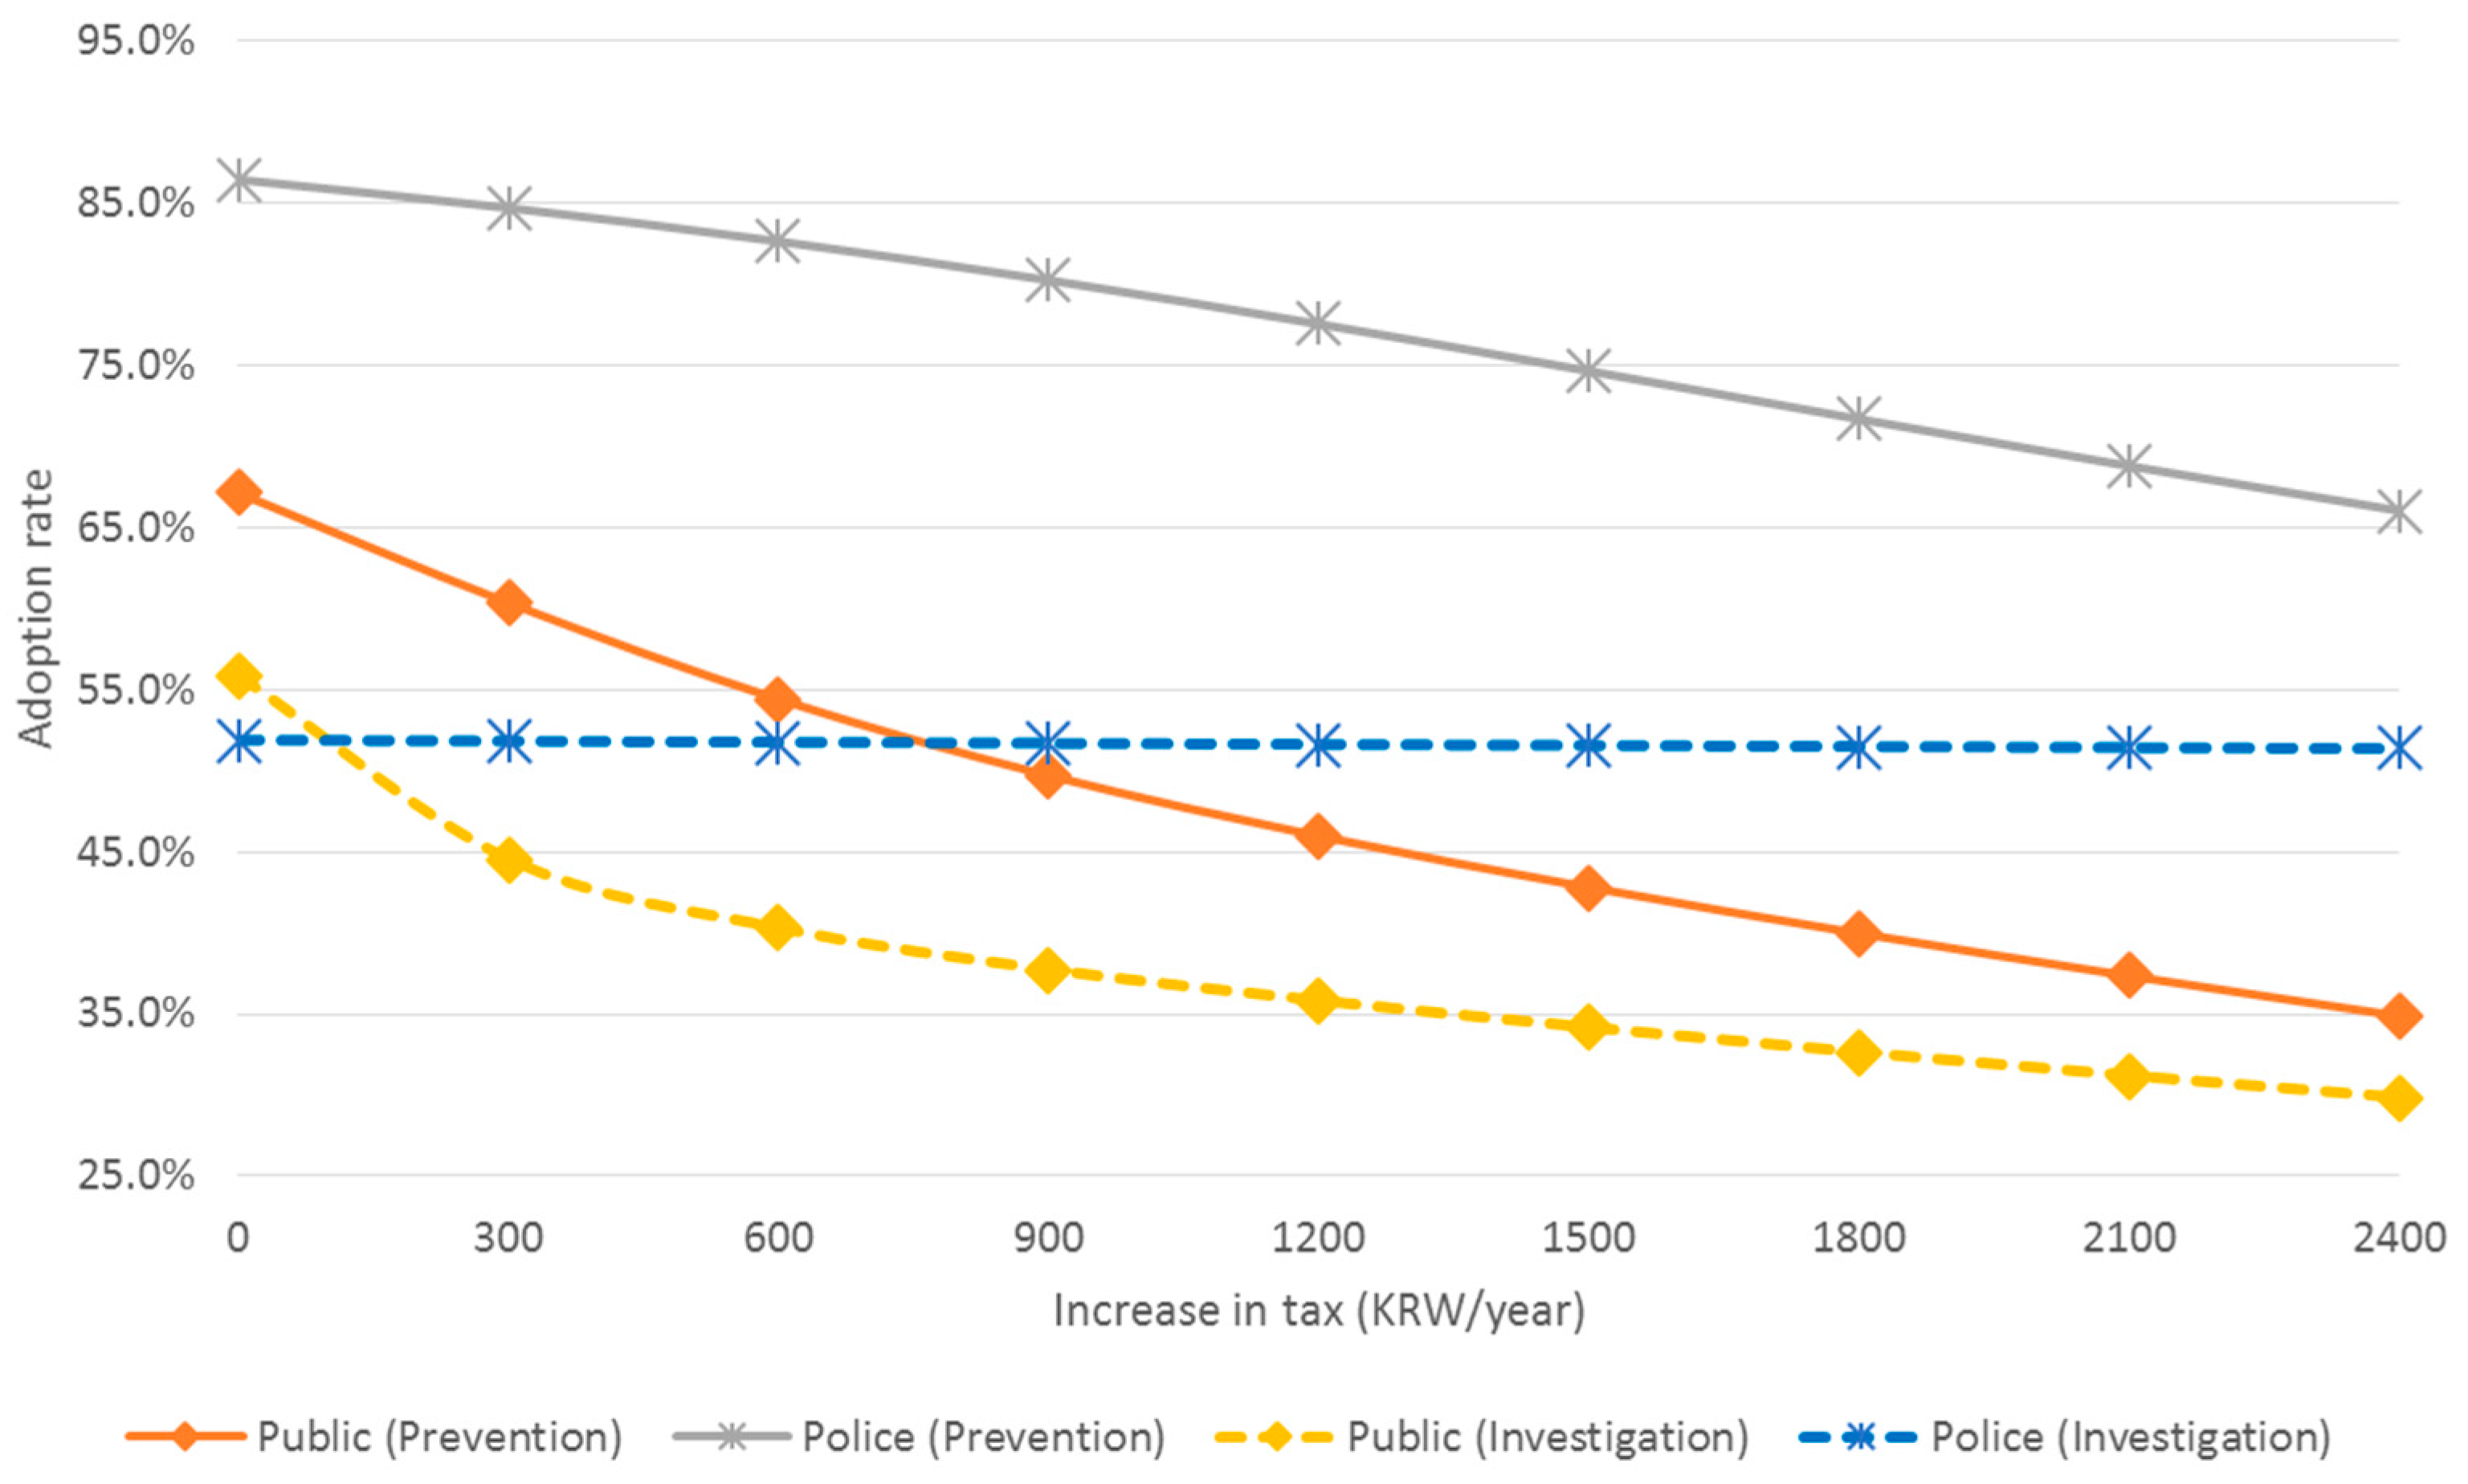
Next, the study analyzes the acceptance of the public and police officers as the levels of tax increase and privacy invasion changes. First, to simulate the acceptance rate by the change in the level of an increase in taxes, the levels of other attributes are assumed to be fixed. Specifically, for cybercrime prevention, the assumed levels of other attributes are low risk of privacy invasion, 15% decrease in workforce needed, 15% decrease in hacking crimes, and 15% increase in auto-blocking of harmful content. For cybercrime investigation, the assumed levels are low risk of privacy invasion, 15% decrease in time spent for investigation, 10% increase in the clearance rate, and decrease in police misconduct. The results of this acceptance analysis are illustrated in Table 8 and Figure 3.
The results show that, in cybercrime prevention, the acceptance of police officers is higher than that of the public by about 20% to 30%, and the gap between the two groups widens as the level of increase in taxes expands, since the public is more sensitive to this attribute. On the other hand, for cybercrime investigation, the acceptance of police officers is steady at around 51%, regardless of an increase in taxes. The public’s level of acceptance is higher than that of police officers when the increase in taxes is below 100 KRW/year, but falls below that of police officers for a higher increase in taxes. If the results of cybercrime prevention and investigation are compared, the public’s sensitivity toward an increase in taxes is similar. However, regarding investigation, the results show high sensitivity for a low increase in taxes, and, regarding prevention, high sensitivity for a high increase in taxes.
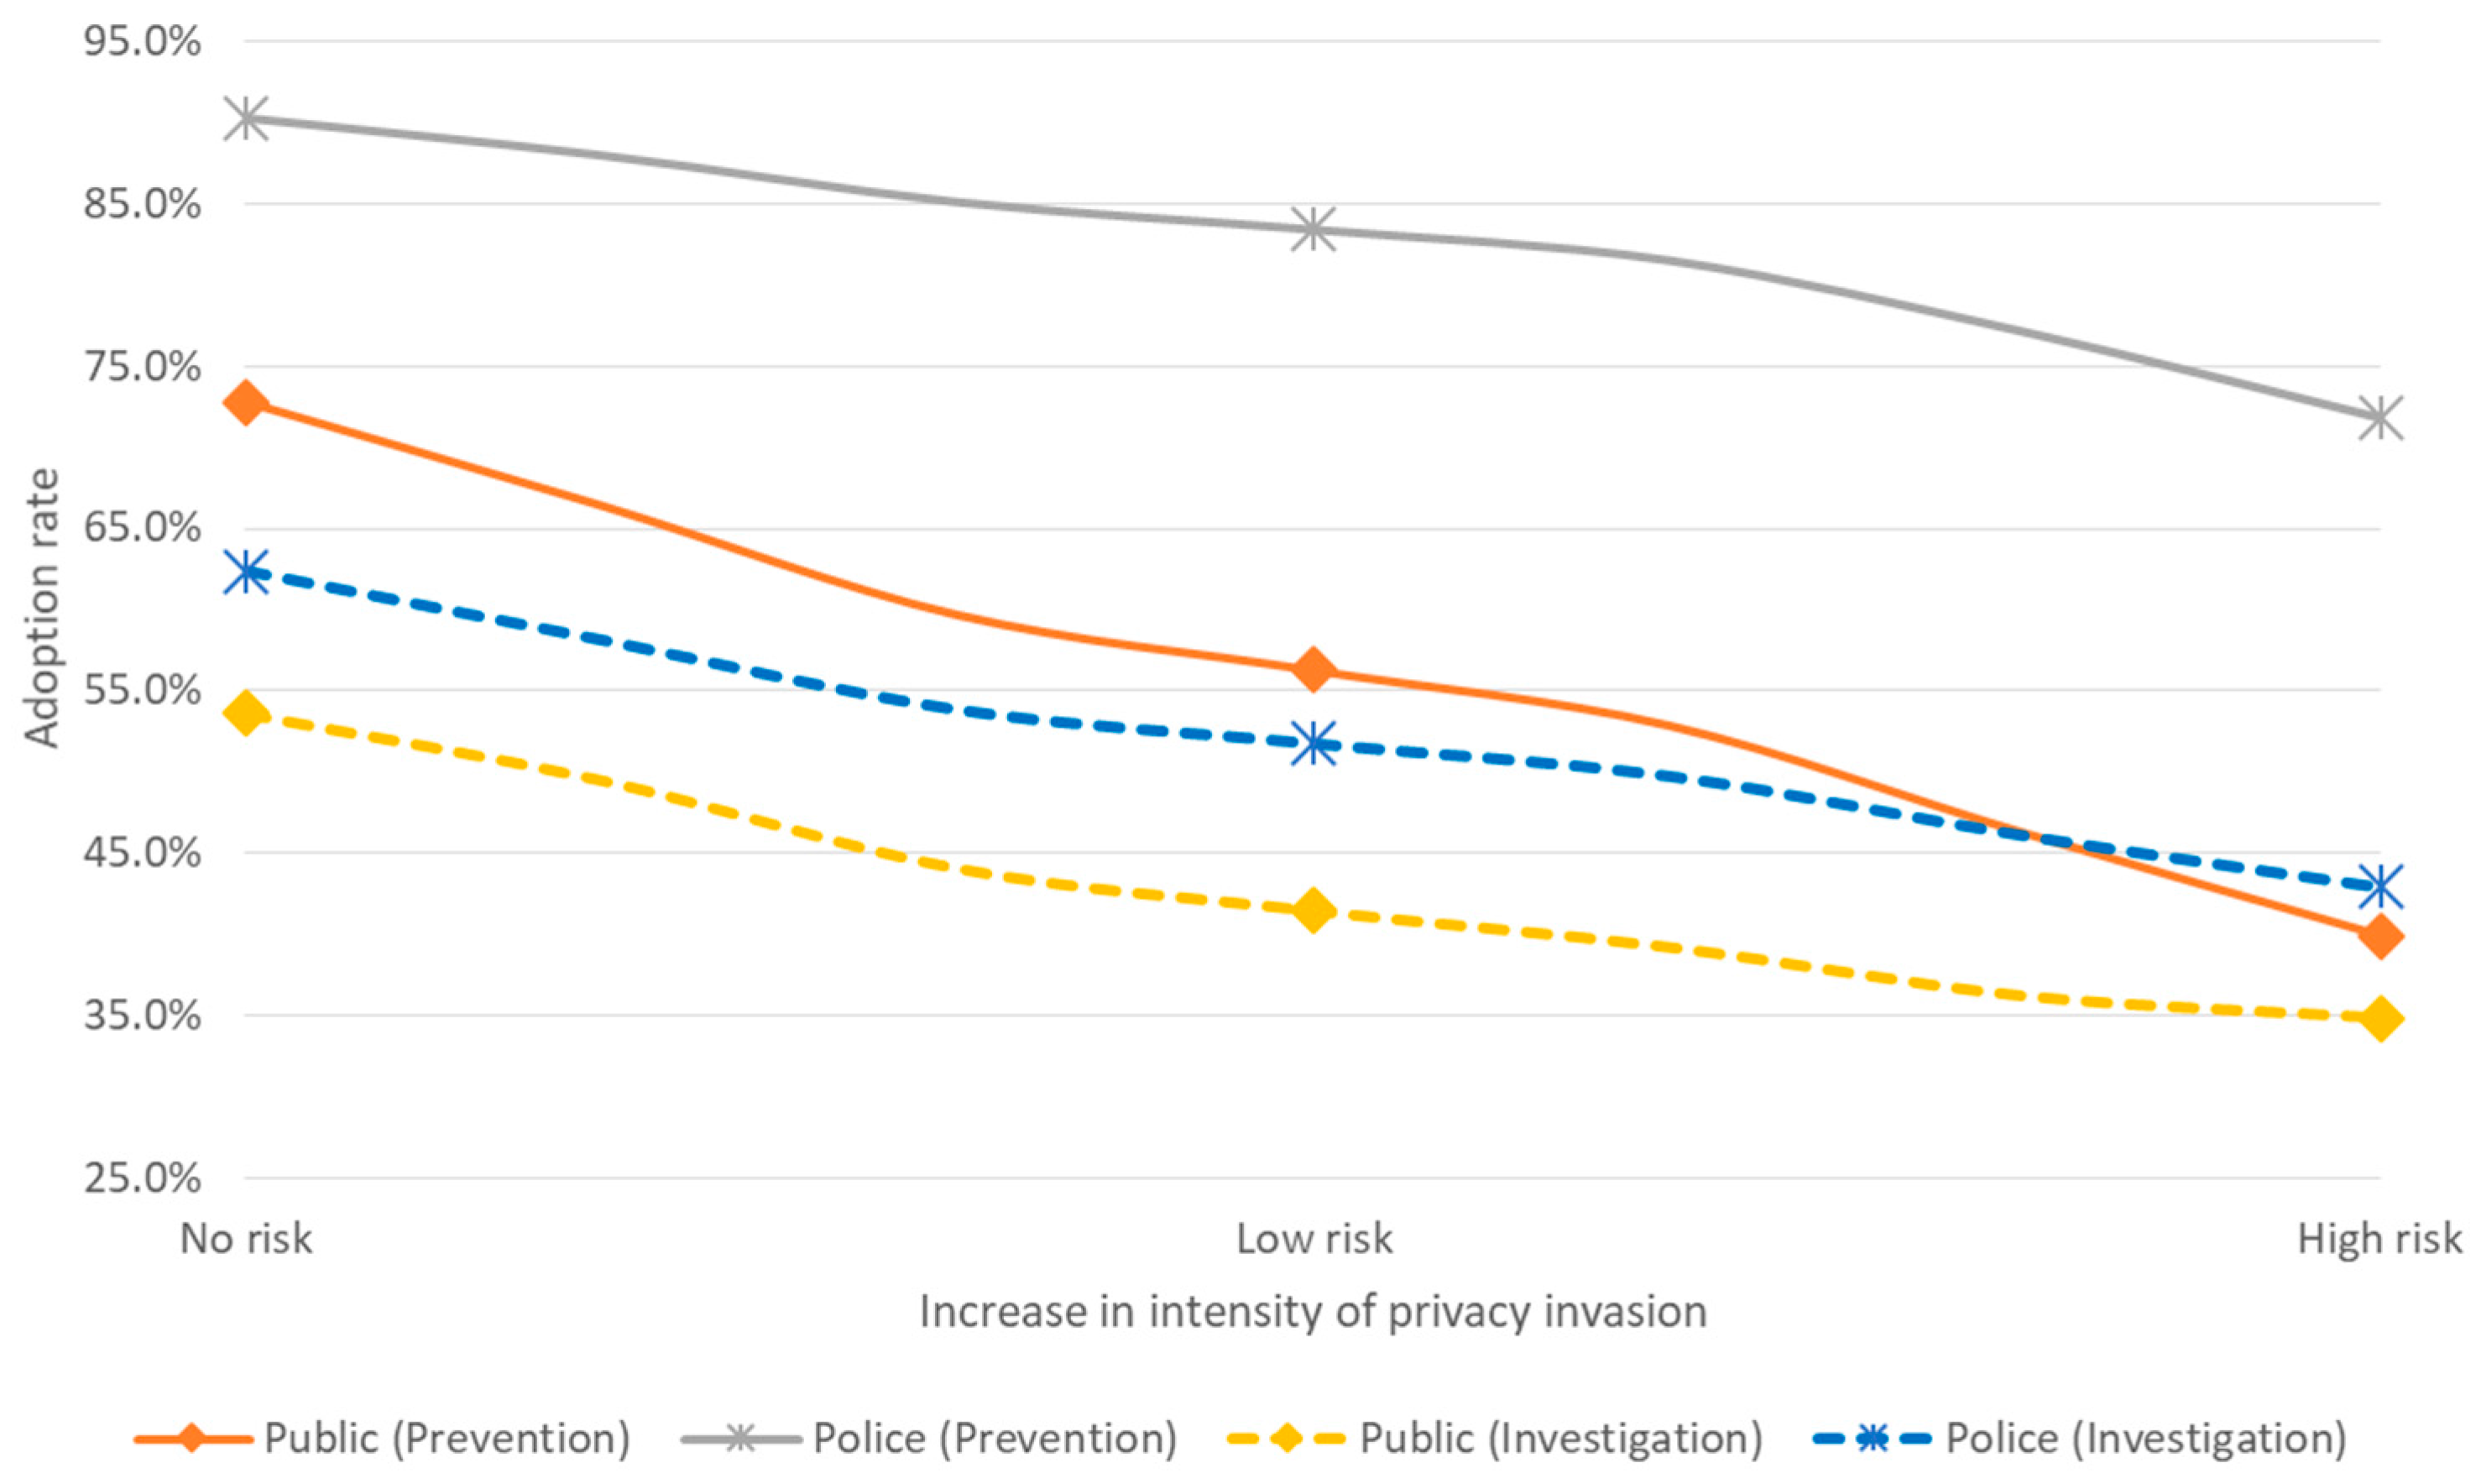
Next, the study simulates acceptance as the intensity of the privacy invasion changes. The assumptions for the other attributes are the same as in the scenario of an increase in taxes, and a KRW 500 increase in taxes is assumed. The level of privacy invasion is then varied, and changes are observed; the results are illustrated in Table 9 and Figure 4.
The results show that, for both prevention and investigation of cybercrime, the acceptance of police officers is higher than that of the public. Additionally, the difference in acceptance for the prevention of cybercrime is much larger than that for investigation, which implies that different attitudes exist toward privacy invasion for cybercrime prevention between the public and police officers.

4.4. Results: Cost-Benefit Analysis

Next, using MWTP results for the public, a cost-benefit analysis is conducted, comparing the investment needed from the government (cost) and benefit to the public (benefit) when smart policing technologies are introduced for cybercrime prevention and investigation. This study assumes that the public benefits from a decrease in needed workforce, a decrease in hacking crimes, and auto-blocking of harmful content in cybercrime prevention as well as from a decrease in time spent for investigation, an increase in the clearance rate, and a decrease in police misconduct in cybercrime investigation. On the other hand, the assumption is that the public loses its benefits from privacy invasion for both cybercrime prevention and investigation.
The study assumes 21,173,397 households in South Korea [47]. To calculate the total benefit of introducing smart policing technologies for cybercrime prevention, a scenario with a low level of privacy invasion, 10% decrease in workforce needed, 10% decrease in hacking crimes, and 10% increase in auto-blocking of harmful content is proposed. The annual household MWTP, total annual household MWTP, and total benefits to the public for cybercrime prevention are illustrated in Table 10.
Next, for cybercrime investigation, the scenario has a low level of privacy invasion, 10% decrease in workforce needed, 5% increase in the clearance rate, and a decrease in police misconduct. Since the attribute of decrease in time spent for investigation does not have a significant effect on benefits to the public, it is not included in the analysis. The annual household MWTP, total annual household MWTP, and total benefit to the public from cybercrime investigation are illustrated in Table 11.
Based on these results, the observed benefit of introducing smart policing technologies in cybercrime prevention and investigation is approximately KRW 1.3 billion. Since the National Police invest KRW 5.1 billion in policing R&D, and this budget is distributed between five major departments, the assumption is made that each department, including cyber safety, receives an investment of approximately KRW 1 billion. Considering the current department system of the police, smart policing can be grouped into five areas: investigation, traffic, public safety, cyber safety, and security. Therefore, according to the results of this study, the benefit of introducing smart policing technologies is larger than its cost.

5. Discussion

The R&D for smart policing technologies in South Korea is currently in its early phase. Therefore, an appropriate future direction of R&D should be decided. The results of this study show that the perception of introduction of smart policing technologies is different for the users (police) and the beneficiaries and cost bearers of the technology (public). Therefore, the perceptions of both groups, specifically the parts that need to be reconciled between the two groups, should be considered in the R&D planning of smart policing technologies.
First, in case of cybercrime prevention, the public considered an increase in tax and privacy as most important, and the police considered a decrease in manpower as important. This implies that some type of reconciliation is needed between the public and police. In other words, the public should acknowledge and understand the problem of worker shortage for the police, and the police should acknowledge the problems of tax burden and privacy invasion when designing policing R&D to ensure reduced social conflict. The increase in tax will need some explanation for the public, since the primary results of our survey suggest that only 9% of the public are aware of policing R&D, and only 31% are interested in smart policing technology. Moreover, for privacy invasion, 55.8% answered that smart policing technologies may invade their privacy, and 47.2% were concerned about problems that may be caused by the technology. However, 74.4% answered that more investment in policing R&D is needed, and only 24% were satisfied with the current level of policing technology. Thus, there is a chance for proper reconciliation. The police should provide more information about policing R&D to the public and try to convince them of need for these technologies despite their cost and the privacy invasion problem. Moreover, as Figure 4 implies, the discrepancy between the public and police in terms of the privacy invasion problem was larger in cybercrime prevention than in cybercrime investigation. Therefore, once introduced, smart technologies for the prevention of cybercrime should give more attention to the privacy invasion problem.
On the other hand, in case of cybercrime investigation, both groups thought that the privacy invasion problem was similarly important. However, the police considered that the problem of increase in tax was extremely less important than did the public. As Figure 3 suggests, the public were also less sensitive to additional tax for investigation rather than the prevention of cybercrime, but the police was almost invariant to the cost change. Moreover, the public were concerned about the police misconduct problem, while the police were not. Therefore, the police need to acknowledge and consider the public’s concerns about increase in tax and police misconduct, and the public should acknowledge and consider the police’s desire to investigate and clear cases by designing better policing R&D policies with less social conflict.

6. Conclusions

This study quantitatively analyzes the difference in the perceptions of the public and police officers toward the introduction of smart policing technologies in cybercrime prevention and investigation, respectively. To this end, a discrete choice model is utilized to identify the preferences of both the public and police officers. Subsequently, a simulation analysis is conducted, and the costs and benefits associated with the introduction of these technologies are compared.
The results can be summarized as follows. First, the general public considers an increase in taxes and privacy invasion as the most important effects related to the introduction of smart policing technologies, while police officers value the factors that make policing activities more efficient. Second, comparing prevention and investigation of cybercrime, the general public feel they benefit more from introducing smart technologies in preventing cybercrime, while police officers from introducing smart technologies in investigating cybercrime. Third, the simulation results of the levels of the acceptance rate of increased taxes and privacy invasion show that the acceptance rate of police officers is generally higher, which means that the public is more sensitive to an increase in taxes and privacy invasion. Fourth, the results of the cost-benefit analysis of introducing smart policing technologies in cybercrime show that the benefit of introducing such technologies is larger than its cost, the latter being the budget the government is currently investing.
The findings of this study can provide some useful and important implications in establishing an R&D plan for smart policing technologies. Three key policy implications arise from these results. First, since the public and police officers have different perceptions toward the effect of introducing smart policing technologies, various stakeholders’ opinions should be considered before establishing an R&D plan in policing. In other words, R&D planning should not be based solely on the utility of either the public (beneficiary and cost-payer of the technology) or police officers (actual users of the technology), but should consider both simultaneously.
Second, the biggest obstacles in introducing smart policing technologies are an increase in taxes and privacy invasion, regardless of referring to cybercrime prevention or investigation. Therefore, to enhance the acceptance of such technologies, an institutional framework should be built to addresses these issues.
Third, the importance of crime prevention compared with investigation should be noted. As our results suggest, the public considers smart policing technologies that enhance the prevention of crime more beneficial than those that enhance the investigation of crime. However, the current R&D of smart policing is focused on investigation. Therefore, the perception of the public should be considered and the importance of technologies that can prevent crimes reconsidered. This is an important angle of this study. There is a possible reconciliation of the differences between the public and police, in that the police value investigation, which is less invasive than massive crime prevention programs involving widespread surveillance. If the public understood the police’s actual preference for investigation (through studies such as this one), they might be more willing to accept technologies promoting investigation, both benefiting the police in reality and minimizing mass surveillance. With more understanding and less conflict between these two groups, sustainable policing for a sustainable community will become possible.
Finally, this study can be supplemented by various future studies. First, a researcher may consider more samples, more factors, or classify the public into more specific groups to gain additional implications. Moreover, this study analyzed the attitudes toward the general effects of smart policing technologies such as increase in clearance rate, but future studies may want to consider a specific technology and its attributes for more delicate R&D planning. Finally, similar studies in other parts of the world are possible.

Acknowledgments

We would like to thank journal editors and two anonymous referees for their constructive suggestions and comments for improving this research. This research was financially supported by Projects for Research and Development of Police Science and Technology under the Center for Research and Development of Police Science and Technology and the Korean National Police Agency (PA-D000001).

Author Contributions

The key research idea was developed and framework of the research was designed by Kisoo Lee and Jongsu Lee together. Hyungbin Moon and Hyunhong Choi designed the survey for statistical data collection and conducted empirical data analysis. Kisoo Lee and Hyungbin Moon wrote the first draft. The paper was then revised and refined by Hyunhong Choi. During the review process, Kisoo Lee and Hyungbin Moon were mainly responsible for revising the theoretical parts, and Hyunhong Choi and Jongsu Lee were mainly responsible for revising the empirical parts of the research. All authors have read and approved the final manuscript.

Conflicts of Interest

The authors declare no conflicts of interest.

References

  1. Call, C. Sustainable Development in Central America: The Challenges of Violence, Injustice and Insecurity; Institut für Iberoamerika-Kunde: Hamburg, Germany, 2000; Volume 8. [Google Scholar]
  2. Raco, M. Securing sustainable communities: Citizenship, safety and sustainability in the new urban planning. Eur. Urban Reg. Stud. 2007, 14, 305–320. [Google Scholar] [CrossRef]
  3. Müller, M.M. Community policing in Latin America: Lessons from Mexico City. Eur. Rev. Lat. Am. Caribb. Stud. 2010, 88, 21–38. [Google Scholar] [CrossRef]
  4. Korea National Police Agency. Crime Statistics. Available online: http://www.police.go.kr (accessed on 8 September 2016).
  5. Degli Esposti, S.; Pavone, V.; Santiago-Gomez, E. Aligning security and privacy: The case of Deep Packet Inspection. In Surveillance, Privacy and Security: Citizens' Perspectives; Friedewald, M., Burgess, P.J., Čas, J., Bellanova, R., Peissl, W., Eds.; Routledge: London, UK, 2017; pp. 71–90. ISBN 978-1138649248. [Google Scholar]
  6. Wright, S. Mythology of cyber-crime—Insecurity & governance in cyberspace: Some critical perspectives. In Cyberspace: Risks and Benefits for Society, Security and Development; Ramírez, J.M., García-Segura, L.A., Eds.; Springer: Cham, Switzerland, 2017; pp. 211–227. [Google Scholar]
  7. Nunn, S. Police technology in cities: Changes and challenges. Technol. Soc. 2001, 23, 11–27. [Google Scholar] [CrossRef]
  8. Sarre, R.T.; Brooks, D.; Smith, C.; Draper, R. Current and emerging technologies employed to abate crime and to promote security. In The Routledge Handbook of International Crime and Justice Studies; Arrigo, B., Bersot, H., Eds.; Routledge: Oxon, UK, 2014; pp. 327–349. [Google Scholar]
  9. Danziger, J.N.; Kraemer, K.L. Computerized data-based systems and productivity among professional workers: The case of detectives. Public Adm. Rev. 1985, 45, 196–209. [Google Scholar] [CrossRef]
  10. Ioimo, R.E.; Aronson, J.E. Police field mobile computing: Applying the theory of task-technology fit. Police Q. 2004, 7, 403–428. [Google Scholar] [CrossRef]
  11. Neyroud, P.; Disley, E. Technology and policing: Implications for fairness and legitimacy. Policing 2008, 2, 226–232. [Google Scholar] [CrossRef]
  12. Koper, C.S.; Lum, C.; Willis, J.J. Optimizing the use of technology in policing: Results and implications from a multi-site study of the social, organizational, and behavioural aspects of implementing police technologies. Policing 2014, 8, 212–221. [Google Scholar] [CrossRef]
  13. Lim, S.; Woo, J.; Lee, J.; Huh, S.Y. Consumer valuation of personal information in the age of big data. J. Assoc. Inf. Sci. Technol. 2017. [Google Scholar] [CrossRef]
  14. Bennett, C.J. The Political Economy of Privacy: A Review of the Literature; Center for Social and Legal Research: Hackensack, NJ, USA, 1995. [Google Scholar]
  15. White, T.B. Consumer disclosure and disclosure avoidance: A motivational framework. J. Consum. Psychol. 2004, 14, 41–51. [Google Scholar]
  16. Phelps, J.; Nowak, G.; Ferrell, E. Privacy concerns and consumer willingness to provide personal information. J. Public Policy Mark. 2000, 19, 27–41. [Google Scholar] [CrossRef]
  17. Ackerman, M.S. Privacy in pervasive environments: Next generation labeling protocols. Pers. Ubiquitous Comput. 2004, 8, 430–439. [Google Scholar] [CrossRef]
  18. Smith, H.J.; Dinev, T.; Xu, H. Information privacy research: An interdisciplinary review. Manag. Inf. Syst. Q. 2011, 35, 989–1015. [Google Scholar]
  19. Beldad, A.; de Jong, M.; Steehouder, M. A comprehensive theoretical framework for personal information-related behaviors on the internet. Inf. Soc. 2011, 27, 220–232. [Google Scholar] [CrossRef]
  20. Hann, I.-H.; Hui, K.-L.; Lee, S.-Y.T.; Png, I.P.L. Overcoming online information privacy concerns: An information-processing theory approach. J. Manag. Inf. Syst. 2007, 24, 13–42. [Google Scholar] [CrossRef]
  21. Ögütçü, G.; Testik, Ö.M.; Chouseinoglou, O. Analysis of personal information security behavior and awareness. Comput. Secur. 2016, 56, 83–93. [Google Scholar] [CrossRef]
  22. Korea Consumer Agency. A Study on the Protection of Information Privacy of Consumers in the Era of Big Data; Policy Research Report 14-09; Korea Consumer Agency: Eum Seong, Korea, 2014. (In Korean)
  23. Greenleaf, G. Asian Data Privacy Laws: Trade & Human Rights Perspectives; Oxford University Press: Oxford, UK, 2014. [Google Scholar]
  24. Correia, M.E.; Reisig, M.D.; Lovrich, N.P. Public perceptions of state police: An analysis of individual-level and contextual variables. J. Crim. Justice 1996, 24, 17–28. [Google Scholar] [CrossRef]
  25. Weitzer, R.; Tuch, S.A. Determinants of public satisfaction with the police. Police Q. 2005, 8, 279–297. [Google Scholar] [CrossRef]
  26. Reisig, M.D.; Giacomazzi, A.L. Citizen perceptions of community policing: Are attitudes toward police important? Policing 1998, 21, 547–561. [Google Scholar] [CrossRef]
  27. Tyler, T.R. Trust and legitimacy: Policing in the USA and Europe. Eur. J. Criminol. 2011, 8, 254–266. [Google Scholar] [CrossRef]
  28. Dowler, K.; Zawilski, V. Public perceptions of police misconduct and discrimination: Examining the impact of media consumption. J. Crim. Justice 2007, 35, 193–203. [Google Scholar] [CrossRef]
  29. Callanan, V.J.; Rosenberger, J.S. Media and public perceptions of the police: Examining the impact of race and personal experience. Policy Soc. 2011, 21, 167–189. [Google Scholar] [CrossRef]
  30. Mazerolle, L.; Antrobus, E.; Bennett, S.; Tyler, T.R. Shaping citizen perceptions of police legitimacy: A randomized field trial of procedural justice. Criminology 2013, 51, 33–63. [Google Scholar] [CrossRef]
  31. Dimc, M.; Dobovšek, B. Perception of cybercrime by selected internet users in Slovenia and USA. J. Crim. Justice Secur. 2013, 3, 338–356. [Google Scholar]
  32. Näsi, M.; Oksanen, A.; Keipi, T.; Räsänen, P. Cybercrime victimization among young people: A multi-nation study. J. Scand. Stud. Criminol. Crime Prev. 2015, 16, 203–210. [Google Scholar] [CrossRef]
  33. Williams, L.M. Beyond enforcement: Welcomeness, local law enforcement, and immigrants. Public Adm. Rev. 2015, 75, 433–442. [Google Scholar] [CrossRef]
  34. Maguire, M. Policing by risks and targets: Some dimensions and implications of intelligence-led crime control. Policy Soc. 2000, 9, 315–336. [Google Scholar] [CrossRef]
  35. Colvin, M.; Noorlander, P. Under Surveillance: Covert Policing and Human rights Standards; Justice: London, UK, 1998. [Google Scholar]
  36. Fox, R. Someone to watch over us: Back to the panopticon? Criminol. Crim. Justice 2001, 1, 251–276. [Google Scholar] [CrossRef]
  37. Schaefer Morabito, M. The adoption of police innovation: The role of the political environment. Policing 2008, 31, 466–484. [Google Scholar] [CrossRef]
  38. Pavone, V.; Degli Esposti, S. Public assessment of new surveillance-oriented security technologies: Beyond the trade-off between privacy and security. Public Underst. Sci. 2012, 21, 556–572. [Google Scholar] [CrossRef] [PubMed]
  39. Strickland, L.S.; Hunt, L.E. Technology, security, and individual privacy: New tools, new threats, and new public perception. J. Am. Soc. Inf. Sci. Technol. 2005, 56, 221–234. [Google Scholar] [CrossRef]
  40. Valkenburg, G. Privacy versus security: Problems and possibilities for the trade-off model. In Reforming European Data Protection Law; Gutwirth, S., Leenes, R., de Hert, P., Eds.; Springer: Amsterdam, The Netherlands, 2015; pp. 253–269. [Google Scholar]
  41. Friedewald, M.; van Lieshout, M.; Rung, S.; Ooms, M.; Ypma, J. Privacy and security perceptions of European citizens: A test of the trade-off model. In IFIP International Summer School on Privacy and Identity Management; Camenisch, J., Fischer-Hübner, S., Hansen, M., Eds.; Springer: Edinburgh, UK, 2014; pp. 39–53. [Google Scholar]
  42. Lin, C.; Hu, P.J.H.; Chen, H. Technology implementation management in law enforcement: COPLINK system usability and user acceptance evaluation. Soc. Sci. Comput. Rev. 2004, 22, 24–36. [Google Scholar] [CrossRef]
  43. Jen-Hwa Hu, P.; Lin, C.; Chen, H. User acceptance of intelligence and security informatics technology: A study of COPLINK. J. Am. Soc. Inf. Sci. Technol. 2005, 56, 235–244. [Google Scholar] [CrossRef]
  44. Egnoto, M.; Ackerman, G.; Iles, I.; Roberts, H.A.; Smith, D.S.; Liu, B.F.; Behlendorf, B. What motivates the blue line for technology adoption? Insights from a police expert panel and survey. Policing 2017, 40, 306–320. [Google Scholar] [CrossRef]
  45. Train, K.E. Discrete Choice Methods with Simulation; Cambridge University Press: Cambridge, UK, 2009. [Google Scholar]
  46. Louviere, J.J.; Hensher, D.A.; Swait, J.D. Stated Choice Methods: Analysis and Applications; Cambridge University Press: Cambridge, UK, 2000. [Google Scholar]
  47. Ministry of Government Administration and Home Affairs. Population Census Data. Available online: http://rcps.egov.go.kr (accessed on 11 November 2016).
  48. International Business Machines. Fred Streefland SMARTER Public Safety in a City. 2010. Available online: http://www-05.ibm.com/innovation/be/smarterplanet/conversations/en/pdf/public_safety_fred_streefland.pdf (accessed on 11 November 2016).
  49. McFadden, D. Conditional logit analysis of qualitative choice behavior. In Frontiers of Econometrics; Zarembka, P., Ed.; Academic Press: New York, NY, USA, 1974; pp. 105–142. [Google Scholar]
  50. Lee, M.; Choi, H.; Koo, Y. Inconvenience cost of waste disposal behavior in South Korea. Ecol. Econ. 2017, 140, 58–65. [Google Scholar] [CrossRef]
  51. Woo, J.; Jang, J.; Moon, H.; Lee, J. Analyzing public preference and willingness to pay for spent nuclear fuel facilities in South Korea: A latent class approach. Prog. Nucl. Energy 2017, 100, 255–265. [Google Scholar] [CrossRef]
  52. Koo, Y.; Kim, C.S.; Hong, J.; Choi, I.J.; Lee, J. Consumer preferences for automobile energy-efficiency grades. Energy Econ. 2012, 34, 446–451. [Google Scholar] [CrossRef]
  53. Hong, J.; Koo, Y.; Jeong, G.; Lee, J. Ex-ante evaluation of profitability and government’s subsidy policy on vehicle-to-grid system. Energy Policy 2012, 42, 95–104. [Google Scholar] [CrossRef]
  54. Train, K.; Sonnier, G. Mixed logit with bounded distributions of correlated partworth. In Applications of Simulation Methods in Environmental and Resource Economics; Scarpa, R., Alberini, A., Eds.; Springer: Amsterdam, The Netherlands, 2005; pp. 117–134. [Google Scholar]
Figure 1. An example of the choice experiment (cybercrime prevention).
Sustainability 09 01921 g001
Figure 2. An example of the choice experiment (cybercrime investigation).
Sustainability 09 01921 g002
Figure 3. Acceptance of smart policing technologies by tax increase.
Sustainability 09 01921 g003
Figure 4. Acceptance of smart policing technologies by intensity of privacy invasion.
Sustainability 09 01921 g004
Table 1. Attributes and attribute levels for the effect of introducing smart policing technologies for cybercrime prevention.
AttributesAttribute Level
Increase in tax (cost)500 KRW/year
1500 KRW/year
2500 KRW/year
Invasion of privacyNo risk of invasion (private information is not collected)
Low risk of invasion (information such as sign up log, ID, IP address, and visit log are collected)
High risk of invasion (information such as sign up log, ID, IP address, visit log, accessing region, MAC address, trading information, and real name are collected)
Decrease in manpower neededCurrent level
15% decreased
30% decreased
Decrease in hacking crimeCurrent level
15% decreased
30% decreased
Auto-blocking of harmful contentsCurrent level
15% increased
30% increased
Note: ID = identity; IP address = internet protocol address; MAC address = media access control address.
Table 2. Attributes and attribute levels for the effect of introducing smart policing technologies for cybercrime investigation.
AttributesAttribute Level
Increase in tax (cost)500 KRW/year
1500 KRW/year
2500 KRW/year
Invasion of privacyNo risk of invasion (private information is not collected)
Low risk of invasion (information such as sign up log, ID, IP address, and visit log are collected)
High risk of invasion (information such as sign up log, ID, IP address, visit log, accessing region, MAC address, trading information, and real name are collected)
Decrease in time spent for investigationCurrent level
25% decreased
50% decreased
Increase in clearance rateCurrent level
10%p increased
20%p increased
Decrease in police misconductCurrent level
Police misconduct decreased
Note: ID = identity; IP address = internet protocol address; MAC address = media access control address.
Table 3. Descriptive statistics.
General PublicPolice Officers
ClassificationRespondents (%)ClassificationRespondents (%)
Total500 (100.0)Total161 (100.0)
GenderMale248 (49.6)PositionLower than sergeant41 (25.5)
Female252 (50.4)Higher than lieutenant120 (74.5)
Age20-29123 (24.6)DutyPatrol division61 (37.9)
30-39133 (26.6)Investigation support15 (9.3)
40-49133 (26.6)Traffic14 (8.7)
50-59111 (22.2)Public safety13 (8.1)
RegionSeoul217 (43.4)Police affairs13 (8.1)
Ilsan22 (4.4)Guard10 (6.2)
Bundang20 (4.0)Information equipment8 (5.0)
Incheon57 (11.4)Intellectual crime7 (4.3)
Busan73 (14.6)Information4 (2.5)
Daegu51 (10.2)Security4 (2.5)
Gwangju30 (6.0)Violent crime2 (1.2)
Daejeon30 (6.0)Others10 (6.2)
Table 4. Estimation results of introduction of smart policing technologies in cybercrime prevention for the general public.
VariableCoefficientVarianceMWTP (Per Year)Relative Importance
Increase in tax−1.087 ***4.300-25.5%
Invasion of privacy−1.964 ***2.958 *−2607 KRW24.0%
Decrease in hacking crime0.649 ***0.541 ***70 KRW/%23.6%
Auto-blocking of harmful contents0.328 ***0.515 ***30 KRW/%13.7%
Decrease in manpower needed0.257 ***0.477 ***36 KRW/%13.2%
Note: MWTP = marginal willingness to pay. ***, ** and * indicate significance at the 1%, 5%, and 10% levels, respectively.
Table 5. Estimation results of introduction of smart policing technologies in cybercrime prevention for police officers.
VariableCoefficientVarianceMWTP (Per Year)Relative Importance
Decrease in hacking crime0.713 ***0.626 ***129 KRW/%24.9%
Decrease in manpower needed0.622 ***0.494 ***140 KRW/%24.4%
Auto-blocking of harmful contents0.529 ***0.473 ***122 KRW/%18.9%
Invasion of privacy−1.527 ***1.806 *−3332 KRW18.8%
Increase in tax−0.543 ***1.115 **-13.0%
Note: MWTP = marginal willingness to pay. ***, ** and * indicate significance at the 1%, 5%, and 10% levels, respectively.
Table 6. Estimation results of introduction of smart policing technologies in cybercrime prevention for the general public.
VariableCoefficientVarianceMWTP (Per Year)Relative Importance
Invasion of privacy−1.045 **17.251 **−1505 KRW30.7%
Increase in tax−2.640 ***465.097 ***-27.1%
Increase in clearance rate0.554 ***1.102 ***143 KRW/%p20.2%
Decrease in police misconduct0.277 *3.148 *41 KRW11.6%
Decrease in time spent for investigation−0.0170.182 ***-10.5%
Note: MWTP = marginal willingness to pay. ***, ** and * indicate significance at the 1%, 5%, and 10% levels, respectively.
Table 7. Estimation results of introduction of smart policing technologies in cybercrime prevention for police officers.
VariableCoefficientVarianceMWTP (Per Year)Relative Importance
Decrease in time spent for investigation0.0820.250 ***-30.2%
Invasion of privacy−0.789 **4.408 **−124,568 KRW29.7%
Increase in clearance rate0.284 **0.862 ***3949 KRW/%p24.6%
Decrease in police misconduct0.1121.769 **-15.0%
Increase in tax−0.005 ***0.000-0.5%
Note: MWTP = marginal willingness to pay. ***, ** and * indicate significance at the 1%, 5%, and 10% levels, respectively.
Table 8. Acceptance rate for smart policing technology by increase in tax.
Increase in Tax (KRW/Year)030060090012001500180021002400
Public (Prevention)67.1%60.4%54.4%49.7%46.0%42.8%40.0%37.4%34.9%
Police (Prevention)86.5%84.7%82.7%80.3%77.6%74.7%71.7%68.8%66.0%
Public (Investigation)55.9%44.6%40.3%37.7%35.8%34.2%32.6%31.2%29.8%
Police (Investigation)51.9%51.8%51.7%51.7%51.6%51.6%51.5%51.4%51.4%
Table 9. Acceptance of smart policing technologies by change in invasion of privacy.
Intensity of Privacy InvasionNone (0)Low (0.5)High (1)
Public (Prevention)72.8%56.3%40.0%
Police (Prevention)90.3%83.4%71.8%
Public (Investigation)53.6%41.4%34.8%
Police (Investigation)62.3%51.8%42.9%
Table 10. Total benefit of introducing smart policing technologies in cybercrime prevention.
AttributeAnnual Household MWTPTotal Household Annual MWTPAttribute LevelTotal Benefit
Invasion of privacyKRW −2607KRW −55,201 millionlowKRW −27,601 million
Decrease in manpower needed36 KRW/%762 million KRW/%10%KRW 7621 million
Decrease in hacking crime70 KRW/%1492 million KRW/%10%KRW 14,920 million
Auto-blocking of harmful contents30 KRW/%627 million KRW/%10%KRW 6275 million
Table 11. Total benefit of introducing smart policing technologies in cybercrime investigation.
AttributeAnnual Household MWTPTotal Household Annual MWTPAttribute LevelTotal Benefit
Invasion of privacyKRW −1505KRW −31,870 millionLowKRW −15,935 million
Increase in clearance rateKRW 143/%pKRW 3026 million/%p5%pKRW 15,132 million
Decrease in police misconductKRW 41KRW 877 millionDecreaseKRW 877 million

