Review

Monitoring and Optimization of the Process of Drying Fruits and Vegetables Using Computer Vision: A Review

1
Department for Innovation in Biological, Agro-food and Forest system (DIBAF), Tuscia University, 01100 Viterbo, Italy
2
Department of Agricultural and Forestry Sciences, (DAFNE) Tuscia University, Via San Camillo de Lellis snc, 01100 Viterbo, Italy
*
Author to whom correspondence should be addressed.
Sustainability 2017, 9(11), 2009; https://0-doi-org.brum.beds.ac.uk/10.3390/su9112009
Submission received: 27 September 2017 / Revised: 18 October 2017 / Accepted: 28 October 2017 / Published: 2 November 2017

Abstract

:
An overview is given regarding the most recent use of non-destructive techniques during drying used to monitor quality changes in fruits and vegetables. Quality changes were commonly investigated in order to improve the sensory properties (i.e., appearance, texture, flavor and aroma), nutritive values, chemical constituents and mechanical properties of drying products. The application of single-point spectroscopy coupled with drying was discussed by virtue of its potentiality to improve the overall efficiency of the process. With a similar purpose, the implementation of a machine vision (MV) system used to inspect foods during drying was investigated; MV, indeed, can easily monitor physical changes (e.g., color, size, texture and shape) in fruits and vegetables during the drying process. Hyperspectral imaging spectroscopy is a sophisticated technology since it is able to combine the advantages of spectroscopy and machine vision. As a consequence, its application to drying of fruits and vegetables was reviewed. Finally, attention was focused on the implementation of sensors in an on-line process based on the technologies mentioned above. This is a necessary step in order to turn the conventional dryer into a smart dryer, which is a more sustainable way to produce high quality dried fruits and vegetables.

1. Introduction

Drying is one of the most energy-consuming, being nonlinear in the changes in water content, unit operations in postharvest processing, and it has been used since ancient times. Drying is a complex operation that involves removal of moisture. During drying, two processes occur simultaneously [1]:
(1)
transfer of energy, mostly as heat, generally from the surrounding environment and/or an energy source to the wet solid;
(2)
transfer of mass, as moisture, from inside of the solid to the surface and its subsequent evaporation due to the process described in Point 1.
The aim of food drying is the reduction of the amount of free-water to slow down deteriorative processes, which are principally caused by microbial growth, chemical reaction and/or enzymatic activity. Fruits and vegetables are particularly susceptible to deteriorative processes, since their initial water content range is from 74–90% w/w [2], and then, water activity allows microbial growth (>0.60). Drying, then, can positively affect fruits’ and vegetables’ shelf-life. Furthermore, it can reduce the cost of storage and transport, due to the loss of the original shape and weight. However, despite these advantages, the process may cause damage and severe changes in the physicochemical and organoleptic properties of the products [3]. Indeed, there are changes in flavor, color, shrinkage and with no adequate control, oxidation of fat and degradation of nutritional compounds [1,3,4].
The very first drying method was solar drying (SD), which required many windy and sunny days to dry the food. Despite this limitation, the method is still used (e.g., production of dried tomatoes in the south of Italy). Nowadays, however, several types of dryers have been developed (e.g., hot-air-convective, microwave, infrared, osmotic and freeze dryers), and the selection among them is important to obtain a quality product [1,3]. Hot-air drying (AD) is the most conventional drying method, and due to the high temperature and long drying cycle, there are usually important losses of flavor, color and nutritional compounds (e.g., vitamin C, carotenoids and phenolic compounds) [4,5]. Microwave (MW) and infrared drying (IR-D) offer some advantages over AD (e.g., better efficiency and faster drying rate) [1]. However, the energy transfer in the drying process is not homogeneous; this results in a disadvantage, which is difficult to eradicate due to the molecular structure and the dielectric properties of the dried products [6]. Osmotic dehydration (OD) is a process often used in combination with other drying methods, which using sugar syrup or brine to remove water, offering some advantages in terms of energy savings and retention of color, aroma and nutritional compounds [7]. Finally, freeze drying (FD) is one of the best methods in order to remove the largest amount of water from products [3,8], and moreover, it works at low pressure and temperature. For this reason, FD is also the best solution to preserve foods’ quality. However, it is also the dryer that requires the most amount of energy to perform the unit operation [3]. For this reason, it is not convenient to use this technology to preserve low cost fruits and vegetables (e.g., carrots, potatoes, onion and the like).
Energy consumption for all the drying processes discussed above is high due to the huge amount of latent heat required for phase transformation of moisture. Thus, the optimization of the operating temperature and the implementation of heat-recovery systems are fundamental in order to get maximum earnings with the lowest environmental impact. However, conventional dryers are far from the optimization of the energy utilization. Frequently, indeed, the food industry over-dries the product, even when it is not necessary to remove such an amount of moisture in order to preserve food-stocks well. Normally, choosing the right amount of moisture enables one to preserve the commodities for a long time and, at the same time, retains the nutrients better, avoiding unnecessary exposition to high temperature [9]. Nowadays, on the market, there is a wide offering of drying devices. Industrial dryers are usually equipped with sensors (e.g., humidity and temperature sensors). The aim of these sensors is to monitor air temperature and relative humidity inside and outside of the drying chamber [10]. These dryers are hardly ever linked to instrumentation able to monitor on-line changes of the products, with the exception of load cells for weight loss [7,10]. This gap opens several possibilities to enhance drying performances.
Single-point spectroscopy in the visible and near infrared region (Vis-NIR) [11], machine vision (MV) [12] and the combination of these technologies (i.e., hyper- and multi-spectral imaging (HSI, MSI) [13]) are devices able to non-destructively assess quality changes during drying. Furthermore, they are simple to use even for non-specialized operators, even if they require a calibration step to work properly [11,12,13]. In the literature, the application of these devices is adopted for the monitoring of moisture content [14,15], shrinkage [16,17], color [15,16], size and shape [16,18], as well as the change of soluble solid content [14,19,20,21], carotenoids [21], vitamin C [22] or phenolic compounds [23,24].
The simultaneous and instant monitoring of processing parameters (e.g., flow rate, air humidity and temperature, sample weight) and product parameters (e.g., color, shrinkage, soluble solid content, water activity, etc.) allows a better modulation of the response of the dryer, energy savings and, at the same time, higher quality dried products. A dryer with such characteristic is by definition a smart dryer [25].
The aim of this work is to present the most recent innovation in the use of non-destructive techniques such as MV, Vis-NIR and HSI in order to control the quality changes and safety aspect with respect to fruits and vegetables before, during and after the drying process, with the goal of obtaining a smart modulation of the process itself. Finally, attention is briefly focused on the quality aspects of the organic dried product because, despite consumer demand, there is a lack of guidelines for processing organic food [26], and to our knowledge, very few works in the literature have been written on this topic.

2. Literature Review

We developed a search strategy in Scopus [27], PubMed [28] and Google Scholar [29], using Boolean combinations (i.e., using the AND logical operator) of three search words (i.e., drying, dryer and dehydration) with the following terms: quality, foodstuffs, vegetables, fruits, food, non-destructive technique, machine vision, image analysis, hyperspectral camera, near infrared spectroscopy, UV-Vis spectroscopy, quality inspection, moisture content, water activity, chemometrics, principal component analysis, image pre-processing, quality changes, shrinkage, color, algorithm, regression, prediction, automation, data-processing, segmentation, texture, nutritional changes, physio-chemical changes, organic and organic legislation. Only articles published from 1999 onwards were taken into account, except for those that were necessary to write about the history of instrumentation and historical applications.

3. Fundamentals of Food-Drying

In the optimization of the drying process, many parameters are considered, in order to reach the following objectives: an increase of foodstuff stability, a reduction of storage and transport costs, energy savings and, of course, a high-quality product [30]. The total cost of a drying process and the quality of the final foodstuff often are competing parameters, especially for low cost processed food. The main aspects in terms of energy and quality for fruits and vegetables are discussed below.

3.1. Quality Aspect in Drying

During drying of fruits and vegetables, many physicochemical changes occur, such as: changes in color due to enzymatic or non-enzymatic browning reactions, changes in texture and shrinkage and loss and/or degradation of nutritional compounds (e.g., ascorbic acid, carotenoids, phenolic compounds and the like) [31].

3.1.1. Nutritional Quality Changes

The nutritional quality of fruits and vegetables depends on their chemical composition, which shows a wide range of variation depending on the species, cultivar and maturity stage. Heat processing, moreover, leads to the degradation and/or isomerization of most of the chemical compounds. Due to the complexity of the matrices, some chemical compounds are chosen as markers of nutritional quality [32]. For fruit and vegetables, ascorbic acid, carotenoids, vitamin E and phenolic content are generally used as markers.

Vitamin C

Ascorbic acid (AA), also known as vitamin C, is an essential nutrient in the human diet. Since fruits and vegetables have a high content of AA, it is commonly used as a quality marker. AA is an antioxidant, heat labile and water soluble compound and is able to regenerate tocopherols (vitamin E), from its oxidized form [33]. High temperature, long drying cycle and exposure to oxygen cause a strong reduction of its concentration in fruit and vegetables. Tomato, indeed, after drying at 75 °C loses about half of its original AA content [34]. Furthermore, it has been observed, in a study on fluted pumpkin leaves, that high temperature over a short-time at low pH leads to a better retention of AA than a lower temperature over a long process at high pH [35]. During hot-air drying, vitamin C losses are greater than the ones related to freeze drying [36]. A slight loss of AA occurs during blanching in hot water due its water-solubility. However, the pretreated sample retained better AA during drying [30].

Carotenoids

Carotenoids are a large class of tetraterpenes responsible for the bright red, yellow and orange color in many fruits and vegetables. Due to their highly hydrophobic nature, they are mainly present within the lipid membrane or in complexes with proteins [37]. There are more than 600 compounds classified as carotenoids, and most of them are human precursors of vitamin A. In plants, they help in photosynthesis and prevent the oxidation of chlorophylls; in human beings, consumption of β-carotene and lutein, the two most important dietary carotenoids, reduces the risk of lung cancer and chronic eye diseases like cataracts [38]. Slight decreases in total carotenoids content were observed during hot-air drying of carrots [39]; moreover, coupled blanching and drying releases carotenoids from lipid membranes and complexes, resulting in better bio-availability [40,41]. Despite this positive effect, heat induces the isomerization of carotenoids from trans to cis, which is more susceptible to oxidation [42]. Finally, it was seen that the lycopene concentration decreases more in FD than AD or MW drying [43].

Phenols

Phenols are a large class of compounds that have at least an aromatic ring with one or more hydroxy-substituents; they may include functional derivatives (e.g., esters). Phenol compounds have antioxidant activity, and in plants, they act as a defense mechanism against pathogens and parasites; for this reason, the peel commonly has a higher level of phenols than the flesh [44]. Commonly, they are also associated with sensorial characteristics (i.e., astringency, color, etc.) [23]. Fruits and vegetables rich in phenols are commonly blue or red. The regular consumption of fruits and vegetables rich in phenols is associated with a reduction in the risk of developing chronic diseases, such as cancer and cardiovascular disease [45]. Significant losses of phenols occur during mechanical processing (e.g., peeling, slicing or shredding); all these steps expose phenols to oxygen directly [46]. Higher loss of phenolics occurs in AD compared with FD and MW drying. This is because it requires a higher temperature and a long drying time [4,47].

Vitamin E

Vitamin E comprises a group of fat-soluble compounds that include both tocopherols and tocotrienols. α-tocopherols are the most abundant in the human body [48].Vitamin E compounds are highly susceptible to oxygen and light exposure during processing and storage [32]. Fatty foods, broccoli and leafy vegetables are good sources of this vitamin. During drying of chestnut at low temperature (e.g., 50 °C for 10 h), it was seen that vitamin E content decreased just slightly [49]. Furthermore, around a 10% vitamin E loss was reported during cooking and microwaving of bean [50].

3.1.2. Color Changes

Color preservation is crucial to make processed fruit and vegetables attractive and acceptable. Indeed, it is the first attribute considered by the consumer to make a buying decision [51]. For this reason, several researches have, as a matter of study, considered color conservation during post-harvest handling and processing of fruits and vegetables [51]. During drying, many phenomena are responsible of color changes. The most common ones are pigment degradation (e.g., chlorophylls and carotenoids) [52] and the occurrence of browning, due both to enzymatic and non-enzymatic reactions [53].

Chlorophylls and Carotenoids

The color of green and yellow/red/orange vegetables is mainly due to pigments closely related to chlorophylls and carotenoids, respectively [54]. These pigments are easily degraded during post-harvest processing by light, heat, oxygen and enzymes [55]. However, it should be noted that the type of product, origin, pre-treatment and type of drying affect the degradation rate of chlorophylls and carotenoids [54] Furthermore, high temperature and low pH stimulate the conversion of chlorophylls into pheophytins by replacing the central magnesium in the chlorin ring with two hydrogen ions [56]; when chlorophyll is converted into pheophytin, the color changes from light-bright green to olive brown. The conversion rate of pheophytins’ formation seems to be slowed down at a water activity (aw) lower than 0.32 [52]. In addition to this reaction, chlorophyll degradation is related to fat peroxidation. In this reaction, lipoxidase and oxygen play the major role [57].

Enzymatic Browning

Polyphenol oxidase (PPO, EC-1.10.32) and peroxidases (POD, EC number 1.11.1.x) are mainly responsible for enzymatic browning. The pathway results in phenols’ degradation and starts with the conversion of amino acid L-phenylalanine to trans-cinnamic acid by enzyme phenylalanine lyase (PAL, EC. 4.3.1.5) [58,59]. After this step is the conversion of trans-cinnamic acid by PPO to ortho-quinones, which spontaneously polymerize to melanins, which are brown pigments responsible for tissue browning [60,61]. In the food processing industry, the results of the activity of these enzymes are often undesirable. For example, a high level of melanins, which are enzymatic browning products, is responsible for the brownish color and off-flavor. One exception is made for Sultana grapes, because consumers seem to prefer brown dried grapes [62]. Several solutions were adopted to inhibit enzyme activity: the use of heat as pre-treatment, to inactivate the enzyme, and the use of sulfur dioxide or sulfites, which are able to complex an intermediate product, the o-quinones [63]. Another way to reduce this adverse phenomenon is to lower the pH of the products using acid (e.g., citric, malic, phosphoric and ascorbic acid) or combining different unit operations (e.g., OD with AD) [64].

Non-Enzymatic Browning

Non-enzymatic browning (NEB) is a series of chemical reactions that occur during a thermal process, resulting in changes in color, texture, antioxidant compounds and aroma [65,66]. The most important non-enzymatic processes are caramelization, which involves pyrolysis of sugars, and the Maillard reaction (MR) [67]. Louis Maillard was the French chemist who first described the MR, in 1913, while John E. Hodge was the first one to describe its chemical pathway, in 1953. The initial stage of MR involves a reaction between a reducing sugar and free amino group (e.g., amino acids, polypeptides and protein) to give N-substituted glucosamine, which then rearranges to form the Amadori and Heyn’s products [68]. MR is a complex net of parallel and consecutive chemical reactions, which are related to product characteristics (e.g., pH, moisture content, etc.) and the processing parameters (e.g., temperature and heat exposure time) [66,69]. At a pH lower than 7.0, the reaction primarily leads to the formation of furfural and hydroxy-methylfurfural [66,68,70], while at a pH higher than 7.0, 4-hydroxy-5-methyl-2,3-dihydrofuran-3-one (HMFone) and fission products (e.g., acetol, pyruvaldehyde and diacetyl) are mainly formed [66,69]. Despite the pathway, all these compounds are highly reactive and, thus, are involved in further reactions responsible for the development of brown pigments (e.g., melanoidins) [70]. Commonly, NEB is monitored as follow:
  • content of sugar (e.g., sucrose, fructose and glucose) [70,71],
  • HMF [70,72] and furfural [72],
  • spectral measurement at 420 nm to measure the browning development [70,71,72,73].
NEB often reduces the quality of processed foods [74] with some exceptions, e.g., roasted coffee and bakery products, in which MR is responsible for better color, taste and aroma [75].

3.1.3. Physical Changes

During drying, physical changes occur, and often, they strongly influence drying product characteristics. The main physical changes (i.e., shrinkage and texture) are discussed below.

Shrinkage

During drying, fruits and vegetables lose water, and the cellular membranes collapse. The result is a reduction in the shape and size of food tissues, commonly called shrinkage [76]. Moisture gradually moves from the center of the food tissues to the external surfaces [77]. Several studies confirmed that there is a linear correlation between moisture content (MC) and shrinkage [17,78,79]. During the initial stage of AD, shrinkage increases rapidly; the value then slowly increases until it reaches an equilibrium point [80]. It was observed that a stronger shrinkage phenomena occurs in MW and AD dryers than in FD [77,81]. This is because the raised temperature increased the rate of cellular shrinkage following an Arrhenius-type behavior [17]. However, in a study performed on strawberries, a similar rehydration behavior was noticed after MW and FD [82].

Texture

Textural parameters of fruits and vegetables are perceived with the sense of touch and hearing, either when the product is picked up with the hand or placed in the mouth and chewed [83]. Texture is the result of complex interactions among food components at micro- and macro-structural levels [84]; using tomatoes as an example, the greatest contributors to the texture are the insoluble solids, which are derived from the cell walls [50]. Other parameters are related to changes in texture (e.g., the structure of the tissue, turgor pressure, porosity, cellular orientation and composition). During drying of fruits and vegetables, several changes in texture are common (e.g., hardness, cohesiveness, springiness and chewiness) [85].
The main parameter to evaluate texture change is firmness, which is commonly measured using a texture profile analyzer (TPA) [59,86]. The high temperature and long drying time in AD often result in heat-damage and losses in texture [47]. During AD of apple slices, three phases in texture were observed: softening, in which gradual changes in firmness appear, uniform hardness and hardening [87]. The last step is due to a limited moisture diffusion rate [87]. In a study made on carrots, it was deducted that MW was faster and the product showed better textural properties compared with AD [88].

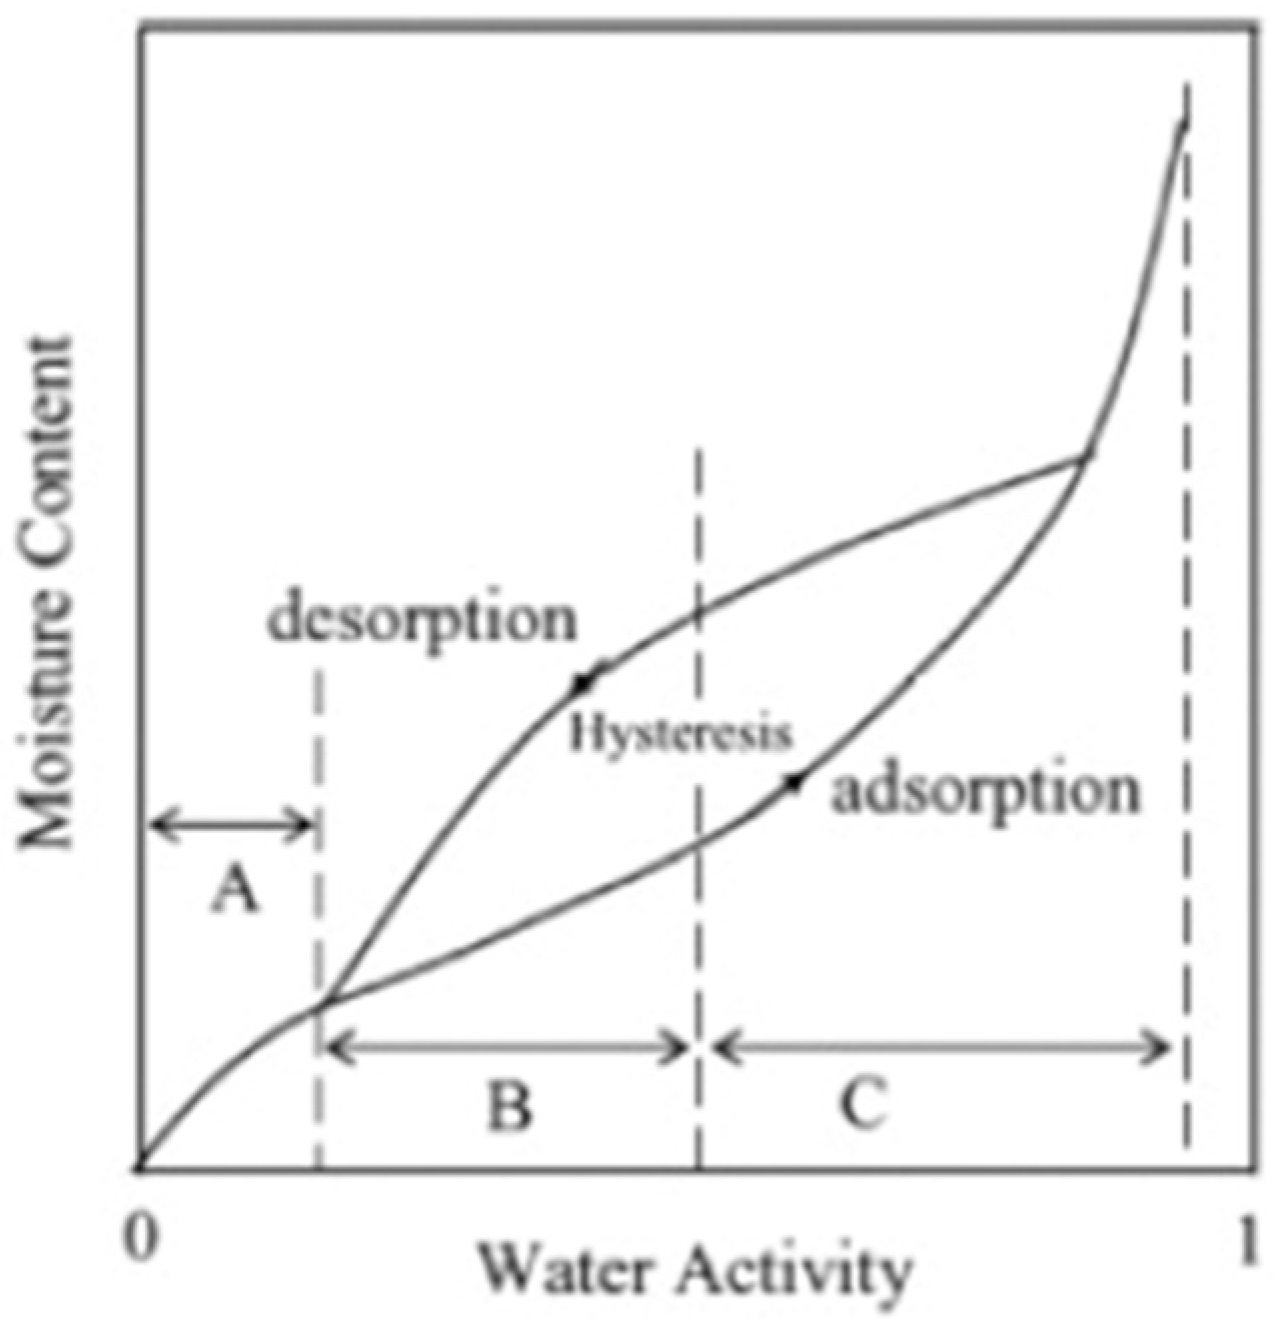
Moisture Content (w) and Water Activity (aw)

Moisture content, or water content (w), is an indicator of the amount of water contained in a solid sample (e.g., soil, fruit and vegetables). Moisture changes during drying are usually expressed as dry basis of moisture content (MCd), which corresponds to the ratio between the amount of water in the sample (mw) over the residual solid content (mRSC), both expressed in the same unit (e.g., g/g or kg/kg).
M C d = m w m R S C ,
However, regarding other food industry applications, moisture content is commonly expressed as wet basis (MCw), which is equal to the ratio between the amount of water in the sample (mw) over the total weight of the sample (mtot).
M C w = m w m t o t = m w m w + m R S C ,
The relationship between MCd and MCw is described by the following equation:
M C d = M C w 1 M C w ,
During drying, mw decreases, and mRSC remains constant. However, microbial growth is more related to the amount of free-water contained in food rather than the total water amount [89]. In order to control microbial growth, then, another parameter should be introduced: the water activity (aw), which is represent as the ratio between the vapor pressure of water in a substance (Pa) over the vapor pressure of pure water (P0) under identical thermodynamic conditions.
a W = P a P 0
Following aw ensures not only microbial growth control, but also the shelf-life of food, the enzymatic activity and the modulation of chemical reaction rates [77]. The relationship between moisture content and water activity during drying is complex, non-linear and unique for each food product. This is due to colligative, capillary and surface effects [90]. At a fixed temperature, the two parameters can be plotted, and the resulting graph is called the moisture sorption isotherm, as shown in Figure 1.

3.2. Energy Aspects in Drying

Drying is one of the most energy intensive unit operations, as it requires 12% of the total energy demand for manufacturing processes in developed countries [92]. For a common dryer, the major cost during its lifetime is the energy consumed, which is roughly five-times its capital cost [93]. Furthermore, most of the energy used in the drying process derives from fossil fuels, therefore leading to greenhouse gas (GHG) emission, which negatively affects the environment. The European Union (EU) is strongly interested in the reduction of GHG emissions. The directive 2012/27/EU establishes a set of common measures for UE members in order to reach at least the 20% energy efficiency target, at all stages of the energy chain, from its production to its final consumption, by 2020.
For dryers, energy efficiency (η), is defined as the energy required rom moisture evaporation at the solids’ feed temperature, (Er), divided by the total energy supplied to the dryer (Es), as shown in Equation (5) [94]:
η = E r E s ,
Energy efficiency (η) is an average parameter and is not representative of the process when there are changes in temperature. To describe the process better, instantaneous energy efficiency formulas (ηins), Equation (6), should be used [94,95].
η i n s = E r ( t ) E s ( t ) ,
Energy efficiency is then the integration of Equation (4) by time, as shown in Equation (7):
η = 1 t 0 t η i n s ( t ) d t ,
For convective drying, assuming the drying system as adiabatic (i.e., with no exchange of heat with the surroundings), energy efficiency can be expressed as thermal efficiency, Equation (8):
η =   T 1 T 2 T 1 T 0 ,
where T0, T1 and T2 are respectively: ambient, inlet and outlet temperature. For microwave-vacuum, drying efficiency (DE) was calculated by Yongsawatdigul and Gunasekaran (1996) as shown in Equation (9) [96]:
D E = t P ( 1 w f ) M i ( w w f ) 10 6   ( M J / k g   H 2 O ) ,
where t (s) is the total time of applied microwave, P (W) is the power applied, wf and wi are the amount of moisture at the initial and final stage and Mi is the initial mass of the sample. However, it should be noted that although Yongsawatdigul and Gunasekaran (1996) assumed Equation (9) as drying efficiency, the equation represents an energy consumption rate.
Finally, probably the most useful indicator for energy efficiency is the specific moisture extraction ratio, Equation (10) (SMER), [97], which is expressed in kg kW−1 h−1:
S M E R = A m o u n t   o f   w a t e r   E v a p o r a t e d E n e r g y   U s e d ,
A dryer’s energy demand depends largely on the configuration, energy efficiency and weather fluctuations. However, since thermal efficiency is generally low (for convective dryers, below 50%) [98], it is reasonable to expect an energy optimization of such processes as feasible. Reducing energy consumption, cost and environmental impact of dryers may be achieved in different ways, i.e., by:
  • dewatering the food prior to the drying process;
  • reducing inlet and outlet gas humidity;
  • reducing heat losses;
  • recovering heat between hot and cold streams;
  • adopting lower cost and/or renewable heat sources, such as solar energy and biofuel;
  • combining heat and power to reduce drying time drastically;
  • using smart drying technology to avoid over-drying.
Smart drying technology may be obtained in many ways (e.g., biomimetic systems, computer vision, spectroscopy, magnetic resonance imaging and a control system for the drying environment) [25]. The idea of smart drying technology is to obtain real-time information related to the process and the product as a means to simultaneously modulate the drying process. The result is a standardized high-quality dried product [25].

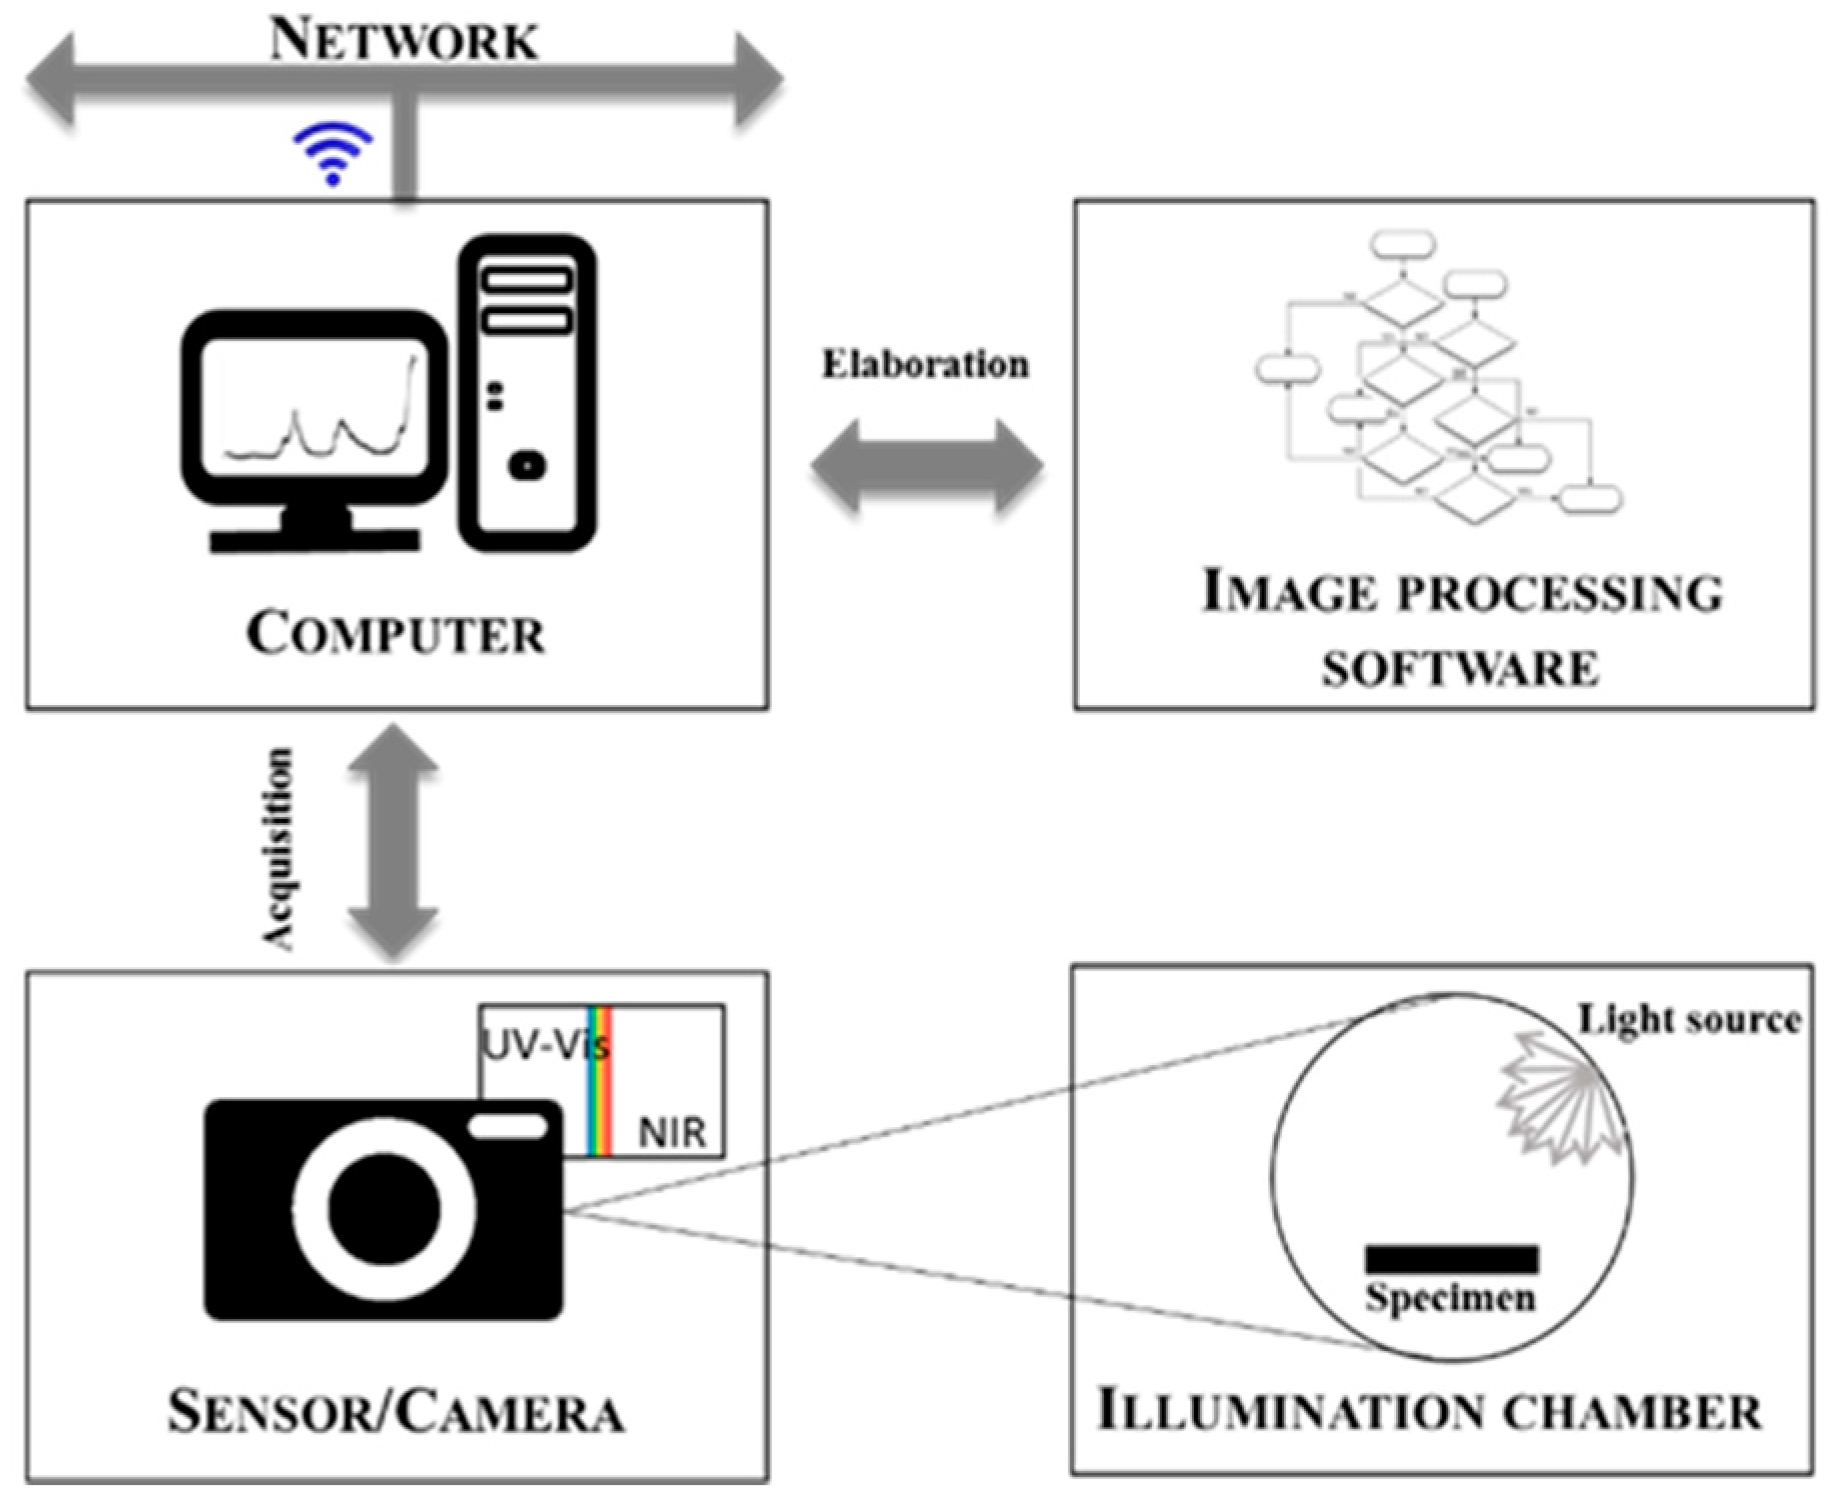
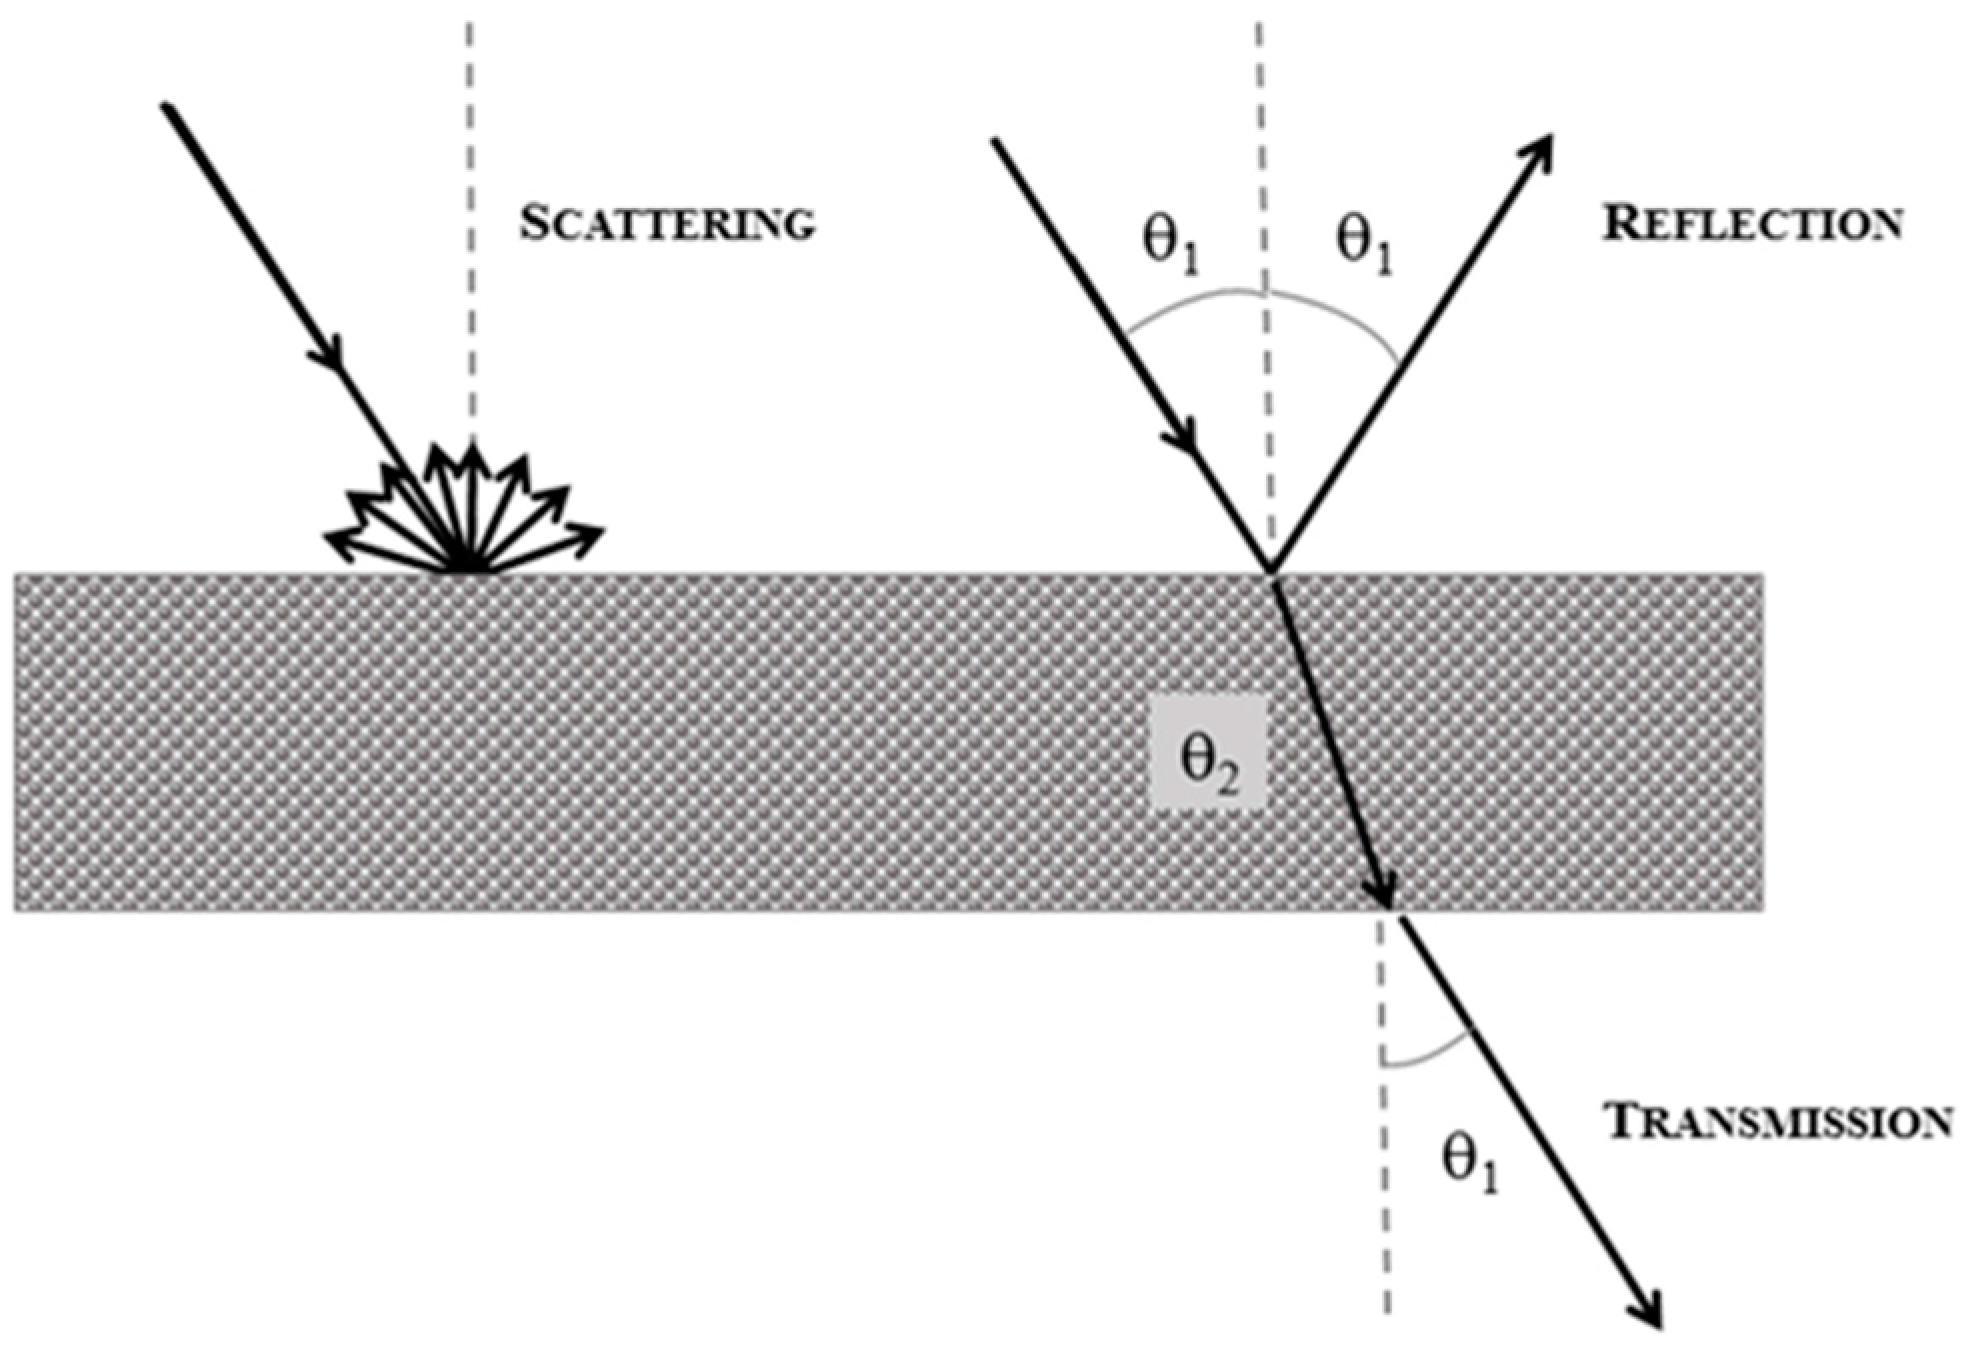
4. Fundamental of Computer Vision

Human beings use their eyes to see and visually sense the world around them. Computer vision (CV) is the science that aims to give a similar capability to a machine or computer. Its application concerns the automatic extraction, analysis and understanding of useful information from a single or a sequence of images, using an algorithmic basis to achieve automatic visual understanding [99].
Since the early 1960s, with the advent of the digital computer, vision was recognized as an important tool to evaluate quality in food production, and its use was constantly increased. It is possible to evaluate the visual characteristic and defects in food products rapidly and inexpensively in a non-destructive way [100]. Nowadays, CV is used in several different fields (e.g., food industry, robotics, medical diagnosis and industrial robotic systems).
A CV system is generally composed, as shown in Figure 2, by five elements: an illumination system, a sensor or a camera, a digitizer (only if the camera it is not digital), a computer and software capable of processing the image. Similar to human vision, CV is strongly affected by several factors (i.e., light source, background, direction of light, size of the area containing the same color and differences between individual perception) [101]. To reduce these defects and increase the accuracy of a CV system, it is necessary to use an illumination chamber [102].
The food industry continues to be among the fastest-growing segments of computer vision application, and it ranks among the top ten industries that uses computer vision systems [103]. This is due to the easy implementation of this technology in a broad range of applications, the simplicity of use, the rapid inspection rate and the feasibility to inspect a product non-destructively [99,100,101,102,103].

4.1. Analysis of Images in the Visible Region

External changes and defects on fruits and vegetables are often characterized by differences in color, shape and size. Commonly, a red, green and blue color space (RGB) camera, linked to a machine vision system, makes it possible to inspect external products in a rapid, accurate and fast way. RGB cameras emulate the human eye’s capacity to capture images [104]. In fact, they acquire three wavelengths in the VIS region by using filters centered at 700, 560.1 and 465 nm (respectively, red, green and blue) [71]. These systems are simple, low cost and fast, and their models show good classification performance for a broad range of applications [105]. Unfortunately, CV systems have several drawbacks; when defects have a similar color to non-defects or when the objects are similar (e.g., same shape, color and the like), image analysis often fails to distinguish them. Furthermore, since RGB cameras acquire images only in the visible region, this spectral region is not suitable for an internal investigation of the object [106]. Thus, if the defect is invisible in the Vis region (e.g., oil oxidation), it is not detectable by the system.

4.2. Single-Point Spectroscopy

Spectroscopy is the study of the interaction of matter and electromagnetic radiation (ER). The interaction occurs in several ways (i.e., reflectance, transmittance, absorbance or scatter of polychromatic or monochromatic radiation), as shown in Figure 3.
Different electromagnetic regions give different information related to the chemical composition of the sample. This being because each chemical bond absorbs light energy at specific wavelengths. As an example, pigments (e.g., chlorophylls, carotenoids and anthocyanins), mainly absorb in the visible spectral range, while water, carbohydrates, fats and proteins have absorption bands in the NIR region [107,108]. For food quality evaluation (e.g., quality control and authenticity), the ultraviolet (UV), visible (Vis) and near infrared (NIR) regions are the main spectral regions used [109].

4.2.1. Single-Point UV-Vis Spectroscopy

The Ultraviolet-visible (UV-Vis) region is a spectral region of the electromagnetic spectrum that covers wavelengths from 200 to 780 nm. Absorption of light in this region promotes the electronic transition of external electrons [107]. Both absorption and emission spectroscopy are routinely performed in a post-harvest laboratory for food-quality purposes. Absorption UV-Vis spectroscopy is commonly used in analytical food quality detection methods, for quantitative determination of different chromophores, (i.e., π-electron systems, conjugated unsaturation, aromatic compounds and conjugated non-bonding electron systems) [110]. Usually, UV-Vis spectroscopy is used for the solution, but there are studies also using this spectral range with a reduced amount of liquid, solid and gas [111].
Fluorescence consists of the excitation of a molecule that quickly returns to the ground state, losing a photon during the process. It is often used due to its high selectivity and sensitivity; indeed, in the solutions, the limit of detection is generally at the level of ppb (part per billion) [112]. In non-destructive food analysis, fluorescence offers a spectral signature containing information of the food’s molecular structure. To extract this information, a chemometric approach is necessary [113].

4.2.2. Single-Point NIR Spectroscopy

The near infrared region covers wavelengths from 780–2500 nm. It is collocated between the visible and the medium infrared region. Infrared absorption leads to the vibrational transition of molecules (e.g., bending and stretching vibrations). NIR is the most energetic part of infrared radiation. The NIR spectrum is essentially composed of overtones and combination bands of specific bonds (i.e., C-H, C-C, C=C, C=O, C-O, N-H, O-H and S-H) commonly present in most organic and inorganic molecules [114,115,116]. Table 1 summaries the main investigable molecular classes using single-point NIR spectroscopy.
Water is the most important chemical constituent of fruits and vegetables; consequently, due to symmetric and asymmetric stretching and bending of the OH group at 979, 1200, 1453, 1780 and 1938 nm, the NIR region (780–2500 nm) is strongly affected by the water molecule [126]. NIR spectroscopy is a secondary method that requires calibration against reference methods for the determination of physicochemical parameters. However, during NIR measurements, spectral data may be affected by baseline shifts due to scattering effects related to the particle size differences and tissue heterogeneities, shifts of peaks towards lower wavelengths with increasing temperature, as well as noise and other irrelevant information due to instrumental bias. All these issues could make the assignment of a functional group to specific absorption bands difficult [130,131], thus affecting the development of well-performing prediction models. In this context, spectral preprocessing (i.e., mathematical transformation of spectral data) helps with enhancing spectral quality and amplifying the information carried out by spectra.

4.2.3. Advantages and Disadvantages of Single-Point Spectroscopy

UV-Vis spectroscopy is widely used due to its high versatility, easy handling, fast scan rate and automation feasibility. However, it is a technique with low selectivity for the analytes, and often, it is necessary to couple it with other devices (e.g., chromatography) and/or process the dataset through chemometrics in order to obtain clear information [107,109,117]. NIR spectroscopy has many advantages (i.e., minimal processing of the sample, fast scan rate, feasibility of automating the process in an on-line device, multi-analytical and non-destructive analysis). However, there are also some drawbacks: Vis-NIR spectra are unreadable without preprocessing and multivariate analysis; moreover, the technique is not very sensitive; the limits of detection indeed are in the order of 10% range [132]; furthermore, as mentioned above, the setting up of robust calibration is a mandatory step to obtain good predictions.
Finally, both spectroscopic techniques give information about the composition of food products, but they can spot only a relatively small area of samples. Even when spectra are acquired in different areas of the sample, the result is the average chemical composition [106]. Often, the spatial distribution of quality parameters is the information desired, in the fruit and vegetable processing industry.

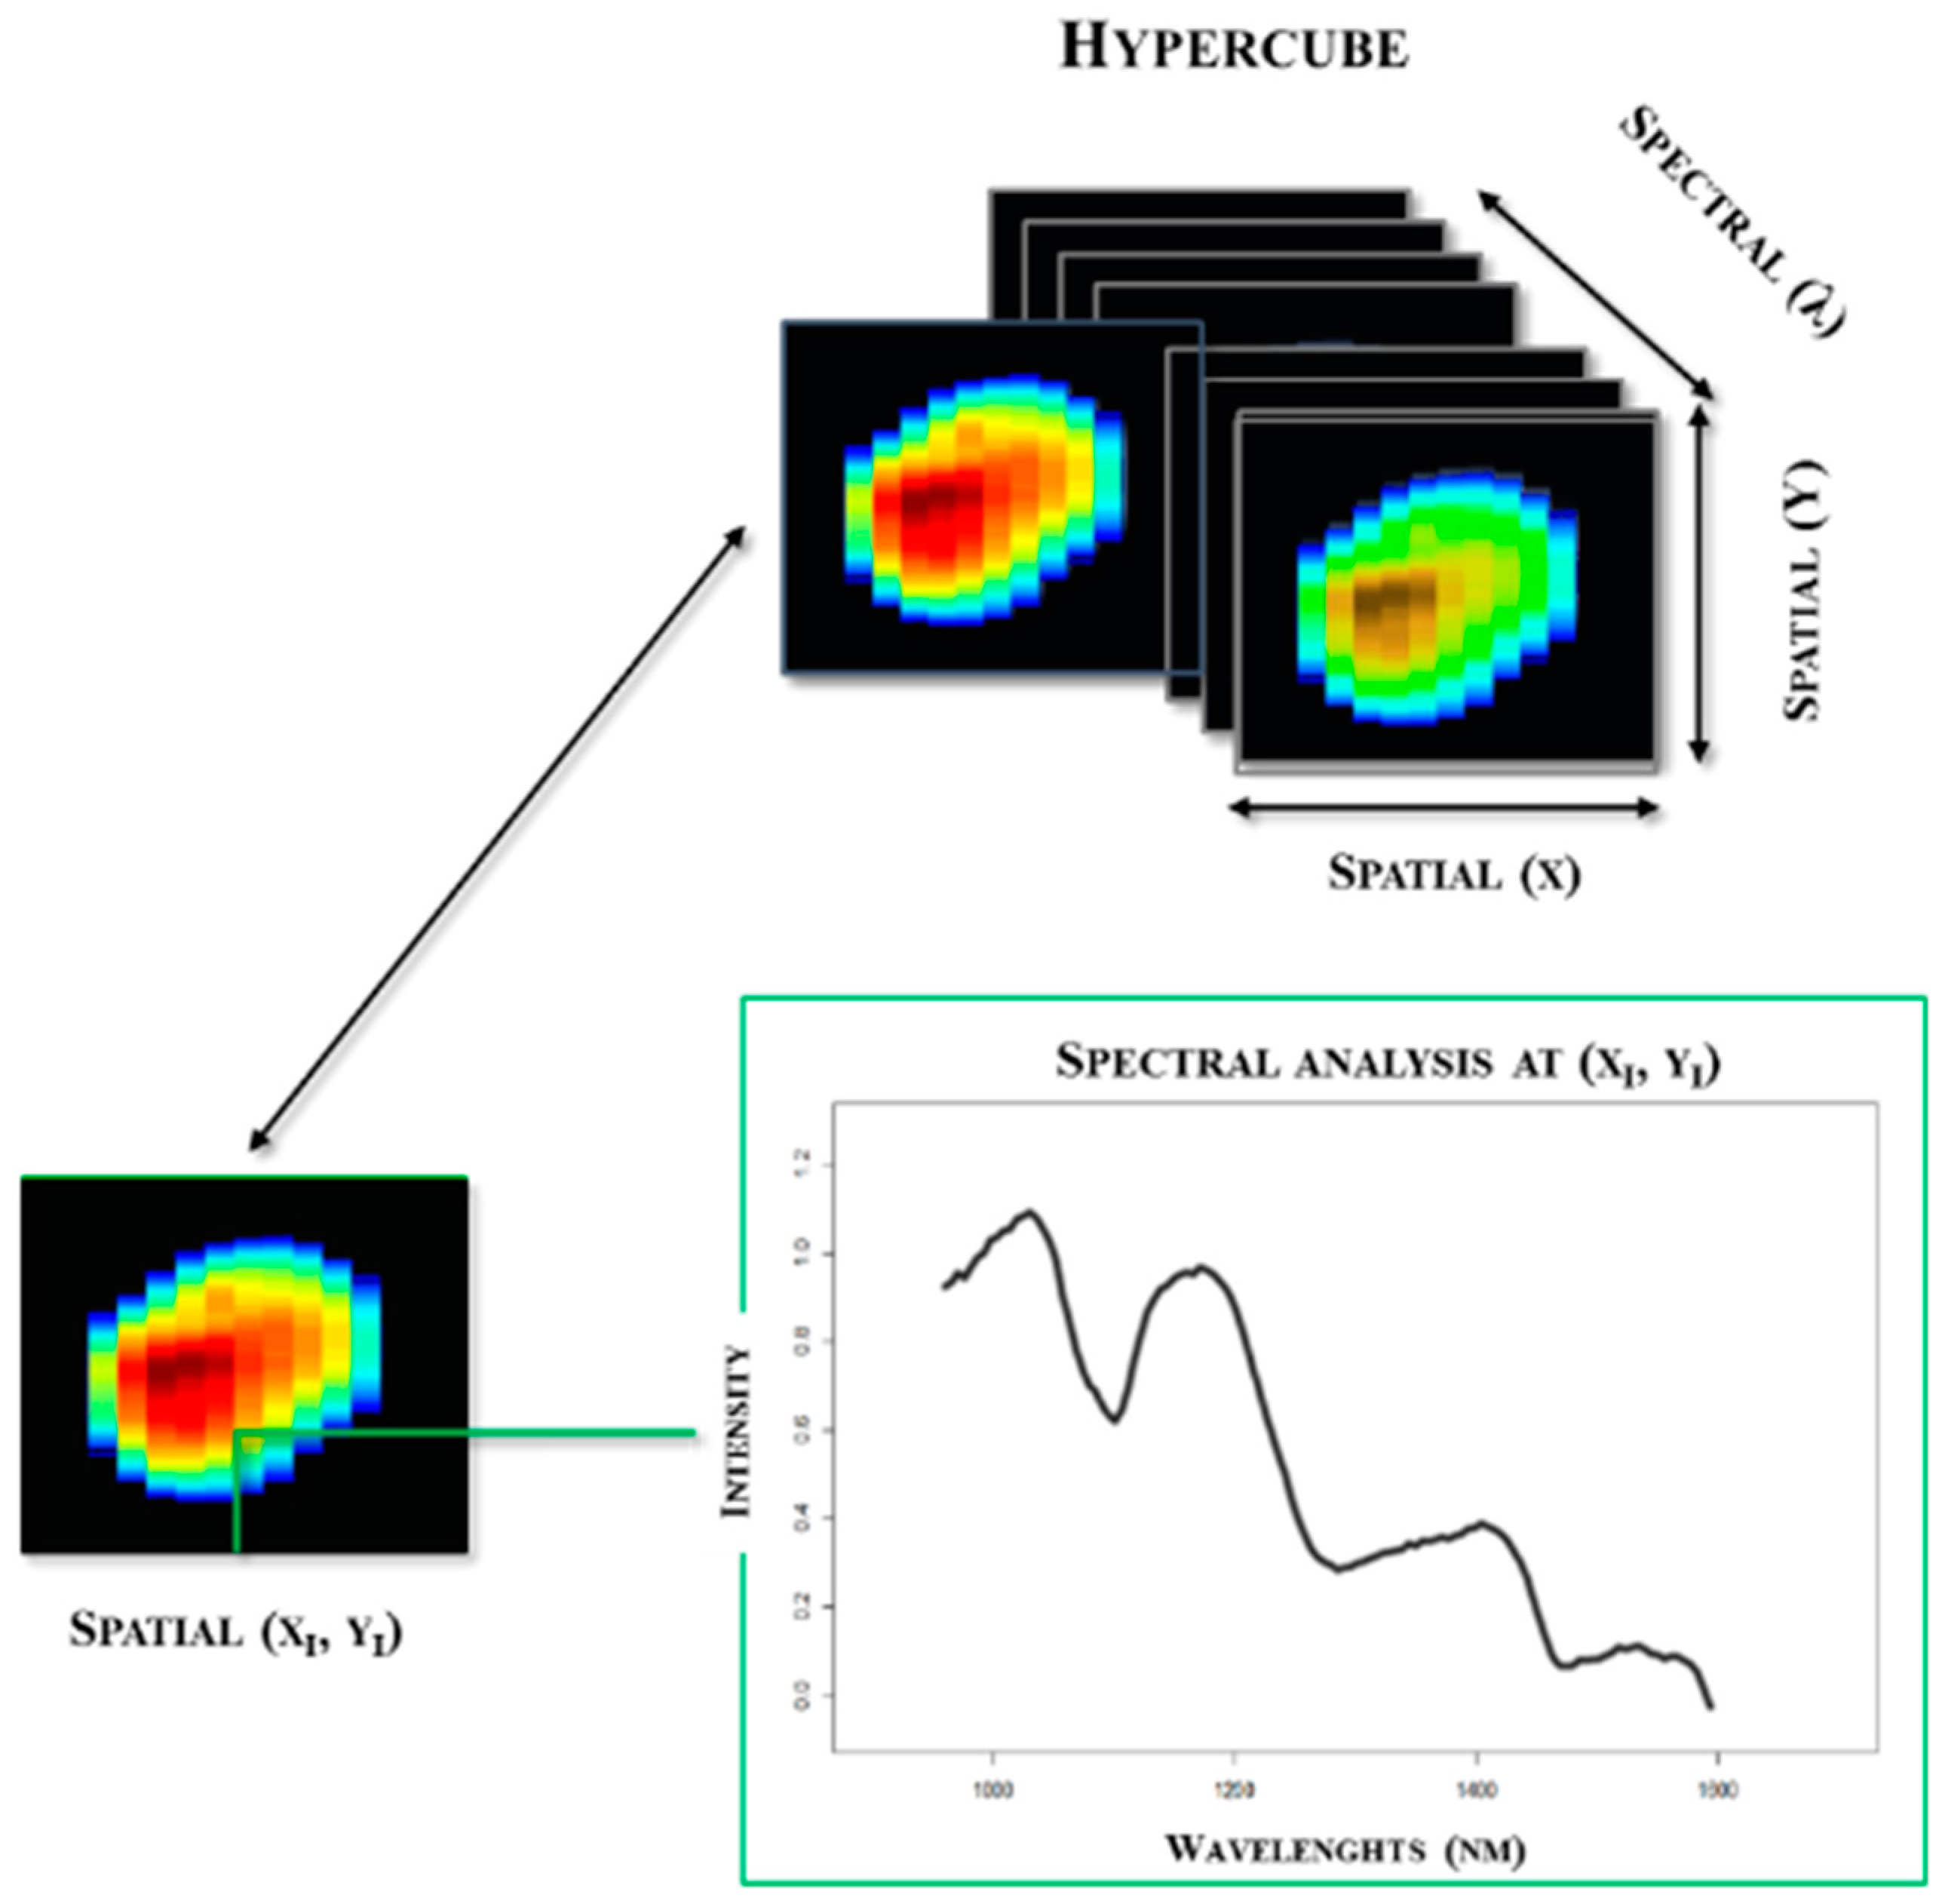
4.3. Hyper- and Multi-Spectral Imaging

Hyperspectral imaging systems are devices able to obtain both spectroscopic and spatial information [133,134]. The data-structure of the hyperspectral image is called the hypercube, which is the 3D image containing two spatial and one spectroscopic dimensions, as shown in Figure 4.
HSI devices in food-analysis work in the Vis/NIR region, each using absorption and emission spectroscopy [135]. However, due to scattering effects, emission spectroscopy in fruit and vegetable tissues is less sensible than in homogeneous liquid matrix [136].
The main advantage of HSI is the feasibility of monitoring both external and internal quality parameters. With this device, it is feasible to distinguish and analyze objects with similar color, shape, size and overlapping spectra. The drawbacks are related to the long acquisition time needed, the high amount of redundant information and, thus, the huge amount of data acquired. These drawbacks limit HSI in on-line processing. Furthermore the computational time to develop the prediction model increases considerably [99]. The development of an MSI system can reduce these drawbacks, mainly due to its possibility to select the most significative wavelengths (from 3–15) in order to predict the physicochemical attributes of interest [137]. MSI has several advantages compared to HSI (i.e., faster scan rate, feasibility of on-line application in the food processing industry, less computer memory required to acquire and process the images) [138]. The drawbacks are related to the device lacking flexibility. Generally, these are built by researchers according to the specific imaging task. Moreover, it is necessary to have an HSI system to use prior to the development of the MSI device.

4.4. Data Processing and Chemometrics

Regardless the device used, a chemometric approach is required to pre-process the signal and to obtain a regression and classification model able to describe the changes in the quality of interest [131]. Image and HSI analyses require an additional step, as summarized in Figure 5.
Preprocessing is required to clean the dataset of undesired physical phenomena (e.g., light scattering, unwanted spectral variations and baseline shifts) [139]. The result of preprocessing is often an improvement of the signal-to-noise ratio (S/N ratio). Usually, in the food-science application of CV, four kinds of preprocessing methods are used (i.e., noise reduction, baseline correction, resolution enhancement, centering and normalization) [139,140].
  • Noise reduction methods (e.g., moving-average and Savitzky–Golay smoothing) can reduce high-frequency noises associated with instrument detectors and electronic circuits.
  • Baseline correction methods (e.g., Savitzky–Golay filters for derivative, multiplicative scatter correction (MSC), standard normal variate (SNV)) are used to reduce or eliminate multiplicative and additive scatter factors and noises.
  • Resolution enhancement methods (e.g., first and second derivatives and Fourier self-deconvolution) point out information from overlapping bands.
  • Mean centering and normalization are preprocessing methods frequently used because they are simple and effective ways to enhance information prior to multivariate analysis.
After the preprocessing step, spectra are processed using chemometrics. For qualitative analysis, the most prevalent algorithm is software independent modelling class analogy (SIMCA), which is based on principal component analysis (PCA) [130]. For quantitative purposes, the most typical linear methods are multilinear regression (MLR), principal component regression (PCR) [131] and partial least square regression (PLS) [141,142]. If a non-linear regression model seems more suitable, artificial neural network (ANN) and the kernel-based technique (e.g., support vector machine (SVM)) can be used [19]. Furthermore, image segmentation (the ability to distinguish the desired object in the matrix) is the most important operation to obtain accurate classification models in computer vision. Segmentation can be done manually by using commercial software packages (e.g., Photoshop (Adobe systems Incorporated, San Jose, CA, USA), Aphelion (AAI, Inc., Saint Contest, Normandy, France) or MATLAB (The MathWorks Inc., Natick, MA, USA)), but in this way, the step takes a long time to be performed, and thus, it is not suitable for on-line processing [143]. For this reason, several algorithms were developed to automate the segmentation process. Generally, this can be done in three different ways: thresholding, edge-based segmentation and region-based segmentation.
  • Thresholding is the simplest segmentation method; pixels are partitioned depending on their intensity value. The Otsu method is an algorithm that works on this principle and is generally used for food quality inspection [144].
  • Edge-based segmentation methods attempt to find the edges directly by their high gradient magnitudes [145].
  • Region-based segmentation is based on pixel-level similarity, following criteria such as grey level, color and texture to identify a single object in images [146].
Nowadays, despite the broad range of algorithms used in CV image analysis, an ideal solution able to ensure good accuracy and efficiency in all the food products has still not been found. Generally, during the development of a CV system, various image preprocessing, segmentation and classification algorithms should be tested to find the best solution for the specific scenario.

5. Applications

Single-point spectroscopy and computer vision, including multi- and hyper-spectral vision systems, have been widely used in the fruit and vegetable industry for quality and safety control [15,146,147,148,149,150]. The subsequent section is focused on the application of these devices for monitoring fruit and vegetable quality during drying.

5.1. Quality Control of Fruit during Drying

Table 2 gives an overview of the application of single-point spectroscopy and machine vision to monitor the quality of fruits during drying.
Romano et al., in 2016, investigated the feasibility of implementing three laser backscattering sources in the Vis/NIR range at 473, 532 and 785 nm for a convective dryer, for quality assessment of two golden-colored kinds of fruit: mango and litchi [151]. Linear mixed model analysis using the Lorentzian distribution showed that 473 nm was adequate for detecting browning changes, 785 nm was suitable to predict hardness and both 532 and 785 nm were able to follow moisture changes both for mango and litchi. The coefficient of determination (R2) for browning, moisture content and hardness were, respectively: R2 = 0.63; 0.91; 0.70 for mango and R2 = 0.81; 0.80; 0.55 for litchi. These results indicate the potential feasibility of the technique for the authors’ intended purposes, although an R2 value lower than 0.80 usually indicates poor performances and that improvements were still required. This application of Vis/NIR spectroscopy presents several advantages: it is rapid, inexpensive, in-line transferable, easily implementable in existing drying systems, non-destructive, multi-analytical and able to improve energy efficiency by avoiding over-drying and quality losses.
Barzaghi et al., in 2008, developed a method able to quantify residual moisture on osmo-air dehydrated apple rings and to discriminate them on the basis of the osmotic solution used as pretreatments [152]. Apple rings, prior to air drying, were dipped several times (i.e., 30, 60, 90 min) in three different sugar solutions. Air drying had been performed then at three different temperatures (i.e., 70, 80, 90 °C). After the treatments, apple rings were packed in polypropylene film under vacuum in order to avoid water absorption phenomena. NIR spectra were recorded directly on packed apple rings by using an FT-NIR spectrometer (NIRFlex 500, Büchi Italia, Assago, Italy).This method showed the following metrics: R2 = 0.93, regression point displacement (RPD) = 3.33; a value of RPD above three corresponds to good prediction accuracy [19]. The method could identify the cultivar and sugar composition of the final product, using the PLS discriminant algorithm. According to the author, this method is promising and could be used to measure sample constituents, (e.g., as water content changes during drying) and to control the product shelf-life without opening the package.
Pu and Sun, in 2015, investigated the feasibility of using Vis/NIR hyperspectral imaging to visualize moisture distribution in mango slices during microwave-vacuum drying [13]. Two Vis/NIR ranges were investigated in this study: 400–1000 nm and 880–1720 nm. PLS was applied to correlate the mean spectrum of each slice with the reference moisture content. The second spectral region (880–1720 nm) showed the best prediction performances in terms of the coefficient of determination in prediction (R2p) and root mean square error in prediction (RMSEP): R2p = 0.97 and RMSEP = 4.80%. Furthermore, different algorithms were tested to reduce the number of wavelengths used to perform the regression; the best result was obtained by using competitive adaptive reweighted sampling (CARS): this model indeed was built using just two wavelengths (1342, 1405 nm), and the prediction performance was as good as the full wavelength model. Starting from this result, the multispectral device can be built and rapid, non-destructive moisture content determination can be done and visualized during the drying process.
Fernández et al., in 2005, analyzed the effect of drying in terms of shrinkage, color and image texture of the apple disc, via a standardized image acquisition system and image analysis [12]. All morphological features (i.e., shape, dimension) changed smoothly during the first 6–8 h of drying, and samples became less uniform in color during that period. The authors developed a classification model to identify different drying based on Euclidean distance. After 6-h of drying, external features remain almost constant. Seven classes (0, 1, 2, 3, 4, 5, ≥6 h) were considered in the classification model. The training set consisted of 72 images and 39 random samples. Ninety-five percent of the test samples were correctly classified into their respective classes.
Sampson et al., in 2014, developed a low cost dual-view CV system with a fish-eye lens for monitoring apple slices during the drying process [153]. The authors decided to use the fish-eye lens in order to obtain a low cost wide field-of-view and two identical cameras (model TL-BW3N8D-0.5W TSD Co.) positioned perpendicularly to obtain 3D imaging information. The aims of this work were to obtain: a perpendicular CV system to evaluate volume and image textural changes and a prediction model for moisture content and color changes. The results suggested that volume can be accurately measured by the proposed method, but it is not suitable to predict the end of the drying process. The uniformity of intensity of the image feature was a better predictor (R > 0.94).
Sturm et al., 2012, developed and optimized a convective hot-air dryer, for routine processing of apple slices by using computer vision [154]. Several dryers and product parameters (i.e., air temperature, air velocity, color changes and shrinkage) were investigated. Air velocity showed a significant influence on product quality; at a fixed temperature, increasing air velocity reduced processing time and damage to the product. The prediction model for total color difference ΔE* followed a third order polynomial trend and showed an R2 = 0.95. The shrinkage prediction model followed a first order polynomial trend, and the coefficient of determination was R2 = 0.68.
Behroozi Khazaei et al., in 2013, applied a method based on computer vision with a low cost Smart Cloud Camera (SCC-101 PA) to follow grape hot-air drying [155]. Shrinkage, ΔE* and moisture content changes were evaluated. Experimental data were acquired by capturing images at different drying temperatures (i.e., 40, 50 and 60 °C). Good prediction models were obtained for shrinkage, moisture content and color changes, demonstrating the feasibility of the on-line evaluation of such parameters during the drying process. The coefficients of determination indeed were respectively: R2 = 0.99; 0.99; 0.95.
Dénes et al., in 2012, evaluated changes in laser-induced diffuse reflectance on apple discs during the hot-air drying process [156]. Samples were measured with an NIR spectrometer (MetriNIR 10-17 ST) and a machine vision system based on laser-induced scattering. NIR spectra were acquired in the following range: 740–1700 nm with 2-nm steps. PLS regression was tested, and the models showed very good performance in predicting moisture content with the following metrics R2 = 0.99, RPD = 6.63, RMSEP = 24.82. The multispectral device is based on a high performance monochromatic CCD IP camera (Photon Focus MV1-D1312, gray scale resolution of 12-bit, max. spatial resolution of 1312 × 1082 pixels, spectral sensitivity from 320–1080 nm) with an L-SV-L5014MP megapixel lens of fixed focus, optimized for Vis-NIR application. Seven laser diode modules emitting at seven different spectral bands were used (532, 635, 650, 780, 808, 850, 1064, 532, 635, 650, 780, 808, 850, 1064 nm). PLS regression was performed with the following metrics: R2 = 0.99, RPD = 6.72, RMSEP = 24.48. Both methods proved themselves to be accurate and rapid for predicting moisture content (dry and wet bulb) on apple slices during drying.

5.2. Quality Control of Vegetables during Drying

Table 3 gives an overview of the application of single-point spectroscopy and machine vision to monitor the quality of vegetables during drying:
Romano et al., in 2012, evaluated the use of a CCD camera combined with two laser diodes emitting at 532 and 635 nm for monitoring changes in moisture content and color in red, green and yellow pepper during hot-air drying [157]. Results showed excellent correlations for yellow pepper (R2 = 0.93 and RMSEP = 7.28). However, green and red pepper changes during drying were not well predicted respectively by green and red LED. However, the 635-nm LED can predict green pepper moisture changes (R2 = 0.90 and RMSEP = 8.77), and 532 nm can predict red pepper w (R2 = 0.89 and RMSEP = 9.95). Scattering phenomena were observed due to changes of tissue structure during drying. CV was validated as a promising way to monitor changes in L* (R2 = 0.87 and R2 = 0.90) and a (R2 = 0.93 and R2 = 0.97) during drying for yellow and green pepper. The result of this work suggested that alteration in tissue structure and the wavelengths selected had a remarkable effect on moisture changes’ predictability.
M. Huang et al., in 2014, developed a hyperspectral method for predicting color and moisture content on soybeans during MVD [15]. HSI images were acquired within the following range: 400–1000 nm for 270 samples. Soybean images were acquired and automatically segmented (via the active contour model). Mean reflectance and image entropy were obtained, tested separately and in combination for predicting (using PLS regression) color and moisture contents. The best prediction results were given by mean reflectance data, with the following metrics (R2p = 0.74 and RMSEP = 1.0% for color and R2p = 0.94 and RMSEP = 4.7% for moisture content). Entropy data regression and its combination with mean reflectance data did not improve the prediction ability of the model. However, the results indicate that the evaluation of color and moisture changes via the hyperspectral technique on soybean during drying is feasible.
Ren and Chen, in 1997, developed a single-point NIR method to determinate moisture content in ginseng roots of different cultivars: Asian ginseng (Panax ginseng) roots, freeze-dried Asian ginseng roots, red Asian ginseng roots and hot-air dried American ginseng (Panax quinquefolium) roots [11]. Single-point NIR spectra were acquired in the following range: 1100–2500 nm using an NIR system (Model 6500, Perstorp Analytical Inc., Silver Spring, MD, USA) at 8-nm intervals. Spectra were recorded as the logarithm of the reciprocal reflectance, log (1/R). A high prediction model was obtained: R2p = 1 and RMSEP = 0.18%.
Hafezi et al., in 2015, standardized an image acquisition system in order to monitor shrinkage changes in potato slices during vacuum-infrared drying [158]. Three factors were varied during the experiments: infrared radiation power (100, 150, 200 W), absolute pressure levels (20, 80, 140, 760 mmHg) and slice thickness (1, 2, 3 mm). During the drying process, surface area reduction was mostly affected by the thickness of potato slices. The results showed that all the factors had significant effects on the potato slices. Furthermore, the percentage reduction of surface area, which is related to shrinkage, can be used as a parameter to measure shrinkage changes. Finally, it was observed that an increase in infrared power and a reduction of absolute pressure at a given thickness led to a reduction of the drying time. However, deformation of the product surface was more evident using this setup.
Martynenko, in 2008, evaluated porosity changes in ginseng roots during hot-air dehydration by using real-time imaging and mass measurements [159]. Porosity changes were evaluated from the moisture-shrinkage-porosity correlation. It was found that any deviation from the linear shrinkage-moisture relationship was due to changes in porosity. Moreover, temperature effects on porosity changes were investigated; it was demonstrated that density and porosity changes were evaluable from real-time volume and mass measurement. Drying at 38 °C resulted in an increase of porosity of 20–25% with the inversion point at the critical moisture content (0.3 g/g), after which there was a significant decrease of porosity (range of 10–15%). However, drying at 50 °C led to a constant porosity until moisture content of 0.5 g/g, after which a strong hardening of the ginseng roots was observed. The discrepancy of this method to evaluate porosity changes and official methods did not exceed 5%.
Mulet et al., in 2000, evaluated the effect of shape (cubes, parallelepipeds and cylinders) on potato and cauliflower stem shrinkage during drying [160]. A basic image analysis was developed to monitor changes in shape during the drying process. Caliper and image analysis data showed a very good correlation with no bias. Furthermore, it was observed that shape influenced shrinkage depending on the x-axis. The difference in shrinkage between directions was greater for cauliflowers, probably due to the alignment of fibers along the axis.
Nahimana and Zhang, in 2011, developed a computer vision method to monitor shrinkage and color change during MVD of carrots [16]. The aim of this article was to evaluate drying characteristics and loss of product qualities with simple and accurate models. Visual color was quantified using Hunter CIE Lab coordinates, and carotenoids contents were determined via a UV-Vis spectrophotometer. Drying time varied from 24–42 min. It was seen that circularity, solidity, major and minor axes varied significantly during drying. Results indicated that the drying rate increased with the increasing of microwave power. Moreover, microwave drying proved to have a better rehydration capacity, as it was observed that the products were more porous and less shrunken. Furthermore, MVD led to a significant whitening index and carotenoid losses, in agreement with what is reported in the literature.
Liu et al., in 2016, evaluated the feasibility of a multispectral method for the real-time determination of color changes and moisture distribution among carrots slices during AD [161]. Twenty wavelengths were used in the spectral region between 405 and 970 nm for the color change detection and moisture content prediction of carrot slices during the dehydration process. Moreover, the authors’ aim was to compare three prediction algorithms: PLS, nonlinear least square-support vector machine (LS-SVM) and back propagation neural network (BPNN) for predicting the accuracy of moisture content. The authors demonstrated that MSI, combined with chemometrics, is a valid tool to non-destructively determine color change and moisture content in carrot slices without any preliminary sample preparation. The best prediction model was the BPNN with the following metrics: R2p = 0.99, RMSEP = 1.48% and RPD = 11.38. The results were very promising and suggested the feasibility of such technology for food-industry purposes.
To summarize, CV is a valid method to non-destructively monitor the external attributes during drying. It is often used also to develop the discrimination model, able to classify the products based on external attributes. NIR and HSI, instead, were principally used to detect changes in moisture and its distribution in fruits and vegetables. MSI development is promising due to its low cost, faster scan rate and good prediction results. However, in all the studies found in the literature, only color and moisture content were investigated with these devices. In other fields instead, these devices were successfully used (e.g., in quality and safety [15,116,150], as well as in post-harvest control of fresh fruits and vegetables using NIR [19,138,162,163] and HSI [164,165] to monitor a broad range of physicochemical changes such as: sugar content [166], protein content [167,168], starch index [135] and several related nutritional compounds [169,170]. For this reason, it seems reasonable to develop a model able to detect the same compounds and their changes during the drying process.

6. Conclusions

The continuously growing demand for high quality processed food in recent years, together with the food industry’s necessity to restrain the quality assurance cost, has led to several technical solutions and standard operation procedures able to simultaneously increase products’ quality and reduce resource consumption. Non-destructive techniques, such as CV and NIRs, can follow the process on-line, resulting in a greener solution in order to perform quality control for several industrial processes. Generally, smart drying systems based on computer vision are used to follow moisture content, color and shrinkage changes. However, even if these systems can obtain more information during the process, especially related to the chemical composition of the product, few works can be found in the literature.
An effort in such a direction was done by Moscetti et al., in 2017, demonstrating the feasibility of the real-time measurement of several quality attributes (e.g., carotenoid contents, Soluble Solid Content, (SSC) lightness and hue angle) in organic carrots (var. Romance) during hot-air drying using near infrared spectroscopy [171]. Further effort in this direction may be useful not only to improve the smart drying technologies, but also to fulfil the lack of guidelines in organic food processing, reducing the gap between conventional and organic drying products.

Acknowledgments

The authors gratefully acknowledge CORE Organic Plus consortium (Coordination of European Transnational Research in Organic Food and Farming System, European Research Area Net, ERA-NET action) and Mipaaf (Ministero delle politiche agricole alimentari e forestali—Italy) for financial support through the SusOrganic project titled: ‘Development of quality standards and optimized processing methods for organic produce’ (No. 2814OE006). Moreover, our sincere thanks to Gianpaolo Moscetti for his valuable help and support for the English revision of this manuscript.

Author Contributions

Flavio Raponi is the first author of the paper; he performed the literature research, developed the topics and wrote the manuscript. All the other authors substantially contributed to the conception and revision of the paper.

Conflicts of Interest

The authors declare no conflict of interest.

References

  1. Filkova, I.; Munjundar, A.S. Handbook of Industrial Drying; CRC Press: Boca Raton, FL, USA, 2014; ISBN 9781466596665. [Google Scholar]
  2. Koszela, K.; Otrza̧sek, J.; Zaborowicz, M.; Boniecki, P.; Mueller, W.; Raba, B.; Lewicki, A.; Przybył, K. Quality assessment of microwave-vacuum dried material with the use of computer image analysis and neural model. Proc. SPIE Int. Soc. Opt. Eng. 2014, 9159, 1–9. [Google Scholar] [CrossRef]
  3. Ratti, C. Hot air and freeze-drying of high-value foods: A review. J. Food Eng. 2001, 49, 311–319. [Google Scholar] [CrossRef]
  4. An, K.; Zhao, D.; Wang, Z.; Wu, J.; Xu, Y.; Xiao, G. Comparison of different drying methods on Chinese ginger (Zingiber officinale Roscoe): Changes in volatiles, chemical profile, antioxidant properties, and microstructure. Food Chem. 2016, 197, 1292–1300. [Google Scholar] [CrossRef] [PubMed]
  5. Dev, S.R.S.; Geetha, P.; Orsat, V.; Gariépy, Y.; Raghavan, G.S.V. Effects of Microwave-Assisted Hot Air Drying and Conventional Hot Air Drying on the Drying Kinetics, Color, Rehydration, and Volatiles of Moringa oleifera. Dry. Technol. 2011, 29, 1452–1458. [Google Scholar] [CrossRef]
  6. Keglevich, G. Milestones in Microwave Chemistry; Keglevich, G., Ed.; Springer International Publishing: Cham, Switzerland, 2016; ISBN 9783319306308. [Google Scholar]
  7. Mujumdar, A.S.; Law, C.L. Drying Technology: Trends and Applications in Postharvest Processing. Food Bioprocess Technol. 2010, 3, 843–852. [Google Scholar] [CrossRef]
  8. Sagar, V.R.; Suresh Kumar, P. Recent advances in drying and dehydration of fruits and vegetables: A review. J. Food Sci. Technol. 2010, 47, 15–26. [Google Scholar] [CrossRef] [PubMed]
  9. Afolabi, I.S. Moisture Migration and Bulk Nutrients Interaction in a Drying Food Systems: A Review. Food Nutr. Sci. 2014, 5, 692–714. [Google Scholar] [CrossRef]
  10. Aghilinategh, N.; Rafiee, S.; Gholikhani, A.; Hosseinpur, S.; Omid, M.; Mohtasebi, S.S.; Maleki, N. A comparative study of dried apple using hot air, intermittent and continuous microwave: Evaluation of kinetic parameters and physicochemical quality attributes. Food Sci. Nutr. 2015, 3, 519–526. [Google Scholar] [CrossRef] [PubMed]
  11. Ren, G.; Chen, F. Determination of moisture content of ginseng by near infra-red reflectance spectroscopy. Food Chem. 1997, 60, 433–436. [Google Scholar] [CrossRef]
  12. Fernández, L.; Castillero, C.; Aguilera, J.M. An application of image analysis to dehydration of apple discs. J. Food Eng. 2005, 67, 185–193. [Google Scholar] [CrossRef]
  13. Pu, Y.Y.; Sun, D.W. Vis-NIR hyperspectral imaging in visualizing moisture distribution of mango slices during microwave-vacuum drying. Food Chem. 2015, 188, 271–278. [Google Scholar] [CrossRef] [PubMed]
  14. ElMasry, G.; Wang, N.; ElSayed, A.; Ngadi, M. Hyperspectral imaging for nondestructive determination of some quality attributes for strawberry. J. Food Eng. 2007, 81, 98–107. [Google Scholar] [CrossRef]
  15. Huang, M.; Wang, Q.; Zhang, M.; Zhu, Q. Prediction of color and moisture content for vegetable soybean during drying using hyperspectral imaging technology. J. Food Eng. 2014, 128, 24–30. [Google Scholar] [CrossRef]
  16. Nahimana, H.; Zhang, M. Shrinkage and Color Change during Microwave Vacuum Drying of Carrot. Dry. Technol. 2011, 29, 836–847. [Google Scholar] [CrossRef]
  17. Yadollahinia, A.; Jahangiri, M. Shrinkage of potato slice during drying. J. Food Eng. 2009, 94, 52–58. [Google Scholar] [CrossRef]
  18. Hu, M.-H.; Dong, Q.-L.; Malakar, P.K.; Liu, B.-L.; Jaganathan, G.K. Determining Banana Size Based on Computer Vision. Int. J. Food Prop. 2015, 18, 508–520. [Google Scholar] [CrossRef]
  19. Nicolaï, B.M.; Beullens, K.; Bobelyn, E.; Peirs, A.; Saeys, W.; Theron, K.I.; Lammertyn, J. Nondestructive measurement of fruit and vegetable quality by means of NIR spectroscopy: A review. Postharvest Biol. Technol. 2007, 46, 99–118. [Google Scholar] [CrossRef]
  20. Leiva-Valenzuela, G.A.; Lu, R.; Aguilera, J.M. Assessment of internal quality of blueberries using hyperspectral transmittance and reflectance images with whole spectra or selected wavelengths. Innov. Food Sci. Emerg. Technol. 2014, 24, 2–13. [Google Scholar] [CrossRef]
  21. Pedro, A.M.K.; Ferreira, M.M.C. Nondestructive determination of solids and carotenoids in tomato products by near-infrared spectroscopy and multivariate calibration. Anal. Chem. 2005, 77, 2505–2511. [Google Scholar] [CrossRef] [PubMed]
  22. Yang, H.; Irudayaraj, J. Rapid determination of vitamin C by NIR, MIR and FT-Raman techniques. J. Pharm. Pharmacol. 2002, 54, 1247–1255. [Google Scholar] [CrossRef] [PubMed]
  23. Romaric, G. Bayili Phenolic compounds and antioxidant activities in some fruits and vegetables from Burkina Faso. Afr. J. Biotechnol. 2011, 10, 13543–13547. [Google Scholar] [CrossRef]
  24. Lopez, J.; Uribe, E.; Vega-Gálvez, A.; Miranda, M.; Vergara, J.; Gonzalez, E.; Di Scala, K. Effect of air temperature on drying kinetics, vitamin c, antioxidant activity, total phenolic content, non-enzymatic browning and firmness of blueberries variety O’Neil. Food Bioprocess Technol. 2010, 3, 772–777. [Google Scholar] [CrossRef]
  25. Su, Y.; Zhang, M.; Mujumdar, A.S. Recent Developments in Smart Drying Technology. Dry. Technol. 2015, 33, 260–276. [Google Scholar] [CrossRef]
  26. Kahl, J.; Baars, T.; Bügel, S.; Busscher, N.; Huber, M.; Kusche, D.; Rembiałkowska, E.; Schmid, O.; Seidel, K.; Taupier-Letage, B.; et al. Organic food quality: A framework for concept, definition and evaluation from the European perspective. J. Sci. Food Agric. 2012, 92, 2760–2765. [Google Scholar] [CrossRef] [PubMed]
  27. Scopus. Available online: www.scopus.com (accessed on 18 October 2017).
  28. Pubmed. Available online: www.ncbi.nlm.nih.gov/pubmed (accessed on 18 October 2017).
  29. Google Scholar. Available online: scholar.google.com (accessed on 18 October 2017).
  30. De Lima, A.G.B.; Da Silva, J.V.; Pereira, E.M.A.; Dos Santos, I.B.; Barbosa de Lima, W.M.P. Drying of bioproducts: Quality and energy aspects. In Drying and Energy Technologies; Springer International Publishing: Cham, Switzerland, 2015; ISBN 9783319197678. [Google Scholar]
  31. Nindo, C.I.; Sun, T.; Wang, S.W.; Tang, J.; Powers, J.R. Evaluation of drying technologies for retention of physical quality and antioxidants in asparagus (Asparagus officinalis, L.). LWT Food Sci. Technol. 2003, 36, 507–516. [Google Scholar] [CrossRef]
  32. Vicente, A.R.; Manganaris, G.A.; Sozzi, G.O.; Crisosto, C.H. Nutritional Quality of Fruits and Vegetables. In Postharvest Handling: A Systems Approach, 2nd ed.; Elsevier Inc.: London, UK, 2009; ISBN 9780123741127. [Google Scholar]
  33. Liu, C.; Russell, R.M. Nutrition and gastric cancer risk: An update. Nutr. Rev. 2008, 66, 237–249. [Google Scholar] [CrossRef] [PubMed]
  34. Ashebir, D.; Jezik, K.; Weingartemann, H.; Gretzmacher, R. Change in color and other fruit quality characteristics of tomato cultivars after hot-air drying at low final-moisture content. Int. J. Food Sci. Nutr. 2009, 60 (Suppl. 7), 308–315. [Google Scholar] [CrossRef] [PubMed]
  35. Ariahu, C.C.; Abashi, D.K.; Chinma, C.E. Kinetics of ascorbic acid loss during hot water blanching of fluted pumpkin (Telfairia occidentalis) leaves. J. Food Sci. Technol. 2011, 48, 454–459. [Google Scholar] [CrossRef] [PubMed]
  36. Shofian, N.M.; Hamid, A.A.; Osman, A.; Saari, N.; Anwar, F.; Dek, M.S.P.; Hairuddin, M.R. Effect of freeze-drying on the antioxidant compounds and antioxidant activity of selected tropical fruits. Int. J. Mol. Sci. 2011, 12, 4678–4692. [Google Scholar] [CrossRef] [PubMed]
  37. Gruszecki, W.I. Carotenoids in lipids Membranes. In Carotenoids: Physical, Chemical, and Biological Functions and Properties; CRC Press: Boca Raton, FL, USA, 2010; pp. 19–30. [Google Scholar]
  38. Lefsrud, M.; Kopsell, D.; Sams, C.; Wills, J.; Both, A.J. Dry matter content and stability of carotenoids in kale and spinach during drying. HortScience 2008, 43, 1731–1736. [Google Scholar]
  39. Urrea, D.; Eim, V.S.; González-Centeno, M.R.; Minjares-Fuentes, R.; Castell-Palou, A.; Juárez, M.D.; Rosselló, C. Effects of air drying temperature on antioxidant activity and carotenoids content of carrots (Daucus carota). In Proceedings of the European Drying Conference, Palma de Mallorca, Spain, 26–28 October 2011; Volume 6, pp. 26–28. [Google Scholar]
  40. Divya, P.; Puthusseri, B.; Neelwarne, B. Carotenoid content, its stability during drying and the antioxidant activity of commercial coriander (Coriandrum sativum L.) varieties. Food Res. Int. 2012, 45, 342–350. [Google Scholar] [CrossRef]
  41. Seybold, C.; Fröhlich, K.; Bitsch, R.; Otto, K.; Böhm, V. Changes in contents of carotenoids and vitamin E during tomato processing. J. Agric. Food Chem. 2004, 52, 7005–7010. [Google Scholar] [CrossRef] [PubMed]
  42. Strati, I.F.; Oreopoulou, V. Recovery and isomerization of carotenoids from tomato processing. Waste Biomass Valoriz. 2016, 7, 843–850. [Google Scholar] [CrossRef]
  43. Siriamornpun, S.; Kaisoon, O.; Meeso, N. Changes in colour, antioxidant activities and carotenoids (lycopene, β-carotene, lutein) of marigold flower (Tagetes erecta L.) resulting from different drying processes. J. Funct. Foods 2012, 4, 757–766. [Google Scholar] [CrossRef]
  44. Chinnici, F.; Bendini, A.; Gaiani, A.; Riponi, C. Radical Scavenging Activities of Peels and Pulps from cv. Golden Delicious Apples as Related to Their Phenolic Composition. J. Agric. Food Chem. 2004, 52, 4684–4689. [Google Scholar] [CrossRef] [PubMed]
  45. Liu, R.H. Potential synergy of phytochemicals in cancer prevention: Mechanism of action. J. Nutr. 2004, 134, 3479S–3485S. [Google Scholar] [PubMed]
  46. Wlodzimierz, O.; Grajek, A. The influence of food processing and home cooking on the antioxidant stability in foods. In Functional Food Product Development; Smith, J., Charter, E., Eds.; Wiley-Blackwell: Oxford, UK, 2010; pp. 178–205. ISBN 9781405178761. [Google Scholar]
  47. Vega-Gálvez, A.; Ah-Hen, K.; Chacana, M.; Vergara, J.; Martínez-Monzó, J.; García-Segovia, P.; Lemus-Mondaca, R.; Di Scala, K. Effect of temperature and air velocity on drying kinetics, antioxidant capacity, total phenolic content, colour, texture and microstructure of apple (var. Granny Smith) slices. Food Chem. 2012, 132, 51–59. [Google Scholar] [CrossRef] [PubMed]
  48. Lodge, J.K. Vitamin E bioavailability in humans. J. Plant Physiol. 2005, 162, 790–796. [Google Scholar] [CrossRef] [PubMed]
  49. Delgado, T.; Pereira, J.A.; Ramalhosa, E.; Casal, S. Effect of hot air convective drying on the fatty acid and vitamin E composition of chestnut (Castanea sativa Mill.) slices. Eur. Food Res. Technol. 2016, 242, 1299–1306. [Google Scholar] [CrossRef]
  50. Lešková, E.; Kubíková, J.; Kováčiková, E.; Košická, M.; Porubská, J.; Holčíková, K. Vitamin losses: Retention during heat treatment and continual changes expressed by mathematical models. J. Food Compos. Anal. 2006, 19, 252–276. [Google Scholar] [CrossRef]
  51. Shewfelt, R.L. What is quality? Postharvest Biol. Technol. 1999, 15, 197–200. [Google Scholar] [CrossRef]
  52. Roshanak, S.; Rahimmalek, M.; Goli, S.A.H. Evaluation of seven different drying treatments in respect to total flavonoid, phenolic, vitamin C content, chlorophyll, antioxidant activity and color of green tea (Camellia sinensis or C. assamica) leaves. J. Food Sci. Technol. 2015, 53, 721–729. [Google Scholar] [CrossRef] [PubMed]
  53. Maskan, M. Kinetics of colour change of kiwifruits during hot air and microwave drying. J. Food Eng. 2001, 48, 169–175. [Google Scholar] [CrossRef]
  54. Brennan, J.G. Food Processing Handbook; Wiley-VCH Verlag: Weinheim, Germany, 2006; ISBN 9783527307197. [Google Scholar]
  55. Madhava Naidu, M.; Vedashree, M.; Satapathy, P.; Khanum, H.; Ramsamy, R.; Hebbar, H.U. Effect of drying methods on the quality characteristics of dill (Anethum graveolens) greens. Food Chem. 2016, 192, 849–856. [Google Scholar] [CrossRef] [PubMed]
  56. Marangoni, A.G. Chlorophyll Degradation in Green Tissues: Olives, Cabbage and Pickles. In Kinetic Analysis of Food Systems; Springer: Cham, Switzerland, 2017; pp. 55–63. ISBN 9783319512921. [Google Scholar]
  57. Cui, Z.-W.; Xu, S.-Y.; Sun, D.-W. Effect of Microwave-Vacuum Drying on the Carotenoids Retention of Carrot Slices and Chlorophyll Retention of Chinese Chive Leaves. Dry. Technol. 2004, 22, 563–575. [Google Scholar] [CrossRef]
  58. Mencarelli, F.; Agostini, R.; Botondi, R.; Massantini, R. Ethylene production, ACC content, PAL and POD activities in excised sections of straight and bent gerbera scapes. J. Hortic. Sci. 1995, 70, 409–416. [Google Scholar] [CrossRef]
  59. Cecchini, M.; Contini, M.; Massantini, R.; Monarca, D.; Moscetti, R. Effects of controlled atmospheres and low temperature on storability of chestnuts manually and mechanically harvested. Postharvest Biol. Technol. 2011, 61, 131–136. [Google Scholar] [CrossRef]
  60. Degl’Innocenti, E.; Pardossi, A.; Tognoni, F.; Guidi, L. Physiological basis of sensitivity to enzymatic browning in “lettuce”, “escarole” and “rocket salad” when stored as fresh-cut products. Food Chem. 2007, 104, 209–215. [Google Scholar] [CrossRef]
  61. Taylor, S.L.; Kinsella, J.E.; Archer, D.; Gregory, J.F.; Harlander, S.K.; Lund, D.B.; Schneeman, B.O.; Macrae, R. Food Science and Technology. Enzym. Food Process. 1993, ii–iib. [Google Scholar] [CrossRef]
  62. Grncarevic, M.; Hawker, J.S. Browning of Sultana Grape Berries During Drying. J. Sci. Food Agric. 1971, 22, 270–272. [Google Scholar] [CrossRef]
  63. Yingsanga, P.; Srilaong, V.; Kanlayanarat, S.; Noichinda, S.; McGlasson, W.B. Relationship between browning and related enzymes (PAL, PPO and POD) in rambutan fruit (Nephelium lappaceum Linn.) cvs. Rongrien and See-Chompoo. Postharvest Biol. Technol. 2008, 50, 164–168. [Google Scholar] [CrossRef]
  64. Ioannou, I.; Mohamed, G. Prevention of enzymatic browning in fruits and vegetables. Eur. Sci. J. 2013, 9, 310–341. [Google Scholar] [CrossRef]
  65. Perera, C.O. Selected Quality Attributes of Dried Foods. Dry. Technol. 2005, 23, 717–730. [Google Scholar] [CrossRef]
  66. Martins, S.I.F.S.; Jongen, W.M.F.; Van Boekel, M.A.J.S. A review of Maillard reaction in food and implications to kinetic modelling. Trends Food Sci. Technol. 2000, 11, 364–373. [Google Scholar] [CrossRef]
  67. Manzocco, L.; Calligaris, S.; Mastrocola, D.; Nicoli, M.C.; Lerici, C.R. Review of non-enzymatic browning and antioxidant capacity in processed foods. Trends Food Sci. Technol. 2000, 11, 340–346. [Google Scholar] [CrossRef]
  68. Hodge, J.E. Dehydrated foods. Chemistry of browning reactions in model systems. Agric. Food Chem. 1953, 1, 928–943. [Google Scholar] [CrossRef]
  69. Cernîşev, S. Effects of conventional and multistage drying processing on non-enzymatic browning in tomato. J. Food Eng. 2010, 96, 114–118. [Google Scholar] [CrossRef]
  70. Garza, S.; Ibarz, A.; Pagán, J.; Giner, J. Non-enzymatic browning in peach puree during heating. Food Res. Int. 1999, 32, 335–343. [Google Scholar] [CrossRef]
  71. Wegener, S.; Kaufmann, M.; Kroh, L.W. Influence of L-pyroglutamic acid on the color formation process of non-enzymatic browning reactions. Food Chem. 2017, 232, 450–454. [Google Scholar] [CrossRef] [PubMed]
  72. Contreras-Calderón, J.; Mejía-Díaz, D.; Martínez-Castaño, M.; Bedoya-Ramírez, D.; López-Rojas, N.; Gómez-Narváez, F.; Medina-Pineda, Y.; Vega-Castro, O. Evaluation of antioxidant capacity in coffees marketed in Colombia: Relationship with the extent of non-enzymatic browning. Food Chem. 2016, 209, 162–170. [Google Scholar] [CrossRef] [PubMed]
  73. Hurtado, A.; Guàrdia, M.D.; Picouet, P.; Jofré, A.; Ros, J.M.; Bañón, S. Stabilisation of red fruit-based smoothies by high-pressure processing. Part II: Effects on sensory quality and selected nutrients. J. Sci. Food Agric. 2016. [Google Scholar] [CrossRef] [PubMed]
  74. Sharma, S.K.; Juyal, S.; Rao, V.K.; Yadav, V.K.; Dixit, A.K. Reduction of non-enzymatic browning of orange juice and semi-concentrates by removal of reaction substrate. J. Food Sci. Technol. 2014, 51, 1302–1309. [Google Scholar] [CrossRef] [PubMed]
  75. Jaeger, H.; Janositz, A.; Knorr, D. The Maillard reaction and its control during food processing. The potential of emerging technologies. Pathol. Biol. 2010, 58, 207–213. [Google Scholar] [CrossRef] [PubMed]
  76. Aprajeeta, J.; Gopirajah, R.; Anandharamakrishnan, C. Shrinkage and porosity effects on heat and mass transfer during potato drying. J. Food Eng. 2015, 144, 119–128. [Google Scholar] [CrossRef]
  77. Bonazzi, C.; Dumoulin, E. Quality Changes in Food Materials as Influenced by Drying Processes. Mod. Dry. Technol. 2011, 3, 1–20. [Google Scholar] [CrossRef]
  78. Nadia, D.M. Effect of Air Drying on Color, Texture and Shrinkage of Sardine (Sardina pilchardus) Muscles. J. Nutr. Food Sci. 2011, 1, 113. [Google Scholar] [CrossRef]
  79. Dehghannya, J.; Gorbani, R.; Ghanbarzadeh, B. Shrinkage of Mirabelle Plum during Hot Air Drying as Influenced by Ultrasound-Assisted Osmotic Dehydration. Int. J. Food Prop. 2016, 19, 1093–1103. [Google Scholar] [CrossRef]
  80. Kerdpiboon, S.; Devahastin, S.; Kerr, W.L. Comparative fractal characterization of physical changes of different food products during drying. J. Food Eng. 2007, 83, 570–580. [Google Scholar] [CrossRef]
  81. Prothon, F.; Ahrné, L.; Sjöholm, I. Mechanisms and prevention of plant tissue collapse during dehydration: A critical review. Crit. Rev. Food Sci. Nutr. 2003, 43, 447–479. [Google Scholar] [CrossRef] [PubMed]
  82. De Bruijn, J.; Rivas, F.; Rodriguez, Y.; Loyola, C.; Flores, A.; Melin, P.; Borquez, R. Effect of Vacuum Microwave Drying on the Quality and Storage Stability of Strawberries. J. Food Process. Preserv. 2016, 40, 1104–1115. [Google Scholar] [CrossRef]
  83. Bourne, M.C. Texture, Viscosity, and Food. In Food Texture and Viscosity; Elsevier: London, UK, 2002; pp. 1–32. ISBN 9780121190620. [Google Scholar]
  84. Guiné, R.P.F.; Barroca, M.J. Effect of drying treatments on texture and color of vegetables (pumpkin and green pepper). Food Bioprod. Process. 2012, 90, 58–63. [Google Scholar] [CrossRef]
  85. Kotwaliwale, N.; Bakane, P.; Verma, A. Changes in textural and optical properties of oyster mushroom during hot air drying. J. Food Eng. 2007, 78, 1207–1211. [Google Scholar] [CrossRef]
  86. Tan, S. Determinants of eating quality in fruit and vegetables. Proc. Nutr. Soc. Aust. 2000, 24, 183–190. [Google Scholar]
  87. Martynenko, A.; Janaszek, M.A. Texture Changes During Drying of Apple Slices. Dry. Technol. 2014, 32, 567–577. [Google Scholar] [CrossRef]
  88. Lin, T.M.; Durance, T.D.; Scaman, C.H. Characterization of vacuum microwave, air and freeze dried carrot slices. Food Res. Int. 1999, 31, 111–117. [Google Scholar] [CrossRef]
  89. Gabriel, A.A. Estimation of water activity from pH and Brix values of some food products. Food Chem. 2008, 108, 1106–1113. [Google Scholar] [CrossRef] [PubMed]
  90. Sablani, S.S. Evaluating water activity and glass transition concepts for food stability. J. Food Eng. 2007, 78, 266–271. [Google Scholar] [CrossRef]
  91. Wikipedia Moisture Sorption Isotherm. Available online: https://en.wikipedia.org/wiki/Moisture_sorption_isotherm (accessed on 1 November 2017).
  92. Strumiłło, C.; Jones, P.L.; Zyłła, R. Energy Aspects in Drying. In Handbook of Industrial Drying, 3rd ed.; CRC Press: Boca Raton, FL, USA, 2006; pp. 1075–1099. ISBN 978-1-57444-668-5. [Google Scholar]
  93. Baker, C.G.J. Energy Efficient Dryer Operation—An Update on Developments. Dry. Technol. 2005, 23, 2071–2087. [Google Scholar] [CrossRef]
  94. Kudra, T. Energy aspects in drying. Dry. Technol. 2004, 22, 917–932. [Google Scholar] [CrossRef]
  95. Grabowski, S.; Marcotte, M.; Poirier, M.; Kudra, T. Drying Characteristics of Osmotically Pretreated Cranberries—Energy and Quality Aspects. Dry. Technol. 2002, 20, 1989–2004. [Google Scholar] [CrossRef]
  96. Yongsawatdigul, J.; Gunasekaran, S. Microwave-vacuum drying of cranberries: Part I. Energy use and efficiency. J. Food Process. 1996, 20, 121–143. [Google Scholar] [CrossRef]
  97. Raghavan, G.S.V.; Rennie, T.J.; Sunjka, P.S.; Orsat, V.; Phaphuangwittayakul, W.; Terdtoon, P. Overview of new techniques for drying biological materials with emphasis on energy aspects. Braz. J. Chem. Eng. 2005, 22, 195–201. [Google Scholar] [CrossRef]
  98. Kemp, I.C. Reducing dryer energy use by process integration and pinch analysis. Dry. Technol. 2005, 23, 2089–2104. [Google Scholar] [CrossRef]
  99. Li, J.B.; Huang, W.Q.; Zhao, C.J. Machine vision technology for detecting the external defects of fruits—A review. Imaging Sci. J. 2015, 63, 241–251. [Google Scholar] [CrossRef]
  100. Davies, E.R. The application of machine vision to food and agriculture: A review. Imaging Sci. J. 2009, 57, 197–217. [Google Scholar] [CrossRef]
  101. Menesatti, P.; Angelini, C.; Pallottino, F.; Antonucci, F.; Aguzzi, J.; Costa, C. RGB color calibration for quantitative image analysis: The “3D Thin-Plate Spline” warping approach. Sensors 2012, 12, 7063–7079. [Google Scholar] [CrossRef] [PubMed]
  102. Gunasekaran, S. Computer vision technology for food quality assurance. Trends Food Sci. Technol. 1996, 7, 245–256. [Google Scholar] [CrossRef]
  103. Gunasekaran, S.; Chen, P.L. Nondestructive Food Evaluation: Techniques to Analyze Properties and Quality; Marcel Dekker Inc.: New York, NY, USA, 2001. [Google Scholar]
  104. Batchelor, B.; Waltz, F. Programmable color filter Representation of color. In Intelligent Machine Vision Techniques, Implementations and Applications; Springer: London, UK, 2001; pp. 345–422. ISBN 978-1-4471-1129-0. [Google Scholar]
  105. Vijayarekha, K. Machine Vision Application for Food Quality: A Review. Res. J. Appl. Sci. Eng. Technol. 2012, 4, 5453–5458. [Google Scholar]
  106. ElMasry, G.; Sun, D.-W. Hyperspectral imaging for food quality analysis and control. In Hyperspectral Imaging for Food Quality Analysis and Control; Sun, D.-W., Ed.; Academic Press: London, UK, 2010; Volume 1, pp. 3–43. ISBN 9788578110796. [Google Scholar]
  107. Munjanja, B.; Sanganyado, E. UV-Visible Absorption, Fluorescence ,and Chemiluminescence Spectroscopy. In Handbook of Food Analysis; Nollet, L.M., Fidel, T., Eds.; CRC Press: London, UK, 2004; pp. 572–583. [Google Scholar]
  108. Abbott, J. Quality measurement of fruits and vegetables. Postharvest Biol. Technol. 1999, 15, 207–225. [Google Scholar] [CrossRef]
  109. Reid, L.M.; O’Donnell, C.P.; Downey, G. Recent technological advances for the determination of food authenticity. Trends Food Sci. Technol. 2006, 17, 344–353. [Google Scholar] [CrossRef]
  110. Nawrocka, A.; Lamorska, J. Determination of Food Quality by Using Spectroscopic Methods. In Advances in Agrophysical Research; InTech: Rijeka, Croatia, 2013; pp. 347–368. ISBN 978-953-51-1184-9. [Google Scholar]
  111. Molina-Diaz, A.; Garcia-Reyes, J.F.; Gilbert-Lopez, B. Solid-phase spectroscopy from the point of view of green analytical chemistry. TrAC Trends Anal. Chem. 2010, 29, 654–666. [Google Scholar] [CrossRef]
  112. Wu, W.-L.; Zhao, Z.-M.; Dai, X.; Su, L.; Zhao, B.-X. A fast-response colorimetric and fluorescent probe for hypochlorite and its real applications in biological imaging. Sens. Actuators B Chem. 2016, 232, 390–395. [Google Scholar] [CrossRef]
  113. He, H.J.; Sun, D.W. Microbial evaluation of raw and processed food products by Visible/Infrared, Raman and Fluorescence spectroscopy. Trends Food Sci. Technol. 2015, 46, 199–210. [Google Scholar] [CrossRef]
  114. Williams, P.; Norris, K. Chemical principles. In Near-Infrared Technology in the Agricultural and Food Industries; Miller, C.E., Ed.; American Association of Cereal Chemists: St. Paul, MN, USA, 2001; pp. 19–37. [Google Scholar]
  115. Moscetti, R.; Haff, R.P.; Monarca, D.; Cecchini, M.; Massantini, R. Near-infrared spectroscopy for detection of hailstorm damage on olive fruit. Postharvest Biol. Technol. 2016, 120, 204–212. [Google Scholar] [CrossRef]
  116. Moscetti, R.; Radicetti, E.; Monarca, D.; Cecchini, M.; Massantini, R. Near infrared spectroscopy is suitable for the classification of hazelnuts according to Protected Designation of Origin. J. Sci. Food Agric. 2015, 95, 2619–2625. [Google Scholar] [CrossRef] [PubMed]
  117. Jha, S.N. Spectroscopy and chemometrics. In Rapid Detection of Food Adulterants and Contaminants; Jha, S.N., Ed.; Academic Press: London, UK, 2016; pp. 163–164. ISBN 9780124200845. [Google Scholar]
  118. Goddu, R.F. Determination of Unsaturation by Near-Infrared Spectrophotometry. Anal. Chem. 1957, 29, 1790–1794. [Google Scholar] [CrossRef]
  119. Gassman, P.G.; Hooker, W.M. Near-Infrared Studies. Norbornenes and Related Compounds. J. Am. Chem. Soc. 1965, 87, 1079–1083. [Google Scholar] [CrossRef]
  120. Aines, R.D.; Rossman, G.R. Water in minerals? A peak in the infrared. J. Geophys. Res. 1984, 89, 4059–4071. [Google Scholar] [CrossRef]
  121. Iwamoto, M.; Uozumi, J.; Nishinari, K. Preliminary Investigation of the State of Water in Foods by Near Infrared Spectroscopy. In Proceedings of the International NIR/NIT Conference, Budapest, Hungary, 3 December 1987. [Google Scholar]
  122. Bush, S.G.; Jorgenson, J.W.; Miller, M.L.; Linton, R.W. Transmission near-infrared technique for evaluation and relative quantitation of surface groups on silica. J. Chromatogr. A 1983, 260, 1–12. [Google Scholar] [CrossRef]
  123. Weyer, L.G. Near-Infrared Spectroscopy of Organic Substances. Appl. Spectrosc. Rev. 1985, 21, 1–43. [Google Scholar] [CrossRef]
  124. Whetsel, K.B.; Roberson, W.E.; Krell, M.W. Near-Infrared Spectra of Primary Aromatic Amines. Anal. Chem. 1958, 30, 1598–1604. [Google Scholar] [CrossRef]
  125. Russell, R.A.; Thompson, H.W. Vibrational Band Intensities and the Electrical Anharmonicity of the NH Group. Proc. R. Soc. Lond. A Math. Phys. Eng. Sci. 1956, 234, 318–326. [Google Scholar] [CrossRef]
  126. Tobergte, D.R.; Curtis, S. Practical Guide and Spectral Atlas for Interpretive Near-Infrared Spectroscopy; CRC Press: Boca Raton, FL, USA, 2013; Volume 53, ISBN 9788578110796. [Google Scholar]
  127. Law, D.P.; Tkachuk, R. Near Infrared Diffuse Reflectance Spectra of Wheat and Wheat Components. Cereal Chem. 1977, 56, 256–265. [Google Scholar]
  128. Wheeler, O.H. Near Infrared Spectra Of Organic Compounds. Chem. Rev. 1959, 59, 629–666. [Google Scholar] [CrossRef]
  129. Chabert, B.; Lachenal, G.; Vinh Tung, C. Epoxy resins and epoxy blends studied by near infra-red spectroscopy. Macromol. Symp. 1995, 94, 145–158. [Google Scholar] [CrossRef]
  130. Pasquini, C. Near Infrared Spectroscopy: Fundamentals, practical aspects and analytical applications. J. Braz. Chem. Soc. 2003, 14, 198–219. [Google Scholar] [CrossRef]
  131. Cozzolino, D.; Cynkar, W.U.; Shah, N.; Smith, P. Multivariate data analysis applied to spectroscopy: Potential application to juice and fruit quality. Food Res. Int. 2011, 44, 1888–1896. [Google Scholar] [CrossRef]
  132. Gómez-Caravaca, A.M.; Maggio, R.M.; Cerretani, L. Chemometric applications to assess quality and critical parameters of Virgin and Extra-Virgin Olive Oil. A Review. Anal. Chim. Acta 2016, 913. [Google Scholar] [CrossRef] [PubMed]
  133. Mollazade, K.; Omid, M.; Tab, F.A.; Mohtasebi, S.S. Principles and Applications of Light Backscattering Imaging in Quality Evaluation of Agro-food Products: A Review. Food Bioprocess Technol. 2012, 5, 1465–1485. [Google Scholar] [CrossRef]
  134. Moscetti, R.; Saeys, W.; Keresztes, J.C.; Goodarzi, M.; Cecchini, M.; Danilo, M.; Massantini, R. Hazelnut Quality Sorting Using High Dynamic Range Short-Wave Infrared Hyperspectral Imaging. Food Bioprocess Technol. 2015, 8, 1593–1604. [Google Scholar] [CrossRef]
  135. Menesatti, P.; Zanella, A.; D’Andrea, S.; Costa, C.; Paglia, G.; Pallottino, F. Supervised Multivariate Analysis of Hyper-spectral NIR Images to Evaluate the Starch Index of Apples. Food Bioprocess Technol. 2008, 2, 308–314. [Google Scholar] [CrossRef]
  136. Karoui, R.; Blecker, C. Fluorescence Spectroscopy Measurement for Quality Assessment of Food Systems—A Review; Springer: Berlin/Heidelberg, Germany, 2010; Volume 4. [Google Scholar]
  137. Zhang, B.; Huang, W.; Li, J.; Zhao, C.; Fan, S.; Wu, J.; Liu, C. Principles, developments and applications of computer vision for external quality inspection of fruits and vegetables: A review. Food Res. Int. 2014, 62, 326–343. [Google Scholar] [CrossRef]
  138. Mahesh, S.; Jayas, D.S.; Paliwal, J.; White, N.D.G. Hyperspectral imaging to classify and monitor quality of agricultural materials. J. Stored Prod. Res. 2015, 61, 17–26. [Google Scholar] [CrossRef]
  139. Rinnan, Å; van den Berg, F.; Engelsen, S.B. Review of the most common pre-processing techniques for near-infrared spectra. TrAC Trends Anal. Chem. 2009, 28, 1201–1222. [Google Scholar] [CrossRef]
  140. Xu, L.; Zhou, Y.P.; Tang, L.J.; Wu, H.L.; Jiang, J.H.; Shen, G.L.; Yu, R.Q. Ensemble preprocessing of near-infrared (NIR) spectra for multivariate calibration. Anal. Chim. Acta 2008, 616, 138–143. [Google Scholar] [CrossRef] [PubMed]
  141. Wold, S.; Sjöström, M.; Eriksson, L. PLS-regression: A basic tool of chemometrics. Chemom. Intell. Lab. Syst. 2001, 58, 109–130. [Google Scholar] [CrossRef]
  142. Wang, H.; Peng, J.; Xie, C.; Bao, Y.; He, Y. Fruit Quality Evaluation Using Spectroscopy Technology: A Review. Sensors 2015, 15, 11889–11927. [Google Scholar] [CrossRef] [PubMed]
  143. Dey, V.; Zhang, Y.; Zhong, M. A Review on Image Segmentation Techniques With remote sensing perspective. In Proceedings of the ISPRS TC VII Symposium—100 Years ISPRS, Vienna, Austria, 5–7 July 2010; Volume XXXVIII, pp. 31–42. [Google Scholar]
  144. Kang, S.P.; Sabarez, H.T. Simple colour image segmentation of bicolour food products for quality measurement. J. Food Eng. 2009, 94, 21–25. [Google Scholar] [CrossRef]
  145. Du, C. Recent developments in the applications of image processing techniques for food quality evaluation. Trends Food Sci. Technol. 2004, 15, 230–249. [Google Scholar] [CrossRef]
  146. Brosnan, T.; Sun, D.W. Improving quality inspection of food products by computer vision—A review. J. Food Eng. 2004, 61, 3–16. [Google Scholar] [CrossRef]
  147. Lu, R. Quality evaluation of Fruit by Hyperspectral Imaging. In Computer Vision Technology for Food Quality Evaluation; Academic Press: Cambridge, MA, USA, 2008; Chapter 14; pp. 319–348. ISBN 9780123736420. [Google Scholar]
  148. Cen, H.; He, Y. Theory and application of near infrared reflectance spectroscopy in determination of food quality. Trends Food Sci. Technol. 2007, 18, 72–83. [Google Scholar] [CrossRef]
  149. Chen, L.; Opara, U.L. Approaches to analysis and modeling texture in fresh and processed foods—A review. J. Food Eng. 2013, 119, 497–507. [Google Scholar] [CrossRef]
  150. Wu, D.; Sun, D.-W. Advanced applications of hyperspectral imaging technology for food quality and safety analysis and assessment: A review—Part II: Applications. Innov. Food Sci. Emerg. Technol. 2013, 19, 15–28. [Google Scholar] [CrossRef]
  151. Romano, G.; Nagle, M.; Müller, J. Two-parameter Lorentzian distribution for monitoring physical parameters of golden colored fruits during drying by application of laser light in the Vis/NIR spectrum. Innov. Food Sci. Emerg. Technol. 2016, 33, 498–505. [Google Scholar] [CrossRef]
  152. Barzaghi, S.; Gobbi, S.; Torreggiani, D.; Giangiacomo, R. Near infrared spectroscopy for the control of osmo–air dehydrated apple rings. J. Near Infrared Spectrosc. 2008, 149, 143–149. [Google Scholar] [CrossRef]
  153. Sampson, D.J.; Chang, Y.K.; Rupasinghe, H.P.V.; Zaman, Q.U. A dual-view computer-vision system for volume and image texture analysis in multiple apple slices drying. J. Food Eng. 2014, 127, 49–57. [Google Scholar] [CrossRef]
  154. Sturm, B.; Hofacker, W.C.; Hensel, O. Optimizing the Drying Parameters for Hot-Air-Dried Apples. Dry. Technol. 2012, 30, 1570–1582. [Google Scholar] [CrossRef]
  155. Behroozi Khazaei, N.; Tavakoli Hashjin, T.; Ghassemian, H.; Khoshtaghaza, M.H.; Banakar, A. Application of machine vision in modeling of grape drying process. J. Agric. Sci. Technol. 2013, 15, 1095–1106. [Google Scholar]
  156. Dénes, L.D.; Zsom-Muha, V.; Baranyai, L.; Felföldi, J. Modelling of apple slice moisture content by optical methods. Acta Aliment. 2012, 41, 39–51. [Google Scholar] [CrossRef]
  157. Romano, G.; Argyropoulos, D.; Nagle, M.; Khan, M.T.; Müller, J. Combination of digital images and laser light to predict moisture content and color of bell pepper simultaneously during drying. J. Food Eng. 2012, 109, 438–448. [Google Scholar] [CrossRef]
  158. Hafezi, N.; Sheikhdavoodi, M.J.; Sajadiye, S.M. Shrinkage characteristic of potato slices based on computer vision. Agric. Eng. Int. 2015, 17, 287–295. [Google Scholar]
  159. Martynenko, A.I. Porosity Evaluation of Ginseng Roots from Real-Time Imaging and Mass Measurements. Food Bioprocess Technol. 2011, 4, 417–428. [Google Scholar] [CrossRef]
  160. Mulet, A.; Garcia-Reverter, J.; Bon, J.; Berna, A. Effect of Shape on Potato and Cauliflower Shrinkage during Drying. Dry. Technol. 2000, 18, 1201–1219. [Google Scholar] [CrossRef]
  161. Liu, C.; Liu, W.; Lu, X.; Chen, W.; Yang, J.; Zheng, L. Potential of Multispectral Imaging for Real-Time Determination of Colour Change and Moisture Distribution in Carrot Slices during Hot Air Dehydration; Elsevier Ltd.: Amsterdam, The Netherlands, 2016; Volume 195, ISBN 8655162919398. [Google Scholar]
  162. Ozaki, Y.; McClure, W.F.; Christy, A.A. (Eds.) Near-Infrared Spectroscopy in Food Science and Technology; John Wiley & Sons, Inc.: Hoboken, NJ, USA, 2006. [Google Scholar]
  163. Moscetti, R.; Monarca, D.; Cecchini, M.; Haff, R.P.; Contini, M.; Massantini, R. Detection of Mold-Damaged Chestnuts by Near-Infrared Spectroscopy. Postharvest Biol. Technol. 2014, 93, 83–90. [Google Scholar] [CrossRef]
  164. Chen, Q.; Zhang, C.; Zhao, J.; Ouyang, Q. Recent advances in emerging imaging techniques for non-destructive detection of food quality and safety. TrAC Trends Anal. Chem. 2013, 52, 261–274. [Google Scholar] [CrossRef]
  165. Feng, Y.-Z.; Sun, D.-W. Application of hyperspectral imaging in food safety inspection and control: A review. Crit. Rev. Food Sci. Nutr. 2012, 52, 1039–1058. [Google Scholar] [CrossRef] [PubMed]
  166. Giangiacomo, R. Study of water-sugar interactions at increasing sugar concentration by NIR spectroscopy. Food Chem. 2006, 96, 371–379. [Google Scholar] [CrossRef]
  167. Kays, S.; Franklin Barton, I.I.; Windham, W. Predicting protein content by near infrared reflectance spectroscopy in diverse cereal food products. J. Near Infrared Spectrosc. 2000, 8, 35–43. [Google Scholar] [CrossRef]
  168. Wesley, I.J.; Larroque, O.; Osborne, B.G.; Azudin, N.; Allen, H.; Skerritt, J.H. Measurement of Gliadin and Glutenin Content of Flour by NIR Spectroscopy. J. Cereal Sci. 2001, 34, 125–133. [Google Scholar] [CrossRef]
  169. Bobelyn, E.; Serban, A.S.; Nicu, M.; Lammertyn, J.; Nicolai, B.M.; Saeys, W. Postharvest quality of apple predicted by NIR-spectroscopy: Study of the effect of biological variability on spectra and model performance. Postharvest Biol. Technol. 2010, 55, 133–143. [Google Scholar] [CrossRef]
  170. Giovanelli, G.; Sinelli, N.; Beghi, R.; Guidetti, R.; Casiraghi, E. NIR spectroscopy for the optimization of postharvest apple management. Postharvest Biol. Technol. 2014, 87, 13–20. [Google Scholar] [CrossRef]
  171. Moscetti, R.; Haff, R.P.; Ferri, S.; Raponi, F.; Monarca, D.; Liang, P.; Massantini, R. Real-Time Monitoring of Organic Carrot (var. Romance) During Hot-Air Drying Using Near-Infrared Spectroscopy. Food Bioprocess Technol. 2017, 10, 2046–2059. [Google Scholar] [CrossRef]
Figure 1. Sorption isotherm for a typical food product. The difference between the adsorption (wetting) and desorption (drying) curve is called hysteresis [91].
Sustainability 09 02009 g001
Figure 2. Elements of a computer vision (CV) system.
Sustainability 09 02009 g002
Figure 3. Interaction between matter and electromagnetic radiation (ER).
Sustainability 09 02009 g003
Figure 4. Schematic representation of a hypercube.
Sustainability 09 02009 g004
Figure 5. Schematic representation of single-point and hyperspectral image (HSI) processing.
Sustainability 09 02009 g005
Table 1. Overtone bands for common molecular classes investigated by NIR.
Molecular Classes/MoleculeBondFeatures (nm)Reference
1st Overtone2nd Overtone
Aliphatic hydrocarbonsC-H17001150[117]
Aromatic hydrocarbonsC-H16851143
Olefins (1-octene)C-H1620 [118]
OlefinsC-H16801180
NorborneneC-H1645–1675 [119]
WaterO-H1453979[120]
Alcohol and phenolsO-H1405–1425945–985[121]
SilanolsO-H1385 [122]
Primary amines (R-NH2)N-H1500 and 15301000[123]
Secondary amines (R2-NH)N-H1520–1540
Aromatic amines (Ar-NH2)N-H1450–14901020[124]
Cyclic aminesN-H1450 [125]
(pyrroles, indoles, carbazoles)
Ethanamide (CH3CONH2)N-H1430 and 1490 [126]
N-methyl ethanamide (CH3CONHCH3)N-H1475
Wheat proteinN-H1500 and 1570 [127]
Aldehydes and ketonesC=O29001960[128]
EstersC=O1900–1950
PeptidesC=O1920
Carboxylic acidsC=O1900
EpoxidesC-O1640–1650 [129]
Organophosphorus compoundsP-H1891
Aliphatic and aromatic thiolsS-H1970–1980 [126]
Phosphorus-thiol groupP-S-H1970 and 1999
Table 2. Monitoring of fruits during drying using spectroscopy and image analysis techniques. AD, air drying; MSI, multispectral imaging; RMSEP, root mean square error in prediction.
ProductsDryer TypeCV DeviceFeaturesResolutionAttribute(s)AlgorithmMetricReference
Error MetricR2
Mango (var. Nam Dokmai)ADVis-NIR473, 532 and 875 nm5 nmBrowning index,----0.63[151]
w0.91
Hardness (h)0.70
Litchi (var. Chinensis Sonn.)ADVis-NIR473, 532 and 875 nm5 nmBrowning index,0.81
w0.80
h0.55
Apple (var. Golden delicious and Pink lady)OD + ADNIR1000–2500 nm0.8–5 nmwPLS-DA3.33 (RPD)0.93[152]
13.79 (RER)
Mango (var. Nam Dokmai)MVDHSI880–1720 nm7 nmwPLS4.7160.97[13]
MSI1342, 1405 nmwPLS5.5820.96
Apple (var. Granny Smith)ADCVRGB1280 × 1024 pixelsL*COM<5% (SE)0.91[12]
a*0.94
b*0.95
Apple (var. Empire)ADCVRGB640 × 480 pixelsArea----1[153]
Thickness0.97
Volume0.95
Hue angle1
L*0.90
Chroma (C*)0.94
Texture0.90
Apple (var. Jonagold)ADCVVisible1280 × 768 pixelsΔE*Third order polynomial 0.95[154]
ShrinkageP = 0.040.68
Sultana grape (var. Vitis vinifera L)ADCVVisible--wPage’s model--0.99[155]
Shrinkage0.99
ΔE*0.95
Apple (var. Idared)ADNIR740–1400 nm9 nmw, (dry bulb)PLSRMSEP < 5.09, RPD = 5.090.98[156]
w, (wet bulb)RMSEP < 24.82, RPD = 6.630.99
MSI532, 635, 650, 780, 808, 850, 1064 nm5 nmw, (dry bulb)PLSRMSEP 38.410.94
w, (wet bulb)RMSEP 13.20.71
MVD = microwave vacuum drying; OD = osmo-air dehydration; COM = Co-occurrence matrices; RPD = regression point displacement; RER = range error ratio.
Table 3. Monitoring of vegetables during drying using spectroscopy and image analysis techniques.
SpeciesDryer TypeCV DeviceFeaturesResolutionAttribute(s)AlgorithmMetricReference
Error MetricR2
Yellow pepper (var. Capsicum annuum)ADCV (CCD camera + laser diode)Visible (CCD camera; 532 and 635 nm)1280 × 1024 pixelsw--7.280.93[157]
L*--0.9
a*0.93
b*0.72
Green pepper (var. Capsicum annuum)ADCV (CCD camera + laser diode)Visible (CCD camera; 532 and 635 nm)1280 × 1024 pixelsw (635 nm)8.770.9
L*--0.87
a*0.97
b*Low
Red pepper (var. Capsicum annuum)ADCV (CCD camera + laser diode)Visible (CCD camera; 532 and 635 nm)1280 × 1024 pixelsw (532 nm)9.950.89
L*--Low
a*Low
b*Low
Soybean (var. Glycine max)MVDHSI400–1000 nm0.12 mm/pixelColorSegmentation PLSRMSEP = 1.00.74[15]
0.64 mm/pixelwRMSEP = 4.70.94
Ginseng (var. Panax ginseng), (var. Panax quinquefolium)ADNIR1100–2500 nm8 nmwFirst derivative, SNV, PLSSEP = 0.141[11]
Potato (var. Solarium tuberosum)IRCV (digital camera)Visible range3648 × 2736 pixelsShapeImage processing, segmentation--[158]
Shrinkage
Ginseng (var. Panax ginseng)ADCV (CCD camera)Visible range1040 × 1392 pixelsDensity, shrinkage, porosityImage processing, segmentation--[159]
Potato (var. Solarium tuberosum)ADComputer vision (black/white video camera)Visible range510 × 492 pixelsShrinkageSegmentationBIAS = 0.6%0.99[160]
Cauliflower (var. Snow March)BIAS = 0.6%0.97
Carrot (var. Daucus carota)MVDCV (CCD digital camera)Visible range3264 × 2448 pixelsShrinkage, color----1[16]
Carrot (var. Daucus carota)ADMSI19 wavelengths from 405–970 nm--w, colorPLS, LS-SVM, BPNNRMSEP = 1.4820.99[161]
MVD = microwave vacuum drying; OD = osmo-air dehydration; COM = co-occurrence matrices; RPD = regression point displacement; RER = range error ratio.

