Article

Exploring Effective Incentive Design to Reduce Food Waste: A Natural Experiment of Policy Change from Community Based Charge to RFID Based Weight Charge

1
Department of Public Administration, Yonsei University, 1599-1885 50 Yonsei-ro Seodaemun-gu, Seoul 03722, Korea
2
Korea Institute of Public Affairs, Graduate School of Public Administration, Seoul National University, 1 Gwanak-ro, Gwanak-gu, Seoul 08826, Korea
*
Author to whom correspondence should be addressed.
Sustainability 2017, 9(11), 2046; https://0-doi-org.brum.beds.ac.uk/10.3390/su9112046
Submission received: 13 August 2017 / Revised: 23 October 2017 / Accepted: 1 November 2017 / Published: 8 November 2017

Abstract

:
This research explores the impact of the Radio Frequency Identification (RFID) Household-Based Food Waste Charging System (RHWC) on the reduction of food waste in Mapo-Gu district located in Seoul city from June 2013 to July 2016. Through comparing the amount of food waste disposal between 12 apartment complexes with the RHWC policy (treatment group) and 61 apartment complexes (control group) without the policy, we attempt to identify whether the RHWC can contribute in reducing food waste. In June 2013, all these apartment complexes adopted an apartment complex unit-based food-waste system (i.e., Community-Based Waste Charging system-CWC), but, in January 2016, the 12 apartment complexes introduced the RHWC policy, while the other 61 apartment complexes kept the CWC policy. This natural experiment setting allows us to compare the difference in the quantity of food waste disposal between these two payment policies. The RHWC uses a weight based payment design, through which each household is electronically charged for the weight of food waste they disposes, while the CWC uses a group incentive system where residents pay the same price by dividing total amount of waste charge by total number of household in apartment complex. We, relying on propensity score matching and Difference-In-Difference (PSM-DID) methodology, found a significant difference in the amount of food waste disposal between these two payment systems. Our empirical finding shows that the RHWC deign can reduce more food waste than the CWC design. This study suggests that municipalities can reduce food waste through redesigning incentive mechanism in which it is able to reduce free riding by electronically identifying and monitoring how much residents throw out thanks to RFID technology.

1. Introduction

Most metropolitan cities face environmental policy challenges about how to develop a sustainable food waste system. This is closely related to public health and sanitary [1]. In addition, reducing food waste can reduce greenhouse gas [2] and climate change [3] because waste sector contributes a lot to greenhouse gas emission. Moreover, solving food waste disposal issue can suggest relevant solution to global hunger [4]. Urban waste disposal system increasingly requests an appropriate arrangement between relevant policy instruments and smart technologies to reduce food waste. Scrutinizing food waste disposal system, especially in highly dense apartment complexes, is becoming important because more people start to reside in apartment complexes with urbanization. Although designing effective pricing mechanism is a key issue in waste reduction and waste management [5], and the potential of RFID technology in increasing effectiveness of waste management is significant [6,7], their importance has not been well illuminated yet.
This study explores the effect of the “Radio Frequency Identification (RFID) Household-Based Waste Charging System” (RHWC) for waste reduction in South Korea. In 1995, South Korea introduced the volume-rate garbage disposal system throughout the country and, since 2005, municipalities of South Korea have adopted various types of pricing mechanisms for food waste disposal, including a community based charging system, plastic garbage bag, sticker mode, and RFID method. Each apartment complex can choose which method to implement by themselves. For instance, before adopting the RFID based waste management, the Community-Based Waste Charging system (CWC) [8] and Sticker system were implemented in 1400 apartment complexes located in Seoul City [7], while the rest used plastic bag system. This heterogeneous adoption process allows us to compare which systems of food waste disposal is effective to reduce food waste, especially between the RHWC and CWC pricing systems. In the CWC and Sticker system, residents in each apartment complex throw food waste into a large plastic container located in the apartment complex and pay waste charge equally divided by the number of households. In other words, both systems have used group incentive system where there is no or less incentive to reduce food waste because residents pay all the same fee regardless how much they throw out. These payment schemes are not enough to reduce food waste significantly due to the free rider problem.
RFID technology provides an opportunity to introduce an innovative food waste management beyond the CWC problem. The RFID system can gauge the amount of food waste with an electronic identification system and charge a fee depending on its weight. The RHWC design allows local governments to gauge the total amount of food waste that each individual household emits using an RFID tag-embedded ID card and a reader machine because the RHWC system can trace the exact amount of emitted waste and charges a waste price to each household based on its emissions.
Little empirical research has, however, discussed the potential impact of the RHWC payment design on reducing food waste in South Korea. We use the adoption of the RHWC policy as a case of natural experiment [9,10] because this new food waste policy naturally generates both treatment and control groups, respectively, adopting the RHWC and the CWC payment schemes. This quasi-experimental condition allows us to collect monthly food-waste disposal data from apartment complexes before and after the adoption of the RHWC scheme. The data set naturally generated by both treatment and control groups allows us to identify the effect of the RHWC payment design on reducing food waste through Difference-In-Difference (DID) analysis and PSM (Propensity Score Matching) method for group matching.
This study tests whether there is significant difference in reducing food waste between the CWC design and the RHWC design. This quasi-experimental setting provides an opportunity to compare the relative effectiveness of the RHWC payment mechanism with the CWC payment mechanism. This research consists of five main sections. First, we provide an overview of food waste pricing policy in Seoul Metropolitan City. Second, we summarize a relevant literature on waste pricing mechanism. Third, we discuss a quasi-experimental research design, data, and analytical methods. Fourth, we discuss our empirical findings and finally suggest theoretical and practical implications and further research topics.

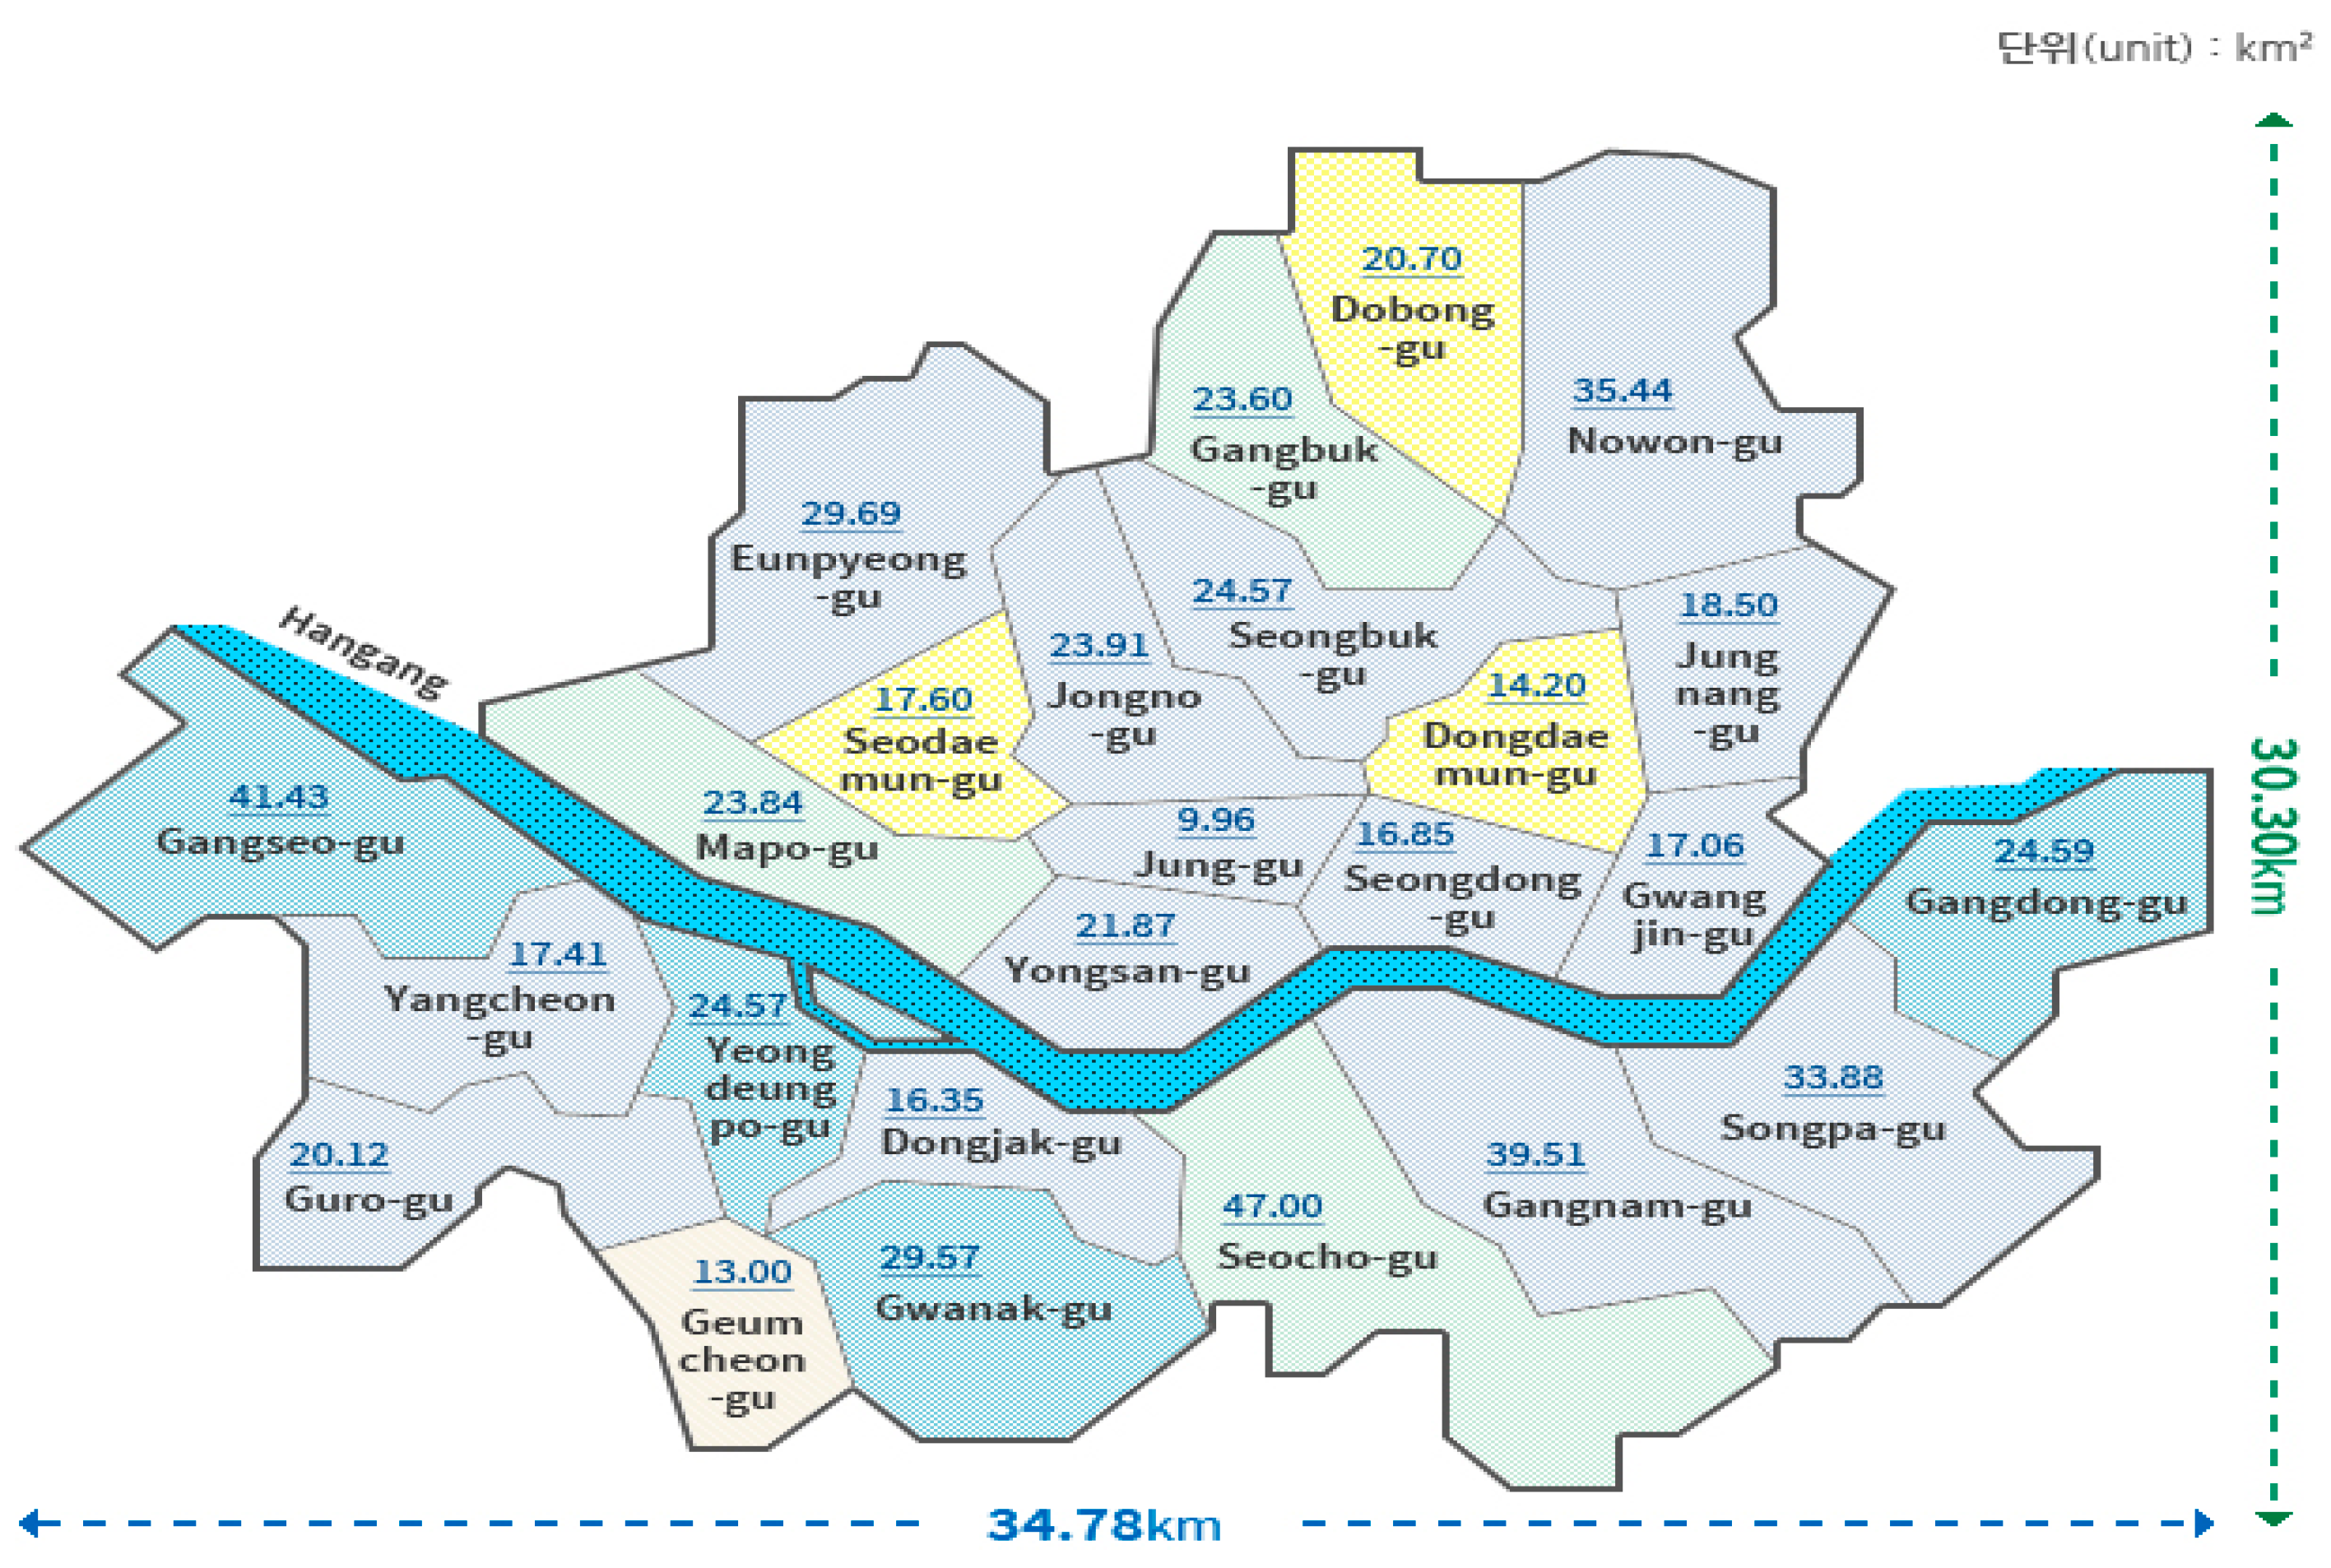
2. Food Waste Pricing Design in Seoul Metropolitan City

In this section, we provide a broad review on food waste pricing system in Seoul Metropolitan City. Municipalities consisting of 25 local autonomous districts, called as Gu, within Seoul Metropolitan City have adopted several different types of payment design for food waste disposal. As of 2015, approximately 20% of the apartment complexes in Seoul are introducing the RFID weighing method, and the city of Seoul is still investing over 800 million USD annually for food waste disposal [11]. Many of local governments in Seoul City still attempt to reduce food waste by raising waste charge while maintaining CWC or Sticker system. As seen in Table 1, Seoul has four kinds of food waste-charging systems. The details are as follows.
In the CWC, each household collects food waste in a large plastic can located inside the apartment complex. A pick-up service with an RFID reader visits the apartment complex regularly to collect food waste as well as emission data. The pick-up service first identifies the apartment complex that the plastic can originates from, and then gauges the total amount. After measuring, the pick-up service reports these data to the Korean Environmental Cooperation (KEC). The KEC imposes a waste charge divided by the number of households (1/n) at the end of the month, so the residents pay equally no matter how much they emitted during the month. In other words, in the CWC, residents collect food waste in a large plastic can with an embedded RFID tag that identifies the apartment complex, not each household. Therefore, we described this type of tax-imposing system as a “community-based imposing system”. The degree of waste charge varies by Gu, but the span of the difference is quite small.
Unlike CWC, the RHWC is based on individual incentive. In the RHWC, the residents of an apartment complex are levied a waste charge based on the amount they emit per month. Specifically, in the RHWC, the residents first touch an RFID-embedded card to a metal can with an RFID reader equipped inside. Once the RFID reader identifies the polluter, the door is opened. Then, the identified resident throws away the food waste in the metal can and checks the amount of waste emitted. These data are transmitted to the server in the Korean Environmental Cooperation (KEC), an organization founded for monitoring and managing waste collection. At the end of the month, the KEC imposes a fee on each household based on this collection data.
In the sticker system, each household collects food waste in a large plastic can located inside the apartment complex. The waste pick-up enterprise measures the total amount of emitted waste using liters, a typical unit for measuring volume, and reports to the Gu (Korean district) office before collecting food waste. At the end of the month, the Gu office sums the total food-waste pollution of each apartment complex and calculates the total waste charge. Then, the Gu office levies a waste tax on each household equal to the waste charge charged on the apartment complex divided by the number of households in the apartment complex (1/n). The plastic-bag system is similar to the sticker system in the way it measures emission quantity and degree of tax. Like the sticker system, the plastic-bag system also implements a weight-based unit-based waste system, and the degree of tax is also similar to the sticker system. In addition, measuring the exact amount of waste pollution of household is impossible in both systems. However, there is one large difference between these two waste pollution methods. In the plastic-bag system, each household buys plastic bags in a nearby retail store based on their need. In other words, in the plastic-bag system, the amount each household has to pay per month is closely related to the amount they emitted. However, because of budget and time limits, the Gu office cannot measure, monitor and trace waste pollutions, so they sell plastic bags to citizens instead of collecting the waste charge directly.

3. Literature Review on Waste Disposal Pricing System

3.1. Unit-Based Waste Pricing System

As Hopper et al. [12] stressed, source reduction is most important in waste minimization. The unit-based waste pricing (or charging) system is widely known among economists as the most efficient way to increase recycling and decrease waste pollution [13]. The definition of a unit-based waste pricing system varies by scholar, but the main theories beneath each definition are similar: the “polluter pays principle” and “use economic incentives and the market system to minimize waste pollution”. In other words, the unit-based waste pricing system is a mechanism that implements market mechanisms to provide economic incentives to decrease waste pollutions [14]. Before the unit-based waste pricing system was adopted, a free or flat-rate system was widely implemented. In these systems, polluters paid nothing or paid a fixed fee no matter how they emitted, and the government paid the remainder needed for waste disposal. Currently, free and flat-rate systems are widely adopted not only in the United States but also in most local governments in South Korea. The most important problem that free and flat-rate systems have is the hindering of taxation equity because they cannot prevent the free-riding effect [15]. Since polluters pay an equal amount of waste charges no matter how much they emit in these systems, free riders can emit as much waste as they want because the amount of their emission is not directly related to a waste charge. The possibility of a free rider insulates the possibility of waste increase.
The unit-based waste disposal system has some advantages in terms of waste reduction in that it can minimize the free-riding effect. However, according to Reichenbach [16], three factors are needed to implement the unit-based waste disposal system successfully. First, the government should identify the source of pollution exactly. This information is necessary for adopting the unit-based waste disposal system, because the government cannot charge a waste charge if they do not know the emitter and the amount of the emission. Second, a precise technique of waste measurement is required. If the government cannot gauge waste pollution exactly, the degree of trust about the unit-based waste disposal system will decrease. Lastly, unit-based pricing should be implemented. That is, the waste charge charged should be proportional to the waste emitted.

3.2. Waste Charge in Waste Reduction

As we mentioned above, the unit-based waste disposal system is implemented to fulfill the “polluter pays principle” by using a market mechanism. Since market mechanisms and economic incentives are the core tools in the unit-based waste pricing system, the waste charge is the key policy instrument [17]. Many economists apprehend the unit-based waste charging policy as a Pigouvian tax that embedded economic incentive and market mechanism to reduce pollution [18]. If environmental damages such as food-waste pollution can be measured exactly, and if waste charge is charged in proportion to the amount of the emission, an economic-incentive instrument can control waste disposal behavior. However, several scholars have criticized the effect of an economic regulation in pollution reduction because it is almost impossible to have accurate information about total emissions, not just for policy makers but also for pollution emitters [19]. Additionally, although an optimal economic regulation should include administrative costs such as the cost of monitoring, time spent for completing forms, and the expense of resolving disputes effectively, those costs are not considered in most cases [20] because optical costs of monitoring and other administrative burdens are difficult to measure. For this reason, the rate for waste charges is usually determined politically, not economically [21]. To overcome these limitations, some alternatives have been proposed. Baiardi and Menegatti [22] suggest using an abatement policy, and Collinge and Oates [23] introduce the concept of trading emission permits and argue that rental emission permits can be a more effective solution for environmental regulation. The U.S. Environmental Protection Agency [24] determined five categories for economic-incentive instruments for environmental regulation: pollution charges, tradable permits, deposit-refund systems, reductions in market barriers, and government subsidy elimination. Keohane et al. [21] stressed the importance of changing the design of economic-incentive instruments. Harrington et al. [25] also warned that economic-incentive environmental regulation cannot be the one best solution and that more important would be how well the incentive policy is targeted and implemented and how well it influences human behavior.
In the literature that deals with the effect of waste charge, one of the typical economic-incentive instruments used in environmental regulation showed mixed results in waste reduction. Fullerton and Kinnaman [26], Miranda et al. [17] argued that the effect of waste charge on household behavior and reduction of municipal waste is clear while Slavik and Pavel [27] pointed out that the effect of waste charge and economic instruments must not be overrated because other factors except economic instrument affects household behavior a lot. Frey and Oberholzer-Gee [28] and Frey and Jegen [29] empirically showed that the effect of economic incentive instruments can be reduced in consequence of the crowding out effect. In addition, Slavik and Pavel [27] criticized the limitation of data previous studies used and irrelevance of methodology that cannot cover deficiency of limited data. Specifically, they argued that most of the previous studies using community level data could not include relevant community characteristics. What they recommend is adopting quasi-experimental data such as Difference-In-Difference to minimize the possibility of bias that scholars like Baltagi [30] warned continuously. Allers and Hoeben [31] implemented DID approach to draw effect of unit-based garbage pricing adopted in municipalities in Netherland. However, since they set municipality as unit of analysis, it is unable to trace and observe various behaviors generated from various housing types.
The main challenge that previous studies embedded lies on data collection. Most of the studies not only study the behavior of household but community could not solve data collection problem. Since tracing and measuring exact amount of household of community waste pollution was difficult to be close to impossible, researchers inevitably use small size of observation. In Williams et al. [32] in which waste pollution behavior of household in UK studied only deals with 61 families. Glanz [33] studied 21 households in Austria and the sample size of Fullerton and Kinnanman [26] was 75. In addition, although there are several studies that study the effect of unit-based pricing with large sample size such as Linderhof et al. [34], Usui [35], and Kinnanman and Fullerton [36] used self-report survey to collect waste pollution data. However, these survey data usually depend on incorrect memory of respondents or cannot escape from common method bias. Thus, the reliability of unit-based pricing and in previous studies embed some questionable biases from this point.

3.3. Individual Incentive and Waste Reduction

One of the most prevalent economic incentive policy instruments adopted by Korean government to reduce food waste is changing incentive design from group incentive to individual incentive. The sticker system, which most apartment complexes located in Seoul use, is implemented based on group incentive system. The total amount of waste fee charged to residents depends on total amount of waste polluted in apartment complex, not each household. The Ministry of Environment encouraged apartment complexes to adopt individual based incentive system where every household pays in proportion to their waste emission. To encourage household and residents to reduce waste pollution, several scholars argued the importance of additional policy instrument. Slavik and Pavel [27] suggest information and education campaign as a substitute instrument for economic incentive instrument. Lyndhurst [37] discussed the potential of incentive design to reduce waste pollution. Specifically, they argued that “carrots” and “sticks” should be used properly and in combination. One example they suggest is giving a prize to the household that showed superior performance in waste reduction. Batllevell and Hanf [15] stressed the importance of “fairness” in waste management policy. According to them, fairness in waste management includes “the equity of cost” or “the fact that everyone pays the same for a unit of waste”.
Then, how should we design an incentive system and ensure fairness in waste charging? More specifically, what is the scope of a polluter who owes a duty to pay waste charge? To what scope should the government charge a waste charge? Among apartment complex and individual household, who should be the basic unit of waste charging? Individual incentive has been the most well-known organizational strategy agreed upon by many scholars to increase the output and performance of an organization [38] because it successfully reduces free riding and social loafing [39]. If each individual in an organization can trust the fairness and accuracy of performance measure and that their performance is directly related to an individual bonus, the performance of an organization will increase [40]. However, the most important problem embedded in individual incentive is the difficulty of measuring individual performance due to budget and time limits. As Baker et al. [38] mentioned, individual trust in an organization can be damaged without relevant individual performance measures. Additionally, the design of individual incentives should be revised if there is no proper performance measuring and evaluating process. Chen et al. [41] also warns that individual incentives can be successfully implemented only in a society where meritocracy has already prevailed. In other words, according to Yang [42], in countries where the tradition of collectivism is strong, such as in South Korea, it is difficult to implement an individual incentive smoothly.

4. Research Design

4.1. Case Selection and Research Design

The data that we used to analyze the impact of the household-based RFID system were collected from Mapo-Gu, Seoul City. Similar to a county in the United States, a Gu is the smallest unit of local government in Seoul, South Korea. As seen in Figure 1, Seoul City has 25 Gus, and Mapo-Gu is right next to the Han river with an area of 23.84 Km2, close to the average of the 25 Gus. Not only is the size of the area very close to the average of Seoul City but also the population and total income. Among the 25 Gus in Seoul, Mapo is the only Gu where the RHWC and the CWC are implemented simultaneously. As we mentioned in the literature review, both the RHWC and the CWC adopt KG as a basic unit by which to gauge the total amount of food-waste pollution. However, the 24 Gus other than Mapo use a volume-based system using liter (L) as the basic unit of measure. When we compare the total amount of waste pollution measured by weight with those gauged by volume, bias will inevitably occur, since weight and volume are different units of measurement. Therefore, we chose Mapo-Gu for our study to minimize this potential bias.
In 2013, when Mapo-Gu first decided to adopt a unit-based food-waste system, Mapo chose the CWC for all the apartment complexes located in its boundaries. However, since January 2016, Mapo Gu has been trying to change the food waste charging system from the community-based CWC to the household-based RHWC. Among the 73 apartment complexes located in Mapo-Gu, 12 complexes right next to the World Cup stadium changed their food waste collection systems from the community-based CWC to the household-based RHWC in January 2016. The rest (61 apartment complexes) maintained the original incentive design.

4.2. Research Design for Difference-In-Difference Analysis

We implemented the DID (Difference-In-Difference) method to determine the effect of the RHWC while minimizing the effect of unobservable variables. As Branas et al. [43] mentioned, the DID method can be an effective way to determine the net effect of an experiment because researchers can control not only experiment-control difference but also pre-post experiment difference simultaneously. As we can see from Table 2, the regression equation implemented to run DID contains two dummy variables. Each indicates the experiment and control group, and before and after the introduction of the policy. The coefficient of first dummy variable indicates the effect of nested characteristics of the experiment group. Additionally, the coefficient of time variable represents the effect of the time trend after policy adoption. The interaction term of these two dummy variables is the net effect of the policy adoption. Specifically, the effect of RFID policy adoption on food waste can be obtained by calculating the difference between “difference between total amount of food waste after adoption of RFID and before adoption of RFID of experiment group” and “difference between total amount of food waste after adoption of RFID and before adoption of RFID of control group”.
To construct the control group most similar to the experiment group, we implemented Propensity Score Matching (PSM) method. The propensity score refers to the conditional probability that each unit of analysis participates in the experiment (or treatment) given observable variables of the unit [44]. The process of doing PSM in this study is as follows. First, we ran logistic regression analysis on 2081 apartment complexes located in Seoul city with a dummy that indicates whether each apartment complex adopts the RFID household-based measurement method as the dependent variable. Second, we calculated the propensity score of each apartment complex. Last, we matched the 12 experiment groups with the 12 control groups that have the closest propensity score. We also used 61 apartment complexes that maintained CWC in Mapo as non-matched control group to check the robustness and external validity of this study.
We used three sorts of control variables. The first control variable indicates the characteristics of an apartment complex, such as the price and number of households. Second, we adopted seasonal dummies to control the effect of seasonal change. As Mena et al. [45] wrote, since food waste is strongly affected by seasonal change and weather, we have to control the seasonal effect to scrutinize the net effect of adopting the RHWC.

4.3. Measurement

Variables are measured as follows (see Table 3). In order to analyze the effect of adopting the RHWC on the food-waste pollution of each apartment complex, we collected the total amount of food waste sent out from the apartment complex monthly and use its logged value as a dependent variable. Waste pollution data were collected from the Gu office, Pick-up Service and the KEC.
Since we adopted the DID method to determine the effect of policy adoption, there are four types of independent variables in the regression equation. Among those independent variables, three variables are related to the DID estimation. Specifically, the first independent variable is a dummy variable that indicates whether the observation belongs to the experiment group or not. If the observation belongs to experiment group, it is coded as 1, and, if it belongs to control group, it is coded as 0. The second independent variable is about the time before and after the policy adoption. Since this RHWC was adopted in January 2016; data prior to January 2016 are coded as 0 and data since January 2016 are coded as 1. The third independent variable is the most important. The third independent variable is the interaction term of first (group dummy) and second (time dummy) variable. In DID analysis, this interaction term represents the net effect of policy adoption. The fourth and last variable indicates the waste charge charged per kilogram.
Additionally, as we mentioned above, we introduced three types of control variables to control the effect of the characteristics of apartment complex and seasonality. For instance, Houtven and Morris [13] used income, race, age, number of household members, and those working full time as control variables in their waste study. Similarly, Reschovsky and Stone [14] adopted age, education, income, and number of family members in the household as control variables. In addition, Adhikari et al. [46] stress the strong effect of income on food waste. In terms of Korean case, Yi and Cho [47] used population density and property tax as control variables. Koivupuro et al. [48] reported that the size, type of household, and whether primary shopper is woman or not are significant. Williams et al. [32] focused on the size of the household and Morisaki [49] showed employment status, age, level of education are important. In this study, we used the average price of 1 m 2 of the apartment complex as a proxy variable for level of income because real estate is a general predictor that represents the level of income in Korea. Additionally, we adopted the total number of householders in each apartment complex, the mean age of residents and the mean number of household members in each apartment complex. To control for seasonality, we added seasonal dummies such as summer, fall, and winter because food waste is strongly affected by weather and season as Ngoc and Schnitzer [5] mentioned.
As we mentioned above, apartment complexes located in Mapo-Gu are the object of this study. Among 73 apartment complexes in Mapo-Gu, 12 apartment complexes changed the waste charging system from the community-based measurement method to the RFID household-based measurement method. We established these 12 apartment complexes as the experiment group. The 63 apartment complexes where the community-based measurement system has been used continuously are constructed as the non-matched control group. Among those 63 apartment complexes, we chose 12 apartment complexes through Propensity Score Matching to construct matched control group.
As can be seen from Table 2 above, we make the 38-month panel data from June 2013 to July 2016 one experiment group and two control groups. Since the RFID household-based measurement method was first adopted in January 2016, the experiment and control groups have 31-month panel data before the adoption of brand new RFID policy. Additionally, there is seven-month panel data after the adoption of household-based measurement method.

5. Empirical Analysis

5.1. Descriptive Statistics

5.1.1. Propensity Score

Table 4 shows the descriptive statistics of the propensity score. As we mentioned above, to determine the propensity score, first we run a logistic regression analysis and calculate the propensity score of adopting the RHWC of each apartment complex. The purpose of calculating the propensity score and matching groups based on this score is to make the probability of policy adoption similar by group. Thus, we can control the selection bias through matching process based on calculated propensity score. Then, we matched the experiment and control groups with the closest propensity score. Table 4 shows the descriptive statistics of the propensity score by group. As seen from this table, the mean of the propensity score of the experiment group is 0.062, and this score is very close to the matched control group, which is 0.063. Conversely, the non-matched control group has 0.090 as a mean score and 0.141 as a maximum score. This result shows that the propensity scores of the experiment and control groups become similar through the matching process.

5.1.2. Dependent and Explaining Variables

Below is the graph of the dependent variable (log value of total amount of food-waste pollution of apartment complex per month) of one experiment group and two control groups. The blue line represents the mean of the dependent variable of apartment complexes included in the experiment group of each month. As Figure 2 shows, the trend of food-waste pollution suddenly dropped after the 31st time period since the RHWC policy was adopted. Conversely, the trend of the red and green dotted lines, each representing the trend of the dependent variable of the matched control group and the non-matched control group, do not change much before or after the policy adoption. We can anticipate the effectiveness of the RHWC in reducing food waste from this descriptive statistic.
We can predict the effect of the RHWC using exact numerical values (see Table 5). The mean of the dependent variable of the experiment group before policy adoption is 9.33, and it decreased after policy adoption to 8.888. Unlike the experiment group, the two matched and non-matched controls show slight changes before and after the policy adoption. More specifically, the mean of the dependent variable of the matched control group appears as 8.985 before the RFID implementation and rather increased by 0.011 after the policy adoption. Similarly, in the non-matched control group case, the mean of the log of waste pollution increased after the RFID adoption even though it showed a slight change, rather than a reduction.

5.1.3. Control Variables

First, in terms of the waste charge, from June 2013 to October 2015, the waste charge was 90 Korean Won per kilogram, but it has increased since October 2015 to 100 Korean Won per kilogram. The RHWC was introduced after the waste charge was raised (see Figure 3).
Second, Table 6 shows the descriptive statistics of control variables by group. We can draw two implications from this result. The descriptive statistics of each variable do not change much before and after the policy adoption. The mean values of each control variable are similar no matter when the value is measured. This finding implies that during the research period, few changes occurred other than the policy adoption. Therefore, we can anticipate a minimized effect from omitted variables from this result.
In addition, the descriptive statistics of the experiment group are more similar to the matched control group. For example, in the case of the experiment group, the mean number of households before and after the policy adoption is 604.75. When we calculate the mean number of households for the non-matched control group, the measured value is 531.787 before and after the policy adoption. Conversely, the mean number of households in the apartment complex of the matched control group is measured as 604.667, which is very similar to the counterpart in the experiment group. This result shows the apartment characteristics of the experiment and control groups become similar through the matching process.

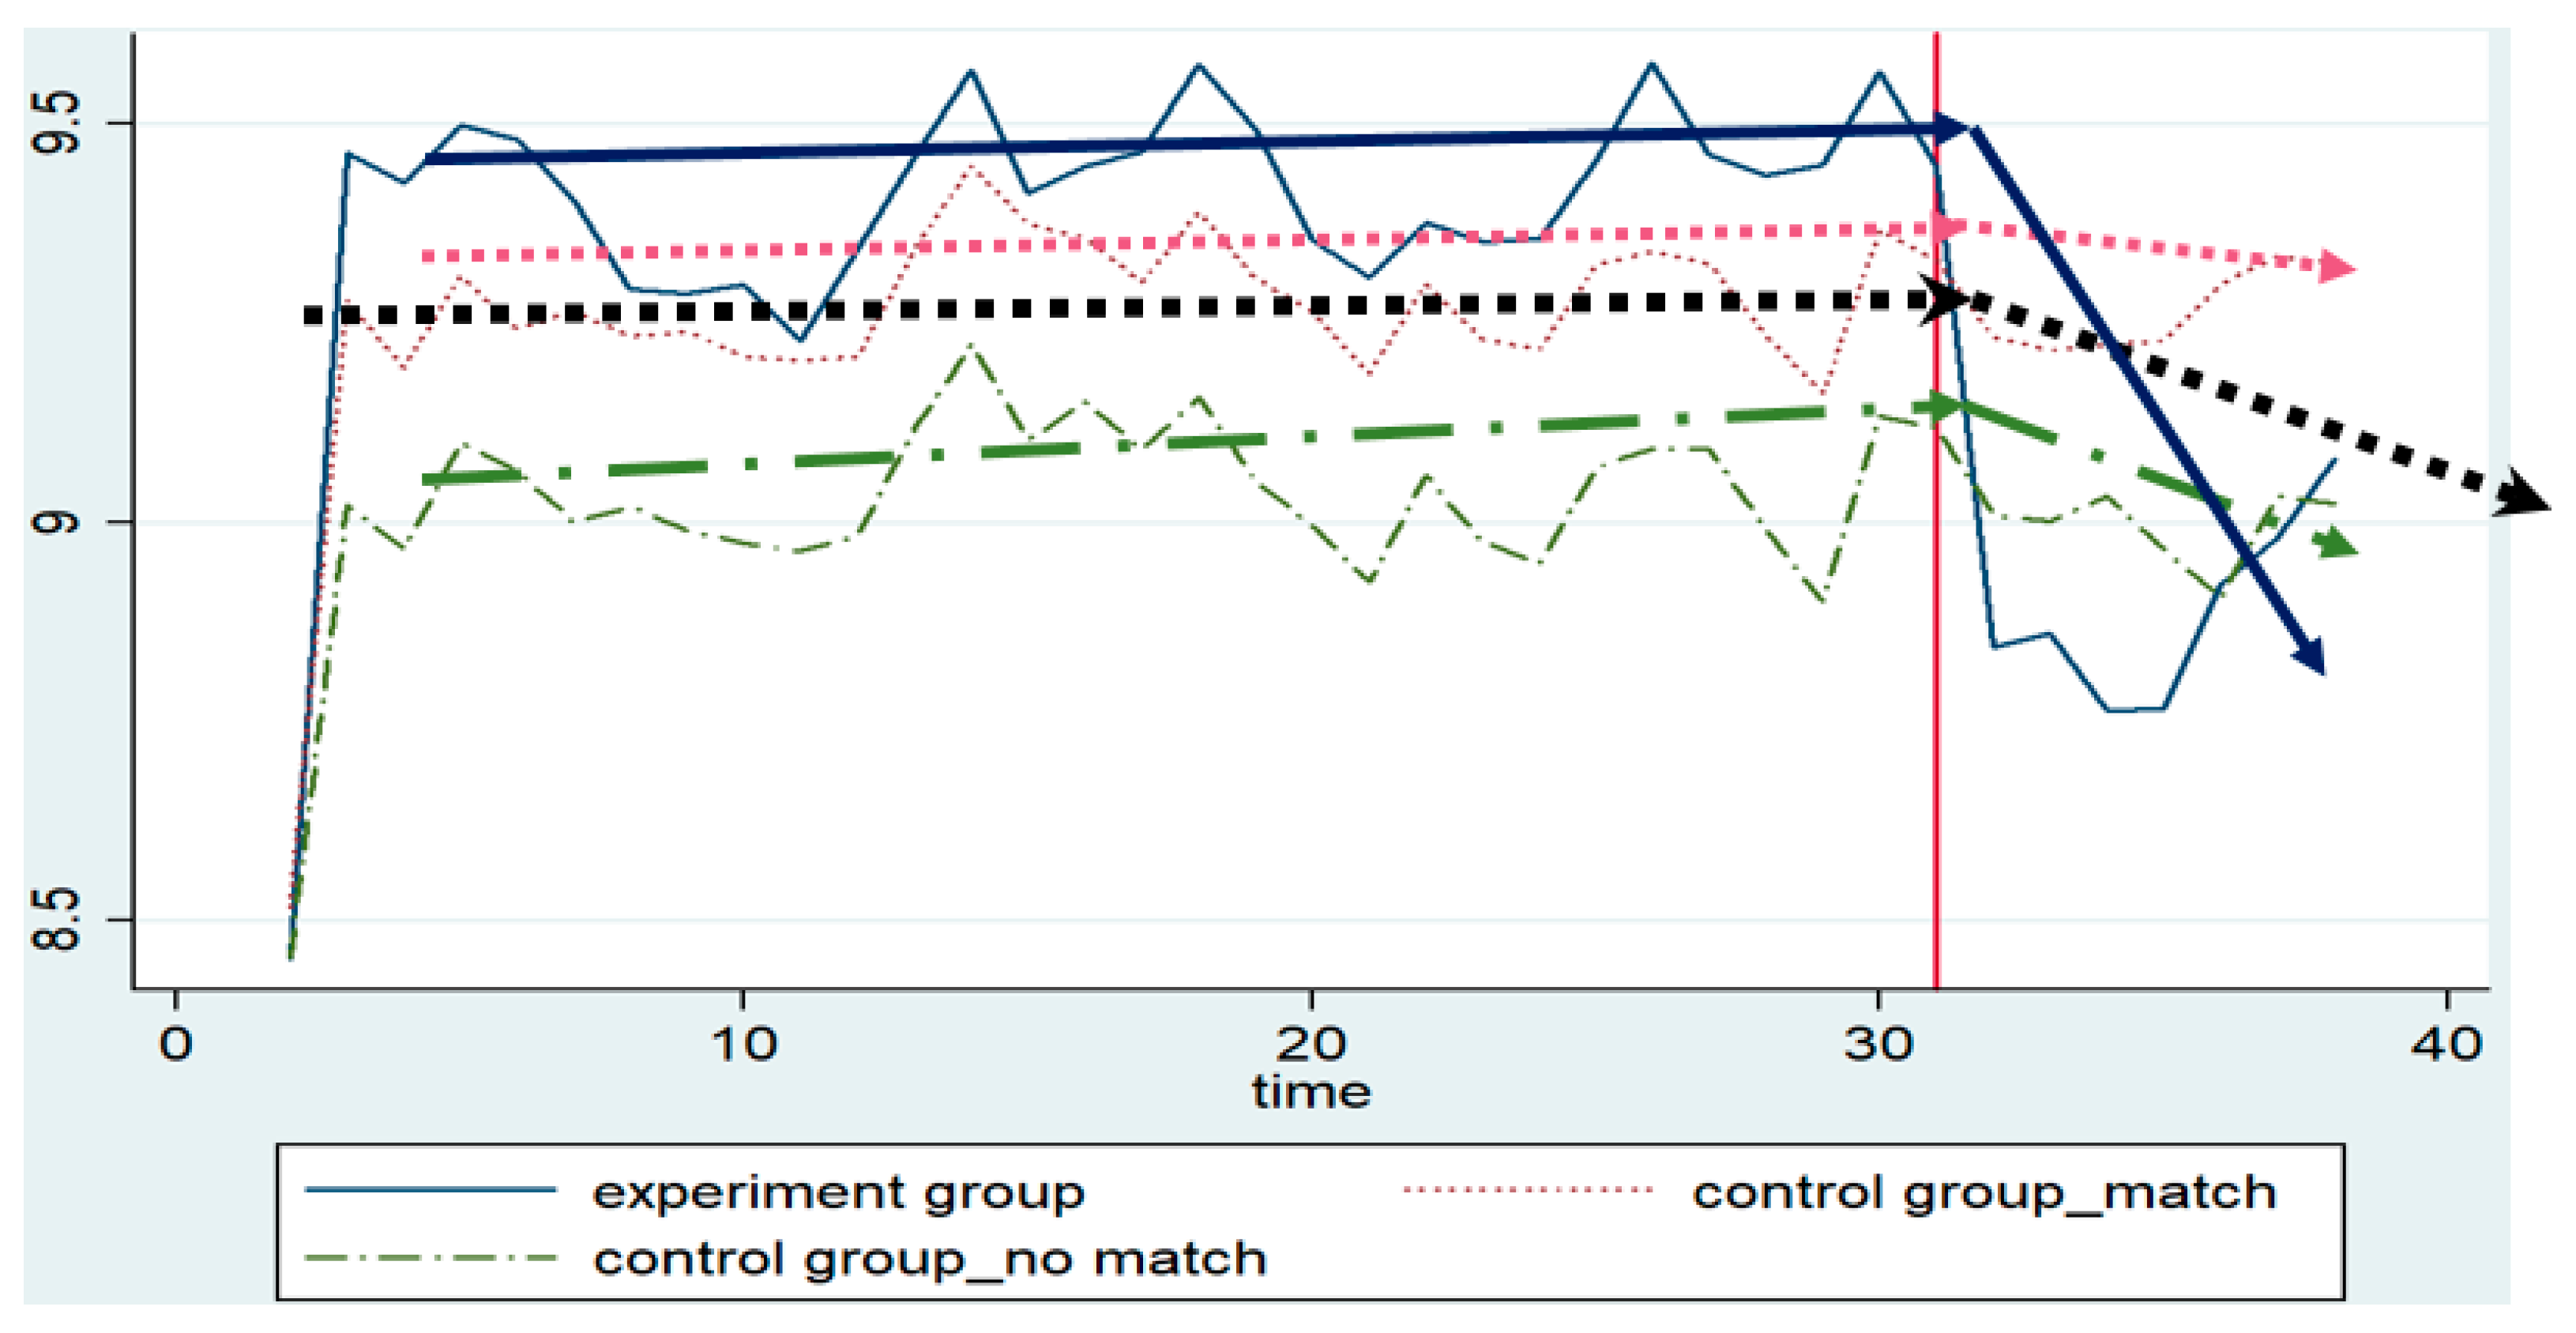
5.2. Difference in Difference Analysis

Table 7 shows the results of the DID analysis. Among six analytical models, <Model 1>, <Model 2> and <Model 3> use non-matched apartment complexes as the control group, unlike <Model 4>, <Model 5> and <Model 6> in which 12 matched apartment complexes are set as the control group. <Model 1> and <Model 4> contain only three types of independent variables (experiment group dummy, policy after dummy, interaction term of group and policy dummy). To compare the effects of the increased waste charge and the policy adoption, we added a waste charge variable to <Model 2> and <Model 5> and checked whether the significance of the interaction term variable changed. If the effect of the waste charge were larger than the household-based measurement method in waste reduction, the statistical significance of the interaction term of the experiment dummy and the policy adoption after dummy would perish. <Model 3> and <Model 6> include control variables that indicate the characteristics of each apartment complex, such as the number of households, the mean apartment complex price, the mean age of residents and the mean number of households. Additionally, we add seasonal dummies to control the effect of seasonality.
As can be seen from this table, the interaction term of the experiment group dummy and the policy after dummy, which represents the net effect of the RFID-based individual-based measurement method, is strongly significant in all six models, and its sign is negative. Specifically, the regression coefficients of interaction term are all strongly significant compare with both matched and non-matched control group, and with control variables and without control variables.
In addition, we compare the effect of the net effect of policy adoption and the increased waste charge. As we mentioned in the case background, in October 2015, the Mapo-Gu government increased the waste charge from KRW 90/kg to KRW 100/kg. Local governments who prefer waste charges as policy instruments for reducing food waste to implementing the RHWC argue that they can achieve policy goals just by increasing the waste charge. However, as we can see from <Model 2> and <Model 4>, the waste charge variable is significant in both model, but its sign is positive. That means, waste charge increases food waste pollution, rather decreases. Even when adding control variables in <Model 3> and <Model 6>, we found that the increased waste charge is not statistically significant. The results from six empirical models are the robust evidence of the impact of the RHWC on reducing food waste especially in comparison with the flat rate waste charge.
About control variables, unlike previous studies, the price of apartment, which is used as proxy variable to control income or financial richness is insignificant in all six models. The financial richness is one of the most important factors in innovation diffusion. However, since we only deal with Mapo-Gu’s apartment complex with similar characteristics, and one of two control groups are constructed through matching process to ensure similarities between experiment group and control group. This would be possible evidence to explain insignificance of apartment price.
Lastly, the R-squared is rather low in <Model 1> and <Model 4>, but the value is getting bigger as control variables are added to the hierarchical model. In <Model 3> and <Model 6>, where not only independent variables but also control variables include characteristics of apartment complex and seasonal dummies are included, adjusted R-square values are much higher. In <Model 3>, the adjusted R-square is 0.4812 and, in <Model 6>, the adjusted R-square is 0.5058. This change implies that the empirical model become relevant as more control variables are added.

6. Conclusions and Implications

6.1. Summary

This study illustrates the effect of the RHWC on reducing food waste. To scrutinize this effect, we adopt a DID analysis that can identify the net effect of policy adoption effectively using an experiment and a control groups. The experiment group in this analysis is 12 apartment complexes located in Mapo-Gu that switched their waste disposal systems from the CWC to the RHWC. We used two sorts of control groups: matched and non-matched. The non-matched control group is composed of 61 apartment complexes located in Mapo-Gu that implemented the CWC continuously. Additionally, from the non-matched control group, we chose 12 apartment complexes through the Propensity Score Matching method to comprise a matched control group with characteristics most similar to the experiment group. The finding from the PSM method also shows that the RFID household-based system is more effective in reducing food-waste pollution than the community-based measurement system. In addition, our empirical findings suggest that the RHWC based on individual payment is more effective to reduce food waste than the CWC based on community payment. These results are drawn robustly in various types of models where matched and non-matched apartment complexes are used as the control groups.

6.2. Implications and Further Research

We try to overcome several limitations of previous studies that mainly caused by limitation of data collection by using quasi-experimental DID methodology and monthly food waste pollution data collected by each apartment complex. By using relevant data on empirical analysis, we can draw some reliable results and implications about newly adopted economic incentive instruments, an individual incentive design. Specifically, we found that changing the incentive design can be the solution for reducing food waste. As is widely known, the individual incentive system is effective in reducing free riding and social loafing [50]. However, some scholars have a negative perspective about the individual incentive and argue that it is not a relevant solution for increasing organizational performance in a society where the collective culture is strong, such as in Korea, or where measuring objective performance is not easy, as in the public sector [39]. However, in this study, we show the effect of the individual incentive design is larger when compared to the group incentive in reducing pollution. In addition, this change from group incentive to individual incentive is stronger than traditional way of environmental regulation, a waste charge. In addition, we found that current level of waste charge is not effective in waste reduction. As Hoel [19] noted, waste charge is a cost-effective method among environmental policy instruments. However, as can be seen from the quasi-experimental result shown in this study, the waste charge did not work appropriately in reducing pollution. This result could be caused by a lack of information about how much the waste charge should be raised. According to Stavins [51], economic environmental regulation is hard to implement effectively in the real world because government officials cannot collect perfect information about the total amount of waste pollutions for an entire society. Formulating the relevant degree of an environmental regulation is difficult or impossible for this reason. According to the empirical result of this study, the food-waste charge in Seoul City appears to be ineffective, or at least not well appropriated.
This analysis also provides several policy implications. First, we suggest a new way of food waste reduction through this study. According to many scholars, such as Bai and Sutanto [52], source reduction is the most effective method in waste minimization. Especially, we try to show brand new way of waste reduction method (i.e., RFID based food waste charge system) that can be adopted especially in apartment complex. Although most of the people reside in apartment complex in this urbanized era, and in most of the developing countries located in East Asia this housing trend is severe due to narrow country area, food waste reduction in apartment complex did not get enough attention from scholars. We expect that this study can give practical implication to not only urbanized developed countries but also to developing countries that face rapid urbanization now in this sense. Second, we show a new way of implementing technology to increase the effectiveness of an existing government policy. Before the invention of RFID technology, exact data about food waste could not be collected because it was hard to trace and measure the amount of waste emitted. However, with the evolution of RFID technology, measuring and tracing the amount emitted by each household, which is important data for driving the individual incentive system, is possible these days. The RFID-based food-waste system in Korea would be the relevant case to shows how innovative new technology can support existing policy by changing the mechanism and design of policy implementation. For instance, Levis et al. [53], who studied food waste treatment in United States and Canada, also stressed the role of economic based method and technology in waste reduction. Third, we would like to suggest an empirical evidence to governments because appropriate waste management can be realized through cooperative governance and public policy. The importance of relevant public policy implemented by government has been agreed from various scholars. Ngoc and Schnitzer [5] described sound waste management as the “first method approaching sustainable waste management” and also mentioned that waste management have to be regulated by public policy. Thi et al. [54] also stressed the role of public policy and indicates limited regulation by government as the main problem. In addition, as Corsten et al. [55], Abdul [56] and Liu [8], who studied environmental regulation policy in China, Malaysia, and Brazil stressed, government’s role in environmental regulation is limited yet. Like this, although the importance of government’s role has been argued historically, local governments does not seem to know what to do and how to join to each other. South Korea shows a conflict between the Ministry of Environment and the local government (Gu) around the RFID-adoption issue. Unlike the Ministry of Environment, who constantly argues the positive effect of the RFID-based household incentive system, the local government sticks to the traditional method of reducing waste, raising waste charge. However, according to the result of this study, changing the incentive design is more effective in reducing food waste than raising the waste charge.
Our case study only addresses apartment complexes located in Mapo-Gu, one of 25 local governments in Seoul City, so it might be difficult to generalize from the empirical results found here. Additionally, the time span for the data is a little bit short because we have only seven months of waste data after the adoption of the policy. Since the effect of the policy implementation change can be temporary, the behaviors of the policy beneficiaries should be monitored from a macro trend over time. Future studies should collect data with a longer temporal and a wider spatial range to solve these limitations. In addition, as Gustavsson et al. [57] reported, waste pollution from production to retailing is larger than waste from consumer in most of the countries. Since we only collect data from consumers, apartment residents, our result would be not enough to suggest solution for the whole society. Besides, as Palatnik et al. [58] reported, the waste emission behavior varies depend on region and the type of waste. We analyze the effect of RFID based system on food waste in the background of urban area in this study, but it necessary to diversify viewpoints in future researches. By extension, although we only care about the quantity of food waste emission in this study, future research needs to focus more on total amount of recycling. Previous studies such as Palatnik et al. [58] already analyzed how households’ willingness to pay (WTP) might affect recycling services. Future research is required to analyze how various types of unit-based pricing system can affect recycling behavior.
Lastly, the extent of waste tax increase is not large because the waste charge was increased from 90 Korean Won per Kilogram to 100 Korean Won per Kilogram. Therefore, it is not enough to analyze the effect of waste charges on reducing waste. However, this can be other evidence to draw the ineffectiveness of the current waste disposal charge system at least in the Korean context. In addition, although newly adopted RFID system may reduce food waste, it can be another cause of illegal waste dumping. In fact, several managers from apartment complex management offices, who we have interviewed, reported that the number of illegal dumping cases increased after the RFID adoption because the residents’ feels the newly adopted system is more inconvenient than the previous method. For this reason, it is crucial for future researchers to conduct studies on measures to reduce illegal waste dumping and to convince the citizens to get use to the new system.

Acknowledgments

This research is a revised version of one part of Sabinne Lee’s Ph.D. dissertation paper.

Author Contributions

Sabinne Lee and Kwangho Jung conceived this research idea and designed a natural experimental scheme derived from geographical variations of RFID based food waste system in Seoul. Sabinne Lee wrote literature review, empirical findings, and policy implications. Kwangho Jung wrote introduction, methodological section, and policy implications. Both Sabinne Lee and Kwangho Jung reviewed statistical results and conclusions.

Conflicts of Interest

The authors declare no conflict of interest.

References

  1. Manaf, L.A.; Samah, M.A.A.; Zukki, N.I.M. Municipal solid waste management in Malaysia: Practices and challenges. Waste Manag. 2009, 29, 2902–2906. [Google Scholar] [CrossRef] [PubMed]
  2. Nahman, A.; De Lange, W.; Oelofse, S.; Godfrey, L. The costs of household food waste in South Africa. Waste Manag. 2012, 32, 2147–2153. [Google Scholar] [CrossRef] [PubMed]
  3. Hartmann, H.; Ahring, B.K. Strategies for the anaerobic digestion of the organic fraction of municipal solid waste: an overview. Water Sci. Technol. 2006, 53, 7–22. [Google Scholar] [CrossRef] [PubMed]
  4. Lundqvist, J.; de Fraiture, C.; Molden, D. Saving Water: From Field to Fork: Curbing Losses and Wastage in the Food Chain; Stockholm International Water Institute: Stockholm, Sweden, 2008. [Google Scholar]
  5. Ngoc, U.N.; Schnitzer, H. Sustainable solutions for solid waste management in Southeast Asian countries. Waste Manag. 2009, 29, 1982–1995. [Google Scholar] [CrossRef] [PubMed]
  6. Jung, K.; Lee, S. A systematic review of RFID applications and diffusion: Key areas and public policy issues. J. Open Innov. Technol. Market Complex. 2015, 1, 9. [Google Scholar] [CrossRef]
  7. Lee, S.; Jung, K. A meta-analysis of determinants of RFID adoption around the world: Organization, technology, and public policy. Asia Pac. J. Innov. Entrepreneurship 2016, 10, 67–90. [Google Scholar]
  8. Liu, G. Food Losses and Food Waste in China. OECD Food Agric. Fish. Pap. 2014. [Google Scholar] [CrossRef]
  9. Meyer, B.D. Natural and quasi-experiments in economics. J. Bus. Econ. Stat. 1995, 13, 151–161. [Google Scholar]
  10. Angrist, J.; Krueger, A.B. Instrumental variables and the search for identification: From supply and demand to natural experiments. J. Econ. Perspect. 2001, 15, 69–85. [Google Scholar] [CrossRef]
  11. Money Today. Available online: http://news.mt.co.kr/mtview.php?no=2016060111054872667 (accessed on 20 March 2017).
  12. Hopper, J.R.; Yaws, C.L.; Ho, T.C.; Vichailak, M. Waste minimization by process modification. Waste Manag. 1993, 13, 3–14. [Google Scholar] [CrossRef]
  13. Van Houtven, G.L.; Morris, G.E. Household behavior under alternative pay-as-you-throw systems for solid waste disposal. Land Econ. 1999, 75, 515–537. [Google Scholar] [CrossRef]
  14. Reschovsky, J.D.; Stone, S.E. Market incentives to encourage household waste recycling: Paying for what you throw away. J. Policy Anal. Manag. 1994, 13, 120–139. [Google Scholar] [CrossRef]
  15. Batllevell, M.; Hanf, K. The fairness of PAYT systems: Some guidelines for decision-makers. Waste Manag. 2008, 28, 2793–2800. [Google Scholar] [CrossRef] [PubMed]
  16. Reichenbach, J. Status and prospects of pay-as-you-throw in Europe—A review of pilot research and implementation studies. Waste Manag. 2008, 28, 2809–2814. [Google Scholar] [CrossRef] [PubMed]
  17. Miranda, M.L.; Everett, J.W.; Blume, D.; Roy, B.A. Market-based incentives and residential municipal solid waste. J. Policy Anal. Manag. 1994, 13, 681–698. [Google Scholar] [CrossRef]
  18. Rosen, H.S. Public finance. In The Encyclopedia of Public Choice; Kluwer Academic Publishers: Dordrecht, The Netherlands, 2005. [Google Scholar]
  19. Hoel, M. Waste chargees versus other environmental policies. Scand. J. Econ. 1998, 100, 79–104. [Google Scholar] [CrossRef]
  20. Polinsky, A.M.; Shavell, S. Pigouvian taxation with administrative costs. J. Public Econ. 1982, 19, 385–394. [Google Scholar] [CrossRef]
  21. Keohane, N.O.; Revesz, R.L.; Stavins, R.N. The Positive Political Economy of Instrument Choice in Environmental Policy; Resources for the Future: Washington, DC, USA, 1997. [Google Scholar]
  22. Baiardi, D.; Menegatti, M. Pigouvian tax, abatement policies and uncertainty on the environment. J. Econ. 2011, 103, 221–251. [Google Scholar] [CrossRef]
  23. Collinge, R.A.; Oates, W.E. Efficiency in pollution control in the short and long runs: A system of rental emission permits. Can. J. Econ. Rev. Can. Econ. 1982, 15, 346–354. [Google Scholar] [CrossRef]
  24. U.S. Environmental Protection Agency. Economic Incentives: Options for Environmental Protection; Office of Policy, Planning, and Evaluation: Washington, DC, USA, 1991.
  25. Harrington, W. Enforcement leverage when penalties are restricted. J. Public Econ. 1988, 37, 29–53. [Google Scholar] [CrossRef]
  26. Fullerton, D.; Kinnaman, T.C. Household responses to pricing garbage by the bag. Am. Econ. Rev. 1996, 86, 971–984. [Google Scholar]
  27. Slavik, J.; Pavel, J. Do the variable charges really increase the effectiveness and economy of waste management? A case study of the Czech Republic. Resour. Conservat. Recycl. 2013, 70, 68–77. [Google Scholar] [CrossRef]
  28. Frey, B.S.; Oberholzer-Gee, F. The cost of price incentives: An empirical analysis of motivation crowding-out. Am. Econ. Rev. 1997, 87, 746–755. [Google Scholar]
  29. Frey, B.S.; Jegen, R. Motivation crowding theory. J. Econ. Surv. 2001, 15, 589–611. [Google Scholar] [CrossRef]
  30. Baltagi, B. Econometric Analysis of Panel Data; John Wiley & Sons: Hoboken, NJ, USA, 2005. [Google Scholar]
  31. Allers, M.A.; Hoeben, C. Effects of unit-based garbage pricing: A differences-in-differences approach. Environ. Resour. Econ. 2010, 45, 405–428. [Google Scholar] [CrossRef]
  32. Willams, H.; Wikström, F.; Otterbring, T.; Löfgren, M.; Gustafsson, A. Reasons for household food waste with special attention to packaging. J. Clean. Prod. 2012, 24, 141–148. [Google Scholar] [CrossRef] [Green Version]
  33. Glanz, R. Causes of Food Waste Generation in Households: An Empirical Analysis; University of Natural Resources and Applied Life Sciences: Vienna, Austria, 2008. [Google Scholar]
  34. Linderhof, V.; Kooreman, P.; Allers, M.; Wiersma, D. Weight-based pricing in the collection of household waste: The Oostzaan case. Resour. Energy Econ. 2001, 23, 359–371. [Google Scholar] [CrossRef]
  35. Usui, T. Estimating the effect of unit-based pricing in the presence of sample selection bias under Japanese recycling law. Ecol. Econ. 2008, 66, 282–288. [Google Scholar] [CrossRef]
  36. Kinnaman, T.C.; Fullerton, D. Garbage and recycling with endogenous local policy. J. Urban Econ. 2000, 48, 419–442. [Google Scholar] [CrossRef]
  37. Lyndhurst, B. Enhancing participation in kitchen waste collections. In Defra Waste & Resources Evidence Programme (WR0209); Resource Recovery Forum: North Yorkshire, UK, 2009. [Google Scholar]
  38. Baker, G.; Gibbons, R.; Murphy, K.J. Subjective performance measures in optimal incentive contracts. Q. J. Econ. 1994, 109, 1125–1156. [Google Scholar] [CrossRef]
  39. Burgess, S.; Ratto, M. The role of incentives in the public sector: Issues and evidence. Oxf. Rev. Econ. Policy 2003, 19, 285–300. [Google Scholar] [CrossRef]
  40. Podgursky, M.J.; Springer, M.G. Teacher performance pay: A review. J. Policy Anal. Manag. 2007, 26, 909–949. [Google Scholar] [CrossRef]
  41. Chen, C.C.; Chen, X.P.; Meindl, J.R. How can cooperation be fostered? The cultural effects of individualism-collectivism. Acad. Manag. Rev. 1998, 23, 285–304. [Google Scholar]
  42. Yang, D. Influence of Group-based Pay on Jon Performance. Ewha Manag. Rev. 2004, 15, 183–195. [Google Scholar]
  43. Branas, C.C.; Cheney, R.A.; MacDonald, J.M.; Tam, V.W.; Jackson, T.D.; Ten Have, T.R. A Difference-In-Differences analysis of health, safety, and greening vacant urban space. Am. J. Epidemiol. 2011, 174, 1296–1306. [Google Scholar] [CrossRef] [PubMed]
  44. Rosenbaum, P.R.; Rubin, D.B. The central role of the propensity score in observational studies for causal effects. Biometrika 1983, 70, 41–55. [Google Scholar] [CrossRef]
  45. Mena, C.; Adenso-Diaz, B.; Yurt, O. The causes of food waste in the supplier-retailer interface: Evidences from the UK and Spain. Resour. Conversat. Recycl. 2011, 55, 648–658. [Google Scholar] [CrossRef]
  46. Adhikari, B.K.; Barrington, S.; Martinez, J.; King, S. Characterization of food waste and bulking agents for composting. Waste Manag. 2008, 28, 795–804. [Google Scholar] [CrossRef] [PubMed]
  47. Yi, M.; Cho, J.T. An Empirical Analysis on the Effects of Food waste Unit Pricing System: Focused on Local Governments. Korean J. Policy Anal. Eval. 2013, 23, 233–256. [Google Scholar]
  48. Koivupuro, H.-K.; Hartikainen, H.; Silvennoinen, K.; Katajajuuri, J.-M.; Heikintalo, N.; Reinikainen, A.; Jalkanen, L. Influence of socio-demographical, behavioural and attitudinal factors on the amount of avoidable food waste generated in Finnish households. Int. J. Consum. Stud. 2012, 36, 183–191. [Google Scholar] [CrossRef]
  49. Morisaki, I. Pattern of Food Losses in Households: A Case Study in Oita-Prefecture, Japan; Ritsumeikan Asia Pacific University: Oita Prefecture, Japan, 2011. [Google Scholar]
  50. Holmstrom, B. Moral hazard in teams. Bell J. Econ. 1982, 13, 324–340. [Google Scholar] [CrossRef]
  51. Stavins, R.N. Economic Incentives for Environmental Regulation; John, F., Ed.; Harvard University: Cambridge, MA, USA, 1997. [Google Scholar]
  52. Bai, R.; Sutanto, M. The practice and challenges of solid waste management in Singapore. Waste Manag. 2002, 22, 557–567. [Google Scholar] [CrossRef]
  53. Levis, J.W.; Barlaz, M.A.; Themelis, N.J.; Ulloa, P. Assessment of the state of food waste treatment in the United States and Canada. Waste Manag. 2010, 30, 1486–1494. [Google Scholar] [CrossRef] [PubMed]
  54. Thi, N.B.D.; Kumar, G.; Lin, C.Y. An overview of food waste management in developing countries: Current status and future perspective. J. Environ. Manag. 2015, 157, 220–229. [Google Scholar] [CrossRef] [PubMed]
  55. Corsten, M.A.M.; Worrell, E.; Van, D.J.C.M. The Potential for Waste Management in Brazil to Minimize GHG Emissions and Maximize Re-Use of Materials; Ministry of Infrastructure and the Environment: Arnhem, The Netherlands, 2012.
  56. Abdul Jalil, M. Sustainable development in Malaysia: A case study on household waste management. J. Sustain. Dev. 2010, 3, 91–102. [Google Scholar]
  57. Gustavsson, J.; Cederberg, C.; Sonesson, U.; Van Otterdijk, R.; Meybeck, A. Global Food Losses and Food Waste; FAO: Rome, Italy, 2011. [Google Scholar]
  58. Palatnik, R.; Brody, S.; Ayalon, O.; Shechter, M. Greening Household Behavior and Waste; OECD Environment Working Papers; University of Haifa: Haifa, Israel, 2014; p. 76. [Google Scholar]
Figure 1. Case Selection.
Sustainability 09 02046 g001
Figure 2. Trend of food waste pollution of experiment and control groups. Note: ‘Control group_match’ indicates control group generated by PSM technique.
Sustainability 09 02046 g002
Figure 3. Waste charge.
Sustainability 09 02046 g003
Table 1. Unit-based food waste charging systems in Seoul.
StickerPlastic BagRFID Household-Based Waste Charging System (RHWC)Community-Based Waste Charging System (CWC)
Standard of measureVolumeVolumeWeightWeight
Fee imposedCommunityHouseholdHouseholdCommunity
Degree of feeVaries by Gu, but cheaper than the RHWC systemKRW 75~100/kg
Note: Gu is an autonomous district of municipal level within metropolitan cities in South Korea.
Table 2. Research Design for Difference-In-Difference Analysis.
CategoryEmpirical Model
Regression Model Y i = α + β 1 T r e a t i + β 2 A f t e r i + β 3 [ T r e a t i A f t e r i ] + β 4 k X k + ϵ i
α : interecept,
β 1 : effect of nested characteristics of the experiment group (experiment group = 1, control group = 0),
β 2 : effect of time trend after policy adoption (after = 1, before = 0),
β 3 : net effect of policy adoption,
β 4 k : control variables,
ϵ : error term
VariablesDefinitions
Dependent VariableY: Natural Logarithm of total amount of apartment complex’s food waste per month
Explaining VariablesTreat: Dummy variable indicates whether RHWC is adopted or not
After: Dummy variable indicates whether time is before or after the RHWC adoption
Treat*After: Interaction term between Treat and After dummy variables
Control VariablesWaste charge fee
Apartment complex characteristics
Seasonal dummies
Research Design for DID analysisGroupBefore RHWC adoptionAfter HWC adoption
Treatment Group (n = 456)T1 (12 apartment complexes, 31-month panel data, n = 372)T2 (12 apartment complexes, 7-month panel data, n = 84)
Control Group (n = 2318)C1 (61 apartment complexes, 31-month panel data, n = 1891)C2 (61 apartment complexes, 7-month panel data, n = 427)
Control Group PSM (n = 456) C 3 (12 apartment complexes, 31-month panel data generated by PSM method, n = 372) C 4 (12 apartment complexes, 7-month panel data generated by PSM method, n = 84)
Effect of RHWC policy on the amount of food waste disposal
= (Difference in the amount of food waste disposal between after and before adoption of RHWC in treatment group) − (Difference in the amount of food waste disposal between after and before adoption of RHWC in control group)
= (T2 − T1) − (C2 − C1) [or (T2 − T1) − (C4 − C3)]
Table 3. Variable Measurement.
Type of VariableVariable NameDefinitionTypeSource
Dependent variableYNatural logarithm of total amount of food waste sent out from apartment complex per month (Kg)NumericGu office, Pick-up Service
Korean Environmental Cooperation
Key Explaining VariablesTreatTreatment group = 1; control group = 0CategoricalGu office
AfterAfter RHWC adoption = 1, before RHWC adoption = 0CategoricalGu office
Treat*AfterTreatment group after RHWC adoption = 1; the others = 0CategoricalGu office
Waste chargeFood waste price per kilogram[KRW]NumericGu Office
Control VariablesApt_priceMean price of apartment complex per m 2 NumericMinistry of Land, Infrastructure & Transportation
N_householdNumber of households in apartmentNumericKorean Appraisal Board
Mean_ageMean age of residentsNumericSeoul Metropolitan Government
Mean_memberMean number of members in householdNumericSeoul Metropolitan Government
SummerSummer = 1; other seasons = 0CategoricalKorean Meteorological Administration Agency
FallFall = 1; other seasons = 0Categorical
WinterWinter = 1; other seasons = 0Categorical
Table 4. Propensity Score of Treatment and Control groups.
GroupNMeanStandard DeviationMinimumMaximum
Treatment group4560.0620.02900.13
Control group23180.0900.02900.14
Control group_PSM4560.0630.02900.13
Table 5. Mean of the amount of food waste disposal between treatment and control groups.
VariableGroupRHWCnMeanS.D.MinimumMaximum
Y (Natural Logarithm)Experiment groupBefore3529.3300.7085.21810.544
After848.8880.5497.4829.690
Control groupBefore18718.9850.8224.82811.447
After4278.9960.7177.17711.195
Control group_PSMBefore3709.2160.7445.18710.687
After849.2650.5937.99210.507
Table 6. Descriptive Statistics of control variables.
VariableGroupRHWC AdoptionNMeanS.D.Min.Max.
N_householdTreatment groupBefore372604.750248.941841036
After84604.750250.091841036
Control groupBefore1891531.790523.531603710
After427531.787524.001603710
Control group_PSMBefore372604.667400.332191807
After84604.667402.202191807
Mean_ageTreatment groupBefore37237.3670.59737.138.7
After8437.3670.59937.138.7
Control groupBefore189140.3101.14437.142.2
After42740.3301.14537.142.2
Control group_PSMBefore37240.3171.23438.742.2
After8440.3171.23938.742.2
Mean_memberTreatment groupBefore3722.9700.2462.423.08
After842.9700.2472.423.08
Control groupBefore18912.6210.1851.823.08
After4272.6210.1851.823.08
Control group_PSMBefore3722.5850.1152.412.88
After842.5850.1162.412.88
Apt_priceTreatment groupBefore372779.87691.954526.316901.961
After77779.87692.421526.316901.961
Control groupBefore1829657.259104.255467.174961.359
After427657.259104.353467.174961.359
Control group_PSMBefore341768.243100.381499.545883.539
After77768.243100.891499.545883.539
Table 7. Difference in Difference analysis.
Independent VariablesControl GroupControl Group_PSM
Model 1Model 2Model 3Model 4Model 5Model 6
Coefficient (SE)Coefficient (SE)Coefficient (SE)Coefficient (SE)Coefficient (SE)Coefficient (SE)
β3 (RHWC Impact) (Treat*After)−0.456 *** (0.063)−0.457 *** (0.063)−0.460 *** (0.057)−0.495 *** (0.078)−0.495 *** (0.078)−0.507 *** (0.079)
β1 (Treat)0.349 * (0.199)0.349 * (0.199)−0.224 (0.191)0.118 (0.220)0.118 (0.220)0.321 ** (0.177)
β2 (After)0.013 (0.026)−0.069 * (0.040)0.030 (0.038)0.052 (0.055)−0.062 (0.075)0.060 (0.082)
Waste charge0.009 ** (0.003)0.002 (0.003)0.013 *** (0.006)0.004 (0.006)
N_household0.002 *** (0.0001)0.002 *** (0.0001)
Apt_price0.0001 (0.0001)−0.001 (0.0001)
Mean_age−0.087 *** (0.043)0.109 ** (0.059)
Mean_member0.630 *** (0.249)0.187 (0.268)
Summer−0.070 *** (0.023)−0.075 ** (0.043)
Fall0.106 *** (0.025)0.118 *** (0.048)
Winter0.038 (0.024)0.036 (0.043)
Intercept8.985 *** (0.018)8.147 *** (0.318)9.845 *** (2.092)9.213 *** (0.063)8.060 *** (0.535)3.258 *** (2.819)
N275427542641910910834
Adj R20.02180.02240.48120.02680.02800.5058
Notes: SE = Standard error; * = p < 0.10, ** = p < 0.05, *** = p < 0.01.

