Environmental Innovation and Employment: Drivers and Synergies

Facultad de Ciencias Económicas y Empresariales, Plaza de la Universidad 1, University of Castilla-La Mancha, 02071 Albacete, Spain
*
Author to whom correspondence should be addressed.
Sustainability 2017, 9(11), 2057; https://0-doi-org.brum.beds.ac.uk/10.3390/su9112057
Submission received: 28 August 2017
/
Revised: 21 October 2017
/
Accepted: 6 November 2017
/
Published: 9 November 2017
(This article belongs to the Section Economic and Business Aspects of Sustainability)
Abstract
:Numerous empirical studies focus on the drivers of environmental innovation or their potential employment effects. Nevertheless, we have scarce knowledge about whether factors that influence eco-innovation and employment generation are related. The main purpose is to analyze the synergies between eco-innovation and employment using a sample of more than 6000 innovative Spanish manufacturing and service firms. Using different econometric procedures, the main findings show that size, R&D and export influence eco-innovation and employment in the same direction, while age, belonging to a group, public subsidies and internal and external knowledge sources exert a different effect. Thus, older firms create less employment but have a high probability of being environmental innovators compared with younger firms. Furthermore, the size of the company moderates the positive role of eco-innovation on employment growth, while young firms not belonging to a group (eco-entrepreneurs) contribute more to employment growth than old firms belonging to a parent firm. Implications for scholars, managers and policy makers in terms of sustainable and economic growth are made.
1. Introduction
In recent decades, scientific evidence for climate change due to warming of the climate system and negative effects of pollution has been unequivocally confirmed. In this regard, diverse policy instruments and environmental regulation have been introduced at the institutional level to mitigate the environmental damage of production. Thus, firms introduce environmental innovations to comply with environmental regulation. However, there are other economic motives for introducing environmental innovation apart from regulatory response, such as cost savings or environmental awareness. In this sense, the introduction of end-of pipe technologies and/or cleaner technologies contribute to pollution emissions abatement and/or decrease their resource and energy use [1]. Cleaner production is driven by market forces and organizational changes, while end-of-pipe adoption depends more on regulatory fulfillment. The implementation of any of these types of technologies is considered an environmental innovation. At the same time, a huge percentage of the population is unemployed in developing and developed economies. In this context, innovation is a key strategy for enhancing the generation of employment because of firms’ sales growth and competitiveness achieved by technological change. Abundant scholarly work has focused on the factors that explain the adoption of environmental innovations by the firm in recent years. However, academics know much less about the potential complementarities between environmental innovation and employment in terms of economic and firms’ behavior. In this regard, numerous works focus on the drivers of environmental innovation [2,3,4,5,6], but empirical research about the relationship between environmental innovation and employment is still relatively scarce [7,8,9,10,11,12].
Even though the analysis of influence of eco-innovation on performance still faces relevant theoretical and empirical limitations [13], the current available statistical information allows achieving more insights on drivers and synergies between eco-innovation and employment growth. In this sense, a better characterization of eco-innovative firms enables gathering better knowledge on the factors jointly influencing environmental sustainable innovation and employment growth. The present paper aims to lessen this gap. Specifically, our main research contribution is to study the similarities and differences among the drivers of eco-innovation and employment at firm level.
The analysis focuses on a large sample of Spanish firms using CIS data for the period 2009–2011. The contribution of the paper to the extant literature is threefold. First, this paper tries to know whether the drivers of environmental innovation are similar to the factors that influence employment in Spanish manufacturing and service firms. Second, we consider the firm’s decision to eco-innovate and then pay attention to the effect on firm employment controlling for environmental performance. Hence, the aim is to answer whether factors that influence eco-innovation and employment are related. Since firms’ decisions on the adoption of environmental innovation and employment depend on firm resources and technological capabilities, we take into account firm unobserved heterogeneity. In contrast to previous studies, attention is placed on the synergies between eco-innovation and employment generation instead of the influence of adopting environmental innovation on employment. As far as we know, no studies have gone deeply into this question. Finally, this study attempts to fill the gap in the literature about the differences between large, and small and medium firms.
The structure of the paper is as follows. In Section 2, previous empirical research about the drivers of eco-innovation and employment are considered. Afterwards, a conceptual framework is proposed. Section 3 describes the used dataset, variables and methods used. Section 4 presents the main results. Finally, Section 5 offers some observations and concludes.
2. Literature Review: Looking Inside Drivers of Eco-Innovation and Employment Growth
2.1. Drivers of Eco-Innovation
Environmental innovation (also called eco-innovation, green innovation or ecological innovation in other previous studies) is defined as an innovation, a new or modified process, practice, system or product, which benefits the environment and contributes to environmental sustainability and development [3,14]. As a response to environmental awareness, companies face environmentally responsible innovative activities. Harabi [7] enumerates several reasons to eco-innovate: fulfillment of environmental regulations; securing of existing markets or increasing market share; costs savings; improvement of the firm’s image and reputation; and firm response to competitor innovation.
The adoption of environmental technologies depends on the firms’ resources and knowledge. Within the resources of the firm, size is considered a main driver of eco-innovation. Most studies confirm a positive influence of size on environmental innovation [15,16,17,18]. In this regard, extra-financial resources needed for environmental innovation are also a sufficient reason to suppose that large firms have a higher probability of eco-innovating than small firms. This is because large firms are more prone to take risks than SMEs (Small and Medium enterprises). Nevertheless, some studies do not support this positive influence of firm size on environmental innovation [19,20]. In these latter studies, other factors—usually less studied in the literature—such as networking, training, cooperation with universities or suppliers seem to outweigh the effect of size [5,17].
Belonging to a group is also another variable that influences technological capabilities and innovation [21]. In this perspective, Le Bas and Poussing [22] find that belonging to a group has a positive influence on the probability of eco-innovating. They believe that this result might be related to the availability of ample resources and the stability of R&D expenditure in firms that are part of a group, taking into account the specificity and complexity of environmental technologies [23].
Concerning the role of learning economics measured by firm age, the theoretical and empirical literature is inconclusive. Some studies show that innovation effort decreases with the age of the firm [24], while others argue that the former relationship shows a U-shaped path. Young firms innovate to survive in a market while old firms innovate to deter the entry of new competitors [25]. In the same direction, the results concerning the influence of age on eco-innovation are not conclusive, either. Some authors show that young firms have a higher probability of developing green innovations than older firms [26], while others do not find that age matters to environmental innovation [4].
The importance of public financing in fostering eco-innovation has also been largely studied in the theoretical and empirical literature. In this sense, most studies confirm the positive effect of government-funded R&D subsidies on environmental innovation [27,28,29].
R&D resources enhance technological capabilities of the firm and trigger innovations [4,30]. Nevertheless, the positive influence of R&D on environmental innovation is not always confirmed in the literature. The influence of R&D intensity is found to be lower in environmental innovators than in non-environmental innovators [31] or R&D resources do not influence the level of environmental innovation [32].
Export orientation is included as a competitive action. It could determine a high innovativeness (environmental and non-environmental innovation). Regarding eco-innovation, Horbach [4] concludes that industries with high export intensity are more engaged in environmental innovation because of the high exposure to competition in global markets. Nonetheless, De Marchi [17] found a weakly significant negative influence of export on environmental innovation. Thus, the expected sign might depend on empirical evidence. However, we expect a positive relationship between an international orientation of the firm and its innovation strategy.
Finally, attention is also paid to the influence of different sources of knowledge information on the innovative process. In this regard, we expect a positive influence of internal sources of knowledge on eco-innovations. Similarly, technical knowledge obtained from external sources is often used to explain sectorial technological capabilities [33,34]. Along this line, several studies enhance the importance of market (clients, suppliers, competitors) and non-market (universities, scientific institutions) sources of information to get enough knowledge for the innovation process [35,36]. This has led to the finding that the level of technological capabilities increases as the knowledge sources become more diverse. Thus, the higher is the level of technological capabilities (by market and non-market sources), the larger is the incentive of firms to innovate. In this sense, Horbach et al. [37] compare the knowledge base and the sources of information used in general and environmental innovations. They show that environmental innovations involve more external sources of knowledge than conventional innovations for French firms. In particular, they find that the external source of knowledge from universities is the most important source for environmental innovative firms followed by the internal source of knowledge. Although they do not find the same evidence for German firms, their results confirm that environmental innovation requires more external information than general innovation. In this sense, eco-innovation requires more external sources of knowledge and information than conventional innovation because the knowledge used in eco-innovation is more multidisciplinary than the knowledge needed in other innovations [38]. Some recent studies have tried to prove the role of external knowledge sources in eco-innovation using the Open Innovation framework proposed by Chesbrough (2003) [39]. Based upon this paradigm, the positive impact of external knowledge sources of information on technological innovation has been empirically shown [40].
The role of firm networking is also confirmed for a sample of 555 Italian firms by Cainelli et al. [41] and for a sample of 4964 European SMEs by Triguero et al. [5]. Similarly, Borghesi et al. [32] enhance the role of acquisition of external knowledge considering a sample of 6000 Italian manufacturing firms facing CO2 abatement and climate change. In the same direction, cooperation with universities and public and private research agencies is also one of the most important innovation sources in eco-innovation [17]. Similarly, Ghisetti et al. [42] confirm that knowledge sourcing has a positive impact on the adoption of eco-innovation using the Community Innovation Survey (CIS) 2006–2008 in eleven European countries.
Finally, firms are sensitive to the distinct technological regimes in which they operate. Hence, higher technological opportunities must tend to involve a higher probability of innovating and eco-innovating [43]. In this sense, we control for the type of sector in which the firm operates according to the degree of technology required.
Following the insights from the literature review, we hypothesize that:
Hypothesis 1a (H1a).
The size of the firm positively influences the adoption of eco-innovation.
Hypothesis 2a (H2a).
Belonging to a group positively influences the adoption of eco-innovation.
Hypothesis 3a (H3a).
The age of the firm negatively influences the adoption of eco-innovation.
Hypothesis 4a (H4a).
Public support positively influences the adoption of eco-innovation.
Hypothesis 5a (H5a).
R&D intensity positively influences the adoption of eco-innovation.
Hypothesis 6a (H6a).
International market orientation positively influences the adoption of eco-innovation.
Hypothesis 7a (H7a).
Internal and external knowledge sources positively influence the adoption of eco-innovation.
2.2. Drivers of Employment Growth Considering Eco-Innovative Performance
For years now, the role of innovation on the creation and/or destruction of employment has been analyzed in the related literature [44,45,46]. In this regard, the positive influence of innovation on employment change has been widely demonstrated [46]. Thus, innovative firms, especially product innovators, expand their sales, employment and profits more than non-innovative firms. However, the empirical evidence shows that technological change demand also has a different impact on employment depending on innovative strategy. Different technological levels and R&D performance justify that some studies do not find a clear-cut positive relationship between innovative behavior and employment [47]. Since the employment growth rates of a firm that introduced environmental innovations may be different than those of a firm that introduces other types of innovations, the influence of several factors on employment growth, taking into account the adoption of environmental innovation, must be considered.
Regarding size, most studies conclude that large companies are more innovative because they have higher R&D and are able to accumulate more knowledge capital than small firms [48] However, the empirical evidence about the influence of size on employment growth is inconclusive. In this regard, García et al. [49] show that employment growth is more important for small for large firm R&D performers in a panel of 1286 Spanish manufacturing firms during the period 1990–1998.
Belonging to a group is also another variable that influences employment as a part of the eco-innovative capabilities of the firm. In this regard, Licht and Peters [50] find that becoming part of a group of firms positively influences employment when they consider the influence of sales growth due to new environmental products on employment in different European countries. The former result might also be due to a higher stability of employment in subsidiaries than in independent firms [51].
Regarding the results concerning the influence of age on employment growth, some studies confirm the disproportionate contribution of young firms to job creation in several countries while old firms contribute more to job destruction [52]. In the same direction, Horbach and Rennings [10] confirm that younger firms show more dynamic employment using 2009 German CIS (specially the environmental process innovators).
The literature has also considered the influence of subsidies on patent stock, productivity, capital investment, sales growth and employment [53]. In this sense, public subsidies have frequently been found to be an incentive to lead additional private R&D and innovation [54]. This positive relationship between firm knowledge of public support and innovative skills at the firm level has been confirmed [55].
Regarding R&D expenditure, firms that invest more in R&D also have a high probability of creating employment. This result is confirmed in numerous studies mainly for product innovators in high-tech manufacturing and service sectors [49]. According to most empirical evidence, a positive relationship between R&D and employment is shown, particularly in high-tech sectors [45,47,52]. Moreover, a positive influence of R&D on employment has been found even in non-high-tech sectors [56] because environmental innovations require more advanced technologies than other types of innovations.
Export orientation is also considered a competitive action for improving firm performance. In this regard, the literature highlights that employment growth is higher in exporter firms than in non-exporters because of higher productivity rates in exporting firms [57,58]. A positive and significant effect of export on employment is expected. Despite the lack of empirical evidence, a higher degree of internationalization is also associated with higher employment dynamics by eco-innovative firms [10].
Finally, attention is also paid to the influence of different sources of knowledge information on employment growth. In this regard, we expect a positive influence of internal sources of knowledge on employment growth. In this sense, little empirical evidence has been found. As far as we know, only few studies contemplate the influence of knowledge sourcing on employment growth. In this sense, Peters [59] considers the intensive use of clients and science (universities, public research institutes) as a source of information to study the relationship between innovation and employment growth in manufacturing and service firms in Germany. Similarly, some research considers the utilization of clients a source of information for the innovation process as an instrument for explaining the influence of sales growth due to new products and process innovation on employment for manufacturing and service firms in France, Germany, Spain and UK [60] and for Chilean manufacturing firms [61]. Furthermore, the positive influence of internal and external knowledge sources on the adoption of eco-innovation has recently been shown [5,17,42].
Taking into account the literature review made above, we hypothesize that:
Hypothesis 1b (H1b).
The size of the firm positively influences employment, controlling for eco-innovative behavior.
Hypothesis 2b (H2b).
Belonging to a group positively influences employment, controlling for eco-innovative behavior.
Hypothesis 3b (H3b).
The age of the firm negatively influences employment, controlling for eco-innovative behavior.
Hypothesis 4b (H4b).
Public support positively influences employment, controlling for eco-innovative behavior.
Hypothesis 5b (H5b).
R&D intensity positively influences employment, controlling for eco-innovative behavior.
Hypothesis 6b (H6b).
International market orientation positively influences employment, controlling for eco-innovative behavior.
Hypothesis 7b (H7b).
Internal and external knowledge sources positively influence employment, controlling for eco-innovative behavior.
2.3. Theoretical Framework
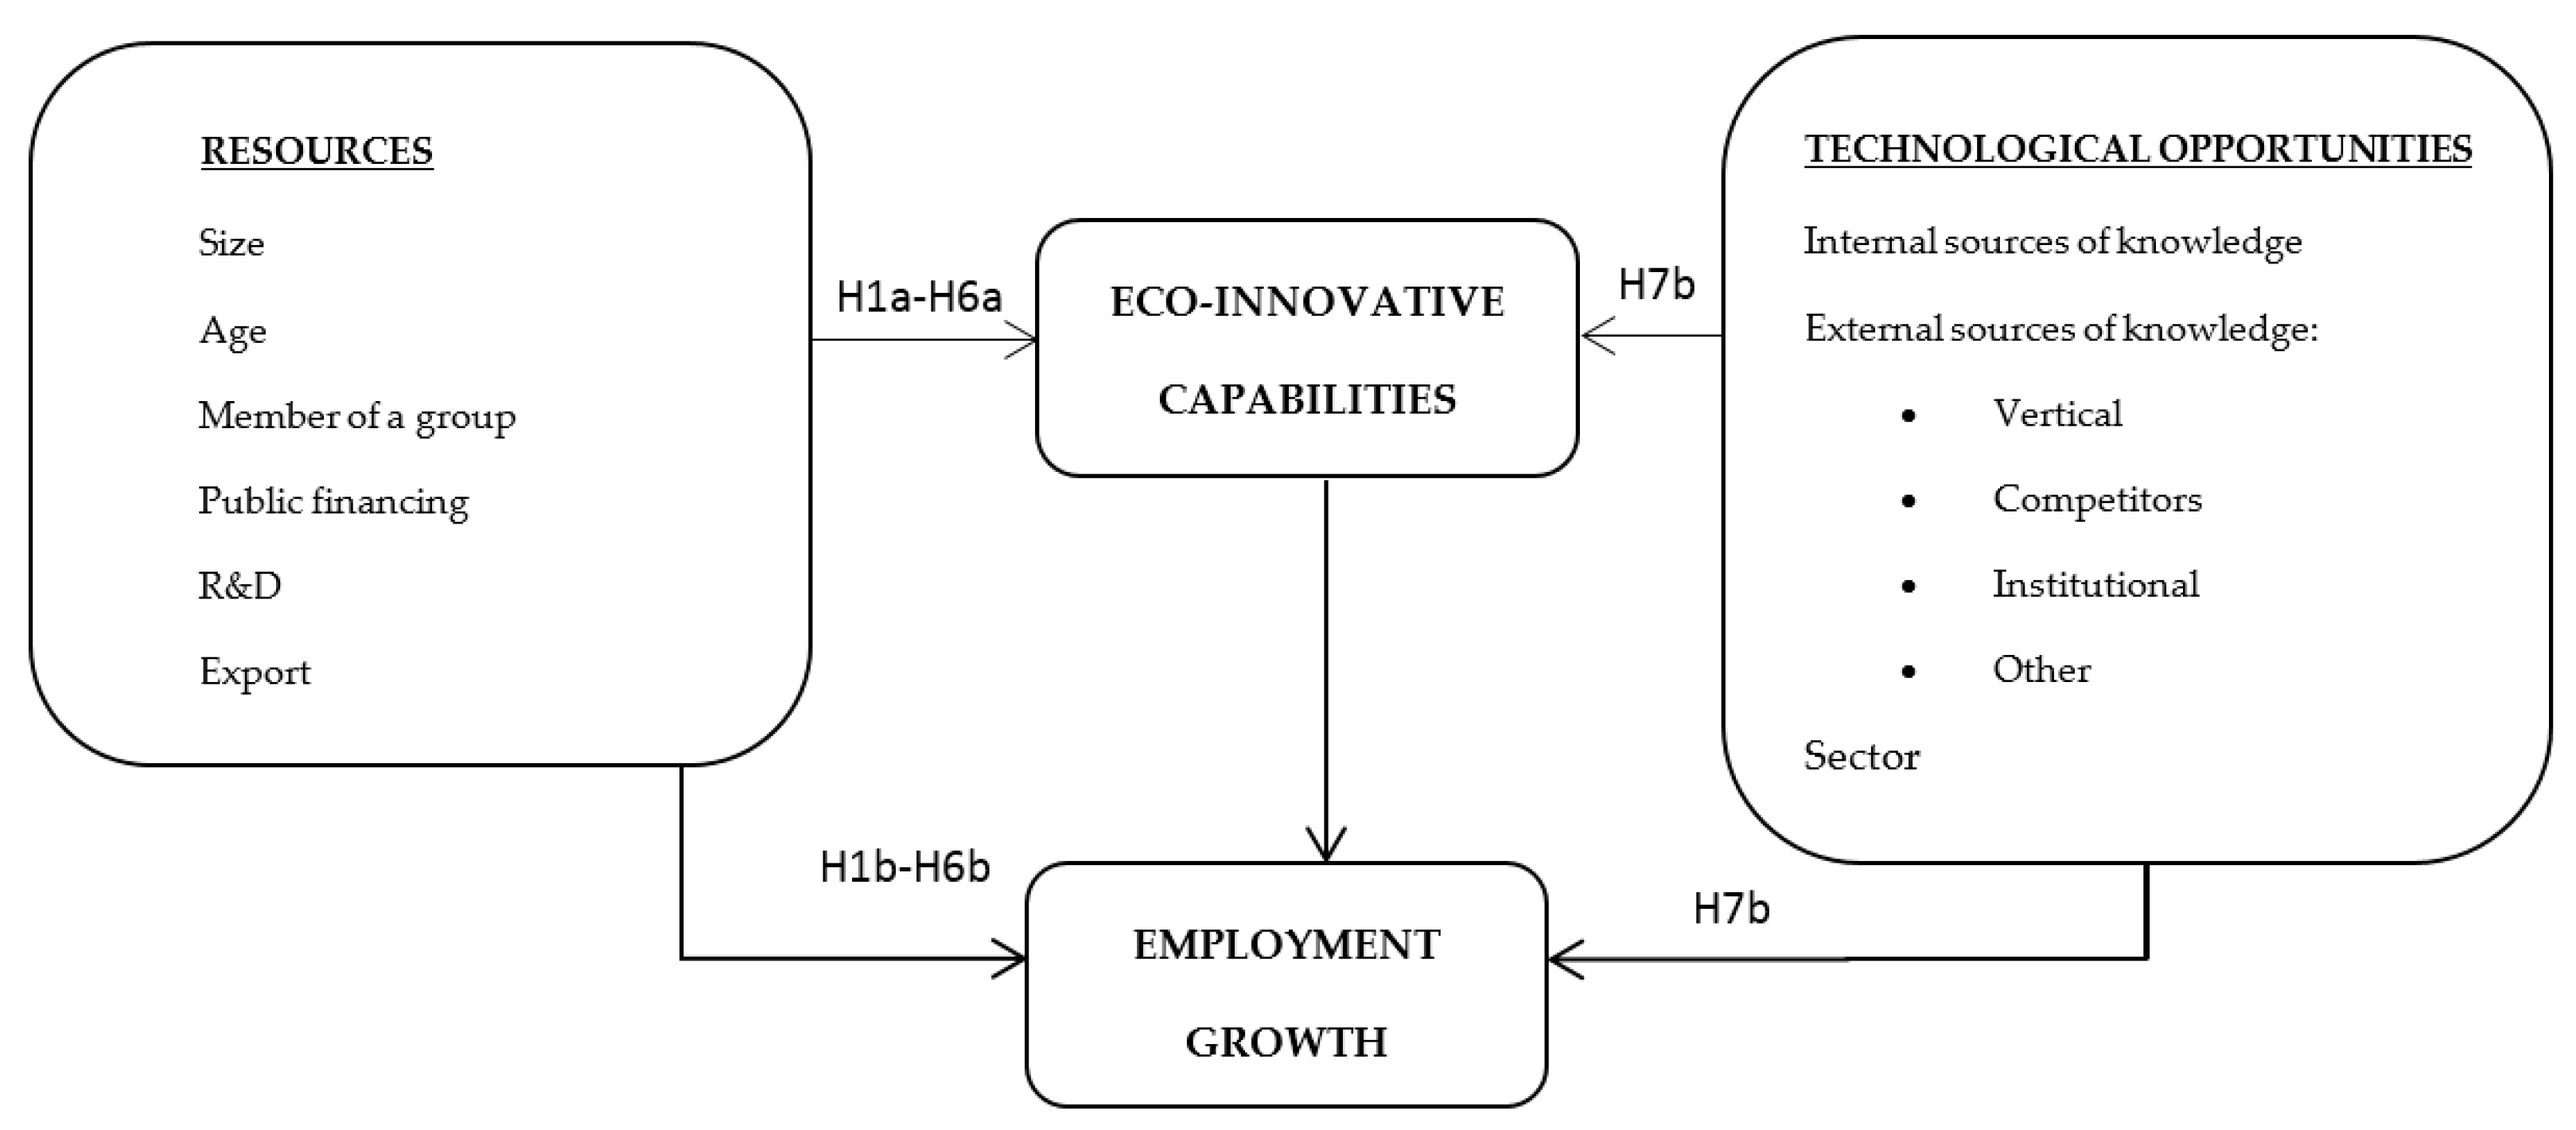
Although environmental innovation is affected by firm pressure and concerns about environment and socio-economic conditions [4,19,62], own resources and capabilities also play a fundamental role in explaining the firm’s innovative performance. The development of eco-innovation usually implies investing in technologies that change the firm’s capability in terms of knowledge creation. To meet these challenges, the firm’s resource base is modified. Hence, this change affects firm performance, namely, employment dynamics. From this perspective, the conceptual framework used for analyzing the drivers of eco-innovations and employment is based on the resource-based view theory (RBV) (Figure 1). In this regard, the RBV paradigm serves to “examine the link between a firm’s internal characteristics and performance” [63]. To do this, the RBV (resources) and competitive dynamics (actions) are integrated. In this way, identifying the linkages between resources and the decision to eco-innovate will contribute to understanding why some firms experience better performance in terms of employment [64]. Thus, this approach makes it possible to analyze the influence of internal and external factors in the decision to eco-innovate and employment growth (performance), taking into account the eco-innovative strategy (action). Based on the arguments above, the proposed theoretical framework is as follows:
3. Materials and Methods
Data are obtained from the Spanish CIS (PITEC) corresponding to the period 2009–2011. This dataset provides a rich source of information about the innovative behavior of firms in all sectors. PITEC includes firms with different sizes and characteristics but only provides information about the behavior of innovative firms. Therefore, PITEC is a very helpful dataset for analyzing the drivers of innovation and measuring the consequences of different kinds of innovations, i.e., eco-innovations. Furthermore, these data give information about the different strategies in relation to the innovation process and the performance of specific outputs, i.e., employment.
This study focuses on environmentally motivated innovations. Thus, all the innovations that enable a firm to decrease, incrementally or drastically, its negative environmental impacts through new products, processes, services or methods are considered. This criterion is similar to the one used by the European Commission in the design of the European Environmental Technologies Action Plan (ETAP). Following other previous studies [4,17], a question of Spanish CIS data asking about the “importance of reduced environmental impacts” instead of self-reported data on the effect of the innovations introduced is used. We believe that these data allow non-ambiguously identifying eco-innovators by their activity and self-perception. This feature of the dataset allows managers to state they aim environmental benefits with their innovation activity. Our first dependent variable is environmental-innovation (or eco-innovation), Ecoinnovationi(t), which takes the value 1 if the company reports that its innovation has been developed to “reduce environmental impact” with high or medium importance. Although this might be a limitation of this research, “unintentional environmental innovations are very difficult to identify and thus to evaluate, since the environmental gains of ‘normal innovations’ have never been the object of systematic study” [65] (p. 2). The second dependent variable is defined as the actual difference in firm size (absolute growth). This proxy is a common way of measuring proportional firm growth [66]. Therefore, our dependent variable is computed as log(gi,t) = log(Employmenti(t)) − log(Employmenti(t − 1)) where Employmenti(t) is the size of firm i at time t.
The database includes 9239 firms that belong to manufacturing and service sectors in Spain, although not all of them confirm to be innovators in the period considered. Table 1 shows the number of eco-innovative and non-eco innovative firms according to size. In total, 6129 firms are innovative firms, 2892 of which are eco-innovators. Therefore, around half of innovative firms declare carrying out eco-innovation (47.19%). If we distinguish by number of employees, nearly half of innovative SMEs confirm to be eco-innovators (2101 firms). This proportion is higher across innovative large firms, given that about 51% eco-innovate. These descriptive results recommend distinguishing behavior by SMEs (<200 employees) and large firms (≥200 employees).
The PITEC also provides information about other firm characteristics. In particular, special attention is paid to firms’ resources and technological opportunities related to size, age, ownership, public financing, R&D, export behavior and sources of knowledge information. All these factors are usually considered drivers of eco-innovation. Furthermore, we introduce control sector dummies to capture sector technological opportunities distinguishing among high-tech, medium-tech, KIS (knowledge-intensive services) and LKIS (low knowledge-intensive sectors), similar to Licht and Peters [50].
One problem is related to the endogeneity issue due to potential reverse causality between some dependent and independent variables. To control for that, we introduce one lagged value of the variables to estimate our models. Finally, robustness analyses are carried out distinguishing by the size of the firm (SMEs and large firms) and the type of technological innovative strategy (process or product). Table 2 provides a complete list of variables and definitions used in this study (see Table A1 for the Correlation Matrix).
Table 3 gives summary statistics of the variables used and the t-tests on mean differences between eco- and non-eco-innovators, which are significant at the 99% level of significance for all variables. The data show that eco-innovative firms are characterized by a better performance in terms of employment growth (a lower decrease). They are bigger and older, belong to a group, export, have higher R&D intensity and receive more public subsidies than non-eco-innovators. Additionally, eco-innovators make greater use of internal and external sources of knowledge. Finally, the share of eco-innovators is higher in the manufacturing sector than in the service sector.
Since we believe that variables that influence being an eco-innovator are related to those that influence employment growth, we estimate the two separate models. The first equation, the Eco-Innovation Equation, explains a firm’s probability of eco-innovating, where is equal to 1 if firm i innovates assessing the importance of alleviating environmental damage from t − 1 to t and 0 otherwise. To do this, we calculate the following probit model:
where is the latent variable, includes a set of control variables, represents the set of exogenous factors and is the usual error term.
Second, the determinants of employment growth are estimated using OLS regressions. The second equation is defined as follows:
where Growth is the log of employees in the year t minus the log of employees in the year t − 1 in firm i; , …, Xri are the explanatory variables, including a dummy for eco-innovation; and is the error term. With the aim of searching for synergies between eco-innovation and employment growth, we also introduce interactions terms between the dummy of eco-innovation and the rest of the independent variables of interest. It enables us to get additional insights on results.
Although OLS estimation is the most widely used regression method, there might appear possible endogeneity problems with respect to eco-innovation. In this case, OLS produces biased and inconsistent estimations. To tackle this, and as a robustness check, an instrumental variable (IV) regression is carried out considering the endogeneity of the eco-innovation variable. In this sense, it is necessary to find a good predictor (instrument) for eco-innovation, which is otherwise exogenous.
The IV method allows for consistent estimation when the explanatory variables are correlated with the error terms. Considering our regression of interest with eco-innovation as an endogenous variable:
where Xi is the endogenous explanatory variable, eco-innovation; W1i, …, Wri are the rest of the exogenous explanatory variables; and ui is the error term. The IV method replaces the actual realized values of Xi, which is correlated with ui by predicted values of Xi that are related to the actual Xi but uncorrelated with ui. Predicted values are formed by projecting Xi on a set of instruments, labeled Zi, which are related to the endogenous explanatory variable and uncorrelated with the errors. The instruments, which must be as numerous as endogenous regressors, are used to estimate the causal impact of Xi on Yi in a two-step procedure, after conditioning on all the remaining exogenous variables (W1i, …, Wri).
The most common IV estimator is the Two Stage Least Squares (2SLS). In a first stage regression, the endogenous variable is regressed on the instruments and the rest of the explanatory variables. In this first stage, the variation in Xi that is not correlated with ui is isolated. The resulting fitted value , is afterwards used in the second stage instead of the endogenous regressor Xi. In particular, in the first-stage regression:
In the second stage, Yi is regressed on the rest of the exogenous variables and the resulting fitted value , according to Expression (5):
where the coefficients β are the 2SLS estimators. In this regression, the exogenous explanatory variables have an important role in the IV estimation, not only because they increase statistical efficiency by reducing the variance of the sample, but also because they control for any self-selection bias caused by the instruments [67,68].
One problem of the 2SLS is that it is very sensitive to the finite simple bias. If we have weak instruments, this bias might increase. In this case, one option is to use a limited information maximum likelihood estimator (LIML). This is approximately median unbiased for over-identified constant. It provides the same asymptotic distribution as 2SLS but provides a finite-simple bias reduction.
The consistency of the IV estimator depends on the exogeneity condition of the instruments. If the instruments are not exogenous (that means, correlated with the error term), they cannot identify the exogenous variation in the endogenous regressor, Xi. In this case, IV estimators are inconsistent.
4. Results
Table 4 reports the results from the corresponding probit equations and average marginal effects to account for the effect of diverse factors on environmental innovation. Size, belonging to a group, age, R&D intensity, public financing, export, and internal and external sources of knowledge considered are determinant factors for explaining eco-innovation. First, larger and older firms have a higher probability of eco-innovating and contributing more to eco-innovation than smaller and younger firms. Therefore, they are more prone to innovate with environmental benefits. Although Ziegler et al. [25] show that young firms have a higher probability of developing green innovations than older firms do, our results are in line with the majority of previous studies [15,17,18,69]. In addition, belonging to a group positively influences the likelihood of eco-innovation. In this sense, the complexity and specificity of environmental technologies and financial resources associated with environmental innovation might be enough of a reason to explain why these types of firms are more willing to take risk. Thus, we accept hypotheses H1a and H2a but H3a is not accepted. The latter result accords to some previous literature. R&D positively influences eco-innovation, supporting H4a. This finding is similar to studies in which higher R&D capabilities enhance eco-innovation [4,30]. Similar results are found for public financing and international market orientation to eco-innovation in support of H5a and H6a. Finally, all internal and external sources of knowledge are relevant for eco-innovation. These findings are in line with the large body of literature that confirms that successful innovators generally tend to use a broader set of knowledge sources [40]. Thus, we accept H7a.
These results are confirmed considering sector technological opportunities (Specification 2 in Table 4). Taking the high-Tech sector as a reference category, all the coefficients are positive to explain eco-innovative behavior in the manufacturing sector and negative for the services sector. Hence, belonging to services sector (low KIS and KIS) decreases the probability of eco-innovating.
Table 5 includes different estimations of the drivers of employment growth controlling for eco-innovation. The results show a positive influence of size on employment in line with findings in previous studies [10,59]. Thus, we accept hypothesis H1b. However, we cannot accept hypothesis H2b: belonging to a group decreases employment growth considering eco-innovative behavior. Similar results are found for age in support of H3b. Older eco-innovative firms are less prone to create employment, in line with previous literature [10,52]. Similar to the influence on eco-innovation, R&D intensity and export positively influence employment. Therefore, we accept H5b and H6b. Regarding external market orientation through export strategies, this variable is also positive and significant for explaining employment dynamics at the 99% level of significance. This result is consistent with literature that highlights that employment growth is higher in exporter firms than in non-exporters [57,58]. However, results for public funding and internal and external sources of knowledge are dissimilar to the estimations made to explain the drivers of eco-innovation (we cannot fully accept H4b and H7b). Taking high-tech sector as a reference category, only the coefficient for the low KIS sector is significant and negative to the contribution to employment when technological opportunities are considered.
The control dummy used for eco-innovation is positive at the 99% level of significance (Specification 2). To argue for synergies, interaction terms are introduced between eco-innovation and the rest of independent variables of interest. As we expected, the sign of eco-innovation remains stable but the coefficient lacks its significance. In the case of interaction with the size of the firm, the negative sign of the coefficient means that the effect of being large on employment growth is significantly lower when these firms are also eco-innovators. In this sense, the size of the company moderates the positive role of eco-innovation on employment growth while young firms not belonging to a group (eco-entrepreneurs) contribute more to employment growth than old firms belonging to a parent company. Thus, the findings shed light on the entrepreneurial perspective of small and young fast-growth eco-entrepreneurs [70]. Although our results are in contrast with previous research confirming the importance of experience of the eco-innovative firms to employment growth [71], we find that green young firms show a greater potential of growth than green mature firms showing the different role of old and start-up firms towards a more sustainable industry [72]. The interaction with R&D intensity also shows a negative sign, indicating that, among eco-innovative firms, the higher the intensity in R&D is, the lower the effect on employment. Therefore, being an eco-innovator and spending more resources on R&D does not mean higher employment growth. When we include the interaction with the sources of knowledge, the internal sources and the vertical external knowledge sources gain significance and the coefficients of the interactions are negative. That result indicates that the effect on employment is lower in eco-innovative firms when they use these sources. Being an eco-innovator and nurturing these sources of knowledge exert a moderating role on employment growth. Finally, the rest of the interactions do not indicate a significant effect (Specification 3). This evidence implies that the way by which eco-innovators use external knowledge sources is different between eco-innovators and non-eco-innovators. This moderate effect of eco-innovation on the influence of external knowledge sources on firm growth could be explained by the high complexity and specificity of knowledge associated with eco-innovations [73]. Moreover, the potential longitudinal and non-linear effects, and the breadth and depth of collaboration across sectors and over time could also be an explanation to this puzzling result [74].
To handle possible endogeneity with respect to eco-innovation, an instrumental variable approach is used. Although it is very difficult to find good instruments to control for the endogeneity of eco-innovation (exogenous for employment growth), we have used two dummies related to fulfillment of environmental regulation and energy savings as instruments. Both of them can be expected to be exogenous. First, environmental regulation influences directly to the propensity to eco-innovate but not employment growth. Second, energy savings is also a driver of eco-innovative decisions but it is not closely related to firm growth. An IV regression for employment growth via two-stage least squares (Specification 4) is estimated. An IV regression via the LIML estimator has been also made for further robustness test. The results, which are not shown in the table, are very similar of those we have obtained in the 2SLS. To validate the introduced instruments the post estimation tests available in STATA 14.0 (StataCorp LP, Texas, USA) have been applied. In this regard, they show the relevance of the excluded exogenous variables and the tests of over-identifying restrictions (Sargan, Basmann and Wooldridge’s robust score tests in the 2SLS, Anderson and Rubin’s chi-squared test, and Basmann’s F test in the LIML) also show that the instruments are valid (the LIML estimation and these tests are available from the authors upon request.) The estimation shows results similar to the first model confirming the robustness of our results.
To summarize, the results show synergies and differences among the drivers of eco-innovation and employment. In particular, size, R&D intensity and export exert a positive influence on both dependent variables. Furthermore, the influence of age and group is significant but in the opposite direction. Internal and external sources of knowledge are relevant factors for eco-innovations but only have influence on employment by controlling for eco-innovation through interactions terms. Internal and external sources from suppliers and providers (vertical) also contribute to employment.
In Table 6, the estimations are carried out distinguishing between SMEs and large firms. Regarding R&D intensity, public subsidies, export, internal sources of knowledge and external knowledge, the findings are identical for SMEs and large firms and consistent with previous estimations. However, the positive influence of age and group on eco-innovation is only significant for small firms at the 99% level of significance. Although the sign of coefficients is similar to the specifications for the whole sample, the influences of eco-innovation and age on employment growth lack significance for large firms.
Regarding the influence of external knowledge sources, knowledge from competitors is significant for SMEs in explaining eco-innovation but not for large firms. Other external sources positively influence eco-innovation for SMEs and large firms, but only matter for eco-innovation, not for explaining employment dynamics as in previous results.
As an additional control, we repeat the estimations distinguishing between product and process innovation. As can be seen in Table A2 in Appendix A, this distinction does not significantly alter the previous results for the whole sample. We find some differences only in the magnitude of coefficients, not in the sign. The most important difference is that the use of competitors’ knowledge sources is only positive to explain eco-product innovation but not eco-process innovation or the lack of significance for eco-innovation to employment growth controlling for eco-product innovation. Hence, the type of innovation does not seem to be a relevant factor in explaining employment in eco-innovative Spanish manufacturing and services firms. This finding contrasts with empirical previous empirical evidence found for firms located in other European countries [37,69].
5. Discussion and Conclusions
This paper explores similarities and differences among the drivers of eco-innovation and employment taking into account eco-innovation performance in a sample of more than 6000 Spanish manufacturing and services firms. To do this, we have estimated two separate equations: an eco-innovation equation and an employment equation controlling for the decision to eco-innovate. Using different econometric methods, we find that the adoption of eco-innovation must be accounted for to explain employment dynamics of Spanish manufacturing and service firms. Moreover, our findings confirm that some variables related to innovative capabilities have a similar influence on eco-innovation and employment. In particular, size, R&D and export positively influence both. However, age, group, public aid, internal knowledge information and external sources of knowledge information from suppliers, providers, universities and research institutes seem to exert a different influence on each of them. Older firms are more likely to eco-innovate but they contribute less to employment growth controlling for the eco-innovative decision. The findings also show the positive influence of R&D intensity on eco-innovation and employment growth in absolute terms. R&D resources foster eco-innovation contributing to increasing the firm’s competitiveness and employment growth. Moreover, the different role of sector technological opportunities in eco-innovation and employment is also verified, showing that belonging to a high-tech sector increases the probability of eco-innovating while contributing negatively to employment growth. To sum up, environmental innovation is driven by diverse internal and external factors to the firm. In this sense, environmental innovation contributes to enhance the competitiveness and productivity of firms. Different motives (regulation, cost savings or others) incentivize environmental innovation and this decision leads to a double “win–win” outcome: pollution abatement and productivity increases [38,75].
Regarding the different behavior of large and SMEs, the results confirm that the drivers and synergies between environmental innovation and employment are similar in SMEs are similar to those of the whole sample. Furthermore, the influence of public subsidies, internal sources of knowledge and vertical external knowledge sources on eco-innovation and employment is comparable. However, some differences are found in the influence of age, R&D intensity and several external knowledge sources. In particular, larger and older firms have a higher probability of eco-innovating and contributing more to employment. In addition, R&D intensity and knowledge information from competitors and institutions such as universities and research institutes do not influence eco-innovation. Thus, a different use of knowledge sourcing on the adoption of eco-innovation and employment by large and small firms is confirmed. In this regard, we have tried to extent the existing literature on the relationship and potential consequences of environmental innovation and to analyze the different influence of firm’s resources and technological capabilities and strategies on the emergence of environmental innovations and employment generation. If eco-innovation is relevant for employment growth, the managers must consider that the choice of a technological innovative strategy with environmental benefits (or without environmental damage) could contribute to the increase of their growth in terms of returns and employees. This managerial decision could also strengthen their level of corporate social responsibility. The enhancement of synergies of environmental innovation and employment growth might even be more crucial for policy makers in European countries, such as Spain, taking into account the linkage with the Europe 2020 Strategy and the International Sustainable Agenda. In this regard, the EU has to promote environmental innovation in the fight against climate change and the promotion of a low-carbon economy but also try to promote employment.
Implications for scholars include the better understanding about how environmental innovation help to foster economic growth and sustainability, but our work is not exempt from limitations. Firstly, there are limitations related to the assessment of eco-innovation. In this regard, more reliable data such as the number of the environmental technology-related patents registered by the firm in a certain time of the period or whether the firm is registered for environmental management system (EMS) such as ISO 14000 series or EMAS (Eco-Management and Audit Scheme) could increase the reliability of the analysis to get deep insights about the relationship between eco-innovation and employment. Unfortunately, we are not able to identify the firm in this dataset to matching with their number of eco-patents or to know if they are implemented a certified EMS. Second, there is a limitation related to the cross-section nature of data. In this sense, we recognize that this means that our results only can be generalized with certain caution because our employment variable only accounts for employment changes between two three-years average based on a survey based-data at the firm-level. In this regard, it would be interesting to use panel data to study the relationship between eco-innovation and employment in a longer period. Third, we only analyze Spanish manufacturing and service firms. Thus, an empirical replication of the research for other European countries could be of particular interest to study considering the different sector specialization at national level and emissions and pollution rates at sectoral level. Finally, the availability of more recent data for Spanish firms could enable to analyze the effect of the recent crisis. We hope to have the opportunity to further research to disentangle all these questions.
In this paper, we have also shown that similar factors can foster eco-innovation and employment, being eco-innovative and creating employment are compatible for firms. In other words, there are some synergies between both of them at the micro-level. Nevertheless, the consequences of environmental technological changes must also be considered at the macro-level. Since environmental problems and policy regulation are different depending on the sector or contextual framework, this will require significant research attention across different sectors and countries. “Policies (environmental) should be assessed on a sector-by-sector basis, depending on the abatement opportunities available and the level of competition the sector is exposed to” [76] (p. 4). Stricter regulation may decrease employment growth in pollution-intensive industry whereas nurturing more service-oriented industry or environmental business may be a key to employment. Depending on the nature of innovation (process or product innovation) and the reasons for their performance (end of pipe regulation, cleaner technologies or new products), the impact on employment at the macro-level is not a simple build-up of effects at the micro and sectoral levels. Indirect effects such as higher costs or substitution of labor by capital can reduce or at less modify the final combination of multiple processes at the firm level. In this sense, public authorities should implement mechanisms to boost environmental innovation to achieve a more sustainable economy, not only in ecological terms, but also in terms of employment generation, taking into account the heterogeneous characteristics of the firms, sectors, regions and countries. In this regard, policy makers should continue to incentivize green capabilities at the firm level, but considering the labor consequences of innovative processes at the micro-, meso- and macroeconomic levels. Governments should establish sound financial support to foster cooperation in innovation processes with external agents to develop innovations that can to link knowledge management processes, human resources practices and environmental management systems. This change could enhance competitiveness and productivity. In this sense, this public support should be vertically oriented and directed to eco-innovators involved in employment generation. This proposal would follow the recommendation of the European Commission for growth toward the 2020 horizon. Smart growth (fostering knowledge, innovation, education and a digital society), sustainable growth (making EU production greener and more resource efficient while boosting competitiveness), and inclusive growth (enhancing labor market participation, skills acquisition, and the fight against poverty) will be possible with a broad understanding of drivers and synergies of eco-innovation and employment dynamics.
Acknowledgments
We thank three referees for their valuable recommendations to previous version of the paper. The authors also gratefully acknowledge the financial support received from the Spanish Ministry of Economy and Competitiveness (ECO2015-70262-R) and the University of Castilla-La Mancha (GI20174083).
Author Contributions
Ángela Triguero designed the theoretical framework. Carlos Álvarez contributed to refining the theoretical arguments. Ángela Triguero and María C. Cuerva analyzed the data and interpreted the results. All authors contributed to writing the paper.
Conflicts of Interest
The authors declare no conflict of interest.
Appendix A

Table A1.
Correlation matrix.
| Eco-Innovation | Size | Group | Age | RDint (t − 1) | Public Subsidies (t − 1) | Export (t − 1) | Internal Sources of Knowledge (t − 1) | Vertical External Knowledge Sources (t − 1) | Competitors Knowledge Sources (t − 1) | Other Sources of Knowledge (t − 1) | Institutional Knowledge Sources (t − 1) | |
|---|---|---|---|---|---|---|---|---|---|---|---|---|
| Eco-innovation | 1.000 | |||||||||||
| Size | 0.0463 *** | 1.000 | ||||||||||
| Group | 0.1048 *** | 0.3667 *** | 1.000 | |||||||||
| Age | 0.0863 *** | 0.1985 *** | 0.1074 *** | 1.000 | ||||||||
| RDint (t − 1) | 0.1599 *** | −0.0905 *** | −0.0083 | −0.0951 *** | 1.000 | |||||||
| Public subsidies (t − 1) | 0.3237 *** | −0.0254 *** | 0.0605 *** | −0.0066 | 0.3122 *** | 1.000 | ||||||
| Export (t − 1) | 0.2222 *** | −0.0394 *** | 0.1331 *** | 0.1139 *** | 0.0468 *** | 0.1970 *** | 1.000 | |||||
| Internal sources of knowledge (t − 1) | 0.1912 *** | 0.0643 *** | 0.0980 *** | 0.0213 *** | 0.1133 *** | 0.1413 *** | 0.0952 *** | 1.000 | ||||
| Vertical external knowledge sources (t − 1) | 0.1711 *** | 0.0216 *** | 0.0091 | 0.0114 | 0.0890 *** | 0.1298 *** | 0.0805 *** | 0.2135 *** | 1.000 | |||
| Competitors knowledge sources (t − 1) | 0.1030 *** | −0.0099 *** | 0.0055 | 0.041 | 0.0774 *** | 0.0916 *** | 0.0606 *** | 0.0955 *** | 0.3161 *** | 1.000 | ||
| Other sources of knowledge (t − 1) | 0.1206 *** | 0.0087 *** | 0.0170 | 0.0157 | 0.1055 *** | 0.1518 *** | 0.0226 *** | 0.0418 *** | 0.1447 *** | 0.1718 *** | 1.000 | |
| Institutional knowledge sources (t − 1) | 0.1615 *** | −0.0140 *** | 0.0157 | −0.0350 *** | 0.2004 *** | 0.2620 *** | 0.0516 *** | 0.0960 *** | 0.0767 *** | 0.0499 *** | 0.2377 *** | 1.000 |
*** p < 0.01.
Table A2.
Drivers of eco-innovation and employment growth by type of innovation.
| Process Innovation | Product Innovation | |||
|---|---|---|---|---|
| Eco-Innovation | Employment | Eco-Innovation | Employment | |
| Eco-innovation | 0.0209 ** | 0.00906 | ||
| (0.00939) | (0.00940) | |||
| Size | 0.0919 *** | 0.0983 *** | 0.1363 *** | 0.0753 *** |
| (0.0188) | (0.0188) | (0.0203) | (0.0164) | |
| Group | 0.0228 | −0.0344 ** | 0.0121 | −0.0375 *** |
| (0.0164) | (0.0146) | (0.0167) | (0.0128) | |
| Age | 0.0008 ** | −0.00172 ** | 0.0010 ** | −0.00118 ** |
| (0.0035) | (0.000674) | (0.0004) | (0.000497) | |
| RDint (t − 1) | 3.69 × 10⁻⁶ *** | 3.96 × 10⁻⁷ * | 2.47 × 10⁻⁶ *** | 4.07 × 10⁻⁷ ** |
| (5.45 × 10⁻⁷) | (2.08 × 10⁻⁷) | (4.67 × 10⁻⁷) | (1.76 × 10⁻⁷) | |
| Public subsidies (t − 1) | 0.0818 *** | 0.00593 | 0.0875 *** | 0.00782 |
| (0.1626) | (0.00975) | (0.0159) | (0.00939) | |
| Export (t − 1) | 0.0196 | 0.0487 *** | 0.0382 * | 0.0327 ** |
| (0.0189) | (0.0150) | (0.0199) | (0.0157) | |
| Internal sources of knowledge (t − 1) | 0.0801 *** | −0.00553 | 0.0585 *** | −0.00177 |
| (0.0157) | (0.0116) | (0.0163) | (0.0105) | |
| Vertical external knowledge sources (t − 1) | 0.0986 *** | 0.0178 | 0.0802 *** | 0.0184 * |
| (0.1584) | (0.0113) | (0.0160) | (0.0109) | |
| Competitors knowledge sources (t − 1) | 0.0317 | 0.00295 | 0.0465 ** | −0.0100 |
| (0.0234) | (0.0129) | (0.0227) | (0.0162) | |
| Other external sources of knowledge (t − 1) | 0.0803 *** | −0.00325 | 0.0769 *** | −0.00974 |
| (0.0246) | (0.0121) | (0.0247) | (0.0118) | |
| Institutional knowledge sources (t − 1) | 0.1049 *** | 0.000166 | 0.0679 *** | 0.00489 |
| (0.0251) | (0.0137) | (0.0239) | (0.0133) | |
| Low-tech manuf. 1 | 0.0920 *** | 0.0214 | 0.0936 *** | 0.0200 |
| (0.0353) | (0.0194) | (0.0342) | (0.0162) | |
| Medium-tech manuf. 1 | 0.1134 *** | 0.0200 | 0.1088 *** | 0.0194 |
| (0.0328) | (0.0192) | (0.0311) | (0.0158) | |
| KIS 1 | −0.2414 *** | 0.0246 | −0.2213 *** | −0.00143 |
| (0.03612) | (0.0219) | (0.0342) | (0.0199) | |
| Low-KIS 1 | −0.1039 *** | −0.0433 * | −0.0387 | −0.0378 * |
| (0.0349) | (0.0244) | (0.0339) | (0.0216) | |
| Observations | 3842 | 3842 | 3814 | 3814 |
| LR chi2 = 589.99 | F test = 2.88 | LR chi2 = 487.48 | F test = 2.33 | |
| Prob > chi2 = 0.000 | Prob > F = 0.000 | Prob > chi2 = 0.000 | Prob > F = 0.000 | |
| Log likelihood = −2368.3 | Log likelihood = −2394.3 | |||
1 Reference category: High-Tech sectors; * p < 0.10; ** p < 0.05; *** p < 0.01.
References
- Frondel, M.; Horbach, J.; Rennings, K. End-of-pipe or cleaner production? An empirical comparison of environmental innovation decisions across OECD countries. Bus. Strategy Environ. 2007, 16, 571–584. [Google Scholar] [CrossRef]
- Green, K.; McMeekin, A.; Irwin, A. Technological trajectories and R&D for environmental innovation in UK firms. Futures 1994, 26, 1047–1059. [Google Scholar]
- Rennings, K. Redefining innovation—Eco-innovation research and the contribution from ecological economics. Ecol. Econ. 2000, 32, 319–332. [Google Scholar] [CrossRef]
- Horbach, J. Determinants of environmental innovation—New evidence from German panel data sources. Res. Policy 2008, 37, 163–173. [Google Scholar] [CrossRef]
- Triguero, A.; Moreno-Mondéjar, L.; Davia, M.A. Drivers of different types of eco-innovation in European SMEs. Ecol. Econ. 2013, 92, 25–33. [Google Scholar] [CrossRef]
- Sáez-Martínez, F.J.; Díaz-García, C.; González-Moreno, Á. Factors promoting environmental responsibility in European SMEs: The effect on performance. Sustainability 2016, 8, 898. [Google Scholar] [CrossRef]
- Harabi, N. Employment Effects of Ecological Innovations: An Empirical Analysis. Available online: https://mpra.ub.uni-muenchen.de/4395/1/MPRA_paper_4395.pdf (accessed on 6 November 2017).
- Getzner, M. The quantitative and qualitative impacts of clean technologies on employment. J. Clean. Prod. 2002, 10, 305–319. [Google Scholar] [CrossRef]
- Rennings, K.; Ziegler, A.; Zwick, T. The effect of environmental innovations on employment changes: An econometric analysis. Bus. Strategy Environ. 2004, 13, 374–387. [Google Scholar] [CrossRef]
- Horbach, J.; Rennings, K. Environmental innovation and employment dynamics in different technology fields—An analysis based on the German Community Innovation Survey 2009. J. Clean. Prod. 2013, 57, 158–165. [Google Scholar] [CrossRef]
- Gagliardi, L.; Marin, G.; Miriello, C. The greener the better? Job creation effects of environmentally-friendly technological change. Ind. Corp. Chang. 2016, 25, 779–807. [Google Scholar] [CrossRef]
- Kunapatarawong, R.; Martínez-Ros, E. Towards green growth: How does green innovation affect employment? Res. Policy 2016, 45, 1218–1232. [Google Scholar] [CrossRef]
- Christensen, J.L.; Hain, D.S. Knowing where to go: The knowledge foundation for investments in renewable energy. Energy Res. Soc. Sci. 2017, 25, 124–133. [Google Scholar] [CrossRef]
- Organisation for Economic Cooperation and Development. Sustainable Manufacturing and Eco-Innovation: Framework, Practices and Measurement; OECD: Paris, France, 2009. [Google Scholar]
- Cleff, T.; Rennings, K. Determinants of environmental product and process innovation. Eur. Environ. 1999, 9, 191–201. [Google Scholar] [CrossRef]
- Rehfeld, K.-M.; Rennings, K.; Ziegler, A. Integrated product policy and environmental product innovations: An empirical analysis. Ecol. Econ. 2007, 61, 91–100. [Google Scholar] [CrossRef]
- De Marchi, V. Environmental innovation and R&D cooperation: Empirical evidence from Spanish manufacturing firms. Res. Policy 2012, 41, 614–623. [Google Scholar]
- Poussing, N.; Le Bas, C. Firm voluntary measures for environmental changes, eco-innovations and CSR: Empirical analysis based on data surveys. Écon. Appl. 2013, Tome LXVI, 141–165. [Google Scholar]
- Wagner, M. Empirical influence of environmental management on innovation: Evidence from Europe. Ecol. Econ. 2008, 66, 392–402. [Google Scholar] [CrossRef]
- Bernauer, T.; Engel, S.; Kammerer, D.; Sejas Nogareda, J. Determinants of Green Innovation—Ten Years after Porter’s Win-Win Proposition: How to Study the Effects of Environmental Regulation on Corporate Environmental Innovation? Polit. Vierteljahr. 2007, 39, 323–341. [Google Scholar]
- Segarra-Blasco, A.; Arauzo-Carod, J.M. Sources of innovation and industry–university interaction: Evidence from Spanish firms. Res. Policy 2008, 37, 1283–1295. [Google Scholar] [CrossRef]
- Le Bas, C.; Poussing, N. Firm Voluntary Measures for Environmental Changes, Eco-Innovations and CSR: Empirical Analysis Based on Data Surveys; LISER Working Paper; Luxembourg Institute of Socio-Economic Research: Luxembourg, 2013; Available online: http://0-dx-doi-org.brum.beds.ac.uk/10.2139/ssrn.2616343 (accessed on 6 November 2017).
- Marzucchi, A.; Montresor, S. Forms of knowledge and eco-innovation modes: Evidence from Spanish manufacturing firms. Ecol. Econ. 2017, 131, 208–221. [Google Scholar] [CrossRef]
- Klepper, S. Entry, Exit, Growth, and Innovation over the Product Life Cycle. Am. Econ. Rev. 1996, 86, 562–583. [Google Scholar]
- Ziegler, A.; Rennings, K. Determinants of Environmental Innovations in Germany: Do Organizational Measures Matter? A Discrete Choice Analysis at the Firm Level; Discussion Paper No. 04-030; The Centre for European Economic Research: Mannheim, Germany, 2004; Available online: http://0-dx-doi-org.brum.beds.ac.uk/10.2139/ssrn.552082 (accessed on 6 November 2017).
- Peeters, C.; van Pottelsberghe de la Potterie, B. Innovation strategy and the patenting behavior of firms. In Innovation, Industrial Dynamics and Structural Transformation: Schumpeterian Legacies; Springer: Berlin/Heidelberg, Germany, 2007; pp. 345–371. [Google Scholar]
- Jaffe, A.B.; Palmer, K. Environmental regulation and innovation: A panel data study. Rev. Econ. Stat. 1997, 79, 610–619. [Google Scholar] [CrossRef]
- Frondel, M.; Horbach, J.; Rennings, K. What triggers environmental management and innovation? Empirical evidence for Germany. Ecol. Econ. 2008, 66, 153–160. [Google Scholar] [CrossRef]
- De Marchi, V.; Grandinetti, R. Who are the green innovators? An empirical analysis of firms level factors driving environmental innovation adoption. In Proceedings of the DRUID Conference, Cambridge, UK, 19–21 January 2012; pp. 19–21. [Google Scholar]
- Mazzanti, M.; Zoboli, R. What Drives Environmental Innovation? Empirical Evidence for a District-Based Manufacturing System. Available online: http://www.siepweb.it/siep/oldDoc/wp/451.pdf (accessed on 6 November 2017).
- Hemmelskamp, J. The Influence of Environmental Policy on Innovative Behaviour: An Econometric Study; Working Paper No. 18.99; Fondazione Eni Enrico Mattei: Milan, Italy, 1999; Available online: http://0-dx-doi-org.brum.beds.ac.uk/10.2139/ssrn.158819 (accessed on 6 November 2017).
- Borghesi, S.; Cainelli, G.; Mazzanti, M. Linking emission trading to environmental innovation: Evidence from the Italian manufacturing industry. Res. Policy 2015, 44, 669–683. [Google Scholar] [CrossRef]
- Cohen, W.M.; Levinthal, D.A. Absorptive Capacity: A New Perspective on Learning and Innovation. Adm. Sci. Q. 1990, 35, 128–152. [Google Scholar] [CrossRef]
- Klevorick, A.K.; Levin, R.C.; Nelson, R.R.; Winter, S.G. On the sources and significance of interindustry differences in technological opportunities. Res. Policy 1995, 27, 131–150. [Google Scholar] [CrossRef]
- Narula, R. Choosing Between Internal and Non-internal R&D Activities: Some Technological and Economic Factors. Technol. Anal. Strateg. Manag. 2001, 13, 365–387. [Google Scholar]
- Vega-Jurado, J.; Gutiérrez-Gracia, A.; Fernández-De-Lucio, I. Does external knowledge sourcing matter for innovation? Evidence from the Spanish manufacturing industry. Ind. Corp. Chang. 2009, 18, 637–670. [Google Scholar] [CrossRef]
- Horbach, J.; Oltra, V.; Belin, J. Determinants and Specificities of Eco-Innovations Compared to Other Innovations—An Econometric Analysis for the French and German Industry Based on the Community Innovation Survey. Ind. Innov. 2013, 20, 523–543. [Google Scholar] [CrossRef]
- Rennings, K.; Rammer, C. The impact of regulation-driven environmental innovation on innovation success and firm performance. Ind. Innov. 2011, 18, 255–283. [Google Scholar] [CrossRef]
- Chesbrough, H.W. Open Innovation: The New Imperative for Creating and Profiting from Technology; Harvard Business School Publishing: Boston, MA, USA, 2003. [Google Scholar]
- Laursen, K.; Salter, A. Open for innovation: The role of openness in explaining innovation performance among U.K. manufacturing firms. Strateg. Manag. J. 2006, 27, 131–150. [Google Scholar] [CrossRef]
- Cainelli, G.; Mazzanti, M.; Montresor, S. Environmental innovativeness, local networks and internationalization. Ind. Innov. 2012, 19, 697–734. [Google Scholar] [CrossRef]
- Ghisetti, C.; Marzucchi, A.; Montresor, S. The open eco-innovation mode. An empirical investigation of eleven European countries. Res. Policy 2015, 44, 1080–1093. [Google Scholar] [CrossRef]
- Cohen, W.M. Empirical studies of innovation activity. In Handbook of the Economics of Innovation and Technological Change; Blackwell: Oxford, UK, 1995; pp. 342–365. [Google Scholar]
- Van Reenen, J. Employment and technological innovation: Evidence from U.K. manufacturing firms. J. Labour Econ. 1997, 15, 255–284. [Google Scholar] [CrossRef]
- Piva, M.C.; Vivarelli, M. Technological change and employment: Some micro evidence from Italy. Appl. Econ. Lett. 2004, 11, 373–376. [Google Scholar] [CrossRef]
- Pianta, M. Innovation and Employment. In Handbook of Innovation; Fagerberg, J., Mowery, D., Nelson, R., Eds.; Oxford University Press: Oxford, UK, 2003; Chapter 22. [Google Scholar]
- Greenan, N.; Guellec, D. Technological innovation and employment reallocation. Labour 2000, 14, 547–590. [Google Scholar] [CrossRef]
- Vaona, A.; Pianta, M. Firm size and innovation in European manufacturing. Small Bus. Econ. 2008, 30, 283–299. [Google Scholar] [CrossRef]
- García, A.; Jaumandreu, J.; Rodríguez, C. Innovation and Jobs. Evidence from Manufacturing Firms. Available online: http://people.bu.edu/jordij/papers/innovationc.pdf (accessed on 6 November 2017).
- Licht, G.; Peters, B. The Impact of Green Innovation on Employment Growth in Europe. Available online: http://www.foreurope.eu/fileadmin/documents/pdf/Workingpapers/WWWforEurope_WPS_no050_MS53.pdf (accessed on 6 November 2017).
- Dachs, B.; Peters, B. Innovation, employment growth, and foreign ownership of firms: A European perspective. Res. Policy 2014, 43, 214–232. [Google Scholar] [CrossRef]
- Bogliacino, F.; Pianta, M. Innovation and employment: A reinvestigation using revised pavitt classes. Res. Policy 2010, 39, 799–809. [Google Scholar] [CrossRef]
- Criscuolo, C.; Gal, P.N.; Menon, C. The Dynamics of Employment Growth; OECD Science, Technology and Industry Policy Papers; OECD: Paris, France, 2014; Available online: http://0-dx-doi-org.brum.beds.ac.uk/10.1787/5jz417hj6hg6-en (accessed on 6 November 2017).
- Klette, T.J.; Møen, J. R&D investment responses to R&D subsidies: A theoretical analysis and a microeconometric study. World Rev. Sci. Technol. Sustain. Dev. 2012, 9, 169–203. [Google Scholar]
- Mairesse, J.; Monhen, P. Using innovation surveys for econometric analysis. In Handbook of the Economics of Innovation; North Holland: Amsterdam, The Netherlands, 2010; Volume 2, pp. 1129–1155. [Google Scholar]
- Lachenmaier, S.; Rottmann, H. Effects of Innovation on Employment: A Dynamic Panel Analysis. Int. J. Ind. Organ. 2011, 29, 210–220. [Google Scholar] [CrossRef]
- Entorf, H.; Pohlmeier, W. Employment, Innovation and Export Activity in Microeconometrics: Surveys and Applications; Basil-Blackwell: Oxford, UK, 1990. [Google Scholar]
- Bernard, A.B.; Jensen, J.B. Why Some Firms Export. Rev. Econ. Stat. 2004, 86, 561–569. [Google Scholar] [CrossRef]
- Peters, B. Employment Effects of Different Innovation Activities: Microeconometric Evidence. Available online: ftp://ftp.zew.de/pub/zew-docs/dp/dp0473.pdf (accessed on 6 November 2017).
- Harrison, R.; Jaumandreu, J.; Mairesse, J.; Peters, B. Does Innovation Stimulate Employment? A Firm Level Analysis using Comparable Micro—Data from Four European Countries. Int. J. Ind. Organ. 2014, 35, 29–43. [Google Scholar] [CrossRef]
- Benavente, J.M.; Lauterbach, R. Technological Innovation and Employment: Complements or substitutes? Eur. J. Dev. Res. 2008, 20, 319–330. [Google Scholar] [CrossRef]
- Eiadat, Y.; Kelly, A.; Roche, F.; Eyadat, H. Green and competitive? An empirical test of the mediating role of environmental innovation strategy. J. World Bus. 2008, 43, 131–145. [Google Scholar] [CrossRef]
- Barney, J. Firm Resources and Sustained Competitive Advantage. J. Manag. 1991, 17, 99–120. [Google Scholar] [CrossRef]
- Ndofor, H.A.; Sirmon, D.G.; He, X. Firm resources, competitive actions and performance: Investigating a mediated model with evidence from the in vitro diagnostics industry. Strateg. Manag. J. 2011, 32, 640–657. [Google Scholar] [CrossRef]
- Oltra, V. Environmental Innovation and Industrial Dynamics: The Contributions of Evolutionary Economics. Available online: http://cahiersdugretha.u-bordeaux4.fr/2008/2008-28.pdf (accessed on 6 November 2017).
- Coad, A.; Hölzl, W. Firm growth: Empirical analysis in Handbook on the economics and theory of the firm. In 324 Handbook on the Economics and Theory of the Firm; Dietrich, M., Krafft, J., Eds.; Edward Elgar: Cheltenham, UK, 2008. [Google Scholar]
- Heckman, J.J. Instrumental Variables: A Study of Implicit Behavioral Assumptions Used in Making Program Evaluations. J. Hum. Resour. 1997, 32, 441–462. [Google Scholar] [CrossRef]
- Wooldridge, J.M. Econometric Analysis of Cross Section and Panel Data; The MIT Press: Cambridge, MA, USA, 2007. [Google Scholar]
- Demirel, P.; Kesidou, E. Stimulating different types of eco-innovation in the UK: Government policies and firm motivations. Ecol. Econ. 2011, 70, 1546–1557. [Google Scholar] [CrossRef]
- Demirel, P.; Li, Q.C.; Rentocchini, F.; Tamwada, J.P. Born to be green: New insights into the economics and management of green entrepreneurship. Small Bus. Econ. 2017. Available online: https://0-doi-org.brum.beds.ac.uk/10.1007/s11187-017-9933-z (accessed on 6 November 2017).
- Leoncini, R.; Marzucchi, A.; Montresor, S.; Rentocchini, F.; Rizzo, U. Better late than never: The interplay between green technology and age for firm growth. Small Bus. Econ. 2017. forthcoming. Available online: http://www.sustainability-seeds.org/papers/RePec/srt/wpaper/0616.pdf (accessed on 6 November 2017).
- Hockerts, K.; Wüstenhagen, R. Greening Goliaths versus emerging Davids—Theorizing about the role of incumbents and new entrants in sustainable entrepreneurship. J. Bus. Ventur. 2010, 25, 481–492. [Google Scholar] [CrossRef]
- Cuerva, M.C.; Triguero, A.; Córcoles, D. Drivers of green and non-green innovation: Empirical evidence in Low-Tech SMEs. J. Clean. Prod. 2014, 68, 104–113. [Google Scholar] [CrossRef]
- Christensen, J.L.; Hain, D.S.; Nogueira, L.A. Joining forces: Collaboration patterns and performance of renewable energy innovators. Small Bus. Econ. 2017. Available online: https://0-doi-org.brum.beds.ac.uk/10.1007/s11187-017-9932-0 (accessed on 6 November 2017).
- Porter, M.E.; van der Linde, C. Toward a new conception of the environment competitiveness relationship. J. Econ. Perspect. 1995, 9, 97–118. [Google Scholar] [CrossRef]
- Dechezleprêtre, A.; Sato, M. The Impacts of Environmental Regulations on Competitiveness; Policy Brief; Grantham Research Institute on Climate Change and the Environment & Global Green Growth Institute: London, UK, 2014. [Google Scholar]
Figure 1.
Factors influencing eco-innovation and employment growth.

Table 1.
Eco-innovators and non-eco-innovators distinguishing by size.
| Total Innovators | Total Innovative SMEs | Total Innovative Large Firms | |
|---|---|---|---|
| Eco-innovators | 2892 (47.19%) | 2101 (45.88%) | 791 (51.03%) |
| Non-eco-innovators | 3237 (52.81%) | 2478 (54.12%) | 759 (48.97%) |
| Total innovators | 6129 | 4579 | 1550 |
Table 2.
Variables in the model.
| Dependent Variables | |
| Eco-innovation | 1 if the innovative firm reports high or medium importance in “reducing environmental impact” as an objective of technological innovation during 2009–2011 0 if not |
| Employment growth | Log of the number of employees in the year 2011 less the log of the number of employees in the year 2010 |
| Explanatory Variables | |
| Resources | |
| Size | 1 if firm has 200 or more employees 0 if firm has less than 200 employees |
| Membership of a group | 1 if firm is membership of a group of firms 0 if not |
| Age | Years since the firm was established |
| Public financing (t − 1) | 1 if firm receives public financing for its internal R&D activity from local, national or regional administration and European Union in the previous period 0 if not |
| R&D intensity (t − 1) | Total expenditure in R&D activities over the total employees in the previous period |
| Export (t − 1) | 1 if firm is exporter in the previous period 0 if not |
| Technological Opportunities | |
| Sources of Knowledge | |
| Internal sources of knowledge (t − 1) | 1 if firm considers that information within the firm has been very relevant for its innovative activity in the previous period 0 otherwise |
| Vertical external knowledge sources (t − 1) | 1 if firm considers that information from providers and clients have been very relevant for its innovative activity in the previous period 0 otherwise |
| Competitors knowledge sources (t − 1) | 1 if firm considers that information from competitors have been very relevant for its innovative activity in the previous period 0 otherwise |
| Institutional knowledge sources (t − 1) | 1 if firm considers that information from laboratories, private institutes, universities, research public organizations or technological center have been very relevant for its innovative activity in the previous period 0 otherwise |
| Other external knowledge sources (t − 1) | 1 if firm considers that information from fairs, conferences, scientific publications or industrial associations have been very relevant for its innovative activity in the previous period 0 otherwise |
| Sector dummies | One dummy for each of the 37 sectors considered (manufacturing and services) |
| High-tech manuf. | 1 if firm belongs to a sector classified as High-tech manufacturing sector 0 otherwise |
| Low-tech manuf. | 1 if firm belongs to a sector classified as Low-tech manufacturing sector 0 otherwise |
| Medium-tech manuf. | 1 if firm belongs to a sector classified as Medium-tech manufacturing sector 0 otherwise |
| KIS | 1 if firm belongs to a sector classified as Knowledge-Intensive Services sector 0 otherwise |
| Low-KIS | 1 if firm belongs to a sector classified as Low-Knowledge-Intensive Services 0 otherwise |
| Instrumental Variables | |
| Eco-regulation | 1 if the innovative firm reports high or medium importance in “compliance with environmental, health or security requirements” as an objective of technological innovation during 2009–2011 0 if not |
| Energy savings | 1 if the innovative firm reports high or medium importance in “reducing energy used per produced unit” as an objective of technological innovation during 2009–2011 0 if not |
Table 3.
Descriptive statistics and mean difference test (Eco-innovators and non-eco innovators).
| Total Innovators | Eco-Innovators | Non-Eco Innovators | Mean Difference Test | ||||||||||
|---|---|---|---|---|---|---|---|---|---|---|---|---|---|
| (6129 Firms) | (2892 Firms) | (3237 Firms) | |||||||||||
| Mean | Std. Dev. | Min | Max | Mean | Std. Dev. | Min | Max | Mean | Std. Dev. | Min | Max | ||
| Employment growth | −0.0317 | 0.3411 | −7.002 | 2.197 | −0.0159 | 0.2590 | −5.46 | 2.076 | −0.0459 | 0.4001 | −7.002 | 2.197 | −5.14 *** |
| Size | 0.2528 | 0.4347 | 0 | 1 | 0.2735 | 0.4458 | 0 | 1 | 0.2345 | 0.4237 | 0 | 1 | −4.45 *** |
| Group | 0.4553 | 0.4980 | 0 | 1 | 0.4882 | 0.4999 | 0 | 1 | 0.4260 | 0.4945 | 0 | 1 | −10.12 *** |
| Age | 28.47 | 20.97 | 0 | 342 | 30.09 | 21.88 | 0 | 342 | 27.01 | 20.01 | 0 | 305 | −8.32 *** |
| RDint (t − 1) | 8168.7 | 22,703.5 | 0 | 637,484.1 | 10,518.8 | 28,600.0 | 0 | 637,484.1 | 6062.6 | 15,333.9 | 0 | 209,967.1 | −15.58 *** |
| Export (t − 1) | 0.7079 | 0.4547 | 0 | 1 | 0.7874 | 0.4092 | 0 | 1 | 0.6367 | 0.4810 | 0 | 1 | −22.47 *** |
| Public subsidies (t − 1) | 0.3909 | 0.4880 | 0 | 1 | 0.4920 | 0.5000 | 0 | 1 | 0.3003 | 0.4584 | 0 | 1 | −34.19 *** |
| Internal sources of knowledge (t − 1) | 0.6110 | 0.4875 | 0 | 1 | 0.6745 | 0.4686 | 0 | 1 | 0.5482 | 0.4977 | 0 | 1 | −14.21 *** |
| Vertical external knowledge sources (t − 1) | 0.4168 | 0.4931 | 0 | 1 | 0.4803 | 0.4997 | 0 | 1 | 0.3540 | 0.4783 | 0 | 1 | −15.12 *** |
| Competitors knowledge sources (t − 1) | 0.1327 | 0.3393 | 0 | 1 | 0.1583 | 0.3651 | 0 | 1 | 0.1074 | 0.3097 | 0 | 1 | −8.94 *** |
| Other sources of knowledge (t − 1) | 0.1137 | 0.3174 | 0 | 1 | 0.1455 | 0.3527 | 0 | 1 | 0.0822 | 0.2747 | 0 | 1 | −9.48 *** |
| Institutional knowledge sources (t − 1) | 0.1091 | 0.3119 | 0 | 1 | 0.1451 | 0.3523 | 0 | 1 | 0.0770 | 0.2666 | 0 | 1 | −19.63 *** |
| High-tech manuf. | 0.0571 | 0.2320 | 0 | 1 | 0.0681 | 0.2520 | 0 | 1 | 0.0473 | 0.2121 | 0 | 1 | −7.46 *** |
| Low-tech manuf. | 0.1644 | 0.3707 | 0 | 1 | 0.1888 | 0.3914 | 0 | 1 | 0.1427 | 0.3498 | 0 | 1 | −3.89 *** |
| Medium-tech manuf. | 0.3607 | 0.4803 | 0 | 1 | 0.4426 | 0.4968 | 0 | 1 | 0.2876 | 0.4527 | 0 | 1 | −15.53 *** |
| KIS | 0.1573 | 0.3641 | 0 | 1 | 0.1083 | 0.3107 | 0 | 1 | 0.2011 | 0.4008 | 0 | 1 | −5.74 *** |
| Low-KIS | 0.2604 | 0.4389 | 0 | 1 | 0.1923 | 0.3941 | 0 | 1 | 0.3213 | 0.4670 | 0 | 1 | 19.94 *** |
| Eco-regulation | 0.5146 | 0.4998 | 0 | 1 | 0.8571 | 0.3499 | 0 | 1 | 0.1661 | 0.3722 | 0 | 1 | −83.92 *** |
| Energy savings | 0.4110 | 0.4920 | 0 | 1 | 0.6569 | 0.1718 | 0 | 1 | 0.1601 | 0.3674 | 0 | 1 | −47.25 *** |
*** p < 0.
Table 4.
Drivers of eco-innovation (Probit Models with average marginal effects).
| (1) | (2) | |
|---|---|---|
| Size | 0.1063 *** | 0.1000 *** |
| (0.0152) | (0.0147) | |
| Group | 0.0212 * | 0.0263 ** |
| (0.1210) | (0.1208) | |
| Age | 0.0008 *** | 0.0008 *** |
| (0.0003) | (0.0002) | |
| RDint (t − 1) | 1.41 × 10−0.6 *** | 2.51 × 10−0.6 *** |
| (3.76 × 10⁻⁷) | (3.49 × 10⁻⁷) | |
| Public subsidies (t − 1) | 0.1443 *** | 0.1497 *** |
| (0.0117) | (0.0117) | |
| Export (t − 1) | 0.0369 *** | 0.0437 *** |
| (0.0136) | (0.0134) | |
| Internal sources of knowledge (t − 1) | 0.1177 *** | 0.1167 *** |
| (0.0111) | (0.0112) | |
| Vertical external knowledge sources (t − 1) | 0.0865 *** | 0.0874 *** |
| (0.0117) | (0.0118) | |
| Competitors knowledge sources (t − 1) | 0.0516 *** | 0.0487 *** |
| (0.0176) | (0.0177) | |
| Other external sources of knowledge (t − 1) | 0.0843 *** | 0.0874 *** |
| (0.0185) | (0.0186) | |
| Institutional knowledge sources (t − 1) | 0.0537 *** | 0.0710 *** |
| (0.0183) | (0.0183) | |
| Sector dummies | Yes | - |
| Low-tech manuf. 1 | 0.0468 * | |
| (0.0264) | ||
| Medium-tech manuf. 1 | 0.0687 *** | |
| (0.0245) | ||
| KIS 1 | −0.1983 *** | |
| (0.0271) | ||
| Low-KIS 1 | −0.0874 *** | |
| (0.0258) | ||
| Observations | 6866 | 6866 |
| LR chi2 | 1274.3 | 1142.85 |
| Prob > chi2 | 0.000 | 0.000 |
| Log likelihood | −4010.8 | −4076.6 |
1 Reference category: High-Tech sectors; * p < 0.10; ** p < 0.05; *** p < 0.01; standard errors in parentheses.
Table 5.
Drivers of employment growth (OLS and IV estimations).
| (1) | (2) | (3) | (4) | |
|---|---|---|---|---|
| OLS | OLS with Eco-Innovation | OLS with Interactions | Instrumental Variables 2SLS | |
| Eco-innovation | 0.0231 *** | 0.0448 | 0.0332 ** | |
| (0.00794) | (0.0296) | (0.0139) | ||
| Size | 0.112 *** | 0.110 *** | 0.159 *** | 0.112 *** |
| (0.0156) | (0.0154) | (0.0280) | (0.0123) | |
| Group | −0.029 *** | −0.0300 *** | −0.0649 *** | −0.0394 *** |
| (0.0111) | (0.0112) | (0.0206) | (0.0101) | |
| Age | −0.00196 *** | −0.00198 *** | −0.00316 *** | −0.00221 *** |
| (0.00057) | (0.000578) | (0.00115) | (0.000228) | |
| RDint (t − 1) | 5.75 × 10⁻⁷ *** | 5.35 × 10⁻⁷ *** | 8.56 × 10⁻⁷ *** | 4.74 × 10⁻⁷ ** |
| (1.78 × 10⁻⁷) | (1.76 × 10⁻⁷) | (2.63 × 10⁻⁷) | (2.11 × 10⁻⁷) | |
| Public subsidies (t − 1) | 0.00706 | 0.00325 | −0.00701 | 3.89 × 10⁻⁶ |
| (0.00838) | (0.00842) | (0.0144) | (0.00994) | |
| Export (t − 1) | 0.0363 *** | 0.0353 *** | 0.0543 *** | 0.0420 *** |
| (0.0119) | (0.0120) | (0.0196) | (0.0114) | |
| Internal sources of knowledge (t − 1) | 0.00098 | −0.00181 | 0.0400 *** | −0.000741 |
| (0.00848) | (0.00865) | (0.0148) | (0.00972) | |
| Vertical external knowledge sources (t − 1) | 0.0163 * | 0.0142 | 0.0612 *** | 0.0166 * |
| (0.00915) | (0.00938) | (0.0122) | (0.0100) | |
| Competitors knowledge sources (t − 1) | −0.000150 | −0.00130 | −0.0313 | −0.00679 |
| (0.0136) | (0.0133) | (0.0261) | (0.0145) | |
| Other external sources of knowledge (t − 1) | −0.00661 | −0.00866 | 0.0211 | −0.0107 |
| (0.0122) | (0.0123) | (0.0167) | (0.0151) | |
| Institutional knowledge sources (t − 1) | 0.00369 | 0.00196 | 0.0280 | 0.00279 |
| (0.0122) | (0.0122) | (0.0174) | (0.0150) | |
| Low-tech manuf. 1 | 0.0226 | 0.0218 | 0.0267 * | 0.0206 |
| (0.0138) | (0.0138) | (0.0144) | (0.0219) | |
| Medium-tech manuf. 1 | 0.0270 ** | 0.0255 * | 0.0338 ** | 0.0266 |
| (0.0132) | (0.0132) | (0.0140) | (0.0202) | |
| KIS 1 | −0.00205 | 0.00239 | 0.00429 | 0.00976 |
| (0.0158) | (0.0159) | (0.0170) | (0.0223) | |
| Low-KIS 1 | −0.0614 *** | −0.0591 *** | −0.0591 *** | −0.0616 *** |
| (0.0188) | (0.0186) | (0.0195) | (0.0213) | |
| Eco-innovation*size | −0.0908 *** | |||
| (0.0305) | ||||
| Eco-innovation*group | 0.0461 * | |||
| (0.0240) | ||||
| Eco-innovation*age | 0.00180 | |||
| (0.00123) | ||||
| Eco-innovation*RD | −6.44 × 10⁻⁷ *** | |||
| (2.43 × 10⁻⁷) | ||||
| Eco-innovation*public subsidies | 0.00554 | |||
| (0.0176) | ||||
| Eco-innovation*export | −0.0458 | |||
| (0.0281) | ||||
| Eco-innovation*internal sources | −0.0354 * | |||
| (0.0184) | ||||
| Eco-innovation*vertical sources | −0.0401 ** | |||
| (0.0169) | ||||
| Eco-innovation*competitor sources | −0.00689 | |||
| (0.0343) | ||||
| Eco-innovation*other sources | −0.0288 | |||
| (0.0220) | ||||
| Eco-innovation*institutional sources | −0.0255 | |||
| (0.0218) | ||||
| Observations | 6866 | 6866 | 6084 | 5914 |
| F-test | 6.24 | 5.93 | 3.08 | Wald chi = 238.48 |
| Prob > F | 0.000 | 0.000 | 0.000 | 0.000 |
1 Reference category: High-Tech sectors; * p < 0.10; ** p < 0.05; *** p < 0.01; standard errors in parentheses. 2 Interaction terms among Eco-innovation and explanatory variables that are not significant have not been showed to save space.
Table 6.
Drivers of eco-innovation and employment growth by size.
| <200 Employees | ≥200 Employees | |||
|---|---|---|---|---|
| Eco-Innovation | Employment Growth | Eco-Innovation | Employment Growth | |
| Eco-innovation | 0.029 8 *** | 0.0146 | ||
| (0.00957) | (0.0143) | |||
| Group | 0.0290 ** | −0.0292 ** | 0.0023 | −0.00271 |
| (0.0133) | (0.0127) | (0.0291) | (0.0133) | |
| Age | 0.0011 *** | −0.00356 *** | 0.0006 | −0.000323 ** |
| (0.0004) | (0.00104) | (0.0004) | (0.000164) | |
| RDint (t − 1) | 2.39 × 10⁻⁶ *** | 5.07 × 10⁻⁷ *** | 2.97 × 10⁻⁶ ** | 4.33 × 10⁻⁷ |
| (3.72 × 10⁻⁷) | (1.95 × 10⁻⁷) | (1.17 × 10⁻⁶) | (2.99 × 10⁻⁷) | |
| Public subsidies (t − 1) | 0.1426 *** | 0.0142 | 0.1530 *** | −0.0121 |
| (0.0134) | (0.0103) | (0.0243) | (0.0114) | |
| Export (t − 1) | 0.0390 ** | 0.0535 *** | 0.0474 | −0.00650 |
| (0.0152) | (0.0153) | (0.0291) | (0.0139) | |
| Internal sources of knowledge (t − 1) | 0.1170 *** | −0.000666 | 0.1087 *** | −0.00731 |
| (0.0127) | (0.0105) | (0.0236) | (0.0116) | |
| Vertical external knowledge sources (t − 1) | 0.0904 *** | 0.0105 | 0.0879 *** | 0.0129 |
| (0.0135) | (0.0117) | (0.0242) | (0.0124) | |
| Competitors knowledge sources (t − 1) | 0.0502 ** | 0.00370 | 0.0380 | −0.0189 |
| (0.0199) | (0.0166) | (0.0386) | (0.0133) | |
| Other external sources of knowledge (t − 1) | 0.0852 *** | −0.00651 | 0.1078 *** | −0.0195 * |
| (0.0212) | (0.0155) | (0.0389) | (0.0110) | |
| Institutional knowledge sources (t − 1) | 0.0598 *** | 0.00639 | 0.0896 ** | 0.000396 |
| (0.0273) | (0.0154) | (0.3917) | (0.0131) | |
| Low-tech manuf. 1 | 0.0766 ** | 0.0301 ** | −0.0497 | 0.00882 |
| (0.0304) | (0.0151) | (0.0551) | (0.0346) | |
| Medium-tech manuf. 1 | 0.0852 *** | 0.0286 ** | 0.0361 | 0.0163 |
| (0.0283) | (0.0137) | (0.0516) | (0.0347) | |
| KIS 1 | −0.1549 *** | −0.0235 | −0.3091 *** | 0.0382 |
| (0.0317) | (0.0179) | (0.0546) | (0.0381) | |
| Low-KIS 1 | −0.0439 | −0.0903 *** | −0.1927 *** | −0.000803 |
| (0.0302) | (0.0230) | (0.0520) | (0.0343) | |
| Observations | 5319 | 5319 | 1547 | 1547 |
| LR chi2 = 729.02 | F test = 3.63 | LR chi2 = 380.14 | F test = 1.09 | |
| Prob > chi2 = 0.000 | Prob > F = 0.000 | Prob > chi2 = 0.000 | Prob > F = 0.363 | |
| Log likelihood = −3183.3 | Log likelihood = −882.1 | |||
1 Reference category: High-Tech sectors; * p < 0.10; ** p < 0.05; *** p < 0.01; standard errors in parentheses.
© 2017 by the authors. Licensee MDPI, Basel, Switzerland. This article is an open access article distributed under the terms and conditions of the Creative Commons Attribution (CC BY) license (http://creativecommons.org/licenses/by/4.0/).
Share and Cite
MDPI and ACS Style
Triguero, Á.; Cuerva, M.C.; Álvarez-Aledo, C. Environmental Innovation and Employment: Drivers and Synergies. Sustainability 2017, 9, 2057. https://0-doi-org.brum.beds.ac.uk/10.3390/su9112057
AMA Style
Triguero Á, Cuerva MC, Álvarez-Aledo C. Environmental Innovation and Employment: Drivers and Synergies. Sustainability. 2017; 9(11):2057. https://0-doi-org.brum.beds.ac.uk/10.3390/su9112057
Chicago/Turabian StyleTriguero, Ángela, María C. Cuerva, and Carlos Álvarez-Aledo. 2017. "Environmental Innovation and Employment: Drivers and Synergies" Sustainability 9, no. 11: 2057. https://0-doi-org.brum.beds.ac.uk/10.3390/su9112057
Note that from the first issue of 2016, this journal uses article numbers instead of page numbers. See further details here.