Sustainable Governance for the Opened Electric Vehicle Charging and Upgraded Facilities Market


1
Academy of Mathematics and Systems Sciences, Chinese Academy of Sciences, Beijing 100190, China
2
School of Economics and Management, University of Chinese Academy of Sciences, Beijing 100190, China
3
Key Laboratory of Big Data Mining and Knowledge Management, Chinese Academy of Sciences, Beijing 100190, China
4
School of Economics, Renmin University of China, Beijing 100872, China
5
School of Finance, Renmin University of China, Beijing 100872, China
6
Research Center on Fictitious Economy and Data Science, Chinese Academy of Sciences, Beijing 100190, China
7
Institute of Energy, Environment and Economy, Tsinghua University, Beijing 100084, China
8
China Automotive Energy Research Center, Tsinghua University, Beijing 100084, China
*
Authors to whom correspondence should be addressed.
Sustainability 2017, 9(11), 2126; https://doi.org/10.3390/su9112126
Submission received: 26 September 2017
/
Revised: 13 November 2017
/
Accepted: 15 November 2017
/
Published: 18 November 2017
(This article belongs to the Special Issue New Governance Model and Strategy to Improve a Sustainable Transport System)
Abstract
:Since the China State Grid opened the market for infrastructure construction of electric charging stations and allowed Tesla, Potevio, BAIC BJEV and other enterprises to provide their own charging stations and other infrastructure construction, the development of electric vehicles has been greatly affected. How to maintain a sustainable governance in the opened electric vehicle charging and upgraded facilities market is an important policy issues. This paper presents a monopolistic competition model for the differentiated products market and addresses several issues related to Cournot equilibrium to illustrate why the expected free market actually operates in a monopolistic competition market structure. The analytic solution of the model shows that whether the extent of firm entry is insufficient, excessive or optimum is determined by consumers’ time preference, level of production differentiation and features of cost structure, including fixed cost and marginal cost. The sensitivity analysis has been performed among the above factors and tracked some other factors which would determine the effect of the new policy issues. The main policy suggestion is that the government should optimize entry regulations and lay down the criterion of charging interface standards for charging stations to avoid the electric vehicle charging and upgraded facilities marketization process of a one-size-fits-all solution and form a monopolistic competition market.
1. Introduction
The State Grid has received much praise since it announced the opening of the market of infrastructure construction of electric charging stations and gave social capital the right to build their own charging electric stations on 27 May 2014. This announcement was good news for many electric vehicle (EV) producers, such as Tesla, who can build and arrange their network of electric charging stations offering charging services for their electric vehicles, contributing to their market share of electric vehicles.
In May 2014, the State Grid Corporation of China opened the electric vehicle charging and upgraded facilities market; the parties actively participating in the charging infrastructure construction industry formed two ways of building public electrical vehicle charging stations. One way was though power supply firms, where the State Grid Corporation of China played the main role; they were responsible for the construction of electrical vehicle charging stations along inter-city highways. The other way was though social capital, including the Central Enterprise, which was represented by the State Grid Corporation of China; Sinopec; Potevio; State-owned enterprises such as BAIC BJEV, Beijing Energy Investment Holding and Huashang Sanyou; and private enterprises such as Tellus, TGOOD, Ueee, Chargerlink and Dianzhuang, as well as foreign invested enterprises such as Tesla.
In addition to the welcoming of electric vehicles producers, average citizens also spoke well of this revolution because of the general perception that entry of the new firms into the market have enhanced competition and improved social welfare. To most people who have slight knowledge of economics, it is believed that opening the market to all potential participators benefits the consumer most because the prior monopoly market of infrastructure construction for electric charging stations gave way to a market with numerous competitors. An increase of competition in a monopoly market usually improves the efficiency of the market and the welfare of consumers. In differentiated product industries, an additional attractive feature of more firms is an increase in product variety, which directly increases consumer surplus.
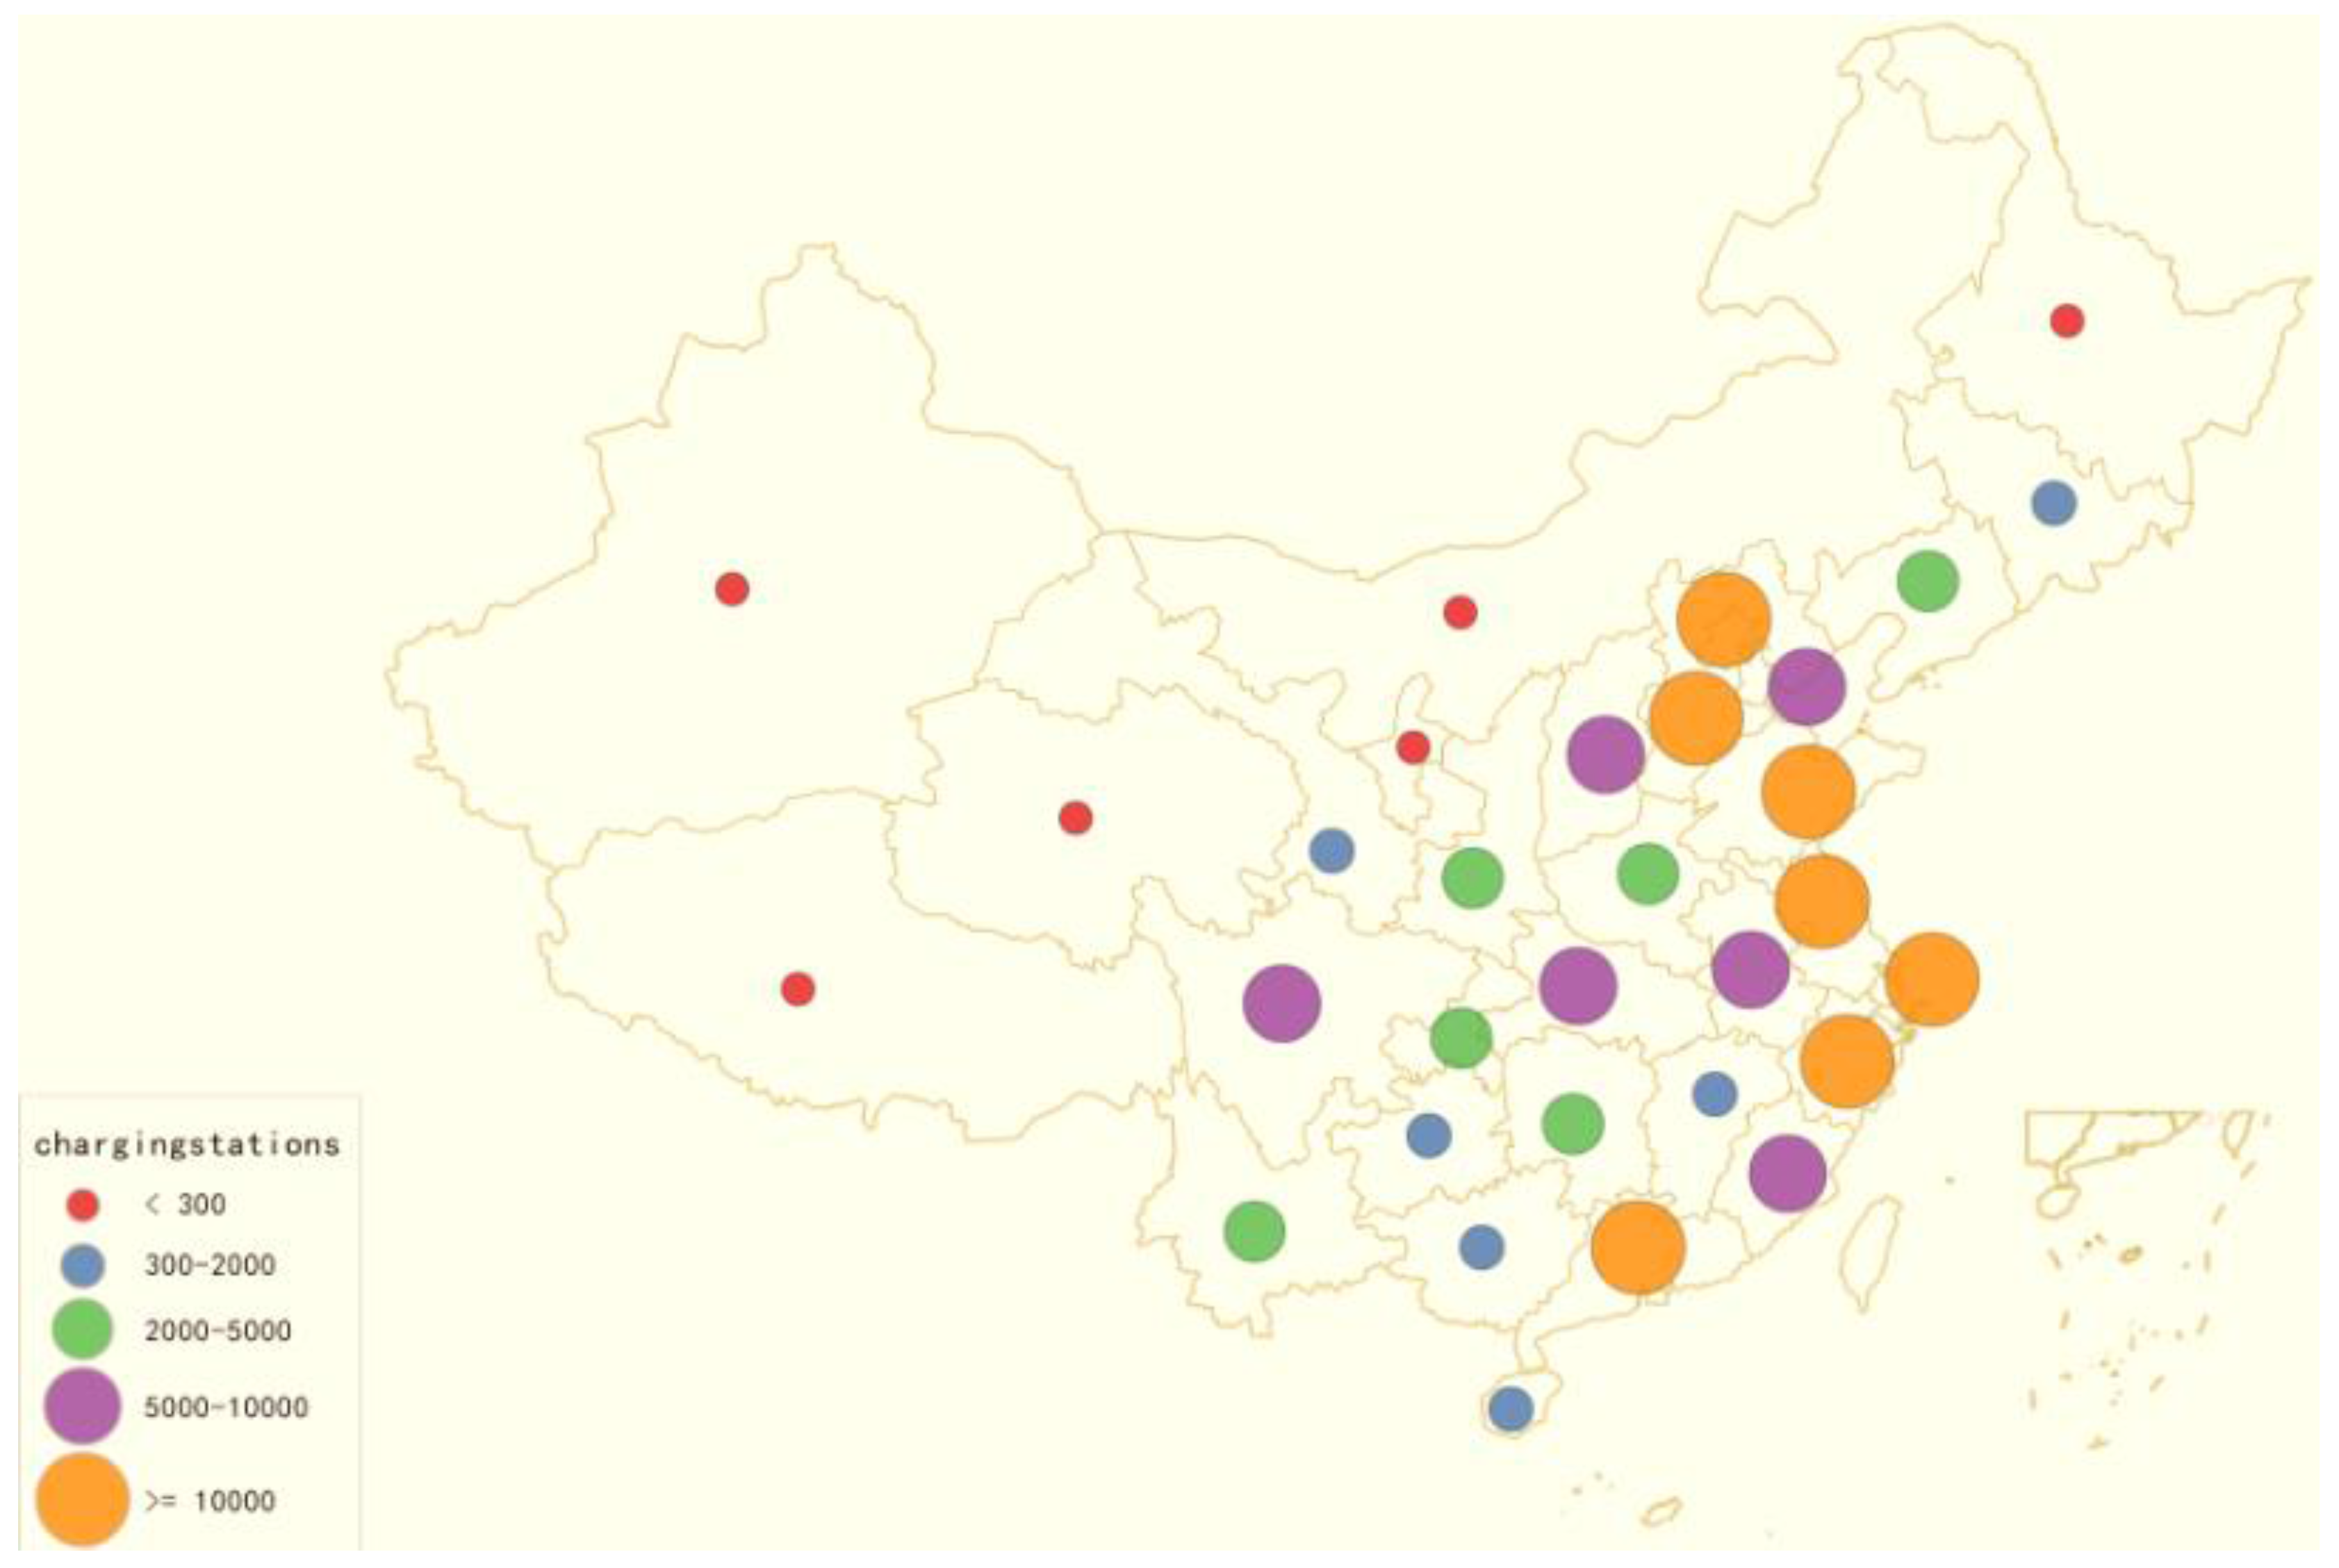
However, we are afraid that the public is overly optimistic regarding it. First, we should pay attention to the difficult position of charging pile construction and development. According to the studies by Becker et al. [1], Zhang et al. [2] and Wu et al. [3], the main bottleneck in the development of new energy vehicles (NEVs) in China is the serious lag in pile construction and the uneven distribution of regions. In Beijing, Shanghai, the Zhejiang urban agglomeration, Guangdong and other regions, the charging pile construction is more numerous than other areas. The western region and the northeastern region of the charging pile construction has been slower (shown in Figure 1), and this situation has not obtained significant improvements with the rapid development of NEVs in recent years. It is obvious that the opening of market for infrastructure construction is not the decisive way for the increasing the NEV industry. Policy-makers have to take some new actions to solve the above problems and to promote the sustainable development of NEV market.
According to the China Association of Automobile Manufacturers’ data, in 2012, China’s new energy vehicle production was 12,552 in total, and the new energy vehicle public charge pile was 18,000 in total. However, from the development of new energy vehicles and charging piles from 2012 to 2016, the production number and sales number of China’s new energy vehicles have increased much faster than the speed of charging pile construction. On the one hand, it reflects the lagging construction of the piles; on the other hand, it also indicates the development of new energy vehicles has caused the potential demand for piles, particularly with the difficulty in achieving a breakthrough in battery technology. The allocation of the changing pile is a key problem. In accordance with the standard of one car one pile, the demand and supply gap concerning piles is huge, as shown in Figure 2.
The electric vehicle charging and facilities market is a highly differentiated, in which there are many different types of power-charging connectors, and every type of charging pile with a particular connector can only match the specific devices with the same connector design. To enhance market share, each EV firm tends to develop its own connector and build charging piles that match its EVs only, and EVs of other firms or brands cannot be charged on the charging pile it builds. When each firm does this, every brand of EVs requires a specific charging pile, and every charging pile offers service to only one brand of EVs. It is natural to question whether this strategy will induce an unnecessary waste of the construction of charging stations. According to incomplete statistics, the current domestic mainstream electrical vehicle charging station business has more than ten firms, including the State Grid Corporation of China, Potevio, TeslaTeld, Star Charge, Southern China Power Grid, Sinopec, Echongwang, Tellus, iCharge, Ueee, Chargerlink, and Dianzhuang, but these enterprises cannot achieve interconnection, as power interface, voltage and other standards are not unified, even if the China Electricity Council issued a “Electric Vehicle Charging Service Information Exchange”, which still cannot unify the platform of the pile with the pile standards; differentiated products help their enterprises build a threshold for entering the branch market, forming a monopoly. Moreover, Tesla has officially announced its charging standards are $0.27/kW h in Mainland China in 15 January 2017, which means Tesla announced the end of the policy of free lifetime charging. In fact, opened and excessive competitive market results in the waste of resources and is gradually becoming a hindrance for the sustainable development of NEV industry.
Despite the concern of a loss of efficiency resulting from the redundant construction of charging stations, some may argue that there still exists some promise that the market will end up with a socially optimal competition—neither too much nor insufficient—with free entry. Firms will drop out of the market if there is too much competition causing loss to them, while they will be attracted to the market if they can earn a positive profit. As long as there are no barriers for firms to enter or exit the market, efficiency can be achieved.
Therefore, our research investigates the question whether the free competition, introduced to the market of infrastructure construction of electric charging stations, will be beneficial. We attempt to give some suggestions for sustainable governance for the oncoming opened electric vehicle charging market, based on our theoretical and empirical analyses. This paper is important for feasibility analysis of electric vehicle charging facility market.
Researchers have conducted some studies on free entry. In the earlier literature regarding free entry, Novshek [4] proved that, if firms are small relative to the market, then the Cournot equilibrium with free entry is approximately perfectly competitive (Pareto optimal). Hart [5] obtained the same conclusion in a differentiated product market.
Later, some scholars have found free entry can be socially excessive under Cournot oligopoly in a homogenous product market when fixed cost exists [6]; some even distinguish the “business-stealing” effect, which contributes to the excessive entry [7]. The same results can be found when incorporating it into cost reducing R & D investment [8]. These findings contribute to the famous “excessive-entry theorem”, based on which there have been many competition policies to avoid the excessive entry of firms.
However, some other scholars have found that the “excessive-entry theorem” is not as robust as it seems and there are some situations where free entry can result in insufficient entry. For example, Spence [9] and Dixit and Stiglitz [10] found that monopolistic competition can result in insufficient entry relative to the social optimum in a differentiated market. Ghosh and Morita [11,12] obtained the same finding when incorporating vertical relationship between industries and bargaining power. Mukherjee [13] considered the market with leaders and concluded that entry is socially insufficient without scale economies. The same conclusion can be obtained when incorporating into it external economies of scale [14], foreign firms [15] and uncertainty that some entrants who incur entry costs fail to enter a market [16]. These discoveries show concerns regarding the anti-competitive entry regulations.
In addition to the theories above, there are also some empirical analyses toward this issue, such as the study conducted by Berry and Waldfogel [17], which shows that, in differentiated product market-radio broadcasting, the number of radio stations under free entry is found to be socially excessive and the welfare loss of free entry is estimated to be 45% of industry revenue.
The literature on the construction of EV charging infrastructure can be summarized in three research directions. First is to focus on charging infrastructure integration. Liu [18] evaluated the approximate demand of charging at an early EV market in Beijing and suggested an assignment model to distribute charging infrastructure. From the author’s point of view, charging posts will play a major role in a charging network, integrating the fast charging stations and battery swap stations. In addition, to minimize the load variation among fast charging stations, the author proposed a 2-km service radius for fast charging stations. He et al. [19] formulated a VII-based (Vehicle-Infrastructure Integration) prediction algorithm for a VII-enabled vehicle framework. In this framework, network analysis was conducted to show cost-effectiveness. As alternate methods, the cost-effectiveness of increased battery capacity versus non-domestic charging infrastructure installations for plug-in hybrid electric vehicles (PHEVs), to reduce gasoline consumption for cars, trucks, and SUVs in the US, was estimated by Peterson and Michalek [20]. They concluded that making more drivers switch to low-capacity PHEVs and Hybrid Electric Vehicles is the lowest cost solution. Furthermore, according to Schroeder and Traber [21], investment in public fast charging is risky for private investment. Private investment is driven seemingly by other than pure project prospects at current EV penetration rates into public fast charging infrastructure. If grid tariffs are not exempted or constant high demand is not assured, private investment will definitely renew the financing of investment into public fast charging. More incentives need to be created by the spreading of alternative home-charging devices and alternative propulsion technologies. Colmenar-Santos et al. [22] proposed the minimum requirement of fast charging infrastructure, which allows countrywide inter-urban EV mobility to join. Some scholars have paid attention to the field of life-cycle analysis of charging infrastructure for EVs, but they have focused on the planning method and the investment requirements. Nansai et al. [23] argued that, in terms of CO2, NOx, and CO emissions, the advantage of EV compared to gasoline vehicles (GVs) is the emissions. An EV emits more life-cycle SOx than GVs. However, this almost remains unchanged with the development of the charging infrastructure. Morrissey et al. [24] found that in the short to medium term, fast charging will most likely become commercially viable because EV users prefer to charge at home in the evening at peak demand times.
Taking different opinions into consideration, it is worthwhile to devote some effort to explore the outcome of the freeing of a differentiated market, the market of infrastructure construction of electric charging stations to be specific. Will the benefit of competition introduced overcome the waste of redundant construction? Will the market end up with excessive entry? Can a social optimum be achieved by free entry; that is, can the social welfare be maximized in this way? What are the effective and sustainable policies for the policy-makers to keep the sustainable development of NEV market? These questions are what we are trying to answer in this paper, since climate change and carbon emissions have become important issues in the field of global transport [25,26].
The remainder of the paper is organized as follows. Section 2 presents a monopolistic competition model for the differentiated products market. Section 3 presents an analytic solution, explores the welfare effect of free entry in the market of electric charging stations and determines the key factors. Section 4 discusses the results of the sensitivity analysis and analyzes the core effect. Section 5 concludes and presents several implications for the development of the electric vehicle charging and upgraded facilities market.
2. Materials and Methods
Following the literature above, we find that there is no definite answer to the question of whether the EV firms’ entry is insufficient or excessive depending on the specific market structure. Considering the special characteristics of the electrical charging station market, it is necessary to identify the result of the action the State Grid had taken and give some highlight to policy makers.
2.1. The Problem of Representative Consumer
In this section, following Dixit and Stiglitz [10], Spence [27] and Koenker and Perry [28], we have made an extension of the model and introduce quality of product into the consumer preference. Then, we explore the welfare effect of free entry in the market of electric charging stations by establishing a monopolistic competition model of the differentiated products market, and find that there is no certainty that the entry may be insufficient, excessive or optimum with different settings of parameters. Consider a representative electric vehicle consumer’s problem:
where is the quantity consumed of a benchmark good or numeraire, and are the consumption and price of differentiated good i, and y is the disposable income of a representative consumer. In this model, product differentiation comes from different EV manufacturers’ use of different charging protocols and producing different charging stations, resulting in firm A’s vehicle being unable to charge on firm B’s charging pile. Thus, is quantity of a composite of differentiated EV industry, where n is the range of charging modes available; , which is greater than 1, measures the elasticity of any two types of differentiated products; and , which is between 0 and 1, measures the elasticity between the numeraire and EV industry of differentiated products.
Worthy of further explanation, we introduce the numeraire to avoid the quantity and marginal utility of other products to be infinite. The price of the numeraire, which is set to be 1, is fixed; thus, the marginal utility is also fixed. Then, EV firms producing other products would not produce too much because, once they do that, the price of their products will go down infinitely small relative to that of the numeraire, which will be harmful to their profits. Therefore, there will exist a maximum output, which would not approach infinity and be comparable with the quantity of the numeraire . Since the marginal utility of a product decreases in its output, the marginal utility of other products will not decrease indefinitely.
As for the economic meaning of , we can take it as the remaining currency a consumer holds for the next period after making the purchase today. The initial wealth of an EV consumer is y, and he decides how much to spend on the differential products and how much currency to keep for next period because, in the welfare function, is the utility brought by the currency remaining. Thus, the consumption decision the consumer makes is the allocation of wealth between the current period and the next period, and, as long as consumer makes a choice, the charging mode of EV is determined. The tradeoff here is that, if the consumer spends more money in the current period, causing an increase in the welfare with a weight of , less will remain for tomorrow, leading to a decrease in welfare, with a weight of .
2.2. The Concavity of the Utility Function
To ensure diminishing marginal utility of EV consumer, we need , . That is,
It is obvious that holds literally. For , rearranging the expression, we have to ensure .
Proof.
Since is greater than 1 for and , as long as , that is, , we have . ☐
The original maximization problem is equivalent to
where is the price index of differentiated products (e.g., differentiated charging interfaces), which is defined as Equation (7).
FOC:
Equation (3) shows that the percentage of the consumer’s income spent on composite products is fixed, to be specific. We first adopt a composite good, which is made up of the differentiated products, and the numeraire to solve the maximizing problem. Finding that the expenditure on the composite good takes up a constant percentage of the disposable income of the representative consumer, we next maximize the utility of composite good subject to the budget constraint . Therefore, the original maximization problem is equivalent to:
According to the definition of , the marginal utility of any consumption of charging pile i is always positive; thus, the consumer will exhaust his budget, which means the constraint in Equation (4) is binding.
Using the Lagrangian approach, we obtain the two first order conditions as follows:
Plugging the first expression in Equation (5) into the second expression, we obtain , which is plugged back into the first expression of Equation (5), and we obtain the demand function of the consumer on product i:
Substituting in with Equation (6), and combining with , the price of the composite good is:
2.3. The Problem of EV Producers
In line with assumption in Koenker and Perry [28], assume , where c is a constant, characterizes feature of marginal cost in production, and e is a constant fixed cost for EV industry, i.e., the infrastructure construction of electric charging stations has an access threshold. Then,
First order condition yields:
Define demand electricity as , and rearrange Equation (8); we have:
In an oligopoly market, where the number of EV firms is relatively small, the behavior of individual firms has an impact on the entire market. In brief, it reflects monopoly power, the competitiveness of the model is reflected by the elasticity of substitution, and monopoly is the impact of a single firm on the market. By Equation (6), we can further derive that:
Thus,
According to the definition of demand elasticity, we have:
In equilibrium, all firms are symmetrical. Thus, combine with Equation (9):
Substitute q in Equation (14) with ,
Rearrange Equation (15)
3. Results
3.1. The Equilibrium in the Long Run
Firms are permitted to enter the EV market freely; thus, in the long run, . Plugging and into firms’ profit, we can solve for the equilibrium number of EV firms ne, in the long run.
3.2. The Result of First Best
FOC:
Rearrange the first expression in Equation (19), and we obtain .
Plugging into the second expression of Equation (19):
According to Equation (20), . We can see the relationship between social optimal price and number of firms (in other words, it represents the diversity of charging modes). Obviously, when the number of firms increases, price will decrease.
Combining Equations (20) and (19), we can solve the social optimum:
If ε is small enough, converging to zero for example, we have a diminishing marginal production cost. In this case, it is optimal to have only one firm in the EV market. However, both and will be negative then, which is impossible for the extraction of the square root. Thus, we assume that , i.e., .
3.3. Discuss the Result of First Best
As for discussing the result of social optimum, we need to compare the magnitude of and . The former, , is the elasticity of substitution in the utility function, which represents the preference of the EV consumer on inter-temporal consumption and determines the utility of today’s consumption. The latter, , characterizes the feature of marginal cost in production. A larger means increasing marginal production costs. The tradeoff here is that, if the consumer cares more about current consumption, then he will spend more on the differentiated products; thus, output in equilibrium will increase. However, along with the increase in output, production costs might increase as well (it might not in some circumstances, depending on the magnitude of ), which act as a negative factor in social welfare. Therefore, the socially optimal solution relies on the magnitude relationship between and .
- (1)
- If , then is sure to be greater than , i.e., , and then, the equilibrium firms’ number decreases in firms’ fixed production costs. Intuitively, the consumer cares more about consumption for the next period than the current one when is small. Since , which measures how small the benefit of differentiation is because is the elasticity of substitution between differentiated charging piles, is relatively greater than , the benefit brought by differentiation is not large enough to overcome the increased fixed costs accompanying the new firm’s entry. Thus, the optimal number of charging station manufacturers in the differentiated industry, , decreases in fixed costs , which is consistent with the claims in most literature considering no differentiation (i.e., unify the charging standards).
- (2)
- If is between and , i.e., , then both and are positive and the socially optimal firm number n increases as the fixed cost increases, which seemingly contradicts the views in most of the literature. However, this can be explained from two aspects:
(2-1) Because the benefit brought by differentiation is significant when products are quite different from each other, since , i.e., is small, the benefit of one more firm entering the EV market outweighs the fixed costs of that new firm. Thus, it is worthwhile to encourage more firms to enter this market even if society will encounter an inefficiency with fixed cost. In fact, the sign of shows the effect of firms’ number on the marginal utility of the consumer. When symmetric, the monotone of with respect to n is related with the sign of the exponent of n, i.e., . When , i.e., , the marginal utility of the consumer increases in . However, the number of firms will not increase to infinity. The reason is as follows.
When the firms’ number increases, not only the fixed costs of the entire EV industry, ne, increases, but the optimal production of each firm, , will also change. For example, when there are many more firms in the EV market, the optimal production of each firm, , will surely decrease, which will reduce the utility of the EV consumer, and thus welfare reversely. Considering these, there must exist an optimal number of firms, instead of the number approaching infinity.
In summary, the effect of new entry on the utility of the consumer can be broken down to two channels. One is realized through consumption, namely, the output of each firm, , and the other one is through the variety of products, i.e., the number of firms, . Social welfare will increase in both the output of each firm, , and firms’ number, . When fixed costs increase, the loss caused by encountering fixed costs and the reduced output per firm can be offset by the increase in firms’ number, . However, this offset is unsustainable with the infinite increase in thus, the optimal number of firms will not approach infinity.
(2-2) In the view of the cost of management: when is large, accompanying the increase in marginal cost, the negative effect of the increase in the cost of the access of multiple firms is offset by the cost savings of the integration of two or more firms; the firm number of the socially optimal therefore will be larger.
- (3)
- When is large and , two exponents in are of opposite sign, and, in equilibrium, firms’ number decreases in firms’ fixed production costs.
We can understand this result by examining the effect of fixed cost on . With a higher fixed cost , the optimal output of each firm, , also increases, which offsets the loss caused by the reduced firm number.
Furthermore, let us pay some attention to , which reflects the feature of the marginal cost of production. If is large, the optimal number of firms will increase, and the output of each firm will decrease. Specifically, taking as an example, it is reasonable to expect each firm produces less since the marginal cost of production is large, which results in more firms being required to satisfy the demand of the consumer. In contrast, when is small, there will be fewer firms in the EV market, and each will produce more.
The last thing needed to be clarified is that here, in the welfare function, we take as a function of , and the social planner makes the decision over and , the result of which is not different from that of the social planner choosing and without replacing with . Namely, the two problems below are equivalent:
Proof.
The second maximization problem of the social planner in Equation (22) is:
By symmetry, the first order condition of maximizing welfare is:
With the two expressions in Equation (24), we can obtain the same solution with that of Equation (21). ☐
3.4. Compare the Equilibrium in the Long Run and the Social Optimum
Because of the complexity of the result in Equation (17), we compare and indirectly by exploring the monotone of profit regarding the number of EV firms, n.
The profit function of firm is ; thus,
Since , we have
According to Equation (26), as long as the number of EV firms is greater than 1, holds; thus, profit monotonically decreases in firms’ number .
We know that firm’s profit in equilibrium in the long run is zero; thus, as long as we know firm’s profits under first best, we can conclude whether the entry is excessive or insufficient. Specifically, if firms’ profits under first best are greater than zero, then there are fewer firms in the social planner’s plan than in equilibrium, leading to less competition; thus, firms earn a positive profit. In contrast, if firms’ profits are negative in the social optimum, then there must be overly intensive competition for firms, which is caused by too many firms entering the EV market, thus, over entry.
To prove this, substitute Equation (21) and into Equation (8), and calculate firms’ profits in the social optimum; we obtain
For the first best, if > 0, the EV firm should have a positive profit in the social optimum, while the profit of the EV firm should be zero under free entry equilibrium, which is found to be socially excessive entry. Conversely, monopolistic competition yields insufficient entry from a social viewpoint when < 0.
4. Discussion
Equation (27) shows that the sign of is determined by many parameters, such as time preference , level of differentiation and features of cost structure , and , leaving uncertainty with respect to the questions of whether firms’ profit is positive or negative and whether there is excessive or insufficient entry in the market. Here, we conduct a series of sensitivity analyses to show that there is indeed not a determined answer to these questions.
4.1. Sensitivity Analysis of Consumer Time Preference
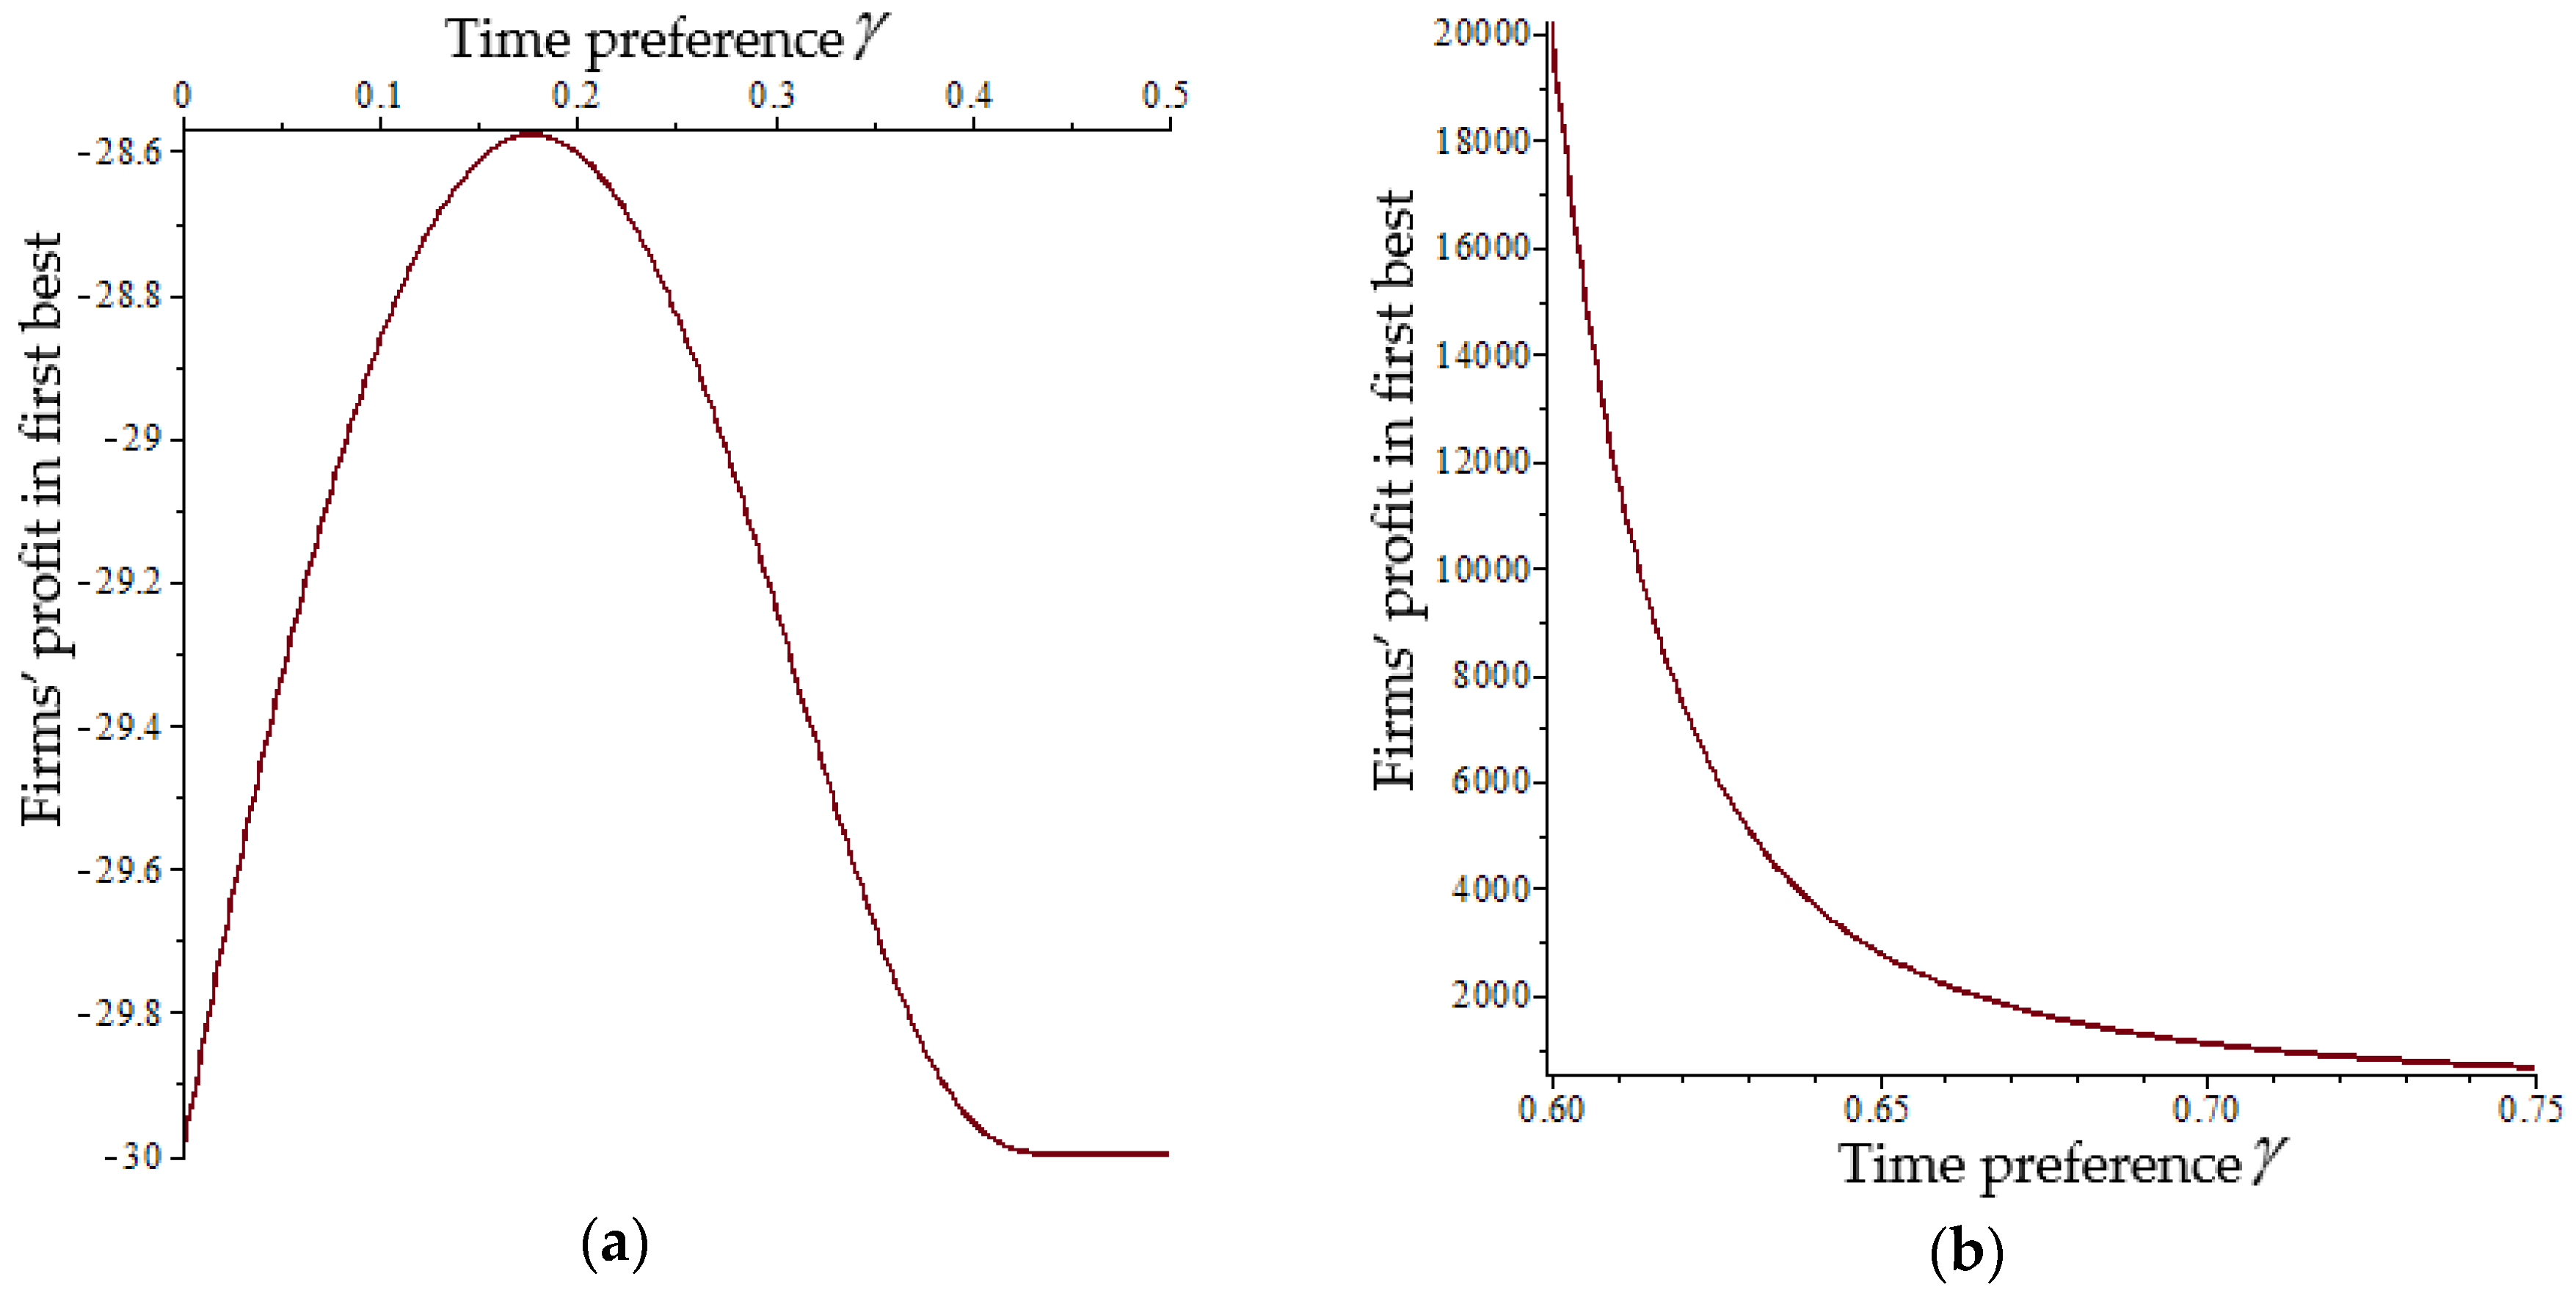
Consider the two cases of we have discussed in Section 3.3; we find that, when , firms’ profit in first best is negative; thus, there is insufficient entry in the long-term equilibrium, as is shown in Figure 3a. While firms’ profit in first best is positive, there is excessive entry in the long-term equilibrium when , as is shown in Figure 3b. This result shows that the EV consumer time preference γ has a threshold, which describes the EV consumer’s time inconsistency that the consumer values highly today’s consumption when is larger. Due to shortsighted behavior, firms will excessively enter the EV market when consumers pay more attention on today’s consumption.
Here, we just show the case when marginal production cost is diminishing, i.e., . We also explore the case when and , finding that the conclusion is robust.
The sensitivity analysis tells us that, when the consumer values the consumption of today more than that of the next period, i.e., is relative large, then firms’ profits are usually positive, which means fewer firms are preferred in the view of the social planner. Therefore, in equilibrium, firms’ number is usually excessive with free entry.
From the sensitivity analysis of , we find that the sign of might be quite different when is located in different intervals. Thus, the following analyses we conduct are all discussed in the cases of and , respectively. Specifically, we let equal 0.4 and 0.7 in two cases, respectively.
4.2. Sensitivity Analysis of Production Diversification
The larger is, the larger is the elasticity of substitution, by the definition of , and the smaller is the extent of production diversification, i.e., the diversity of infrastructure construction of electric charging stations. A large elasticity of substitution means a small decrease in product j’s price would make the quantity sold of product i decrease significantly, with variables measured by percentage. Only when goods are so alike that the consumer can easily find a substitute that serves a similar function and changes his purchase decision quickly that the elasticity of substitution, i.e., , would be large. Thus, we say that the larger is, the smaller is the extent of production diversification.
In the case of , the consumer cares much about consumption today, as is shown in Figure 4a. Meanwhile, σ is small, that is, the extent of diversification is large. Then, it is consistent with the research conclusion of Cournot equilibrium that firms earn a positive profit in first best, i.e., the social planner prefers fewer firms in the EV market.
In the case when , which means is larger, the extent of diversification is small, and the consumer does not care so much about consumption today, as is shown in Figure 4b. Then, it is possible for some small σ when the benefit of diversification is relatively large for the benefit of entry to be large enough to overcome the fixed cost of entry. Thus, it is better to encourage more firms to participate in the EV market. In other words, firms tend to enter insufficiently in a free market since they did not take the benefit of diversification into consideration and were hindered by the entry barrier, fixed cost . While for some larger , the benefit of entry is small, and there is no need for enhancing competition, so the entry in equilibrium would probably be excessive.
From both cases, we find an interesting and seemingly unintuitive result that in first best increases in , i.e., decreases in the extent of diversification. Moreover, the optimal firms’ number decreases in , i.e., increases in the extent of diversification. However, this is indeed intuitive because as increases, the difference between charging modes decreases. Thus, less benefit can be obtained by the consumer from an increase in the variety of infrastructure construction of electric charging stations, and fewer products or firms are preferred in the EV market. With the decrease in the consumer’s welfare due to less diversified products, it is more efficient for the social planner to improve the total welfare by tilting to the producer. Thus, firms earn more as σ increases.
4.3. Sensitivity Analysis of Features of Cost Structure
The features of cost structure, , and , may also affect the sign of , where fixed cost reflects the level of the EV market’s access threshold and marginal cost is the characteristic of the EV producer.
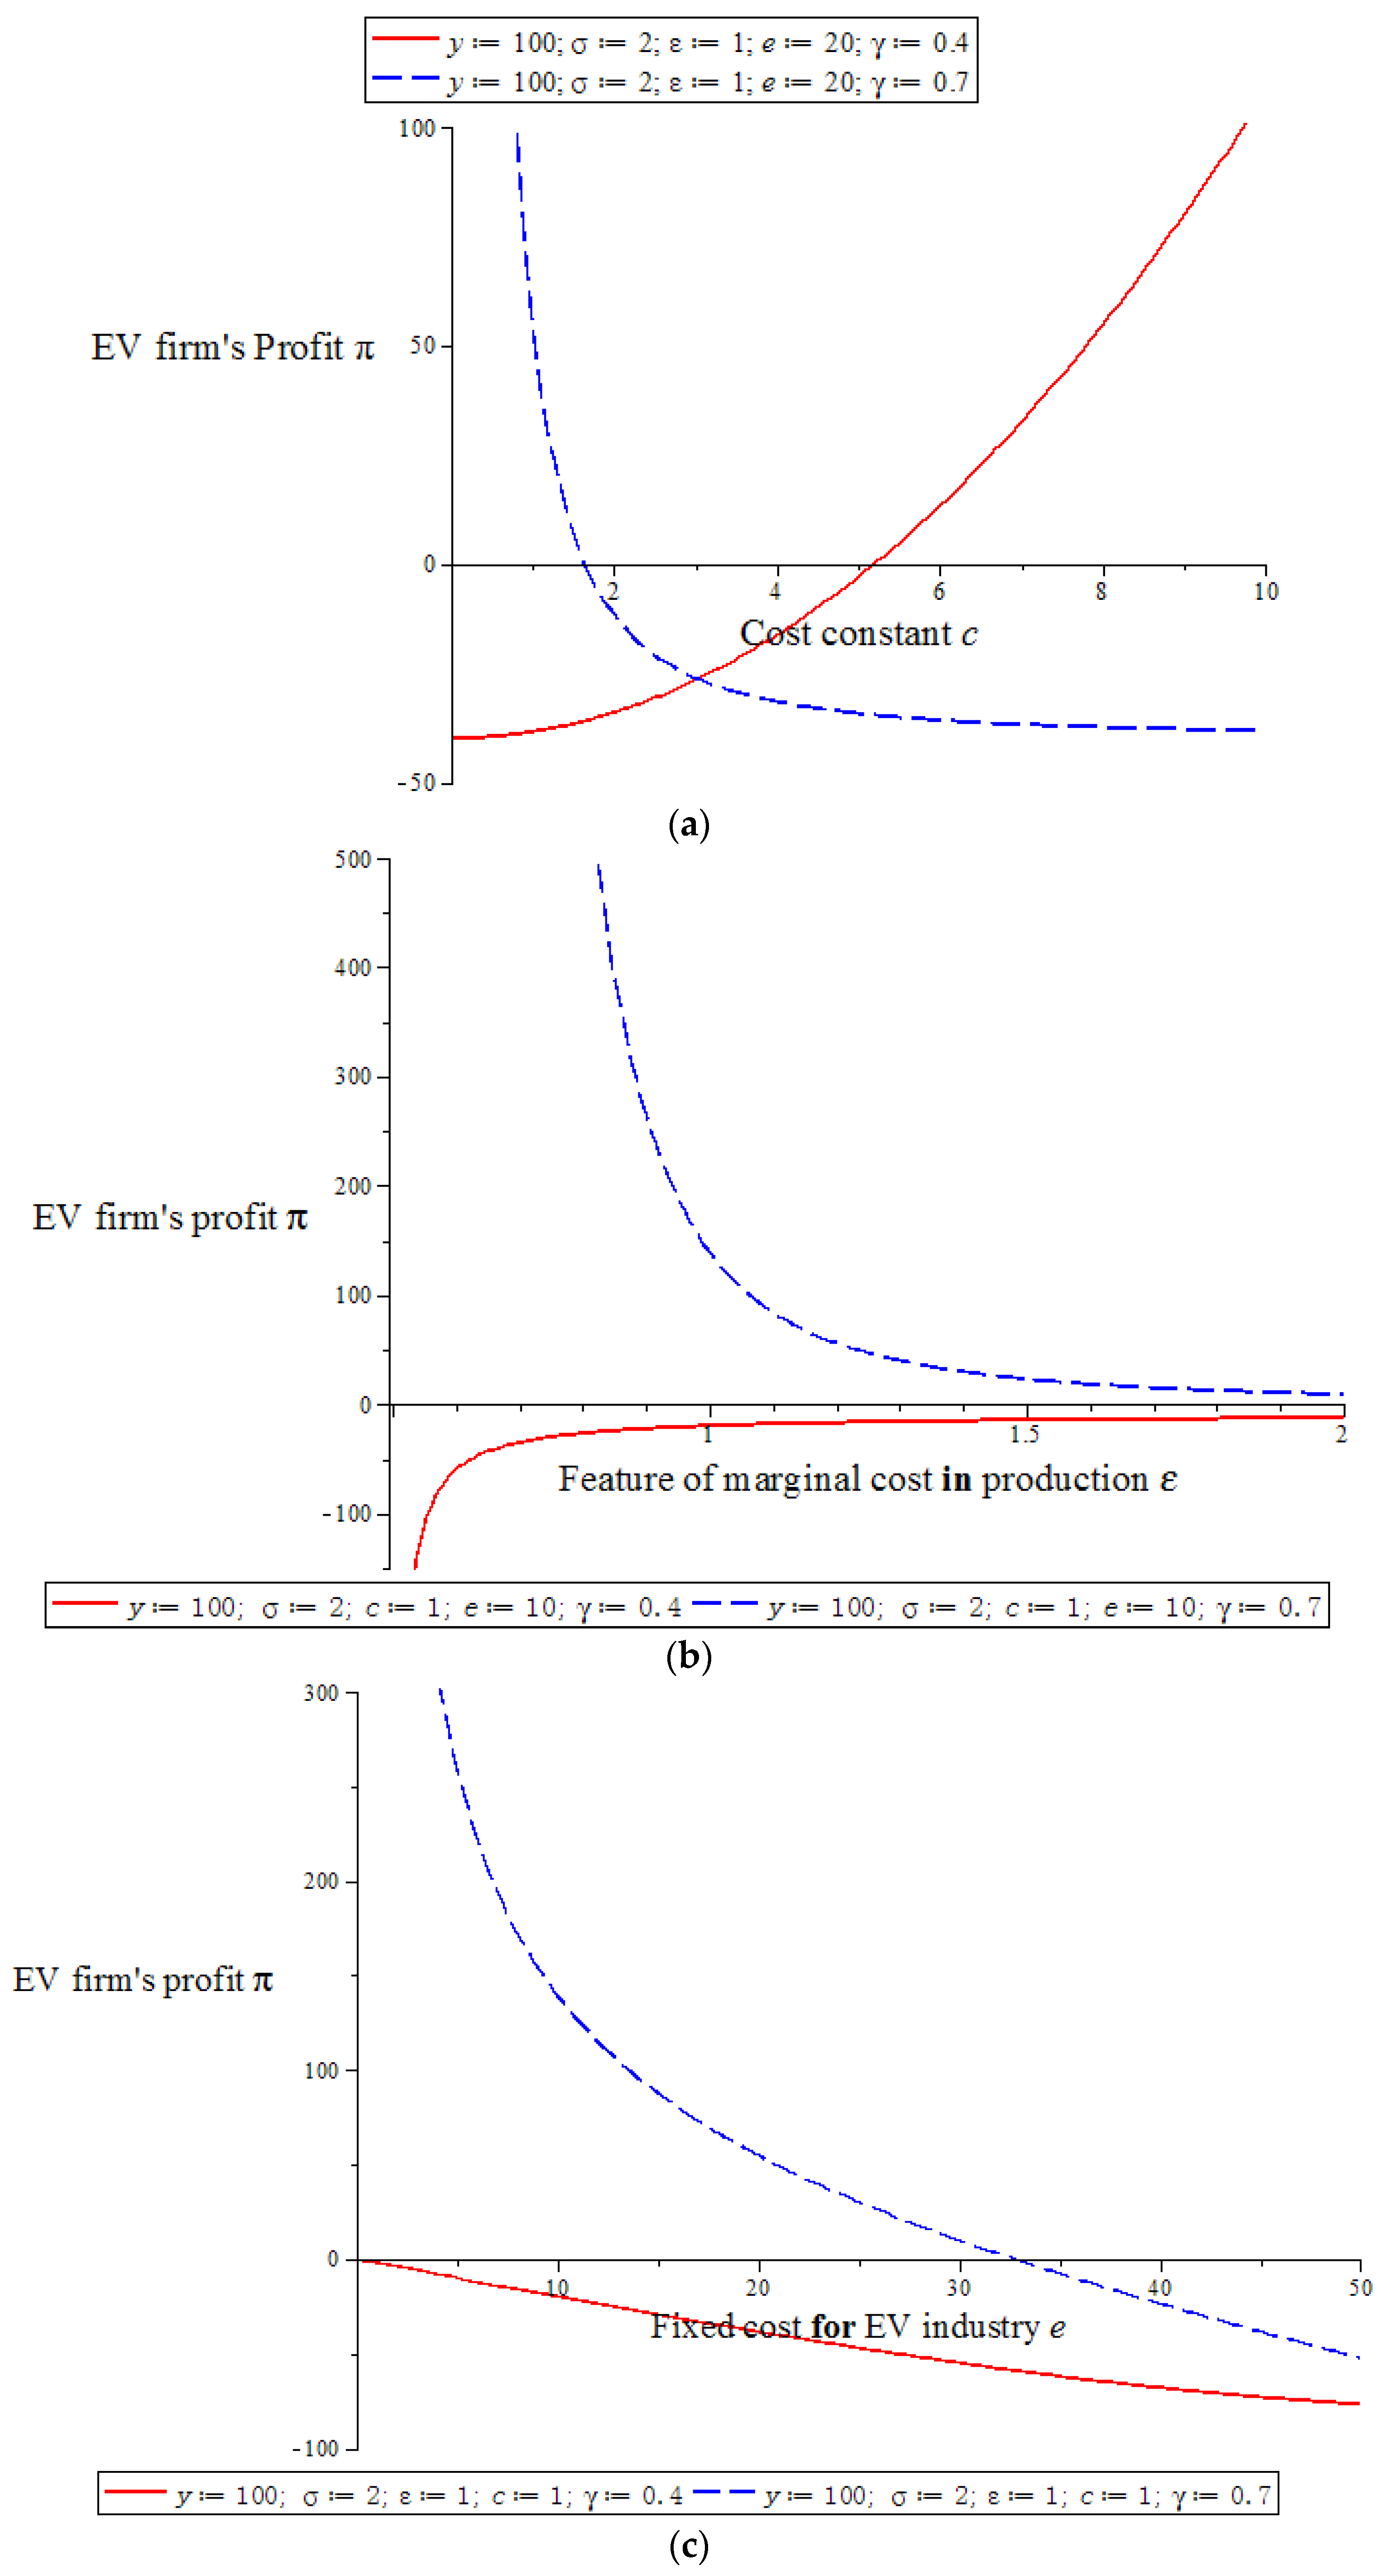
Figure 5a is the sensitivity analysis of c, which shows that, as increases, the market might switch from insufficient entry to excessive entry or reverse, depending on the value of γ.
Figure 5b shows the sensitivity analysis of ε. When , EV firms’ profit increases in while remaining negative; thus, there is insufficient entry in equilibrium. When , EV firms’ profit decreases in ε while remaining positive; thus, there is excessive entry in equilibrium.
Figure 5c shows that always decreases in fixed cost . However, this does not mean the social planner always prefers fewer firms when fixed cost increases because there exists some tradeoff between the optimal output per firm q and the optimal firms’ number n, which has been explained in the discussion of the result of first best. In Figure 5c, we could see that might be positive for some range of and negative for some other range of . That is to say, starting with excessive entry, EV firms might end up with insufficient entry as e increases.
4.4. Sensitivity Analysis of Different Situations
In this part, we analyze some different situations for EVs in the future. Parameters we select are closely related to the demand and supply conditions of EV market. Based on many research reports, we find the cost of battery constitutes the major part of EV’s price, while electricity price and maintenance cost influence the decision of consumers as well. Currently, subsidy of government is probably an inducement factor for purchasing, as well. To simplify our analysis, we assume the increasing demand for EVs will naturally motivate the equivalent need of charging stations even more. On the other hand, we discuss the cost and profit of owners of charging stations, to analyze how they change their supply of charging equipment. As a result, we can get some suggestions for sustainable governance on this market.
Data in this section are from previous research and market surveys on EV market, including some professional papers on EV battery, research reports on EV market, and so on. Some primary results and sources are listed in the Table 1. Fiducial value is the actual value in 2015, while the ranges contain the estimation from studies.
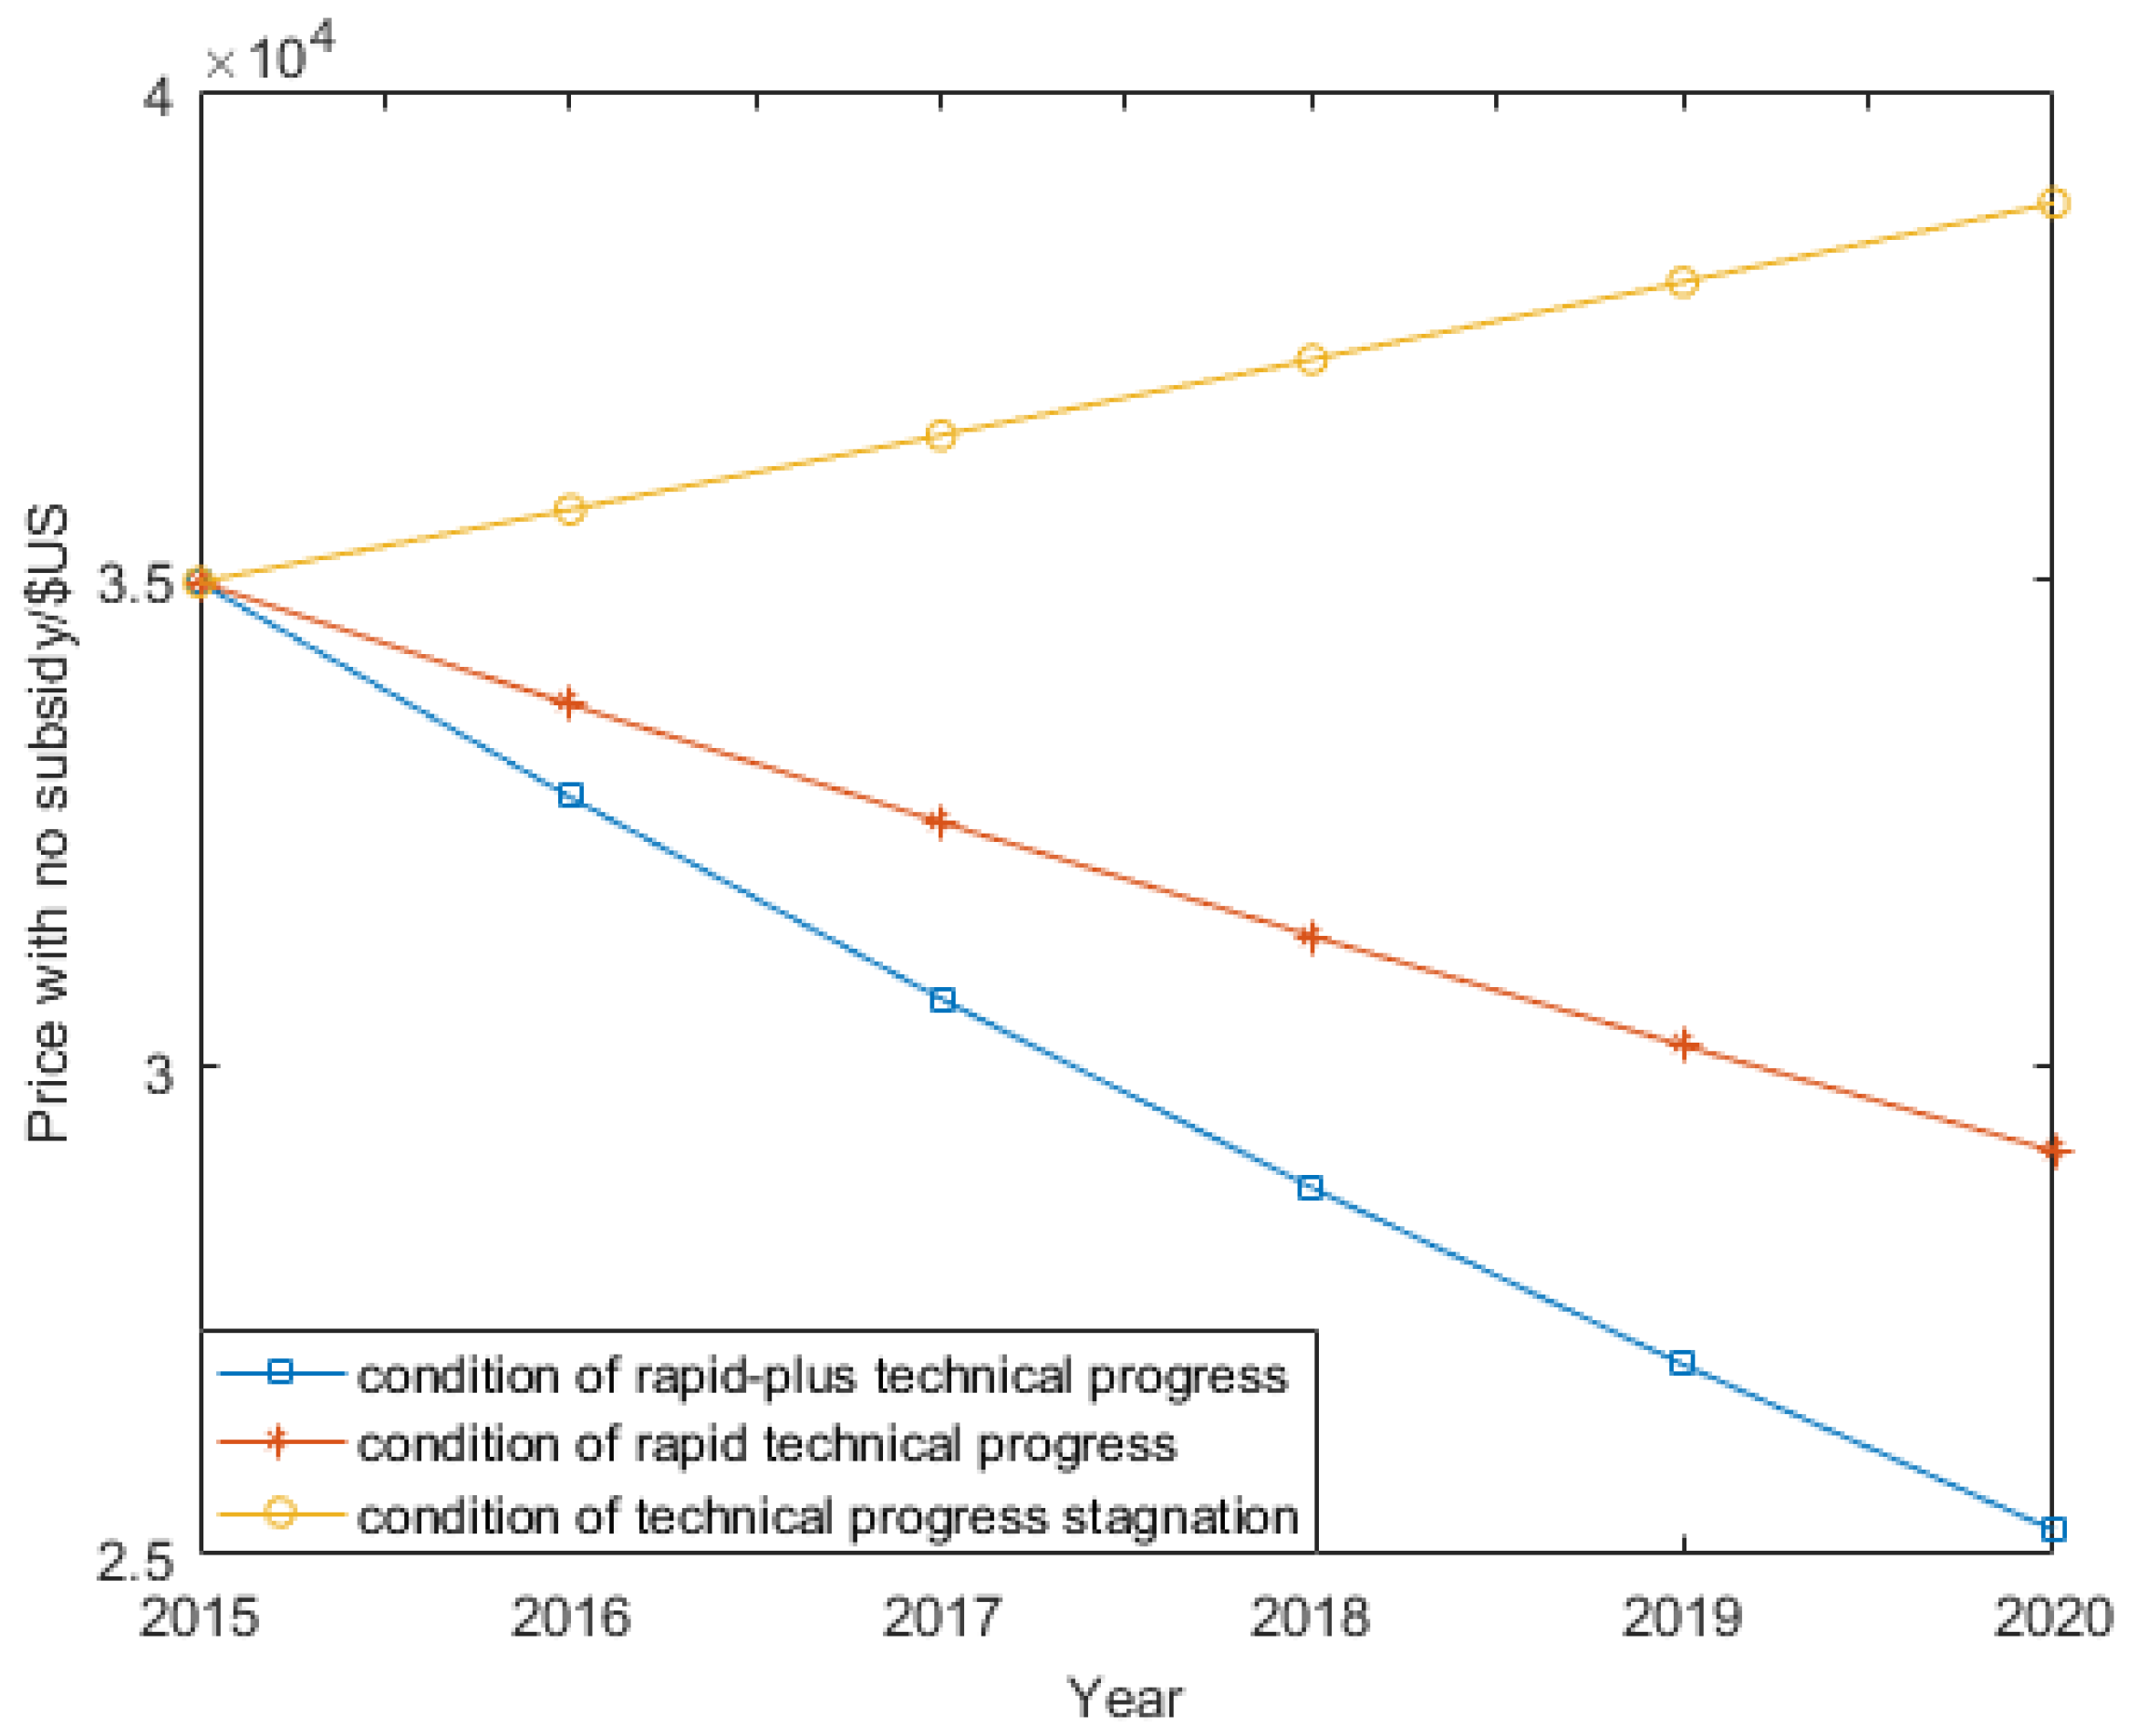
According to our survey, we find that the costs of EVs are largely due to their power batteries, so engineers are continually concentrating on the technology to improve the battery capacity and service life to lower the unit cost. Based on Zhang et al. [29], the unit cost of battery in 2015 is $380/kWh, and we assume three different kinds of situations: stagnation, rapid growth and rapid growth plus, in which the unit cost of battery decrease at the rate of 4.5%, 9.8% and 12.3%. Together with the paper of Hao et al. [31], we reasonably speculate the battery capacity will increase at the rate of 6.8% per year, in the next five years. Thus, we can compute the battery cost. In addition, through our market survey, we find averagely, the cost of batteries makes up half or 60% of that of EVs, leading to a simple way to obtain the estimated price of EVs, as shown in Figure 6.
Next, consider an important factor in the sales of EVs: subsidy by the government. In fact, the subsidy is very different in diverse regions. According to the data we have collected and the research of Zhang et al. [29], we find some provinces used to provide subsidies of half the EV’s price, while others no more than $1500. To conduct the new plan of the central government, many local governments have to lower their subsidies on the consumption of EVs. We distinguish three types of situations based on the different subsidies: a higher one means the subsidy is more than $6800 per car, which is common in eastern provinces. A medium one offers $4500 to $6000 as the subsidy for each EV, which is known in some western provinces. A less common situation is the lower one, providing a certain amount less than $3000 per car. Thus, we make the estimation as follows to obtain the real payment of purchasing an EV for consumers. Estimation result with highest subsidy is shown in Figure 7, while the other two are hided because of similar trends.
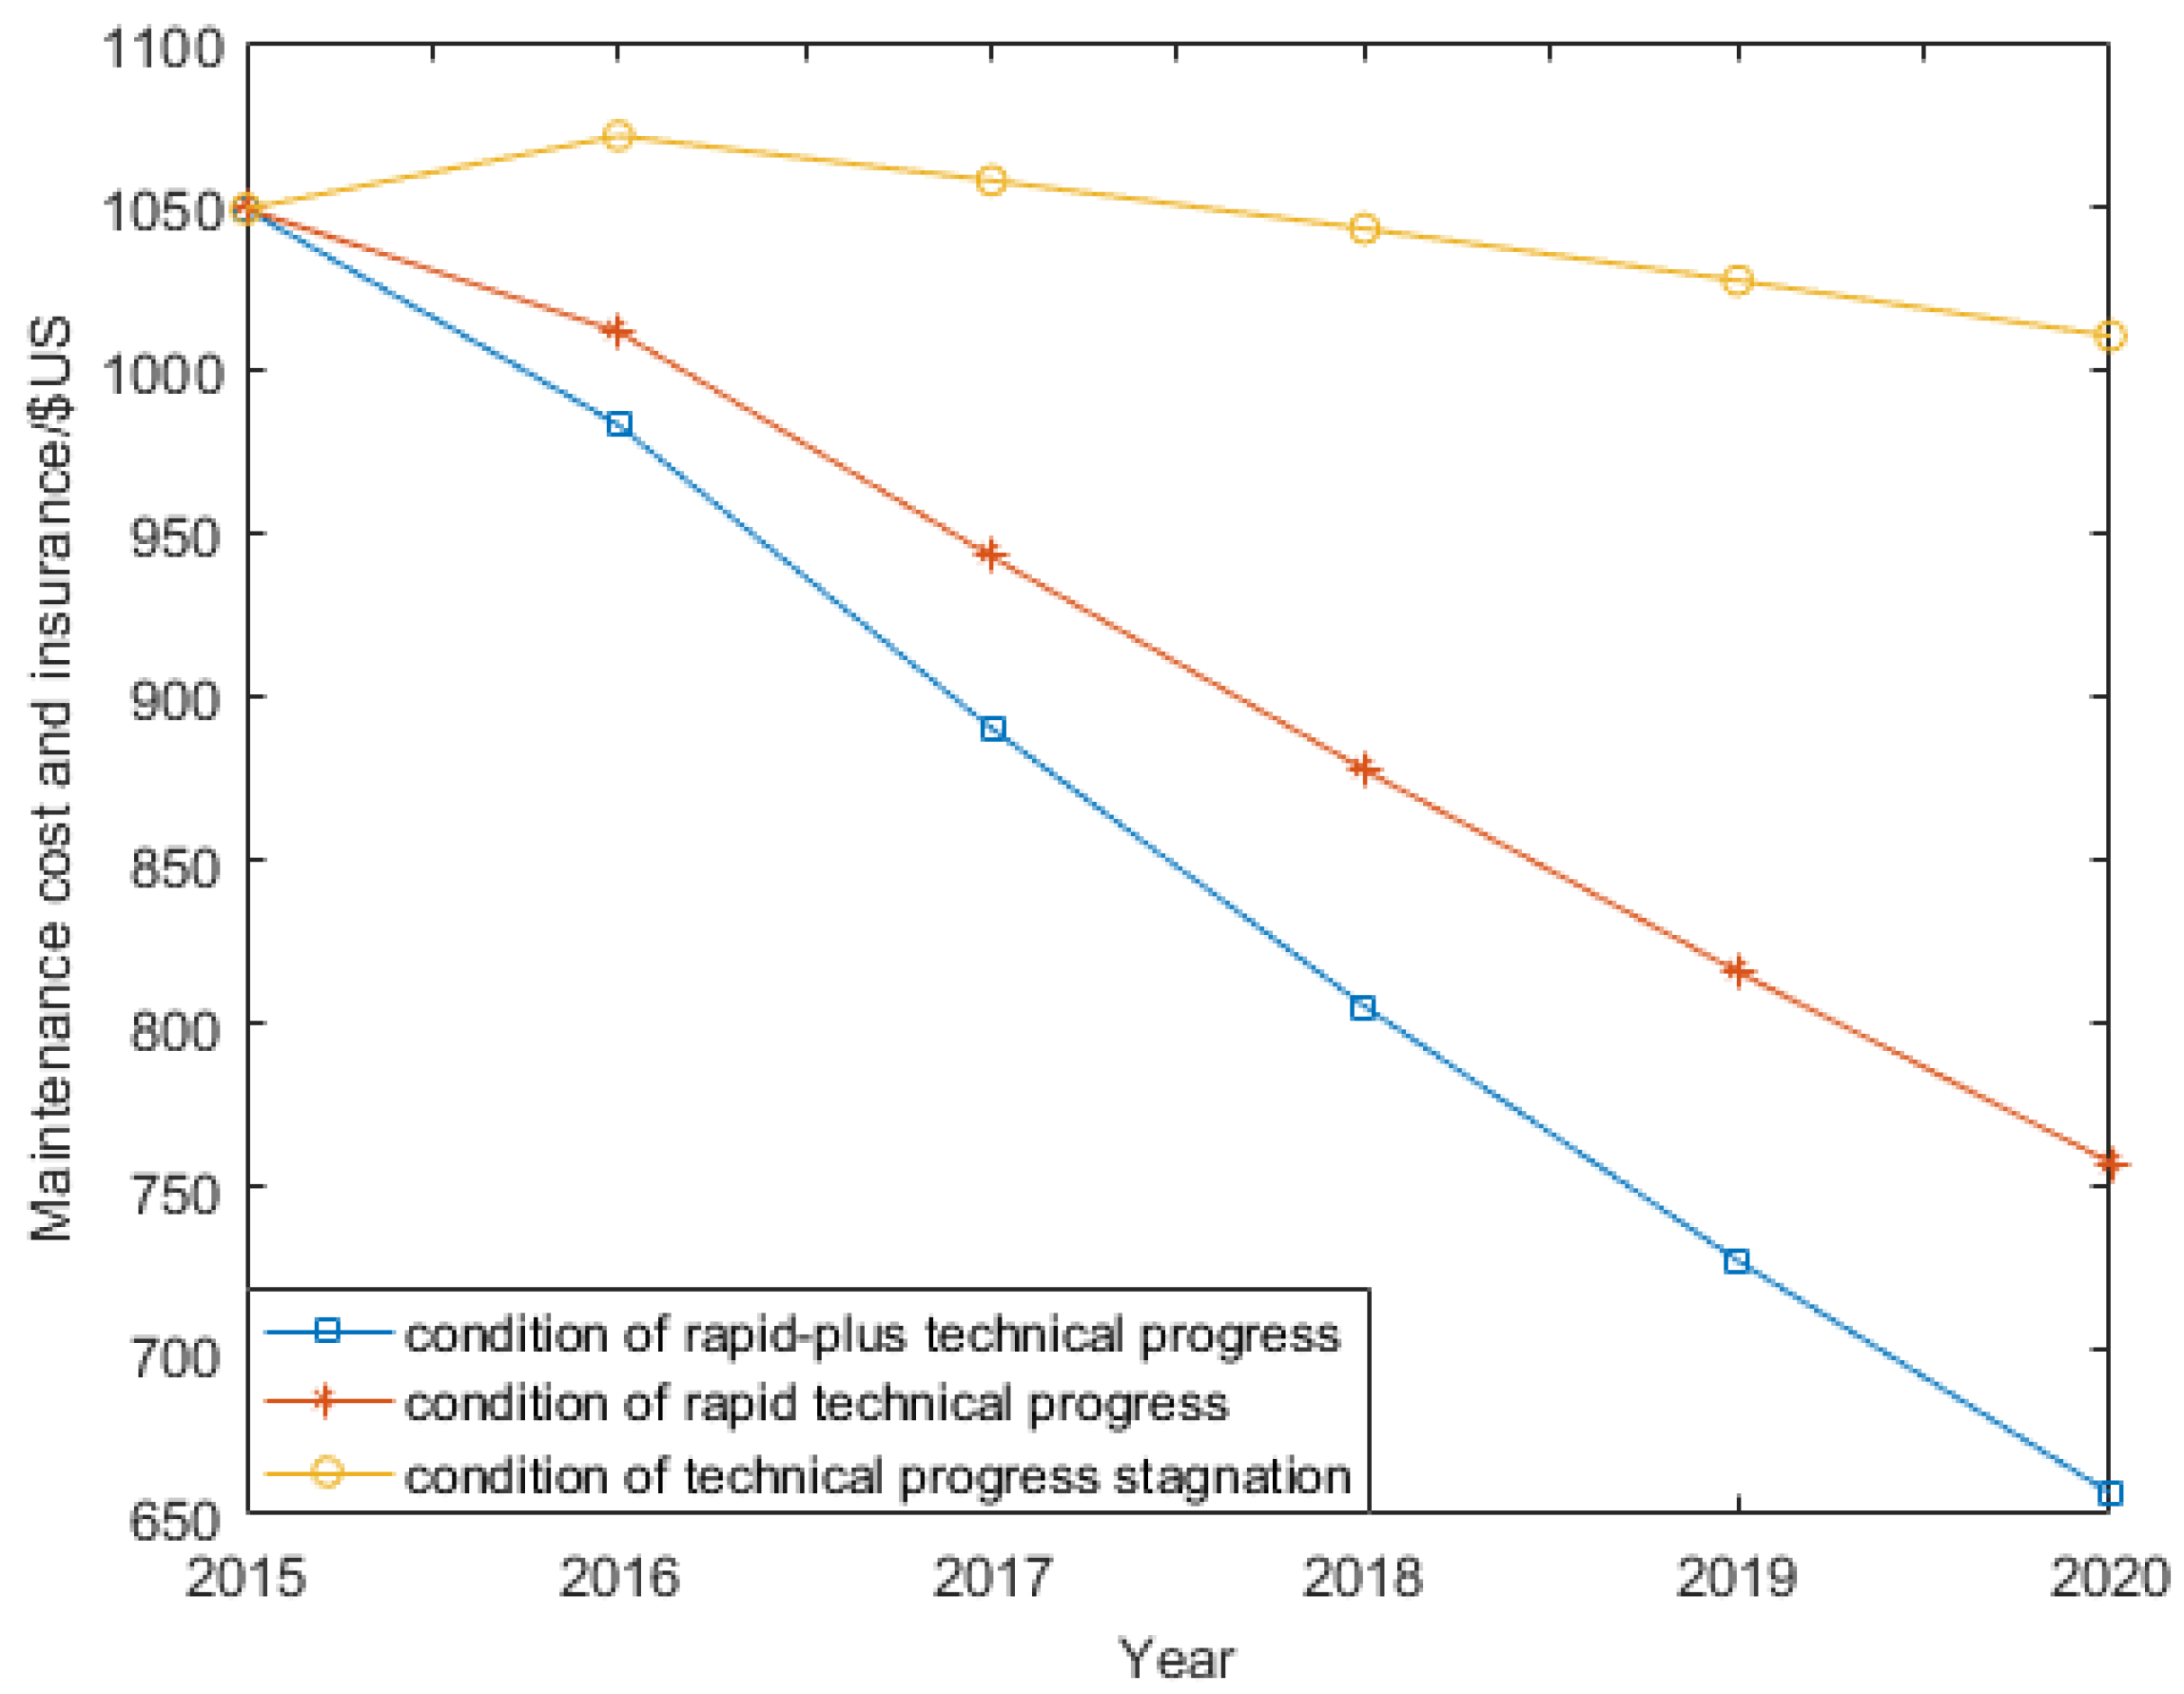
From the following graphs, we find the importance of technology advances for EV consumers, which is a determinant for EV’s price. Rapid growth of technology lowers the cost of battery, and increases the service life of battery, to make the EV more efficient and more convenient, which influences the market demand of EV’s. While comparing the situations within and without subsidy, we can hardly find many differences on the trend of EV’s price, which tells the weaker effect of subsidy on the preference of consumers, to some degree. On the other hand, it is easy to find that rapid growth of technology will decrease the loss of utility resulting from a decline in the level of subsidy. In other words, it could be an efficient way to provide subsidies for EV producers to stimulate their technological advances rather than for the sales to consumers indirectly. Moreover, we have to admit, under the situation of a low level of subsidy (even a medium level of subsidy), the real payment of EV is not that competitive compared with traditional cars based on equivalent conditions. To adapt to the upcoming new subsidy plan, EV producers have to try hard to increase their returns to scale and decrease their marginal cost, by innovating the producing technology. Furthermore, we find another important effect of rapid growth of technology is to lower maintenance costs and insurance. Estimated maintenance costs are displayed in Figure 8. According to our interviews with consumers and insurance salesman, we discover the expensive insurance somewhat is an obstacle for potential EV consumers, which is much higher than traditional cars. Reason for this problem is the high uncertainty of EVs’ batteries, which is liable to damage. Therefore, rapid growth of technology is beneficial for consumers to decrease their insurance, to stimulate their demand.
Next, we have analyzed the ordinary expense of an EV to obtain the advantage of EVs compared with traditional cars. Generally, owners of EVs have to charge at public charging stations for one or two hours during their operational period. Some reasons for this situation are the heavy investment and the low efficiency of charging piles. According to Zhang et al. [29], we assume a typical owner of an EV, with 14,143 km driving per year.
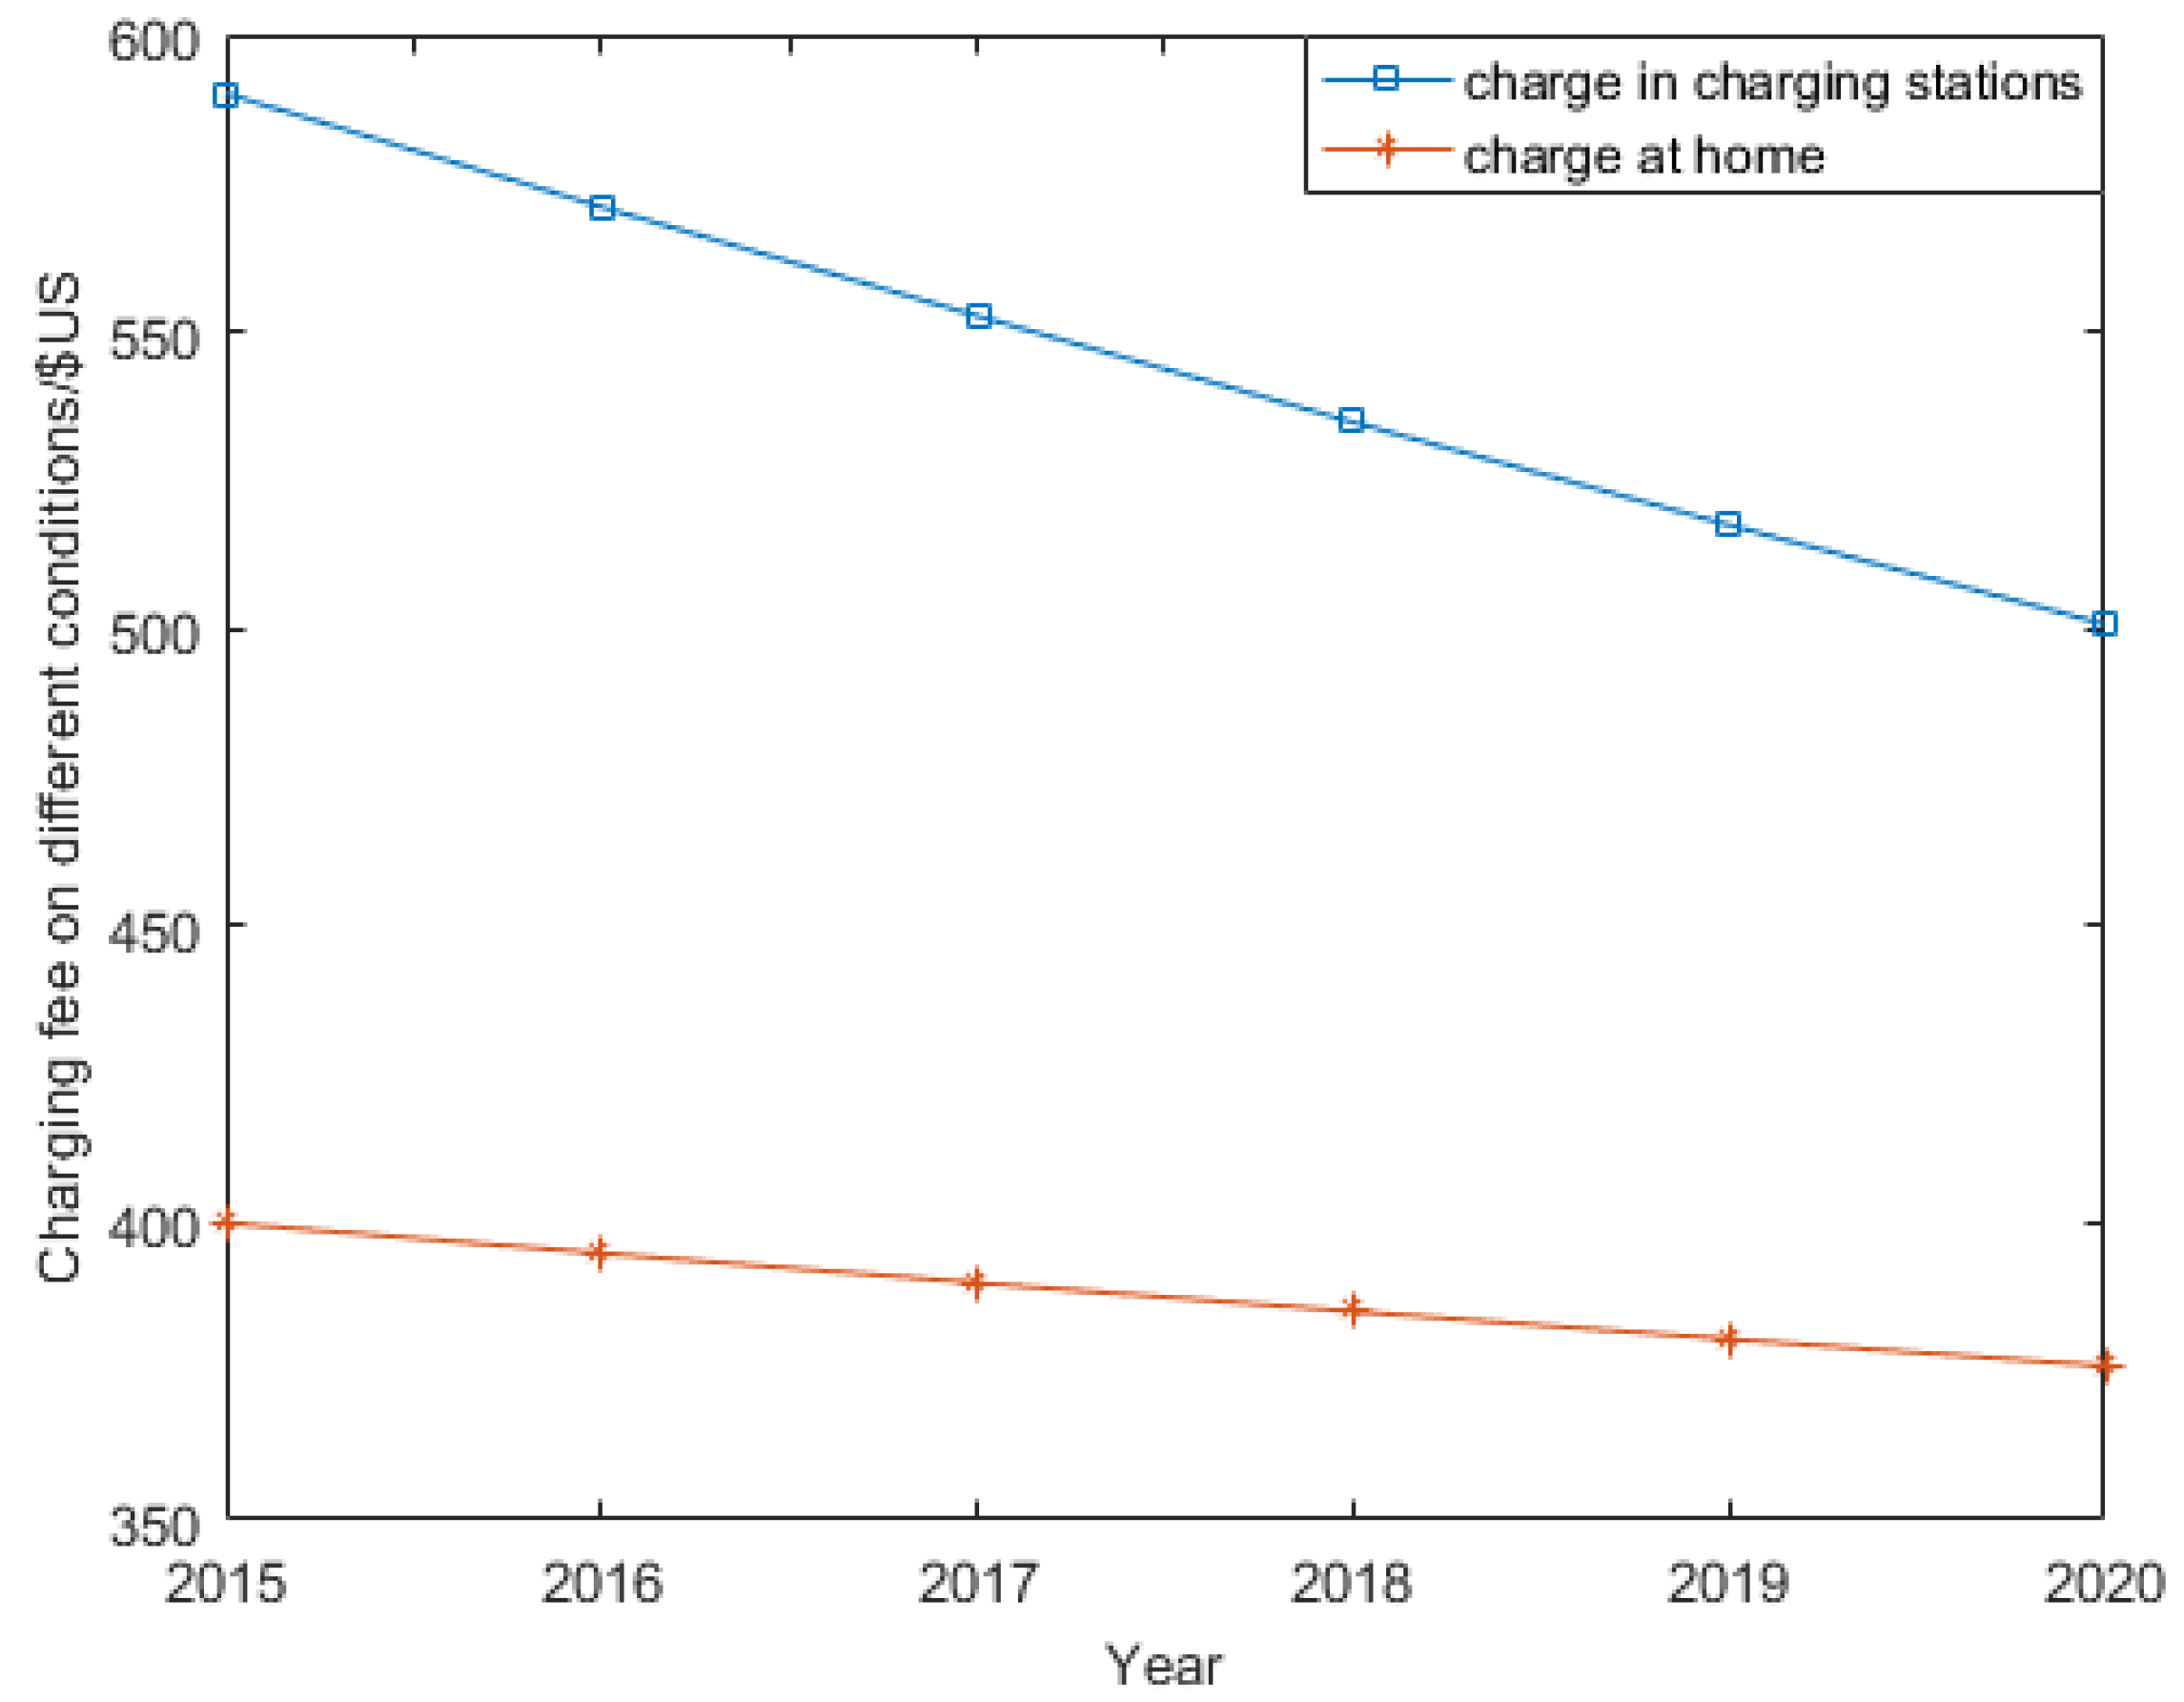
We have to clarify that charging at public stations requires $0.12 per kWh for service fee, with some parking fee, except for charging expense. However, charging at home requires an investment in the needed equipment. Consider three situations as follows: charging at public stations during rush hours or ordinary times will cost about $0.27 per kWh with no fixed investment. The last situation of charging at low times provides a lower electricity price of $0.08 per kWh with no fees, but with an in investment in charging pile. Based on the market survey, we apportion the investment of $1200 over five years to reflect the real cost of each year. So we compare the different charging fee in Figure 9. Based on the same driving mileage, we obtain the expense of traditional cars, approximately $1170 per year. It is easy to find that the economic advantage of EVs is not as remarkable as expected.
According to the analysis above, we find the economic advantage of EVs is gradually becoming reduced with the decline in subsidies, regardless of the purchasing prices or charging fees. In this condition, more charging stations and convenience for charging have become increasingly more important. On the one hand, more charging stations reduce the charging fees for owners of EVs because they can choose to charge at any time or anywhere instead of competing for limited equipment during rush hours. On the other hand, more charging stations will reduce the searching cost and the possibility of traffic jams, improving the utility of consumers.
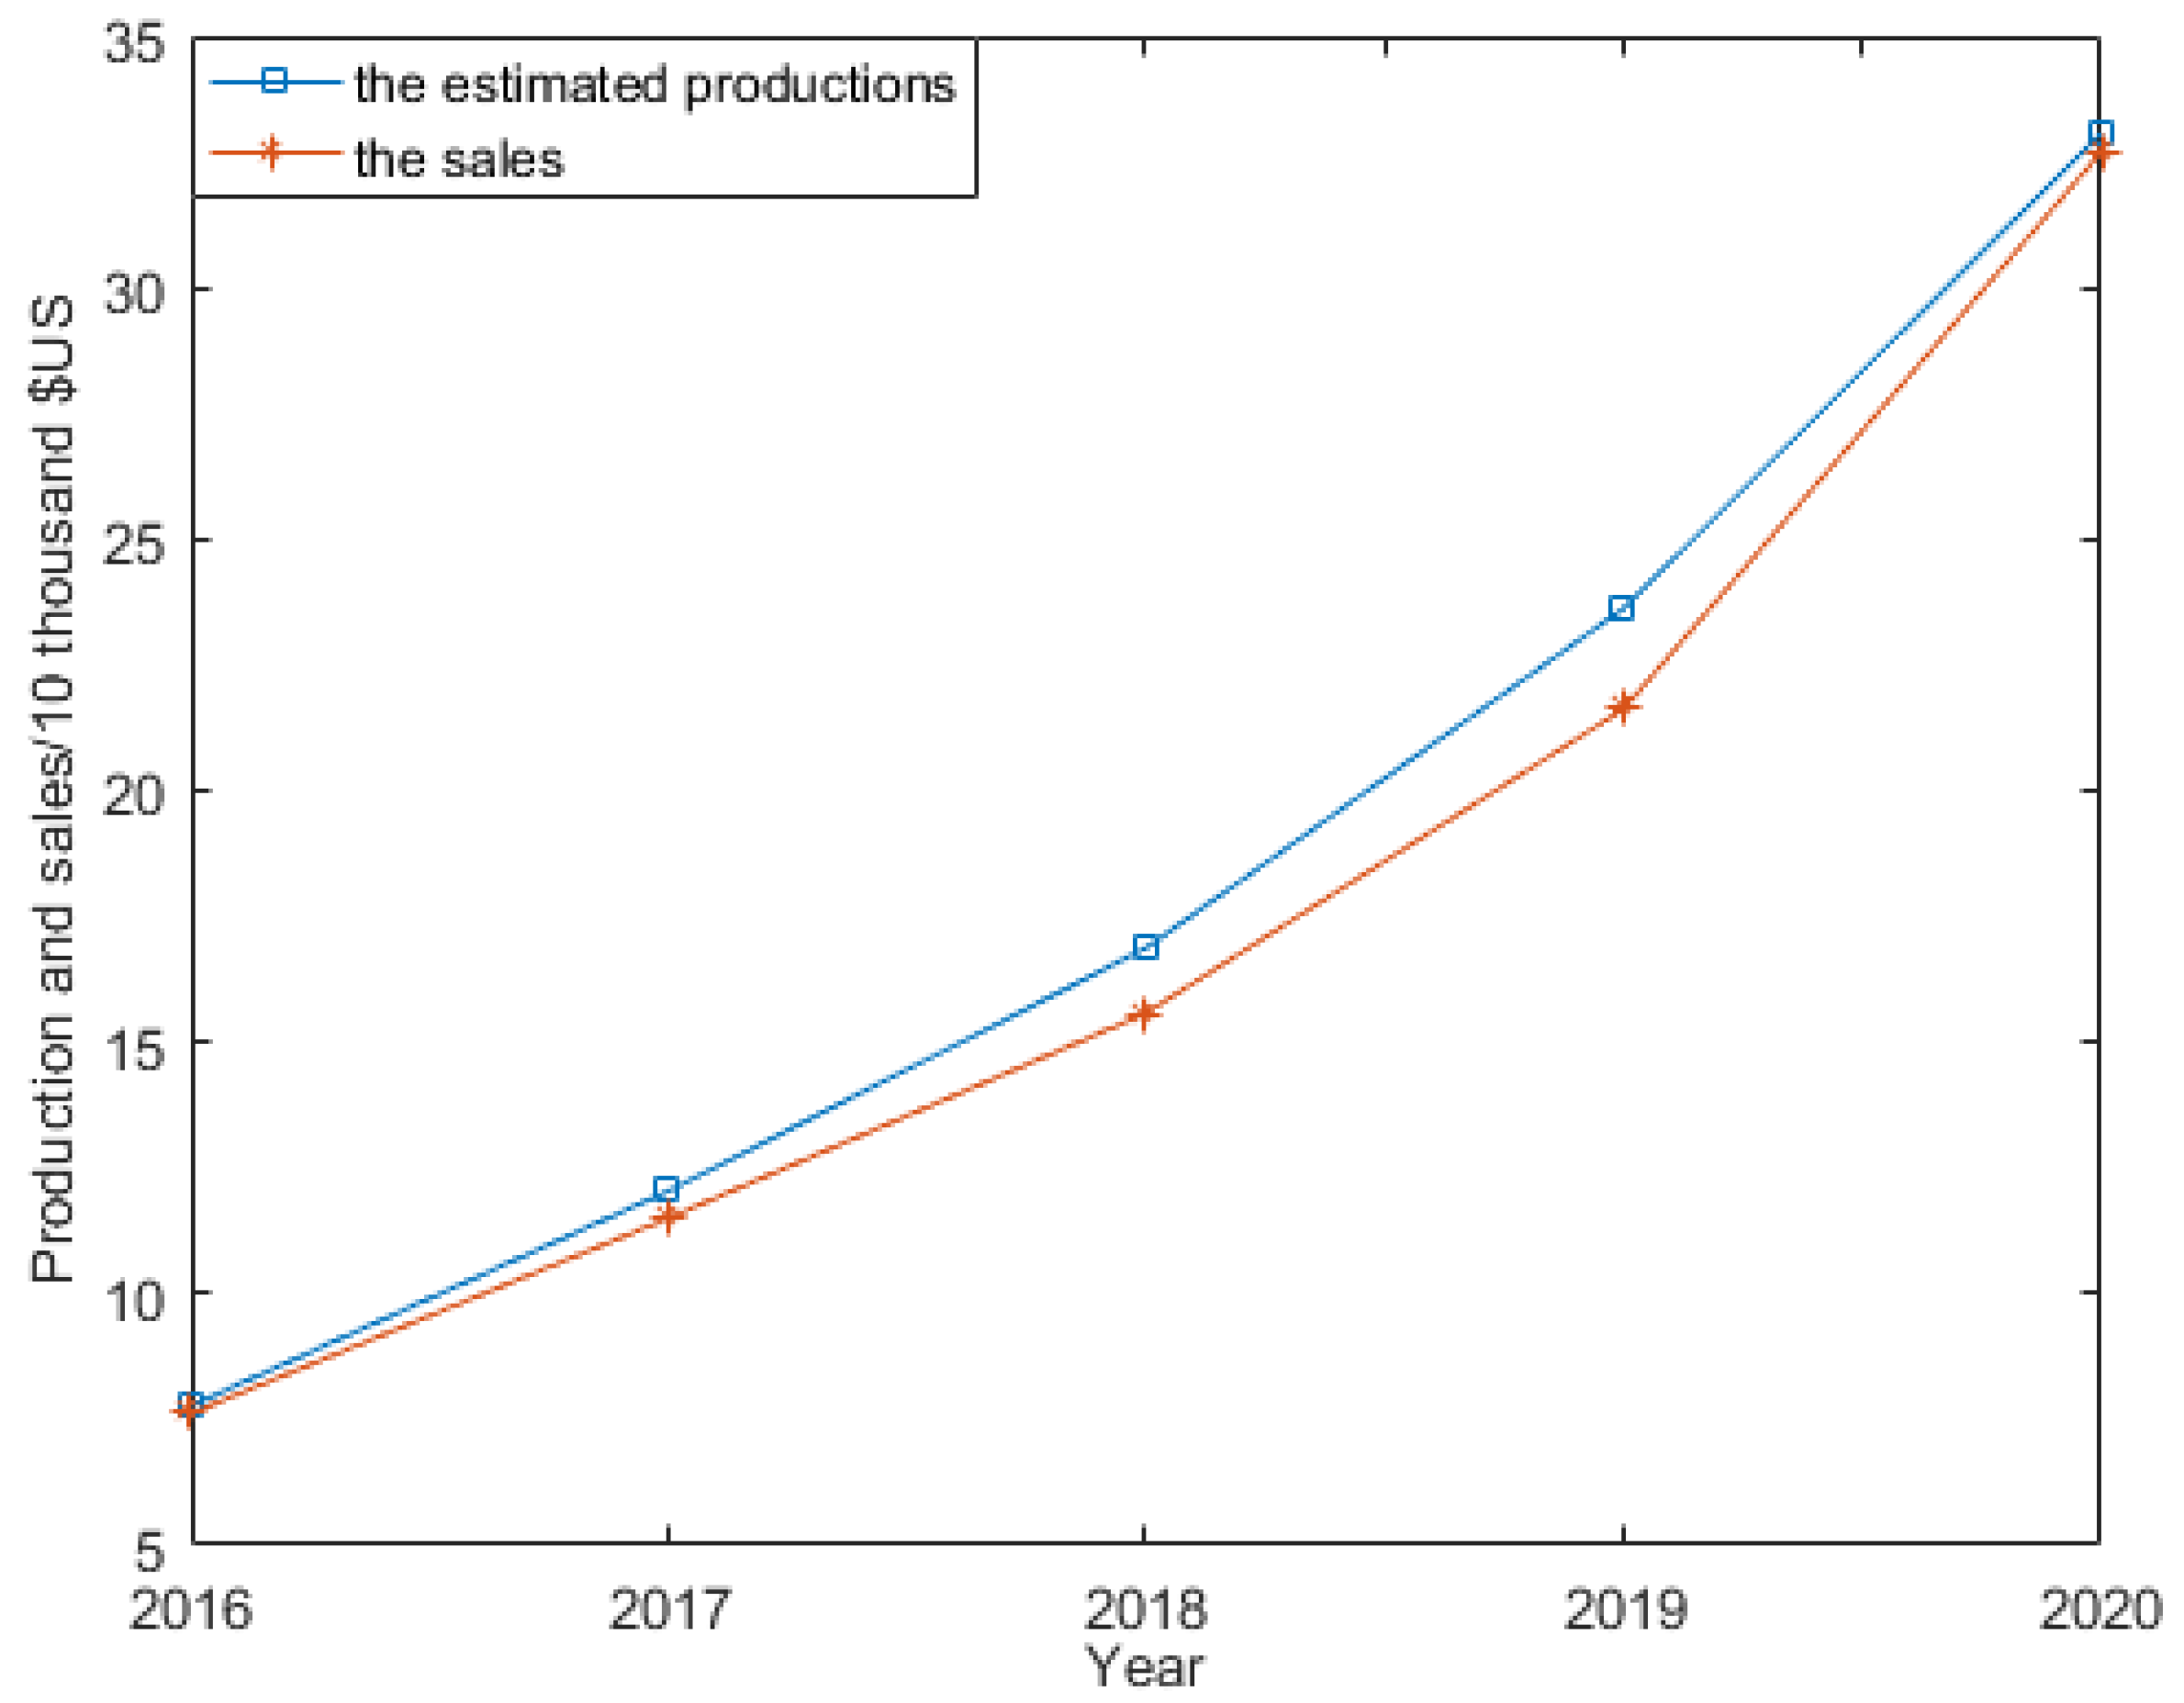
Based on the market development and industrial policy of the Chinese government, we suppose the production and sales of EVs would increase at a speed of 40%, making the annual output reach approximately $0.33 million in 2020. In this aspect, we estimate the future productions and sales of EVs in Figure 10 and find the market of EVs promising in the next few years. The problem is the mismatch in the booming purchasing of EVs and the lack of sufficient charging equipment.
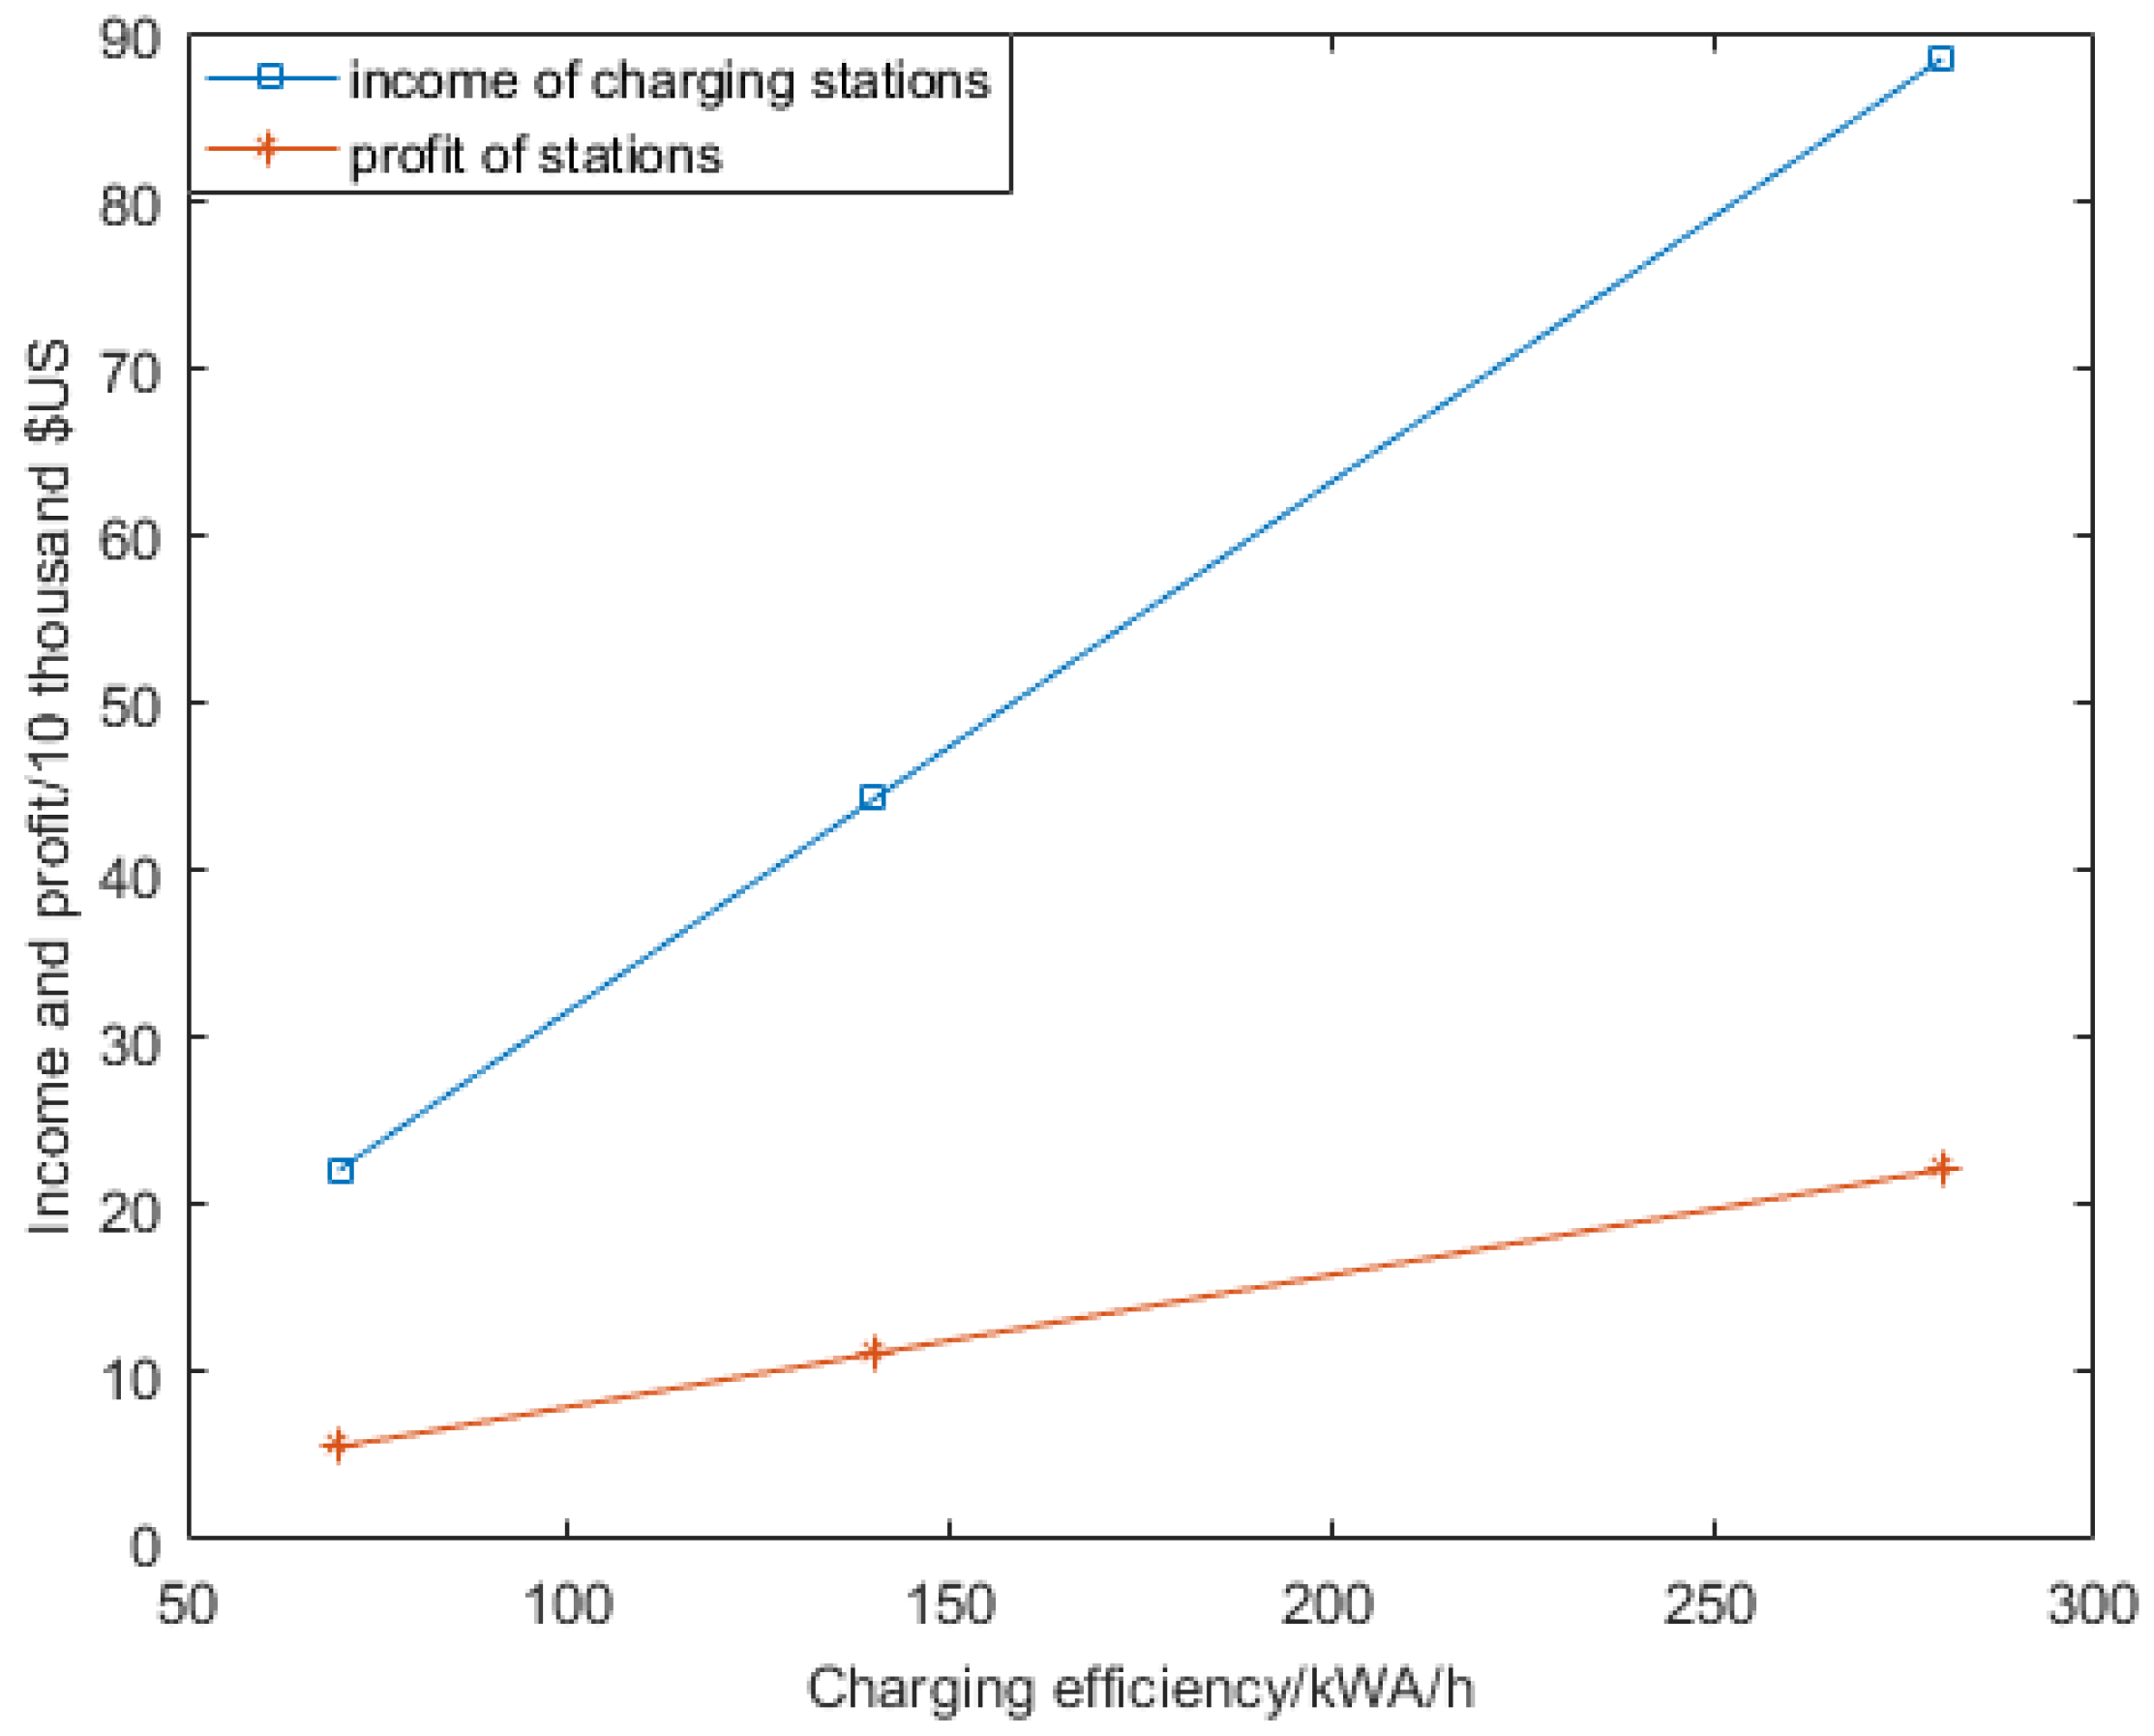
Thus, we have to conduct further discussion regarding construction of charging stations. Take as an example a normal charging station with 20 facilities. Considering the purchase, construction and monitoring costs, we have to invest $646,600 at the start. Operation maintenance fee is approximately $40,600 per year. We presume three situations depending on the quality of battery life. The type of highest quality requires 15 min to charge 70 kva while the lowest type requires an hour.
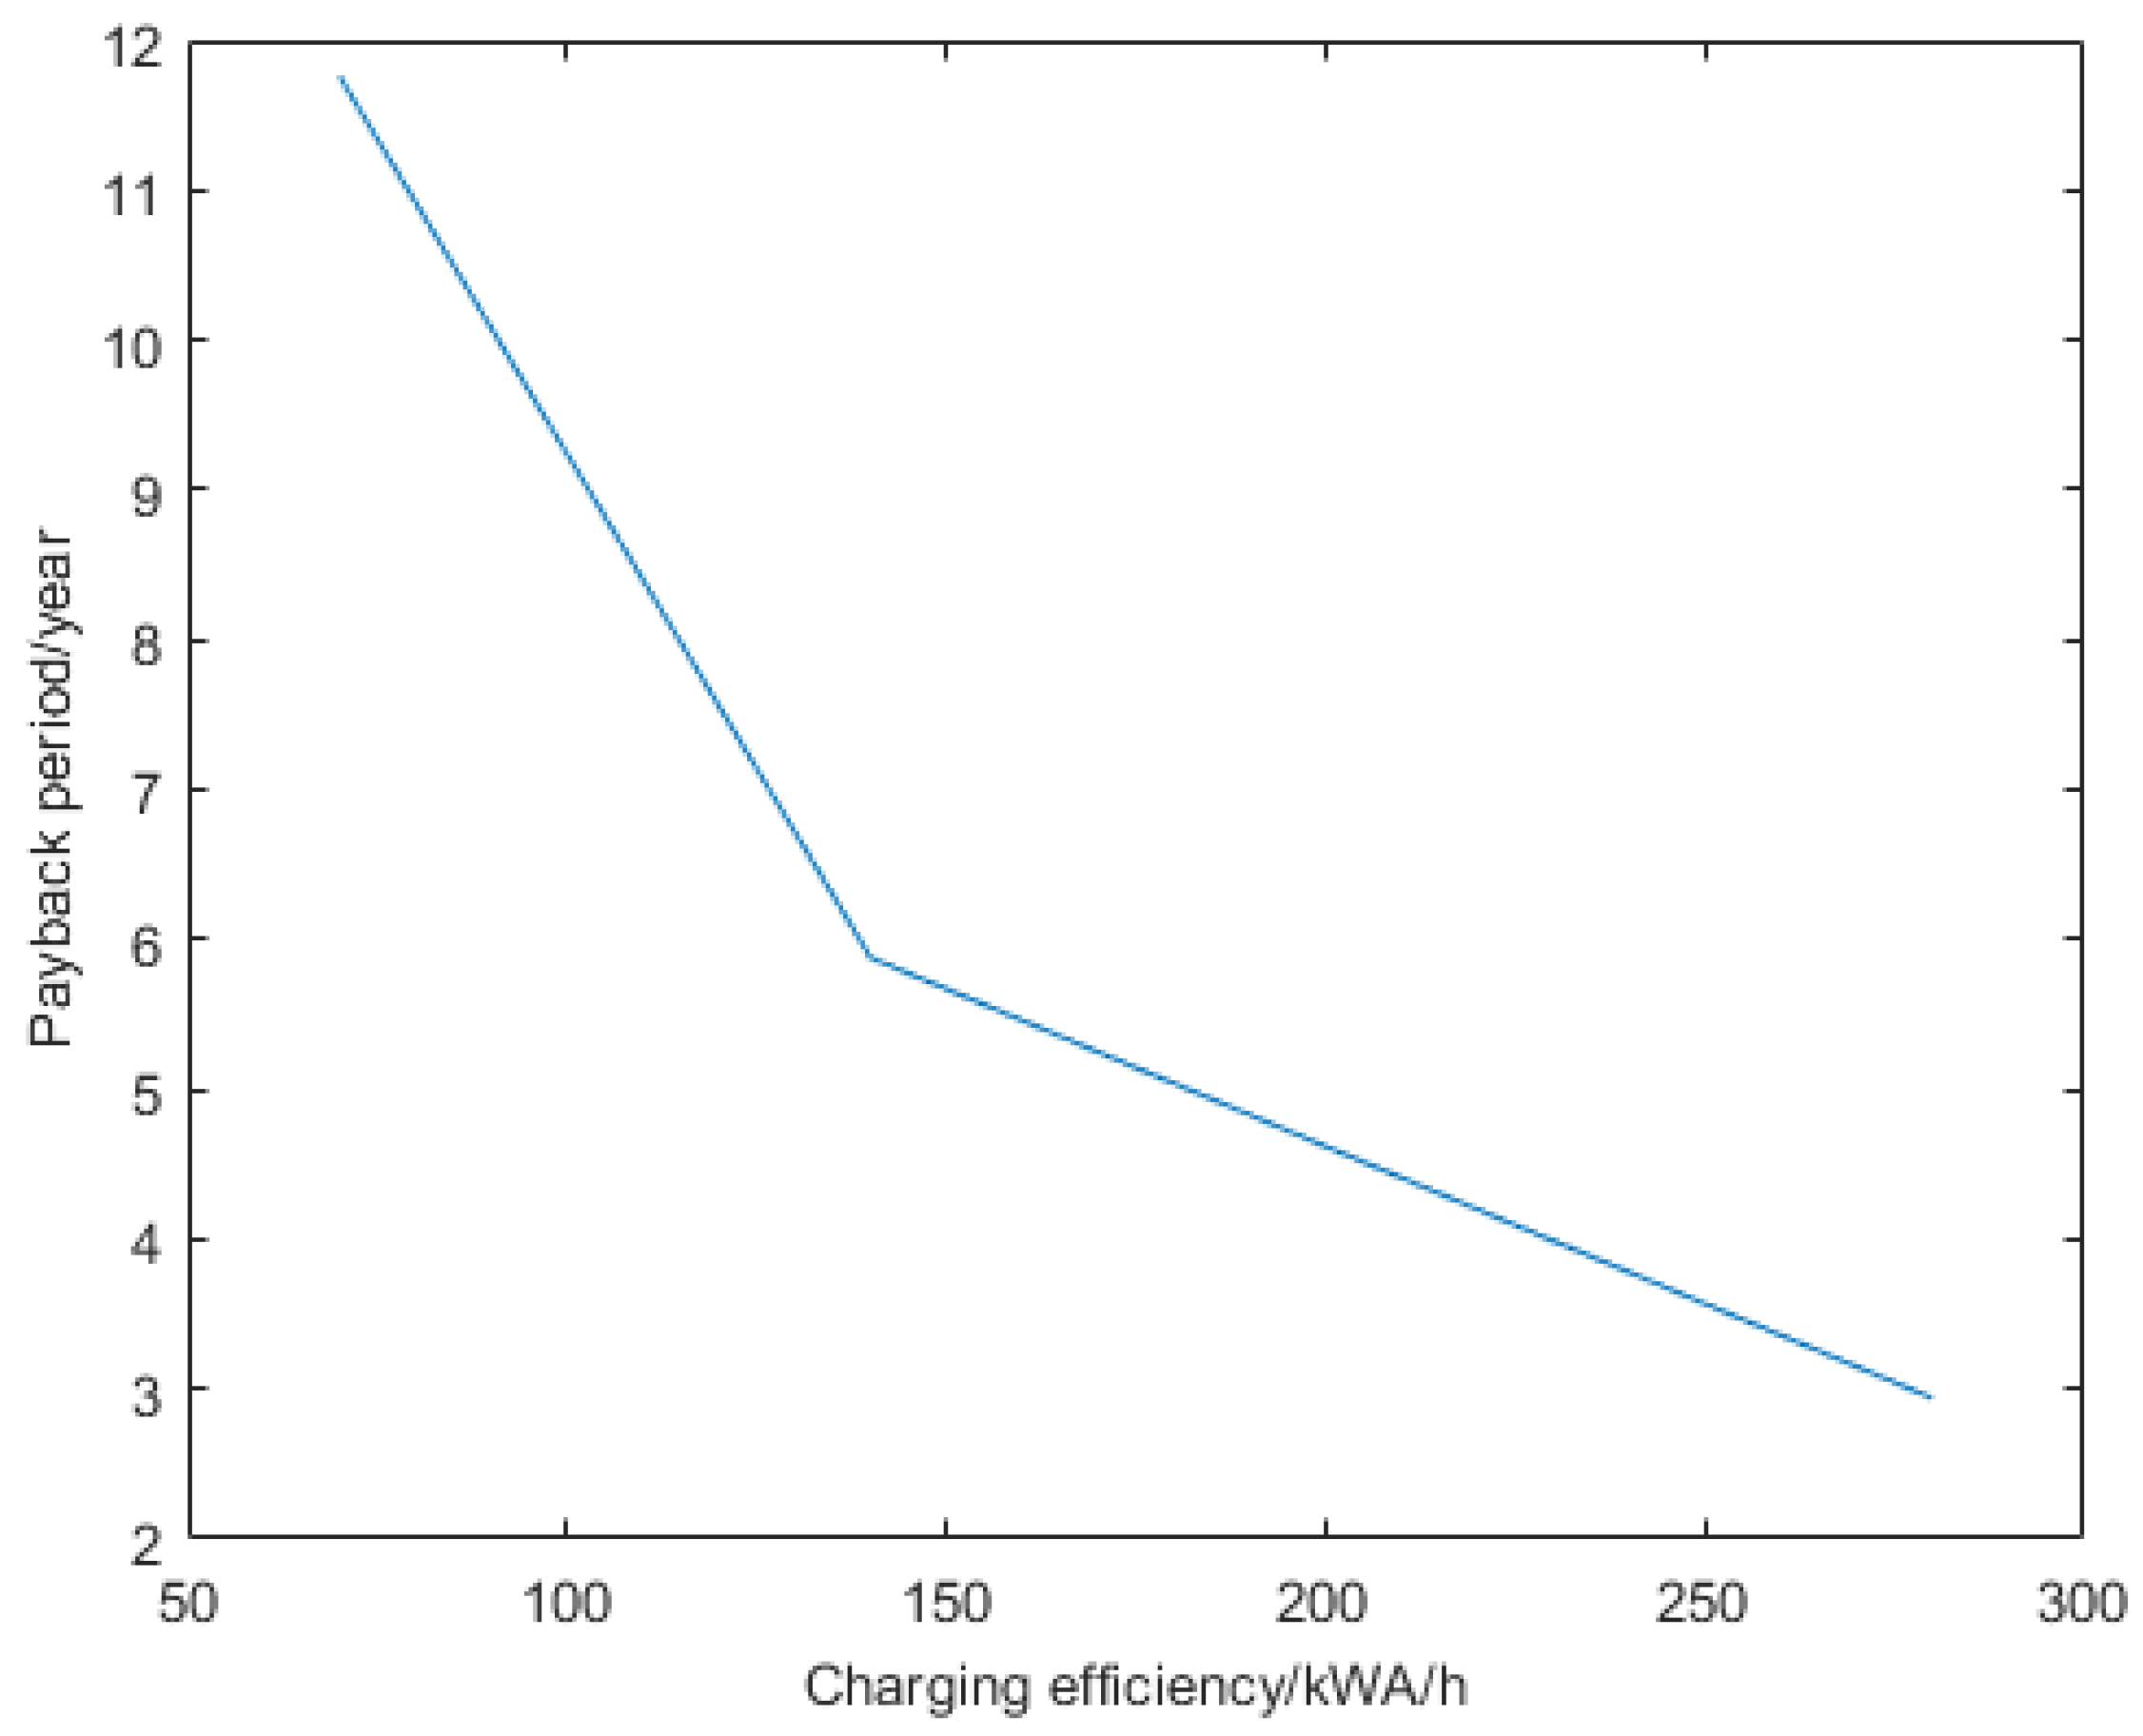
From Figure 11 and Figure 12, we find the profit of charging stations partly relies on the technological advances as well. Rapid technological advances will improve the charging efficiency to increase the numbers able to charge, leading to a higher profit and thus ensuring investors recoup their investments. There are some manufacturers investing in charging stations with little profit. Therefore, it is necessary for governments to provide reasonable subsidies for the investment in charging stations to lower the risks of uncertainty, which is common in many provinces. Furthermore, it is a priority for EV producers to strengthen their technical abilities.
5. Conclusions
Based on the theory of monopolistic competition of the electric vehicle charging and upgraded facilities market, we present the following conclusions:
- (1)
- Since introducing differentiated products into the monopolistic competition model, whether there is excessive or insufficient entry in the market is determined by consumers’ time preference, level of production differentiation and features of cost structure in the Cournot equilibrium with free entry. Many researchers have conducted a lot of work to evaluate the chances and challenges of the opened market, to estimate the demand of market, as Li and Zhang [34] did, while their papers are partly based on the hypothesis of perfect competition market. Our research makes up this deficiency to some degree.
- (2)
- Consumer’s time preference has a crucial effect on the result of free entry. If the consumer values current consumption more than that of the subsequent period, then firms’ number is usually excessive with free entry. If the consumer prefers to leave more currency to tomorrow, then there is usually insufficient entry.
- (3)
- The elasticity of substitution σ also plays an important role in determining whether the market demonstrates excessive or insufficient entry. The market might switch from insufficient entry to excessive entry as the elasticity of substitution increases, i.e., the extent of diversification decreases.
- (4)
- Production costs will influence the result of free entry in complex ways because of the features of marginal cost and fixed cost. In short, entry can be excessive or insufficient depending on the specific cases.
- (5)
- Technological advance is a vital factor for the industry of EVs. With increasing income, residents tend to choose products of high quality rather than low-end ones. There is no doubt that higher technical progress will reduce the cost of both producers and consumers in the long run.
- (6)
- A lack of sufficient charging equipment is always a disturbing problem for consumers of EVs, leading to crowding and the inconvenience of charging. A large amount of initial investments set barriers to entry of charging stations. How to promote the sustainable development of industry of EV is still a problem. As mentioned in the paper of Schroeder and Traber [21], investment in charging stations is hardly profitable at low EV adoption rates, unless investment cost can be severely lowered. Furthermore, we find the charging efficiency plays an important role in the supply of infrastructure, which means facilities with higher charging efficiency is more popular for consumers and easier to be paid back.
Therefore, we put forward some specific policy suggestions for sustainable governance in EV market:
- (1)
- With the rapid development of EVs, accelerating the construction of EV charging infrastructure will help to alleviate the concerns of users about the mileage of EVs and change the views of ordinary consumers on the affordability and applicability of EVs. However, electricity regulators need to anticipate that there are probable differences about the growth of EVs and charging facilities construction between different areas. A high popularizing rate at a specific area may indicate the increasing of concentrated electric load, affecting the reliability of the power grid, adding the cost of electricity and bringing challenges to the power distributing system and to users. According to this, the power company supervision department should effectively design the price of electricity and the charging station location to ensure that power companies take the integration of EVs into consideration during the planning steps, integrate the EV charging resources and constantly optimize the pricing rules about the inherent usage of service cost.
- (2)
- Although product diversity can increase consumer utility, the electric vehicle charging and upgraded facilities market, however, should avoid the marketization process of a one-size-fits-all solution when the charging interface standard of charging stations cannot be unified to prevent monopoly in the market segments. Furthermore, to avoid socially excessive entry, the government should optimize entry regulations and lay down a criterion for the charging interface standards of charging stations as soon as possible.
- (3)
- Subsidies for the EV market could be more pertinent to encourage the technical progress and technological innovation. The government could focus on the producers more than the demand side, lower the tax to producers of EVs and provide extra subsidies on the technological invention and patents.
- (4)
- Once the government unifies the charging interface standard, intensifying the construction of the pile with multiple modes should be the following step, including the government’s building of piles and qualified uniform building piles constructed by government subsidized companies. Furthermore, the government could encourage more new models such as with crowd funding to construct 4.8 million charge piles officially to meet the 5 million EV charging demand forecasted for 2020. In addition, the government may introduce various ways of financing, such as PPP, to motivate nongovernmental capital to share both the risk and profit.
Acknowledgments
This project was co-sponsored by the National Natural Science Foundation of China (71390331, 71774095 and 71673165), Shandong Independent Innovation and Achievement Transformation Special Fund of China (2014ZZCX03302) and the International Science & Technology Cooperation Program of China (2016YFE0102200).
Author Contributions
All authors were involved in preparing the manuscript. Xunmin Ou and Xin Tian contributed to the design of the research framework and advised on aspects of energy consumption estimation. Tian Wu, Bohan Zeng and Yali He developed the methodology and constructed the theoretical model. Bohan Zeng and Yali He analyzed the sensitivity analyses. Tian Wu conducted the research and wrote the manuscript.
Conflicts of Interest
The authors declare no conflict of interest.
References
- Becker, T.A.; Ikhlaq, S.; Burghardt, T. Electric Vehicles in the United States: A New Model with Forecasts to 2030; Center for Entrepreneurship and Technology, University of California: Berkeley, CA, USA, 2009; Volume 1. [Google Scholar]
- Zhang, X.; Rao, R.; Xie, J.; Liang, Y. The Current Dilemma and Future Path of China’s Electric Vehicles. Sustainability 2014, 6, 1567–1593. [Google Scholar] [CrossRef]
- Wu, T.; Ma, L.; Mao, Z.; Ou, X. Setting up charging electric stations within residential communities in current China: Gaming of government agencies and property management companies. Energy Policy 2015, 77, 216–226. [Google Scholar] [CrossRef]
- Novshek, W. Cournot equilibrium with free entry. Rev. Econ. Stud. 1980, 47, 473–486. [Google Scholar] [CrossRef]
- Hart, O.D. Monopolistic competition in a large economy with differentiated commodities. Rev. Econ. Stud. 1980, 46, 1–30. [Google Scholar] [CrossRef]
- Suzumura, K.; Kiyono, K. Entry barriers and economic welfare. Rev. Econ. Stud. 1987, 54, 157–167. [Google Scholar] [CrossRef]
- Mankiw, N.G.; Whinston, M.D. Free entry and social inefficiency. RAND J. Econ. 1986, 17, 48–58. [Google Scholar] [CrossRef]
- Okuno-Fujiwara, M.; Suzumura, K. Symmetric cournot oligopoly and economic welfare: A synthesis. Econ. Theory 1993, 3, 43–59. [Google Scholar] [CrossRef]
- Spence, M. Product differentiation and welfare. Am. Econ. Rev. 1976, 66, 407–414. [Google Scholar]
- Dixit, A.K.; Stiglitz, J.E. Monopolistic competition and optimum product diversity. Am. Econ. Rev. 1977, 67, 297–308. [Google Scholar]
- Ghosh, A.; Morita, H. Free entry and social efficiency under vertical oligopoly. RAND J. Econ. 2007, 38, 541–554. [Google Scholar] [CrossRef]
- Ghosh, A.; Morita, H. Social desirability of free entry: a bilateral oligopoly analysis. Int. J. Ind. Organ. 2007, 25, 925–934. [Google Scholar] [CrossRef]
- Mukherjee, A. Social efficiency of entry with market leaders. J. Econ. Manag. Strategy 2012, 21, 431–444. [Google Scholar] [CrossRef]
- Mukherjee, A. External economies of scale and insufficient entry. J. Ind. Compet. Trade 2010, 10, 365–371. [Google Scholar] [CrossRef]
- Marjit, S.; Mukherjee, A. Foreign competition and social efficiency of entry. Econ. Model. 2013, 32, 108–112. [Google Scholar] [CrossRef]
- Creane, A. Note on uncertainty and socially excessive entry. Int. J. Econ. Theory 2007, 3, 329–334. [Google Scholar] [CrossRef]
- Berry, S.; Waldfogel, J. Free entry and social inefficiency in radio broadcasting. RAND J. Econ. 1996, 30, 397–420. [Google Scholar] [CrossRef]
- Liu, J. Electric vehicle charging infrastructure assignment and power grid impacts assessment in Beijing. Energy Policy 2012, 51, 544–557. [Google Scholar] [CrossRef]
- He, Y.; Chowdhury, M.; Ma, Y.; Pisu, P. Merging mobility and energy vision with hybrid electric vehicles and vehicle infrastructure integration. Energy Policy 2012, 41, 599–609. [Google Scholar] [CrossRef]
- Peterson, S.B.; Michalek, J.J. Cost-effectiveness of plug-in hybrid electric vehicle battery capacity and charging infrastructure investment for reducing US gasoline consumption. Energy Policy 2013, 52, 429–438. [Google Scholar] [CrossRef]
- Schroeder, A.; Traber, T. The economics of fast charging infrastructure for electric vehicles. Energy Policy 2012, 43, 136–144. [Google Scholar] [CrossRef]
- Colmenar-Santos, A.; Palacio, C.D.; Borge-Diez, D.; Monzón-Alejandro, O. Planning minimum interurban fast charging infrastructure for electric vehicles: Methodology and application to Spain. Energies 2014, 7, 1207–1229. [Google Scholar] [CrossRef]
- Nansai, K.; Tohno, S.; Kono, M.; Kasahara, M.; Moriguchi, Y. Life-cycle analysis of charging infrastructure for electric vehicles. Appl. Energy 2001, 70, 251–265. [Google Scholar] [CrossRef]
- Morrissey, P.; Weldon, P.; O’Mahony, M. Future standard and fast charging infrastructure planning: An analysis of electric vehicle charging behaviour. Energy Policy 2016, 89, 257–270. [Google Scholar] [CrossRef]
- Chen, L.; Huang, X.; Chen, Z.; Jin, L. Study of a new quick-charging strategy for electric vehicles in highway charging stations. Energies 2016, 9, 744. [Google Scholar] [CrossRef]
- Ye, B.; Jiang, J.; Miao, L.; Yang, P.; Li, J.; Shen, B. Feasibility study of a solar-powered electric vehicle charging station model. Energies 2015, 8, 13265–13283. [Google Scholar] [CrossRef]
- Spence, M. Product selection, fixed costs, and monopolistic competition. Rev. Econ. Stud. 1976, 43, 217–235. [Google Scholar] [CrossRef]
- Koenker, R.W.; Perry, M.K. Product differentiation, monopolistic competition, and public policy. Bell J. Econ. 1981, 12, 217–231. [Google Scholar] [CrossRef]
- Zhang, Q.; Ou, X.; Yan, X.; Zhang, X. Electric vehicle market penetration and impacts on energy consumption and CO2 emission in the future: Beijing case. Energies 2017, 10, 228. [Google Scholar] [CrossRef]
- Lin, C.; Wu, T.; Ou, X.; Zhang, Q.; Zhang, X.; Zhang, X. Life-cycle private costs of hybrid electric vehicles in the current Chinese market. Energy Policy 2013, 55, 501–510. [Google Scholar] [CrossRef]
- Hao, H.; Cheng, X.; Liu, Z.; Zhao, F. China’s traction battery technology roadmap: Targets, impacts and concerns. Energy Policy 2017, 108, 355–358. [Google Scholar] [CrossRef]
- The State Council of the People’s Republic of China. Energy Saving and Development Plan of New Energy Vehicle Industry, 2012–2020. Available online: http://www.gov.cn/zwgk/2012-07/09/content_2179032.htm (accessed on 23 October 2017). (In Chinese)
- Forward Industry Research Institute. Investment Analysis Report on the Development of Electric Vehicle Charging Stations in China, 2016–2021. Available online: https://bg.qianzhan.com/trends/detail/506/160624-073ebc2b.html (accessed on 23 October 2017). (In Chinese).
- Li, G.; Zhang, X. Modeling of plug-in hybrid electric vehicle charging demand in probabilistic power flow calculations. IEEE Trans. Smart Grid 2012, 3, 492–499. [Google Scholar] [CrossRef]
Figure 1.
Number of electric vehicle charging stations in provinces of China.

Figure 2.
Development of new energy vehicles and charging piles in China (2012–2016).

Figure 3.
Sensitivity analysis of time preference. Note: Parameter values used are in both (a,b). Since , thus, , we plot with ranges of : from 0 to 0.5 in (a); and 0.5 to 1 in (b).
Figure 3.
Sensitivity analysis of time preference. Note: Parameter values used are in both (a,b). Since , thus, , we plot with ranges of : from 0 to 0.5 in (a); and 0.5 to 1 in (b).

Figure 4.
Sensitivity analysis of production diversification.

Figure 5.
(a) Sensitivity analysis of the constant cost parameter; (b) sensitivity analysis of the feature of marginal cost in production; and (c) sensitivity analysis of fixed cost for EV industry.
Figure 5.
(a) Sensitivity analysis of the constant cost parameter; (b) sensitivity analysis of the feature of marginal cost in production; and (c) sensitivity analysis of fixed cost for EV industry.

Figure 6.
Expected price of EVs with no subsidy in China.

Figure 7.
Expected price of EVs with the high level of subsidy in China.

Figure 8.
Maintenance cost and insurance of EV per year.

Figure 9.
Charging fee under diverse situations.

Figure 10.
Expected productions and sales of EVs in China.

Figure 11.
Income and profit analysis of typical charging stations.

Figure 12.
Payback period of charging stations.


Table 1.
Parameter description for sensitivity analysis of different situations.
| Parameter | Fiducial Value | Ranges | Data Sources |
|---|---|---|---|
| Battery cost of EV | $376/kW h | $195–$376/kWh | Zhang et al. [29] |
| Subsidy of EV | $6000 | $2200–$8200 | |
| Electricity price | $0.13/kW h | $0.07–0.14/kWh | |
| Mileage per year | 14,143 km/year/car | 12,000–15,000 km/year/car | |
| Price of EV | $35,000 | $25,000–$39,000 | Lin et al. [30] |
| Maintenance cost and insurance fee of EV per year | $1100/year | $800–$1200/year | |
| Life of battery | 8 years | 8–12 years | Hao et al. [31] |
| Endurance mileage | 372 km | 150–630 km | Investigating data of 20 kinds of EVs on hot sale, including Tesla, BAIC, BYD, DENZA, BMW |
| Production and sales of EVs | $52,600 | $52,600–$331,000 | Decree of the State Council of the People’s Republic of China. No. 22 [32] |
| Infrastructure investment of charging station | $361,000 | - | Forward industry research institute [33] |
| Income of charging station | $55,600/year | $55,600–$222,600/year |
© 2017 by the authors. Licensee MDPI, Basel, Switzerland. This article is an open access article distributed under the terms and conditions of the Creative Commons Attribution (CC BY) license (http://creativecommons.org/licenses/by/4.0/).
Share and Cite
MDPI and ACS Style
Wu, T.; Zeng, B.; He, Y.; Tian, X.; Ou, X. Sustainable Governance for the Opened Electric Vehicle Charging and Upgraded Facilities Market. Sustainability 2017, 9, 2126. https://0-doi-org.brum.beds.ac.uk/10.3390/su9112126
AMA Style
Wu T, Zeng B, He Y, Tian X, Ou X. Sustainable Governance for the Opened Electric Vehicle Charging and Upgraded Facilities Market. Sustainability. 2017; 9(11):2126. https://0-doi-org.brum.beds.ac.uk/10.3390/su9112126
Chicago/Turabian StyleWu, Tian, Bohan Zeng, Yali He, Xin Tian, and Xunmin Ou. 2017. "Sustainable Governance for the Opened Electric Vehicle Charging and Upgraded Facilities Market" Sustainability 9, no. 11: 2126. https://0-doi-org.brum.beds.ac.uk/10.3390/su9112126
Note that from the first issue of 2016, this journal uses article numbers instead of page numbers. See further details here.