Article

An Open Source-Based Real-Time Data Processing Architecture Framework for Manufacturing Sustainability

1
Department of Industrial and Systems Engineering, Dongguk University, Seoul 100-715, Korea
2
u-SCM Research Center, Nano Information Technology Academy, Dongguk University, Seoul 100-715, Korea
3
Department of Systems Management Engineering, Sungkyunkwan University, 2066 Seobu-ro, Jangan-gu, Suwon, Gyeonggi-do 16419, Korea
*
Author to whom correspondence should be addressed.
Sustainability 2017, 9(11), 2139; https://0-doi-org.brum.beds.ac.uk/10.3390/su9112139
Submission received: 12 October 2017 / Revised: 15 November 2017 / Accepted: 17 November 2017 / Published: 20 November 2017
(This article belongs to the Special Issue Sustainable Materials and Manufacturing)

Abstract

:
Currently, the manufacturing industry is experiencing a data-driven revolution. There are multiple processes in the manufacturing industry and will eventually generate a large amount of data. Collecting, analyzing and storing a large amount of data are one of key elements of the smart manufacturing industry. To ensure that all processes within the manufacturing industry are functioning smoothly, the big data processing is needed. Thus, in this study an open source-based real-time data processing (OSRDP) architecture framework was proposed. OSRDP architecture framework consists of several open sources technologies, including Apache Kafka, Apache Storm and NoSQL MongoDB that are effective and cost efficient for real-time data processing. Several experiments and impact analysis for manufacturing sustainability are provided. The results showed that the proposed system is capable of processing a massive sensor data efficiently when the number of sensors data and devices increases. In addition, the data mining based on Random Forest is presented to predict the quality of products given the sensor data as the input. The Random Forest successfully classifies the defect and non-defect products, and generates high accuracy compared to other data mining algorithms. This study is expected to support the management in their decision-making for product quality inspection and support manufacturing sustainability.

1. Introduction

In the modern industrialized society, manufacturing is the key backbone and has become a major source of the global economy [1]. For any advanced country, having such a strong base of manufacturing becomes significant issue because it will stimulate other sectors of economy in their country [2]. Nowadays, people are more conscious about sustainability issues and the condition of today’s global environment. Global warming, pollution, shortage of oil, extinction of species, have frequently been covered in the news and have been major subjects of political discussion. Goodland defined that sustainability has three fundamental aspects: environmental (natural resources), social (health, poverty) and economic (productivity, competitiveness) [3]. Rosen and Kishawy (2012) explained in their study, the importance of integrating sustainability with manufacturing as it can improve the environmental performance [4]. The current study predicted that decision makers who adopt a sustainability culture within companies are more likely to be successful in enhancing design and manufacturing. In addition, Garetti and Taisch (2012) revealed that the manufacturing technology together with culture and economy can be considered as the tools and options for building new solutions towards a sustainable manufacturing concept [5]. Gunasekaran and Spalanzani (2012) suggested that balancing the economic, environmental and social challenges needs further attention from researchers and practitioners and a framework is needed for the sustainable development in manufacturing [6].
Modern manufacturing facilities are data-rich environments that support transmission, sharing and analysis of information across pervasive networks to produce smart manufacturing [7,8]. Potential benefits of smart manufacturing include improvements in operational efficiency, process innovation, and environmental impact [9,10]. However, like other industries and domains, current information systems that support business and smart manufacturing are being tasked with the responsibility of storing increasingly large data sets (i.e., big data), as well as supporting real-time processing using advanced analytics [10,11,12,13,14]. Presently, the Internet of Things (IoT) device is used as technology to transmit this raw sensor data to be used in real-time big data analytics. The focus on big data technologies in manufacturing is a relatively new interdisciplinary research area incorporating automation, engineering, information technology and data analytics. At this point, it is important to identify appropriate technologies that can address big data issues in manufacturing that are effective, cost efficient and maintain environment. Furthermore, managing quality is crucial for the manufacturing enterprises to survive the competition in the global market and to improve customer satisfaction. The traditional visual inspection is not efficient enough to ensure the quality of the product in manufacturing, as it can increase the cost and the resources during the process [15]. As solution, the data mining can be utilized to help in identifying not only the defective products but can also simultaneously determine the significant factors that influence the success or failure of the process [16].
Therefore, this study proposes an open source-based real-time data processing (OSRDP) architecture framework for manufacturing sustainability. OSRDP architecture framework consists of several open sources technologies, including Apache Kafka, Apache Storm and NoSQL MongoDB that are effective and cost efficient. Multiple streams of sensor data generated from the machines are received by Apache Kafka, next are processed at Apache Storm, and then stored in a distributed storage NoSQL MongoDB. For improving the quality prediction, the data mining technique is used to predict the quality of products based on historical sensor data that previously stored in the NoSQL MongoDB. The proposed OSRDP architecture framework utilized open-source based technologies and big data analytics which supports on manufacturing sustainability, especially in terms of reducing investment cost [17,18] and reducing the social risk [19]. In addition, the data mining based quality prediction is utilized in our OSRDP framework, thus it is expected to support the management in their decision-making for product quality inspection and reduce the inspection cost [15]. This framework can be applied for many real-time big data analytics in manufacturing and expected to support the management and manufacturing sustainability.
The remainder of this study is described as follows. In Section 2, the literature review is described. In Section 3, the OSRDP architecture framework and OSRDP scenario in manufacturing are presented. In Section 4, the experimental environment, data collection, performance evaluation and performance result are provided. The discussion about cost analysis to select a cost-effective integration and the impact analysis of OSRDP on the manufacturing sustainability are presented in Section 5. Finally, in Section 6 concluding remarks and future work of this study are presented.

2. Literature Review

2.1. Real-time Big Data Processing in Manufacturing

As increasing the Internet of Things (IoT) and sensor devices, it is expected that the data generated from manufacturing process will grow exponentially, generating so called ‘big data’. One of the focuses of smart manufacturing is to create real-time monitoring system to support accurate and timely decision-making. Therefore, big data analytics is expected to contribute significantly to the advancement of smart manufacturing. Mani et al. (2017) explored the application of big data analytics in mitigating supply chain social risk and to demonstrate how such mitigation can help in achieving sustainability [19]. The results show that companies can predict various social problems including workforce safety, fuel consumptions monitoring, workforce health, security, physical condition of vehicles, unethical behavior, theft, speeding and traffic violations through big data analytics, thereby demonstrating how information management actions can mitigate social risks. Malek et al. (2017) combined IoT with Big data technologies into single platform for continuous and real-time data monitoring and processing [20]. The experiments utilized open hardware sensors, such as pulse and oximetry, carbon dioxide in air, humidity and temperature sensors. The purpose of study is to analyses how the lack of proper building’s ventilation can impair occupants’ performance and affect their health. The proposed system is able to monitor the sensor data in real-time, and found direct relationship between CO2 and O2 concentration inside building.
The development of information technology and sensor technology has enabled large-scale data collection when monitoring the manufacturing processes. Those data could be potentially useful when learning patterns and knowledge for the purpose of quality improvement in manufacturing processes. Therefore, the integration of big data and data mining technology in smart manufacturing is expected to help the management in decision making. He and Wang (2017) utilized statistical process monitoring for big data analytics tool in smart manufacturing [21]. Proposed system is able to handle large volume of streaming data for real-time, statistical analysis and online monitoring. Siddique et al. (2017) proposed an efficient intrusion detection system which continuously monitors network traffic aiming to identify malicious actions [22]. The proposed system is capable of handling large volume of network traffic in real-time environments. Based on contemporary dataset, the proposed model showed high performance and efficiency.

2.2. Open Source Technologies for Big Data Processing

Open Source Initiative defines Open Source Software (OSS) as; “software that can be freely used, changed, and shared (in modified or unmodified form) by anyone” [23]. In contrast to traditional software development model, the OSS development model heavily relies on contributions of volunteers, rather than traditional employees. Many projects, such as the Linux operating systems, the Mozilla browser, Apache Kafka, Apache Strom, MongoDB, and the Apache web server have been successfully developed in OSS communities [24]. In the manufacturing area, many researchers had used open source-based application to achieve the concept of integrated enterprise [25]. In this study, three open source big data processing are used, they are Apache Kafka, Apache Storm and NoSQL MongoDB. The Apache Kafka is used for handling the incoming fast large volume of streaming data while Apache Storm is utilized for real-time distributed processing. In addition, MongoDB is used to store the large amount of unstructured sensor data.
Apache Kafka is a scalable publish-subscribe messaging system and used for building real-time data pipelines [26]. It is built to be fault-tolerant, high-throughput, horizontally scalable, and allows geographically distributing data streams and processing. Apache Kafka consists of several components, they are topics (the name of category or feed to which messages/logs are published), producers (the processes that publish messages/logs into Apache Kafka), consumers (the process that subscribes to topics and process the feed of published messages) and broker (the name of the server which Apache Kafka process is operating on that server). Apache Kafka is well suited for situations wherein users must process real-time data, and analyze them. At LinkedIn, Apache Kafka supports dozens of subscribing systems, and delivers more than 55 billion messages to consumers daily [27]. Kreps et al. (2011) introduced Kafka, a distributed messaging system that used for high volumes of log data. It also provides integrated distributed support and can scale out. The result showed that Kafka achieves much higher throughput than conventional messaging systems (such as ActiveMQ and RabbitMQ) [28]. Fernandez-Rodriguez et al. (2017) proposed real-time vehicle data streaming models for a smart city [29]. The proposed system gathers information from drivers in a big city, analyzing that information and sending real-time recommendations to improve driving efficiency and safety on roads. A simulation is used to evaluate the system performance and Apache Kafka is utilized for stream processing. The result showed that Apache Kafka achieve a higher scalability and faster responses as well as cost reduction compared to traditional system.
Apache Storm is an open-source distributed real-time computation system for processing large volumes of high-velocity data [30]. Apache Storm includes multiple features such as horizontal scalability, fault tolerance, guaranteed data processing and the support of different programming languages. Scalability feature of Apache Storm includes possibility of rebalancing a cluster when new working nodes have been added. Guaranteed data processing ensures that if a worker node fails, Storm will automatically reassign tasks and replay all tuples to guarantee its processing. Apache Storm runs in-memory, therefore it is able to process large volumes of data at in-memory speed. Previous studies have utilized Apache Storm for real-time big data processing. Nivash et al. (2014) compared the performance of data processing models like Hadoop, Apache YARN, Mapreduce, Storm and Akka in the Big Data domain [31]. The current study proposed two algorithms namely JATS and SD, which enhance the efficiency of the Storm data processing architecture. The proposed system is capable of handling huge amount of data in real-time. De Maio et al. (2017) proposed the temporal fuzzy concept analysis on a distributed real-time computation system based on Apache Storm [32]. The proposed system is implemented by utilizing big data stream analysis in the smart city context and expected to support smart city decision-making processes. In addition, Yang et al. (2013) studied several technologies associated with real-time big data processing. The proposed system is built based on Storm, and the result showed that the big data real-time processing based on Storm can be widely used in various computing environment [33].
The NoSQL MongoDB is used to store the large amount of unstructured sensor data. The term ‘NoSQL’ collectively refers to database technologies that do not abide by the strict data model of relational databases. MongoDB is a document-oriented NoSQL database that offers high performance and scalability. By sacrificing some properties of relational database model, NoSQL databases can achieve higher availability and scalability, essential requirements for big data processing. Unlike other NoSQL databases, its data structure is designed independently as a document unit so that schema definition is not needed. MongoDB uses a scale-out scheme, which is flexible against hardware expansion, and supports auto-sharding. Thus, the automatic distribution of data over several servers can be conveniently carried out [34,35,36,37]. There have been various researches on the performance of MongoDB. Nyati et al. (2013) compared the insertion/searching performance of MongoDB to MySQL in a single machine, showing that MongoDB outperformed MySQL [38]. Kanade et al. (2014) conducted an experimental comparative study between embedding and referencing design patterns, showing that the embedding pattern performs better in terms of query response time [39]. Liu et al. (2012) proposed an algorithm to solve irregular distribution of data among distributed storages, and demonstrated that the proposed approach can improve the throughput and read/write response time of the existing automatic data distribution [40].
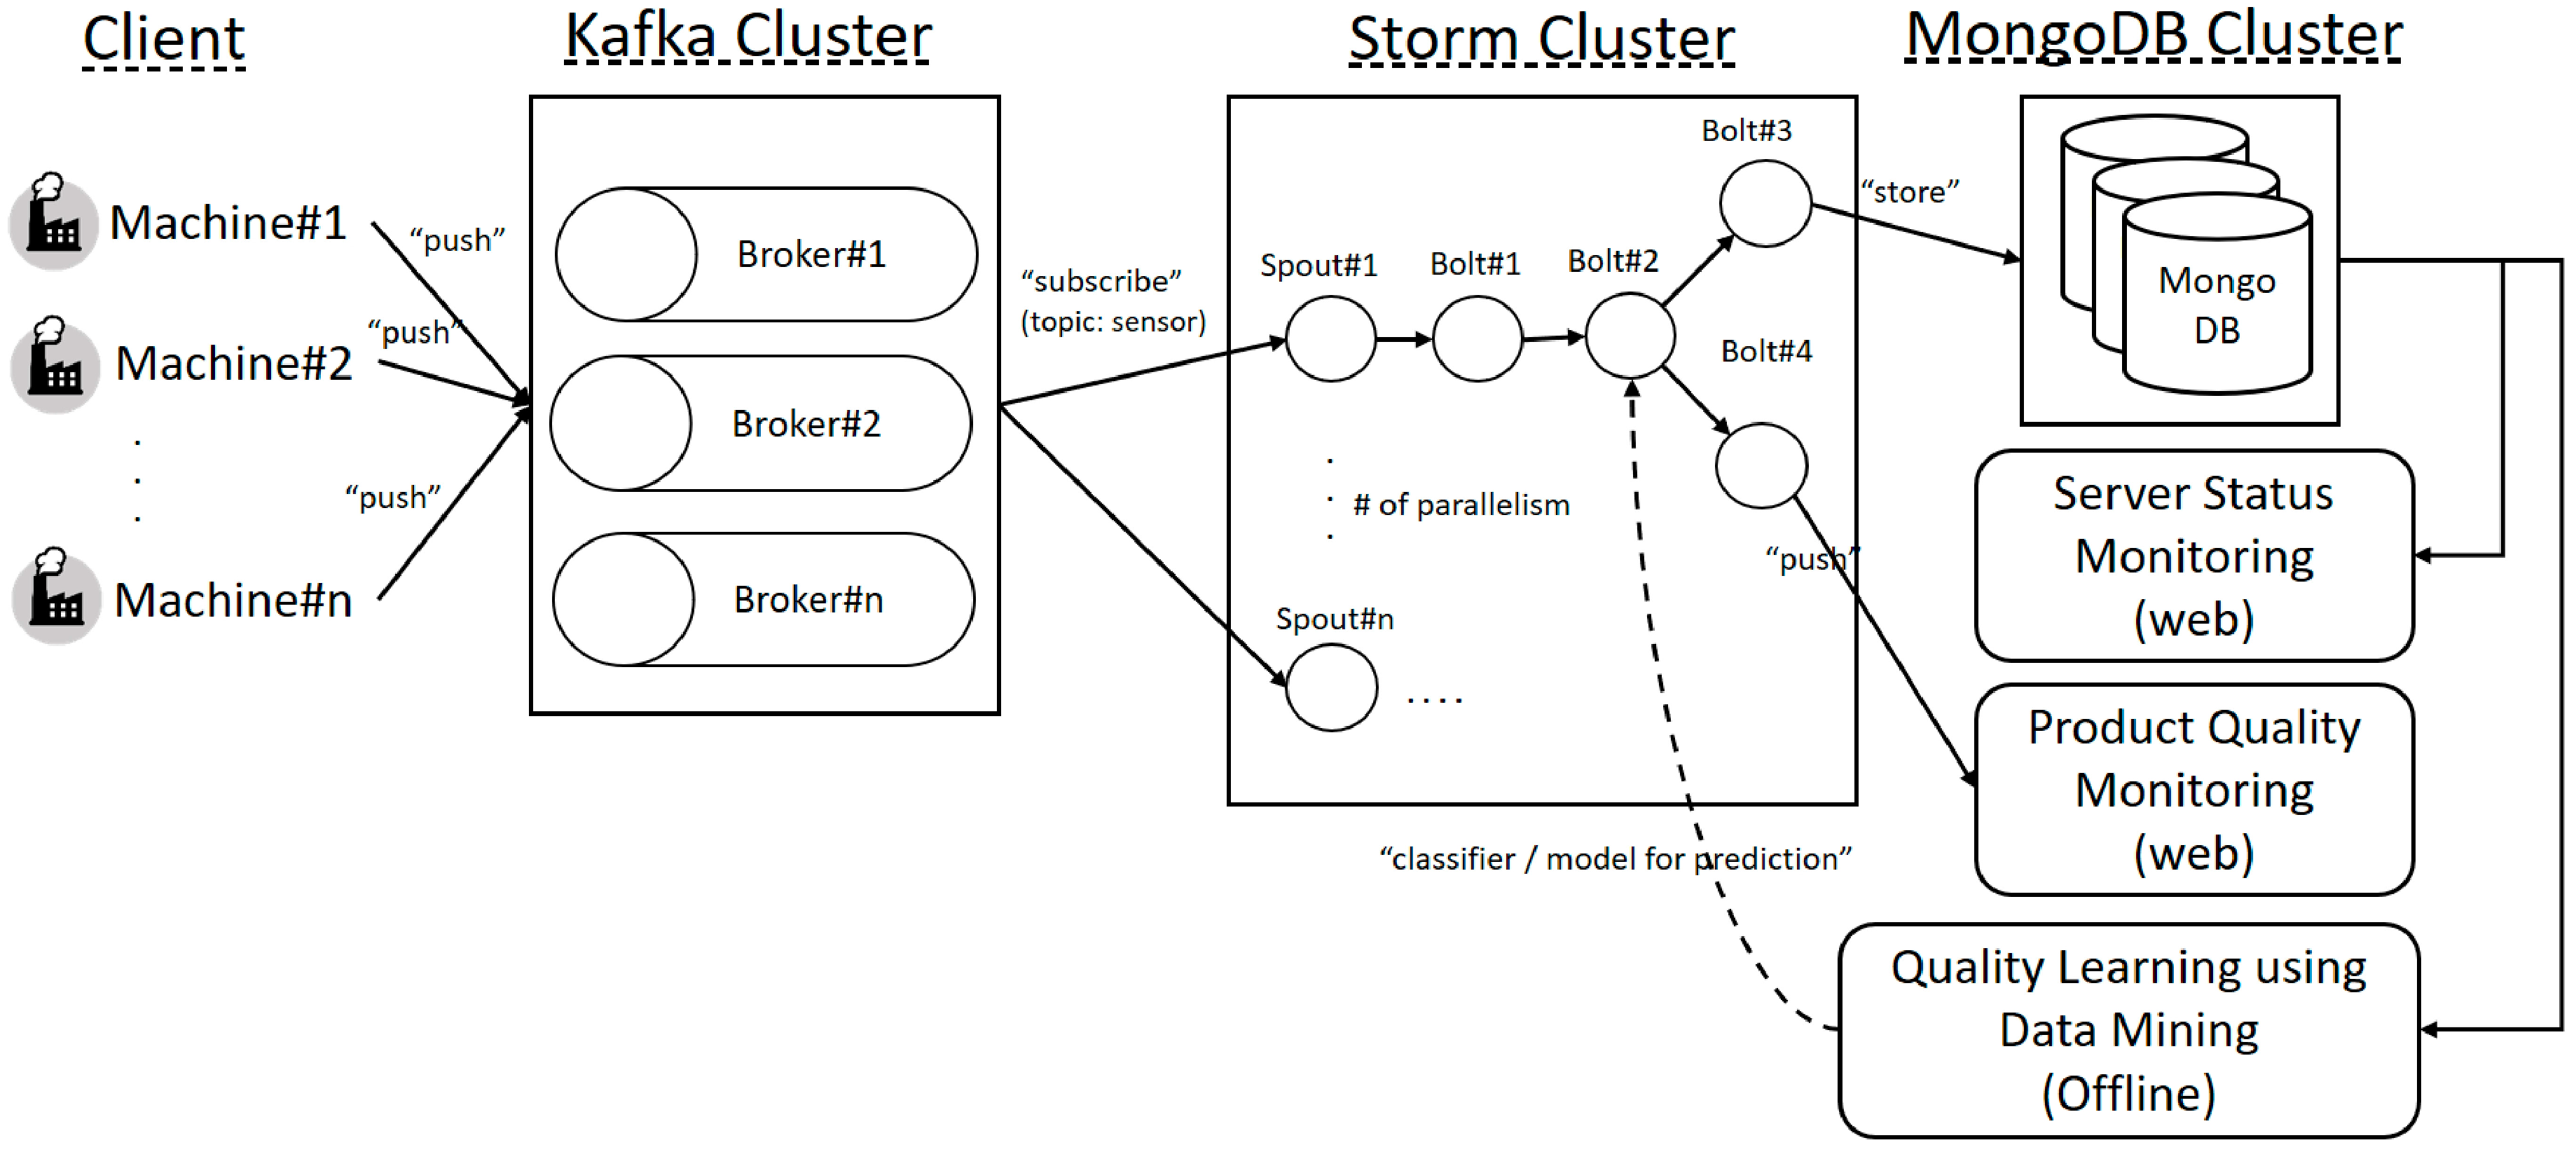
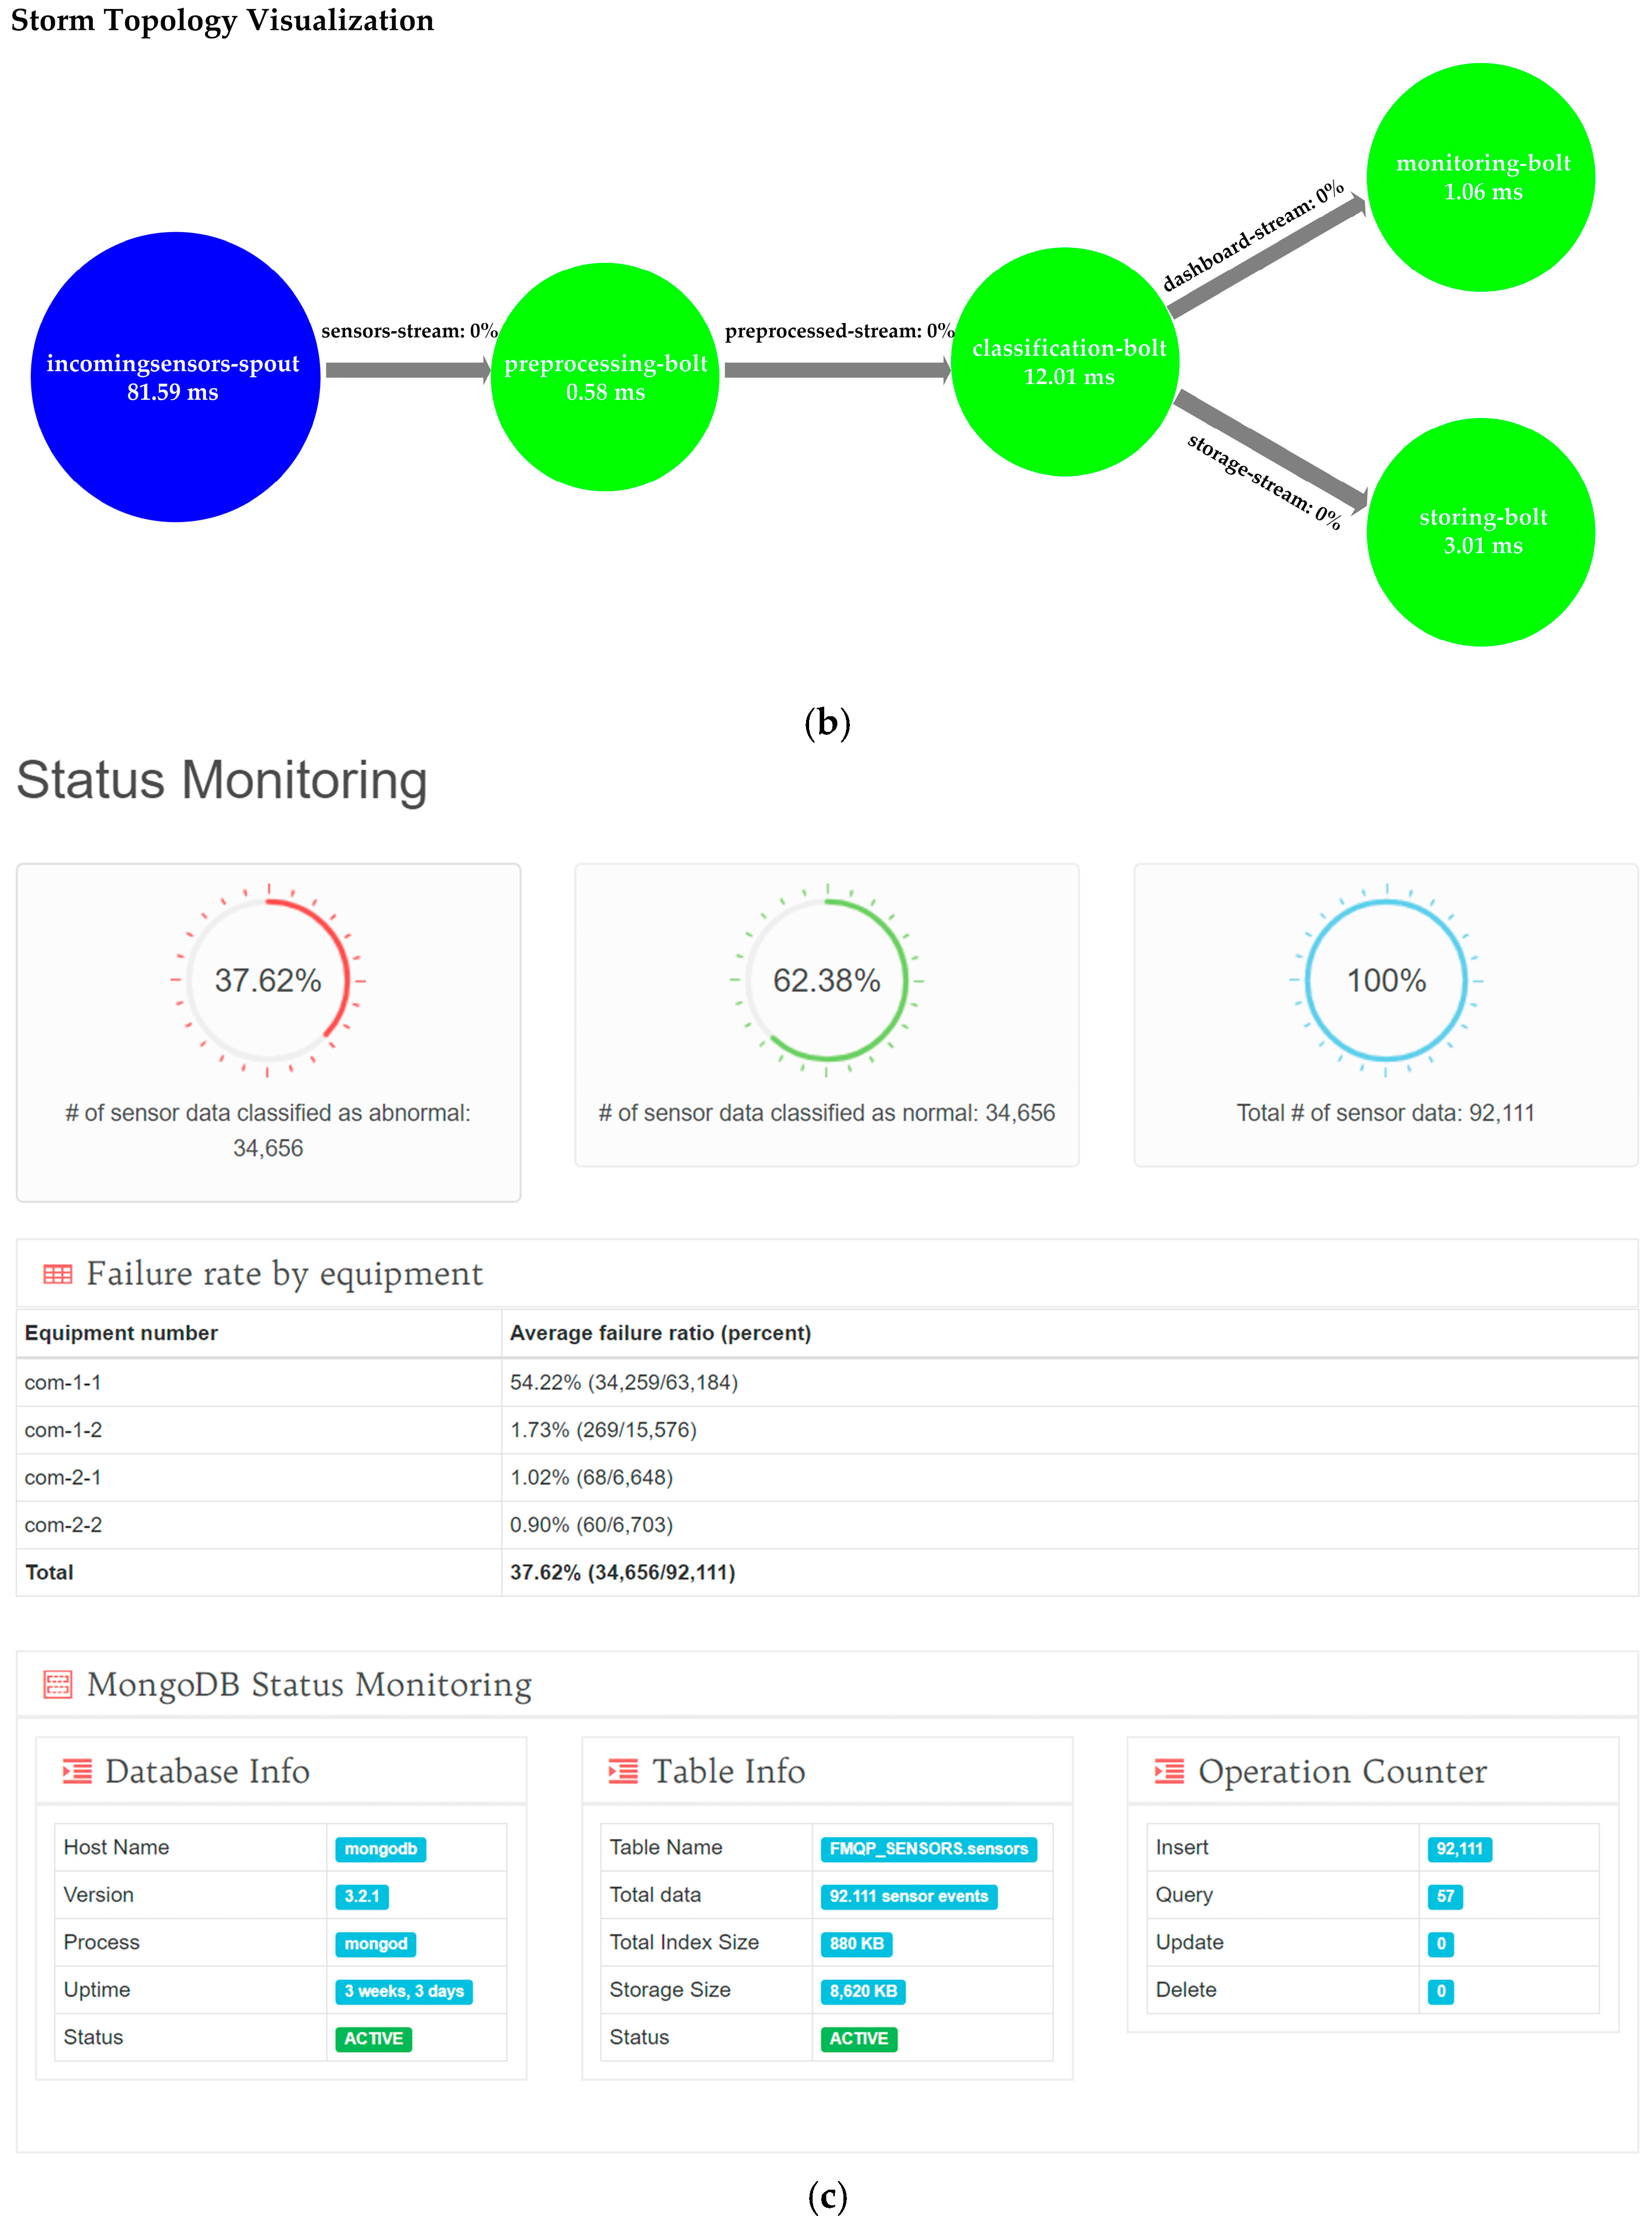
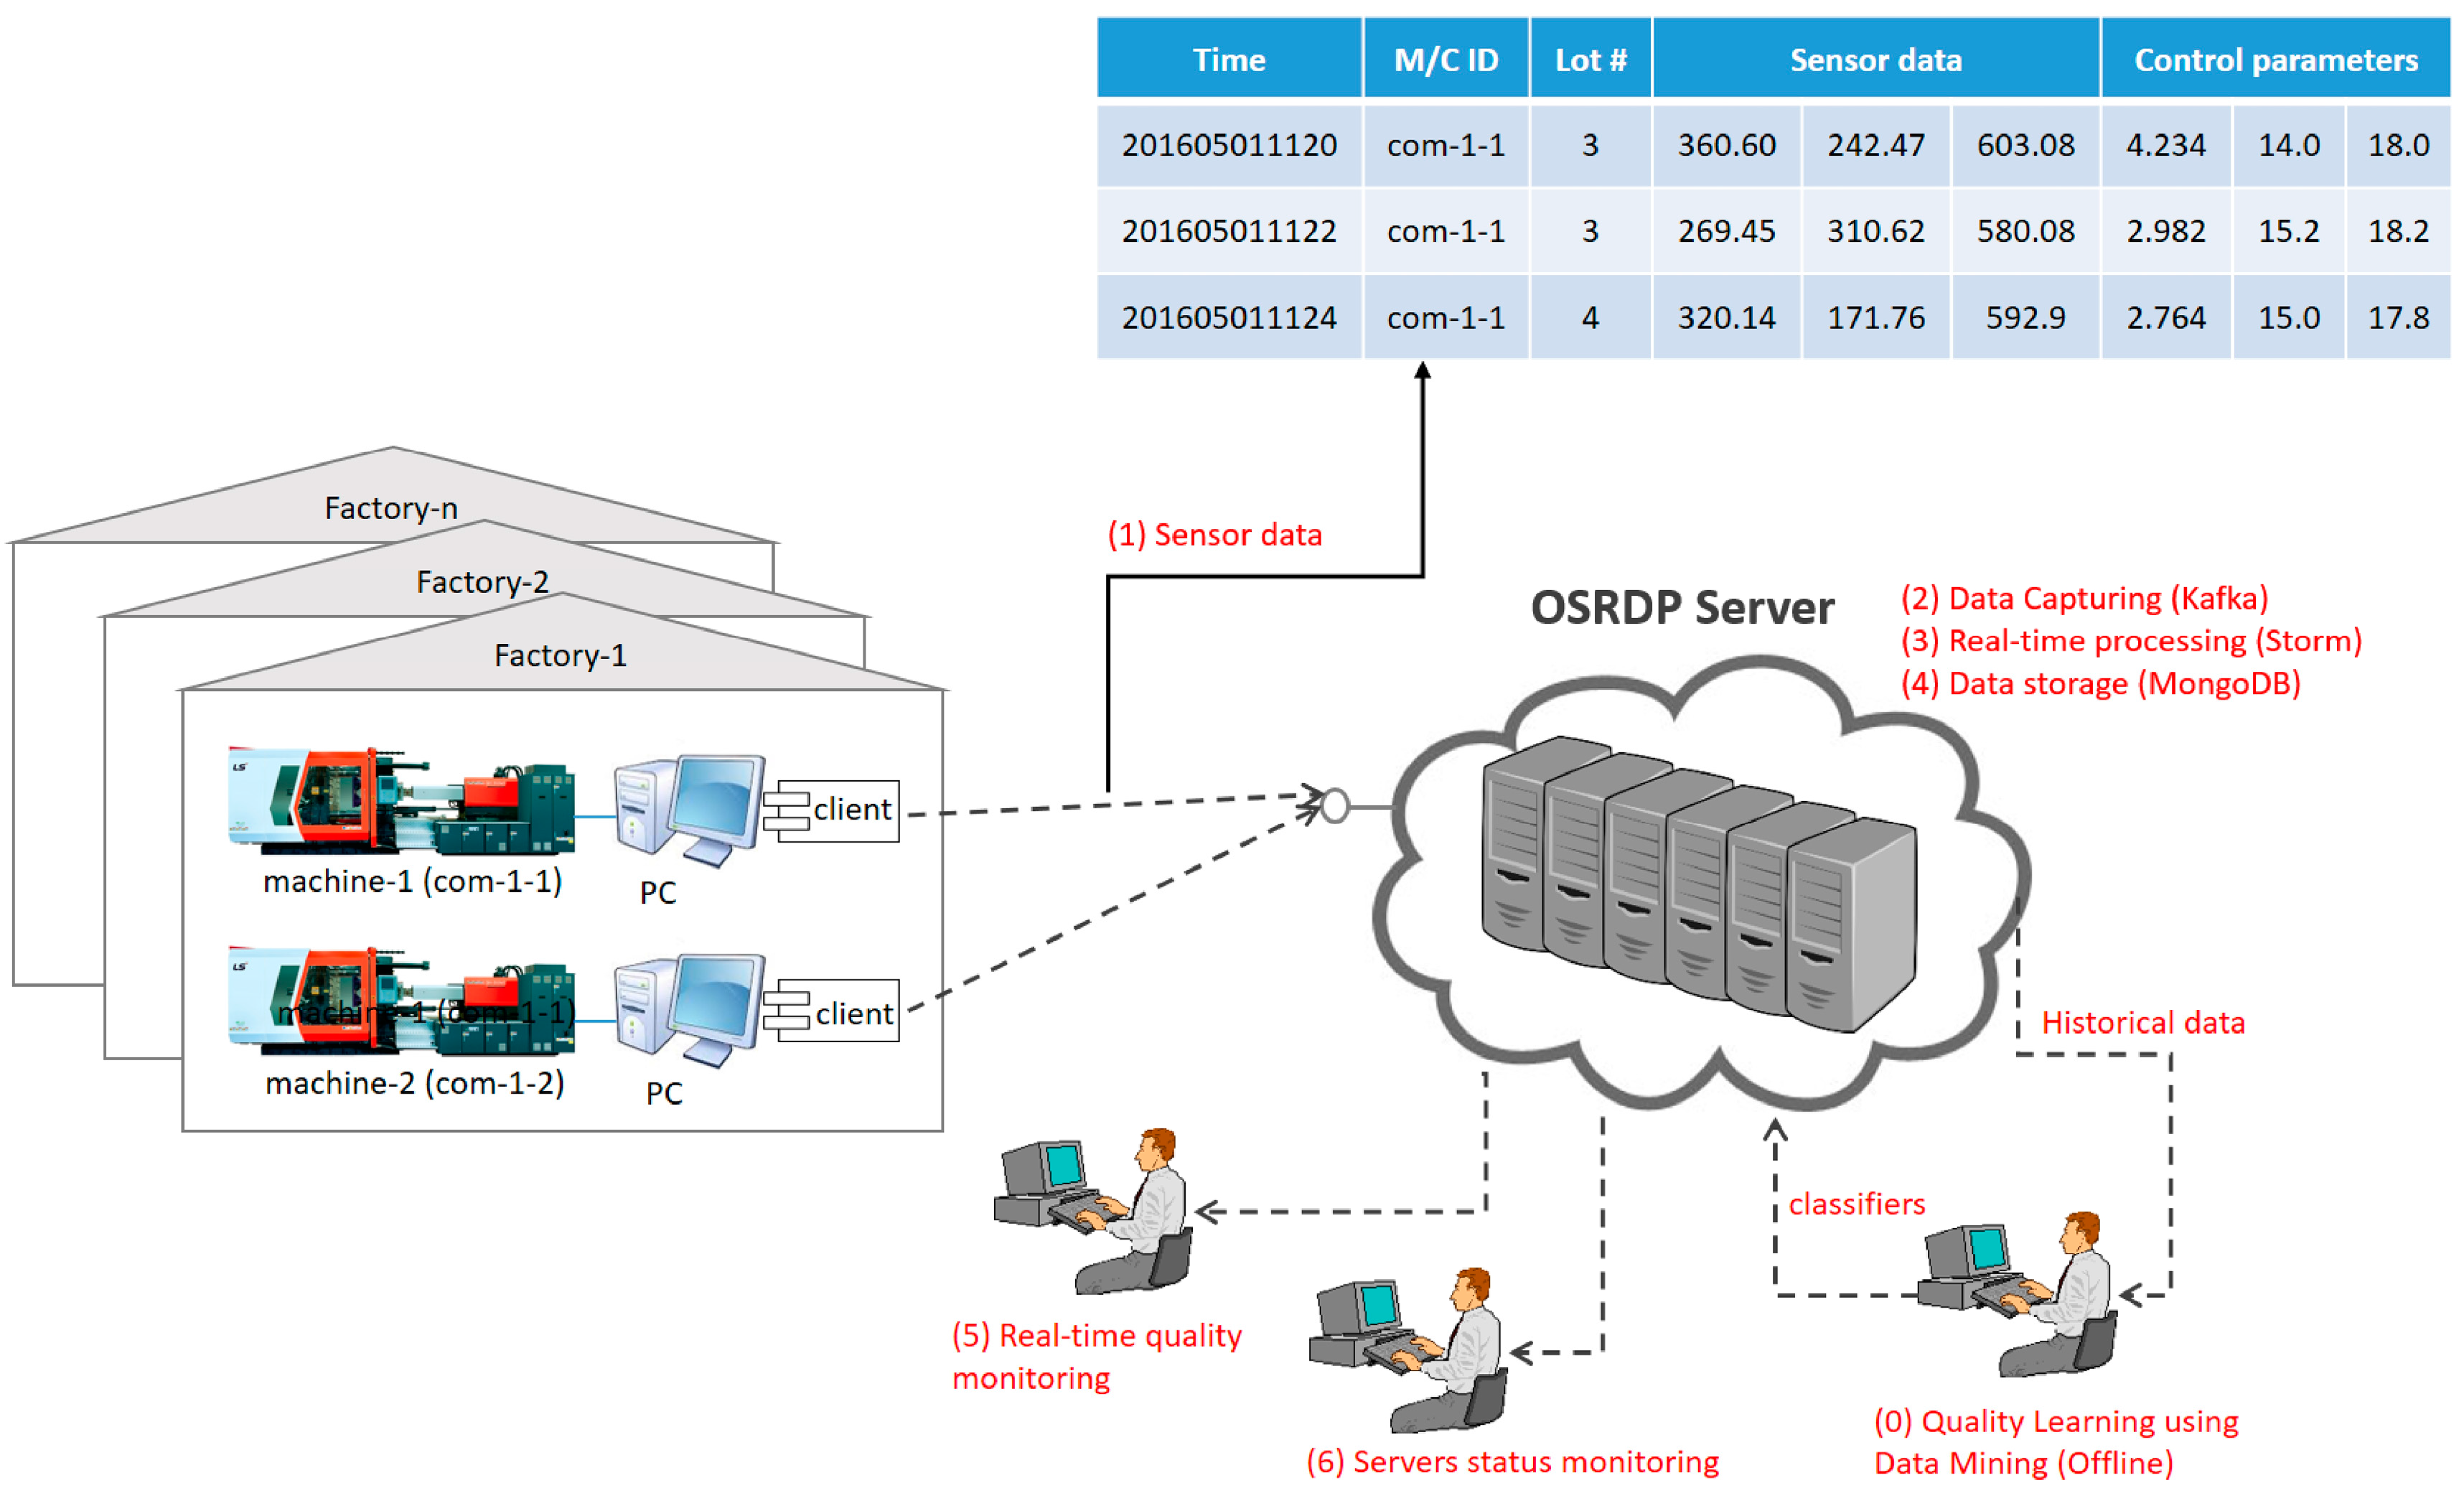
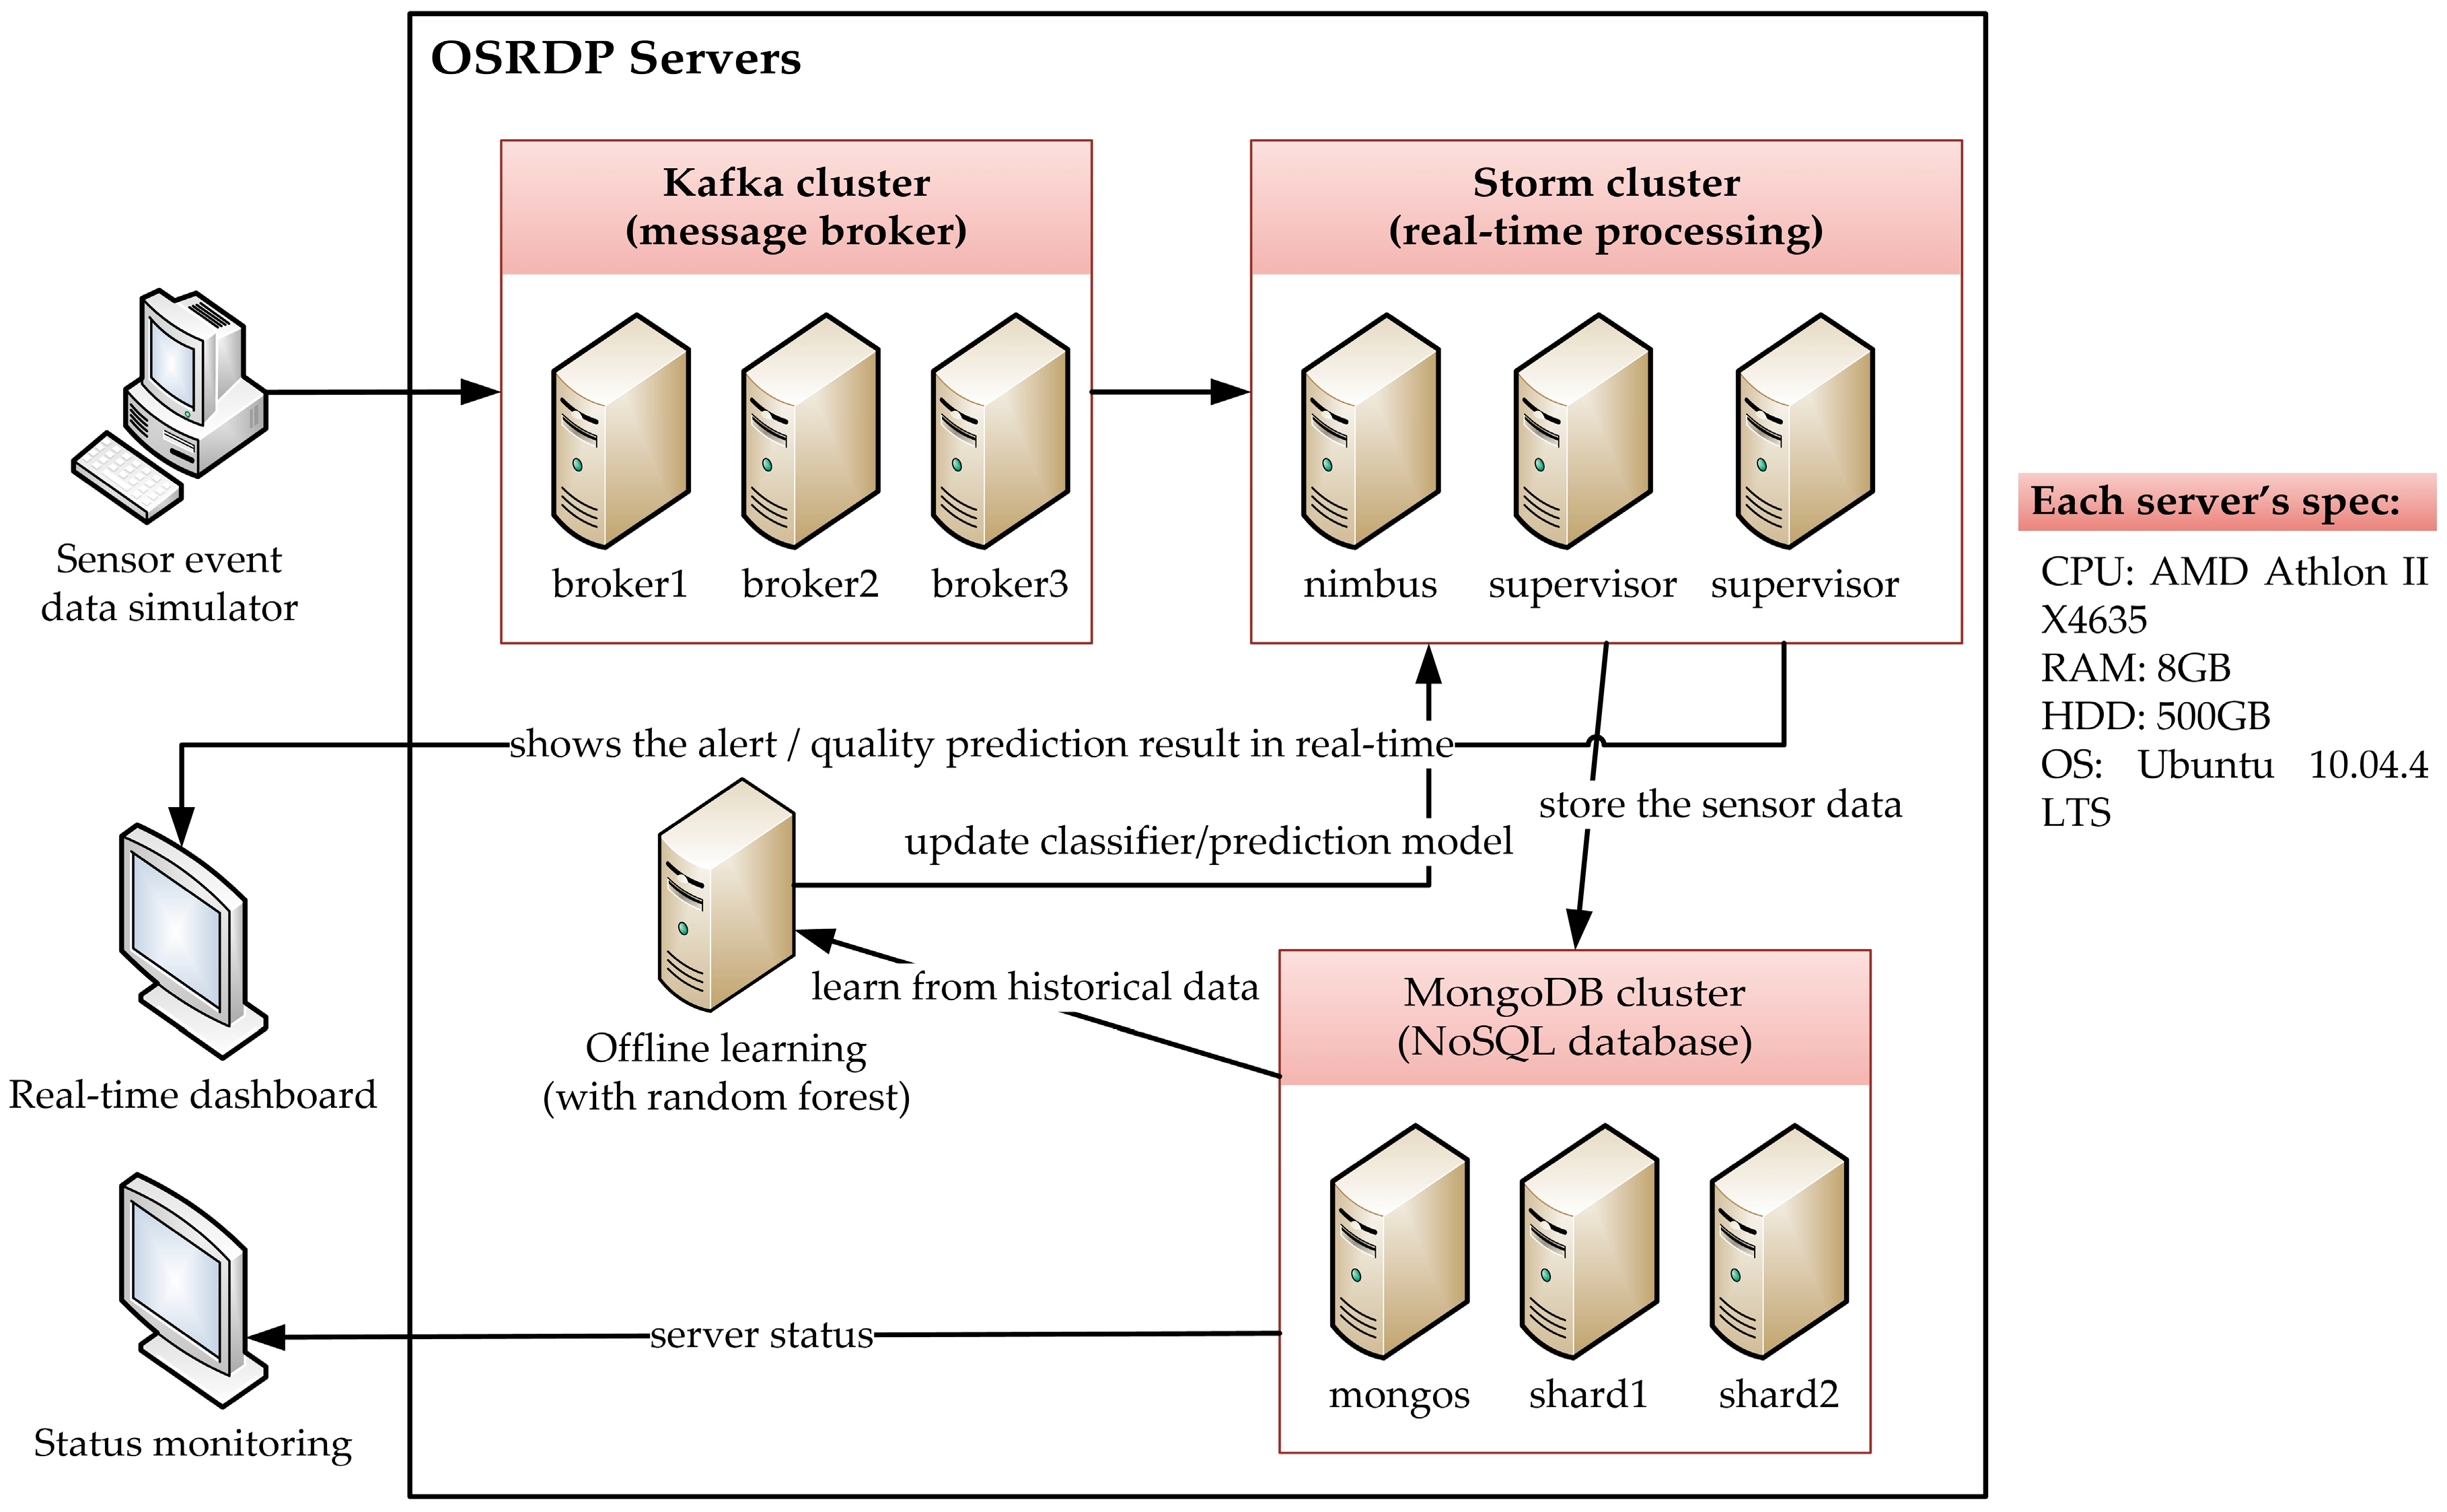
In our proposed OSRDP architecture framework, we created a topology that receives sensors data from Apache Kafka, executes, processes, analyzes, monitors and stores sensor data in real-time. Apache Storm is used to process streaming data continuously, while NoSQL MongoDB is used for saving data. For improving the quality prediction, the data mining technique is used as the last part to analyze the historical sensor data that previously stored in the NoSQL MongoDB.

2.3. Quality Improvement Based on Data Mining

Managing quality is crucial for the manufacturing enterprises to survive the competition in the global market. Industries today need to stay ahead in competition by servicing and satisfying customer’s needs. At the moment, the process to ensure the quality of the product in manufacturing is based on the visual inspection, and these operations increase the cost and the resources during the process [15]. The application of data mining can help in identifying not only the defective products but can also simultaneously determine the significant factors that influence the success or failure of the process. Data mining is now used in many different areas in in manufacturing, especially in the areas of production processes, control, maintenance, customer relationship management (CRM), decision support systems (DSS), quality improvement, fault detection, and engineering design [16]. Data can be analyzed to identify hidden patterns in the parameters that control manufacturing processes or to determine and improve the quality of products.
Quality of the products that satisfy customer demands is the key goal for a product manufacturing company. A product produced with variation in characteristics, than the anticipated are called as defect. Ferreiro et al. (2011) proposed the system to detect automatically the quality of material [15]. The material for the tests was aluminum Al 7075-T6, commonly used in aeronautical structures. The current studied showed that probability technique Naive Bayes generated high accuracy around 95% to classify whether the burr from material is out of tolerance limits or not. Tseng et al. (2004) used rough set theory to resolve quality control problems in PCB manufacturing by identifying the features that produce solder ball defect and also determined the features that significantly affect the quality of the product [41]. Chen et al. (2005) generated association rules for defect detection in semiconductor manufacturing. They determined the association between different machines and their combination with defects to determine the defective machine. In the mild steel coil manufacturing plants, large amount of data is generated with the help of many sensors deployed to measure different parameters which can be used for defect diagnosis of the coils produced [42]. Patel and Jokhakar (2016) proposed defect cause analysis model to be applied in steel industry [43]. The result showed that random forest can achieve accuracy of 95% compared to other algorithm. Tseng et al. (2005) used CNC machines based on rough set theory. The information of defined process is created as a rule-based [44]. Syn et al. (2011) proposed model based on fuzzy theory that predict the surface quality of the products produced by the machine [45]. Zeaiter et al. (2011) proposed real-time cavity pressure that estimate weight and dimensions of the product using force sensor data by using regression analysis model [46].
For the case of injection molding process, the stability control of production is an important aspect. Improving product quality stability is main challenge for injection molding because the injection process is usually disturbed by several inevitable variations. Zhou et al. (2017) proposed a quality prediction model based on polymer melt properties to monitor product weight variation [47]. The proposed control method results in a decrease in product weight variation from 0.16% to 0.02% in the case of varying mold temperature. In addition, the number of cycles to return stability decreases from 11 to 5 in with respect to variations in the melt temperature.

3. OSRDP Architecture Framework

3.1. OSRDP Architecture Framework

Proposed OSRDP architecture framework is developed based on Apache Kafka, Apache Storm, and MongoDB. As can be seen in Figure 1, the proposed OSRDP architecture framework provides the ability to combine the batch and real-time processing. The IoT sensor devices send the sensor data from the machines and the sensor data are handled by Kafka Cluster in order to avoid data loss. Inside Storm topology, the spout is defined as adapter to read the sensor data from Kafka while the bolt is utilized as processing unit.
Kafka Spout delivers sensor data into the Data Preprocessing Bolt. Data Preprocessing Bolt performs a series of preprocessing operations on sensors data, including data transformation and filtering. Once the preprocessing process is finish, the sensor data is then ready to be sent for quality prediction. The Data Mining Bolt conducted quality prediction process based on historical sensor data. The classifier which is generated based on training data will be used for quality prediction. The Data Mining Bolt was implemented by utilizing the library from Weka data mining tool [48]. The result of quality prediction is presented by Real-time Monitoring Bolt by utilizing Socket.IO library [49]. Socket.IO is a JavaScript framework that enables real-time web applications for every browser even supporting older browsers at the same time [50]. Finally, the MongoDB Bolt stores the sensor data and quality prediction’s result into MongoDB for further use.
Figure 2a shows the screenshot of real-time quality monitoring for specific machine number. The real-time quality monitoring page enables the manager to check the quality prediction process output of defect/non-defect product in real-time. The implementation of Storm topology can be seen in Figure 2b. Furthermore, Figure 2c illustrates the screenshot of server status monitoring page. The manager or admin can easily check status of the server, that contains detailed information about healthiness of the server, current running tasks, Storm cluster information, MongoDB cluster information and average overall prediction summary. It also provides insight for managers about historical quality data, percentage of overall defect, and non-defect products.

3.2. OSRDP Scenario in the Manufacturing

In this study, several steps of OSRDP implementation scenario in the manufacturing are presented. Figure 3 illustrates the flow of sensor data for the OSRDP scenario in the manufacturing.
(0)
Pre-Step: Before using the data mining algorithm, we need to engage in offline learning first for quality prediction based on historical quality data. After learning is finished, it will produce the classifier model and will be used for real-time quality prediction in the Bolt of Storm topology.
(1)
The injection molding machine will send the sensor data into OSRDP server.
(2)
In the OSRDP server, the sensor data will be managed by Kafka and published to Storm.
(3)
In the Storm, there are several processes such as preprocessing task, and prediction task.
(4)
After the prediction task in the Storm is finished, the sensor data and its prediction result will be stored into MongoDB.
(5)
Storm will also send the result of prediction task into real-time quality monitoring web-page. So, then the manager can see the quality prediction result in real-time.
(6)
The admin/manager can also check status of the server by login into server status monitoring web-page.

4. Case Analysis with Experiment

4.1. Experimental Environment

To generate simulation data, we set up three clusters. Each cluster consists of three commodity servers with the same specifications, as shown in Table 1. All the servers are running the same operating system which is Ubuntu 10.04.4 long term support (LTS). The first cluster is the Apache Kafka cluster of which each of the Apache Kafka servers is running Apache Kafka version 0.8.2.0. And then the second cluster is Apache Storm cluster which each of the Apache Storm servers is running Apache Storm version 0.9.3 and zookeeper version 3.4.6. In the Apache Storm cluster, two servers are configured as supervisor (slave), and one server is used as nimbus (master). All the three servers are running zookeeper as a cluster. Finally, the third cluster is MongoDB cluster which each of the MongoDB server is running MongoDB version 3.2.1. In the MongoDB cluster, two servers are configured as shards for storing data, and one server is used as a mongos and config server for coordinating and distributing the data across MongoDB cluster. The connection speed between each server is 100 megabytes per second. The details configuration for simulation test is shown in Figure 4.

4.2. Data Collection

Experimental data was collected from injection molding process. For the case of injection molding process, the stability control of production is an important aspect. Improving product quality stability is main challenge for injection molding because the injection process is usually disturbed by various inevitable variations such as polymer melt properties, machine operations, and mold temperature [47]. Thus, the data mining based prediction model is needed to predict quality of product from injection molding. In injection molding process, one of dominant factor affects to the quality of product is the injection pressure [51]. We collected the injection pressure data and extract the features variable based on site field interview. The extracted features are described in Table 2 and illustrated in Figure 5.

4.3. Performance Evaluation of the OSRDP Architecture Framework

The proposed OSRDP architecture framework should be scalable to accommodate the growing volume of data without suffering noticeable performance loss. In this study, performance of system is presented in terms of processing time based on three scenarios as shown in Table 3. Each scenario has different number of parallelism. The Apache Storm provides the ability to set the number of parallelism (process). Single process in apache storm is defined as single number of spout and bolt. As increasing number of process, the storm will simultaneously distribute the incoming sensor data into different process to be executed, thus it is expected to reduce the processing time.
We run the simulator program and record the processing time of each scenario. In Figure 6, the horizontal axis shows the average number of sensors data sent to the server per second and the vertical axis represents the processing time in milliseconds for each scenario. Figure 6a showed for all three scenarios as the average number of sensors data increased, the processing time of the server increased. Figure 6b showed that parallelism increased the system’s performance. As the number of parallelism increased, less time was necessary to process the sensors data, especially when the number of sensors data was high. It reveals that by increasing the number of parallelism, the proposed OSRDP architecture framework is able to process high sensors data per second. It could be concluded that the proposed OSRDP architecture framework has high scalability.

4.4. Performance Comparison of Data Mining Models

In this section, evaluation results of quality prediction based on data mining techniques are presented. For this purpose, we investigated and evaluated four data mining algorithms such as; Naive Bayesian (NB), Multi-Layer Perceptron (MLP), Logistic Regression (LR), and Random Forest (RF). These are the most common widely used as supervised learning techniques while simultaneously achieving high-accuracy performance [52]. Random Forest of tree classifiers are a popular ensemble method for classification problems [53]. RF has a random subset feature selection which each tree is independently constructed using a bootstrap sample of the dataset. In RF, each node is split using the best among a subset of predictors randomly chosen at that node. Eventually, a majority vote is taken for final prediction output. It is well-known that by combining (majority vote), the prediction output of several classifiers results is a much better performance than using single classifier [54]. RF are usually preferred with respect to other classification techniques because of their high numerical robustness, native capacity of dealing with numerical and categorical features, and effectiveness in many real-world classification problems [55,56]. Recently, Oneto et al. (2017) proposed a data-driven system based on Random Forest for predicting the crash stopping maneuvering performance. The results showed that the proposed method not only can be used to accurately predict the results of the safety test but also can be used to better forecast the safety properties of a ship before its production [57].
In this study, all classifiers were generated based on Weka data mining tool with default parameter settings. For the RF, the parameter settings for the maximum depth of the tree is unlimited, the number of randomly chosen attributes is set to 0, and the number of iteration is set to 100. The number of attributes (input variables) are eight as already described in Table 2 and the number of output variable is two class which is defect (D) and non-defect (ND) product. In addition, the number of instances in our dataset is 120 data and the value of our dataset are in numerical value. After a classifier is constructed, it needs to be evaluated for accuracy. Effective evaluation is crucial because without knowing the approximate accuracy of a classifier, it cannot be used in real-world tasks. A confusion matrix [58] of a classifier might be seen in Table 4 and can be used to cover all the situation of the classification results such as to calculate the accuracy, precision, recall, and f-measure.
As could be seen in Table 4, TP and TN indicate the numbers of non-defect product and defect product that are correctly classified, respectively; FN (beta-error) and FP (alpha-error) indicate the numbers of non-defect product and defect product that are incorrectly classified, respectively. With the confusion matrix at hand, it is much easier to calculate the value of accuracy (acc), which is defined as
acc = TP + FN TP + FN + FP + TN ,
precision (p), which is defined as
p = TP TP + FP ,
recall (r), which is defined as
r = TP TP + FN ,
as well as the value of F-measure (F), which is defined as
F = 2 pr p + r
In this study, the training set is used to generate the classifier and the test set is used for evaluating the classifier. The training set should not be used in the evaluation as the classifier is biased toward the training set and may generate the overfitting problem. Cross-validation method is commonly used to prevent the overfitting problem [59]. Thus, in our study 10-fold cross-validation was used. By using 10-fold cross-validation method, our dataset is partitioned into 10 equal-size disjoint subsets. One subset is then used as the test set and the remaining 9 subsets are combined as the training set to learn a classifier. This procedure (with different possible combination of training and test set) is then run until 10 times, which gives 10 accuracies. The final estimated accuracy of learning from this data set is the average of the 10 accuracies.
Figure 7a–d showed the confusion matrix of NB, LR, MLP, and RF classifier, respectively. The confusion matrix of each classifier can be used to calculate the value of precision, recall, f-measure, and accuracy. The comparison results of four data mining algorithms are shown in Table 5. Overall, the classification accuracy for RF reveals highest accuracy (95.83%), while LR (91.67%), MLP (89.17%), and NB (67.5%) is in the second, third, and fourth position, respectively. In addition, we utilized Information Gain to evaluate the worth of attribute with respect to the output class. We found significant features (input variables), they are MaxPressureValue, IntegralToMin, and TotalIntegral, respectively. Furthermore, based on the experiments results we concluded that RF outperforms among three other data mining algorithms (NB, LR, and MLP). It is expected that our proposed system can support the management in their decision-making for product quality inspection.

5. Discussion

5.1. Cost Analysis to Select an Cost-Effective Integration Solution

As budgets for implementing new technology in the manufacturing industry are relatively low and the existing Personal Computer (PC) in manufacturing has limitations as it is called a “commodity hardware”, it is important to address the cost factor of the OSRDP architecture framework implementation and adopt most cost-effective approach. In this study, we suggested an open-source-based technology that is cost-effective for implementation and integration. To understand the reason, a brief implementation cost analysis is presented below.
Main components to implement OSRDP architecture framework are sensor devices, and servers.
  • Sensor devices: Cost of the sensor device ranges from USD $50 to USD $200 [60,61]. Price varies from vendor to vendor and depends on different functionalities of each sensor device.
  • Servers: Cost of the server ranges from USD $1000 to USD $2000 [62]. Price varies from vendor to vendor and depends on specification, performance, and support. The alternative is to use the commodity hardware that is most cost-effective and inexpensive than the higher-specification server [63].
Singh and Reddy (2015) suggested two different type of scaling to minimize cost investment. Scaling itself is the ability of the system to handle and adapt while the number of data that should be processed are increased [64]. The two types of scaling itself are:
  • Horizontal Scaling: Horizontal scaling involves distributing workload across many servers in clusters. Those servers usually are commodity hardware that are not high-specification servers. Horizontal scaling also known as “scale-out”, where multiple commodity servers are added together into cluster to improve processing capability. This is usually cost-effective and inexpensive while achieving high processing capability [65].
  • Vertical Scaling: Vertical scaling involves adding more processors, more memory and higher specification hardware within one server. It is also known as “scale-up” which by replacing the processor and RAM with higher specification, or buying expensive and high-specification server [64].
Advantages and disadvantages of using horizontal and vertical scaling are shown in Table 6. While scaling-up vertically can make management and installation straight-forward, it limits scaling ability of a platform since it requires a large amount of financial investment. To manage future workloads, one always will have to add additional or replacement hardware that is more powerful than previous requirements due to limited space and number of expansion slots available in a server. This forces the manufacturing to invest more than what is required for current processing needs and costs much more than horizontal scaling.
Conversely, scaling-out horizontally provides a manufacturing the ability to increase performance in small commodity hardware that lowers financial investment. Also, there is no limit to the number of commodity hardware that can be added into the cluster. Despite these advantages, the main drawback is limited availability of software frameworks that can be effectively used by horizontal scaling. The proposed OSRDP architecture framework consists of open source-based technologies that effectively and efficiently work well with horizontal scaling, thus it is cost-effective for manufacturing industry.

5.2. The Impact Analysis of the OSRDP Architecture Framework on the Manufacturing Sustainability

This section provides detailed analysis of the proposed OSRDP architecture framework’s effect on manufacturing sustainability, especially in terms of reducing investment cost and labor cost.
Reducing the investment cost by choosing the open-source technology: According to results of the survey that has been conducted by Walli et al., a majority of U.S. companies and government institutions are turning to open source software instead of using commercial software packages [66]. Some 87% of the 512 companies surveyed are using open source software. Larger companies are more likely to be open source users: all 156 companies with at least USD $50 million in annual revenues were using open source. Those companies and government institutions used open source for three primary reasons: to reduce information technology (IT) implementation costs [17,18], deliver systems faster, and make systems more secure. In addition, many organizations are saving millions of dollars on IT implementation by using open source software. In 2004, open source software saved large companies (with annual revenue of more than USD $1 billion) an average of USD $3.3 million. Medium-sized companies (between USD $50 million and USD $1 billion in annual revenues) saved an average USD $1.1 million. Firms with revenues less than USD $50 million saved an average USD $520,000. Some 70% of large firms are seeing moderate or major benefits from open source. Of the companies under USD $1 billion in revenues, 59% are reaping major benefits. According to the report for the UK Cabinet Office supported by Open Forum Europe, the first reason for adopting the OSS technology is to reduce the vendor lock in and the second is value for money [67]. In addition, by adopting the OSS technology not only can reduce the vendor lock in, but also can increase the innovation opportunities, support a more agile development process, and provide a safeguard for sustainability of code. The proposed OSRDP architecture framework is based on open-source technologies, and thus the manufacturing industry can adopt it with less investment. Therefore, the proposed OSRDP architecture framework will support the manufacturing industry’s sustainability.
Reducing the labor cost: Data mining has been used in various process for optimization, monitoring and control applications in manufacturing, and predictive maintenance in different industries [68,69,70,71,72]. In addition, data mining also has been used to reduce cycle time and scrap, and improve resource utilization in certain NP-hard manufacturing problems. Data mining has powerful tools for continuous quality improvement in a large and complex process such as semiconductor manufacturing [69,70,72]. Data mining techniques provide promising potential for improving quality control in manufacturing systems [73], especially in complex manufacturing environments wherein detection of causes of problems is difficult [16]. Currently, the process to ensure the quality of the product in manufacturing is based on the visual inspection, and these operations increase the cost and the resources during the process [15]. The proposed OSRDP architecture framework utilized data mining algorithm to detect quality of the product in real-time. Thus, it is expected to support the management in their decision-making for product quality inspection and reduce the labor cost. This benefit will facilitate the manufacturing industry to achieve one of the aspects of sustainability, to reduce the cost during quality product inspection.

6. Conclusions

In this study, an OSRDP architecture framework for manufacturing sustainability was proposed. The OSRDP architecture framework can be used to solve the real-time data processing issues and support manufacturing sustainability. The OSRDP used several open source-based big data processing such as Apache Kafka for handling fast data, Apache Storm for real-time processing and quality monitoring, and MongoDB for storing sensors data. The results showed that the proposed system is capable of processing a massive sensor data efficiently when the number of sensors data and devices increases. Data mining based on Random Forest is presented and successfully predict the quality of products given the sensor data as the input. The OSRDP architecture framework utilizes open source-based technologies thus it is expected to reduce the investment cost. In addition, the data mining technique is applied to detect the product quality, thus it is expected to support the management in their decision-making and reduce the labor cost.
We obtained promising preliminary results of OSRDP architecture framework. Therefore, we must investigate the optimal design of OSRDP architecture framework that can be applied for general manufacturing process in the future. It is necessary to make a further enhancement of data mining algorithm by using historical sensors data and improving processing performance by providing auto-load-balancing between the cluster. In addition, a comprehensive technical guideline can be provided in the future to enable the industrial practitioners to implement it in their manufacturing process.

Acknowledgments

We would like to acknowledge Yong-Han Lee (Y.-H.L.) for his contributions, advice and support during his time at Dongguk University. May he (Y.-H.L.) rest in peace. This study also was supported by the Basic Science Research Program through the National Research Foundation of Korea (NRF) funded by the Ministry of Education (NRF-2016R1A6A3A11930205) and the IT R&D program of MOTIE/KEIT [10052972, Development of the Reconfigurable Manufacturing Core Technology based on the Flexible Assembly and ICT Converged Smart Systems].

Author Contributions

Muhammad Syafrudin developed the conceptual design, framework of the study, analyzed the results, and wrote the manuscript. Norma Latif Fitriyani, Donglai Li, and Ganjar Alfian performed the experiments, collected the materials for the literature review. Jongtae Rhee reviewed the conceptual design of the study. Yong-shin Kang helped designing the framework of study and reviewed the final manuscript.

Conflicts of Interest

The authors declare no conflict of interest.

References

  1. Jovane, F.; Koren, Y.; Boër, C.R. Present and Future of Flexible Automation: Towards New Paradigms. CIRP Ann. 2003, 52, 543–560. [Google Scholar] [CrossRef]
  2. Koren, Y. The Global Manufacturing Revolution: Product-Process-Business Integration and Reconfigurable Systems; John Wiley & Sons: Hoboken, NJ, USA, 2010. [Google Scholar]
  3. Goodland, R. The concept of environmental sustainability. Annu. Rev. Ecol. Syst. 1995, 26, 1–24. [Google Scholar] [CrossRef]
  4. Rosen, M.A.; Kishawy, H.A. Sustainable Manufacturing and Design: Concepts, Practices and Needs. Sustainability 2012, 4, 154–174. [Google Scholar] [CrossRef]
  5. Garetti, M.; Taisch, M. Sustainable manufacturing: Trends and research challenges. Prod. Plan. Control 2012, 23, 83–104. [Google Scholar] [CrossRef]
  6. Gunasekaran, A.; Spalanzani, A. Sustainability of manufacturing and services: Investigations for research and applications. Int. J. Prod. Econ. 2012, 140, 35–47. [Google Scholar] [CrossRef]
  7. Davis, J.; Edgar, T.; Porter, J.; Bernaden, J.; Sarli, M. Smart manufacturing, manufacturing intelligence and demand-dynamic performance. Comput. Chem. Eng. 2012, 47, 145–156. [Google Scholar] [CrossRef]
  8. Lee, J.; Kao, H.-A.; Yang, S. Service innovation and smart analytics for Industry 4.0 and big data environment. Procedia CIRP 2014, 16, 3–8. [Google Scholar] [CrossRef]
  9. Hazen, B.T.; Boone, C.A.; Ezell, J.D.; Jones-Farmer, L.A. Data quality for data science, predictive analytics, and big data in supply chain management: An introduction to the problem and suggestions for research and applications. Int. J. Prod. Econ. 2014, 154, 72–80. [Google Scholar] [CrossRef]
  10. Wamba, S.F.; Akter, S.; Edwards, A.; Chopin, G.; Gnanzou, D. How ‘big data’ can make big impact: Findings from a systematic review and a longitudinal case study. Int. J. Prod. Econ. 2015, 165, 234–246. [Google Scholar] [CrossRef]
  11. Lee, J.; Lapira, E.; Bagheri, B.; Kao, H. Recent advances and trends in predictive manufacturing systems in big data environment. Manuf. Lett. 2013, 1, 38–41. [Google Scholar] [CrossRef]
  12. Kumar, P.; Dhruv, B.; Rawat, S.; Rathore, V.S. Present and future access methodologies of big data. Int. J. Adv. Res. Sci. Eng. 2014, 3, 541–547. [Google Scholar]
  13. Chen, C.L.P.; Zhang, C.-Y. Data-intensive applications, challenges, techniques and technologies: A survey on Big Data. Inf. Sci. 2014, 275, 314–347. [Google Scholar] [CrossRef]
  14. Vera-Baquero, A.; Colomo-Palacios, R.; Molloy, O. Towards a process to guide Big data based decision support systems for business processes. Procedia Technol. 2014, 16, 11–21. [Google Scholar] [CrossRef]
  15. Ferreiro, S.; Sierra, B.; Irigoien, I.; Gorritxategi, E. Data mining for quality control: Burr detection in the drilling process. Comput. Ind. Eng. 2011, 60, 801–810. [Google Scholar] [CrossRef]
  16. Harding, J.A.; Shahbaz, M.; Srinivas, S.; Kusiak, A. Data mining in manufacturing: A review. ASME J. Manuf. Sci. Eng. 2005, 128, 969–976. [Google Scholar] [CrossRef]
  17. Baldwin, H. 4 Reasons Companies Say Yes to Open Source. Available online: http://www.computerworld.com/article/2486991/app-development-4-reasons-companies-say-yes-to-open-source.html (accessed on 9 November 2016).
  18. Shaikh, M.; Cornford, T. Total Cost of Ownership of Open Source Software: A Report for the UK Cabinet Office Supported by OpenForum Europe; UK Cabinet Office: London, UK, 2011. Available online: http://eprints.lse.ac.uk/39826 (accessed on 9 November 2016).
  19. Mani, V.; Delgado, C.; Hazen, B.T.; Patel, P. Mitigating Supply Chain Risk via Sustainability Using Big Data Analytics: Evidence from the Manufacturing Supply Chain. Sustainability 2017, 9, 608. [Google Scholar] [CrossRef]
  20. Malek, Y.N.; Kharbouch, A.; El Khoukhi, H.; Bakhouya, M.; De Florio, V.; El Ouadghiri, D.; Latre, S.; Blondia, C. On the use of IoT and Big Data Technologies for Real-time Monitoring and Data Processing. Procedia Comput. Sci. 2017, 113, 429–434. [Google Scholar] [CrossRef]
  21. He, Q.P.; Wang, J. Statistical process monitoring as a big data analytics tool for smart manufacturing. J. Process Control 2017. [Google Scholar] [CrossRef]
  22. Siddique, K.; Akhtar, Z.; Lee, H.-G.; Kim, W.; Kim, Y. Toward Bulk Synchronous Parallel-Based Machine Learning Techniques for Anomaly Detection in High-Speed Big Data Networks. Symmetry 2017, 9, 197. [Google Scholar] [CrossRef]
  23. Open Source Initiative. Available online: https://opensource.org/definition (accessed on 18 October 2016).
  24. Roberts, J.A.; Hann, I.-H.; Slaughter, S.A. Understanding the motivations, participation, and performance of open source software developers: A longitudinal study of the apache projects. Manag. Sci. 2006, 52, 984–999. [Google Scholar] [CrossRef]
  25. Panetto, H.; Molina, A. Enterprise integration and interoperability in manufacturing systems: Trends and issues. Comput. Ind. 2007, 59, 641–646. [Google Scholar] [CrossRef]
  26. Apache Kafka. Available online: https://kafka.apache.org (accessed on 20 October 2016).
  27. Goodhope, K.; Koshy, J.; Kreps, J.; Narkhede, N.; Park, R.; Rao, J.; Ye, V.Y. Building LinkedIn’s real-time activity data pipeline. IEEE Data Eng. Bull. 2012, 35, 33–45. [Google Scholar]
  28. Kreps, J.; Narkhede, N.; Rao, J. Kafka: A distributed messaging system for log processing. In Proceedings of the NetDB, Athens, Greece, 12–16 June 2011. [Google Scholar]
  29. Fernández-Rodríguez, J.Y.; Álvarez-García, J.A.; Fisteus, J.A.; Luaces, M.R.; Magaña, V.C. Benchmarking real-time vehicle data streaming models for a Smart City. Inf. Syst. 2017, 72, 62–76. [Google Scholar] [CrossRef]
  30. Jain, A.; Nalya, A. Learning Storm; Packt Publishing: Birmingham, UK, 2014. [Google Scholar]
  31. Nivash, J.P.; Raj, E.D.; Babu, L.D.; Nirmala, M.; Kumar, V.M. Analysis on enhancing storm to efficiently process big data in real time. In Proceedings of the 2014 International Conference on Computing, Communications and Networking Technologies (ICCCNT), Hefei, China, 11–13 July 2014. [Google Scholar]
  32. De Maio, C.; Fenza, G.; Loia, V.; Orciuoli, F. Distributed online temporal Fuzzy concept analysis for stream processing in smart cities. J. Parallel Distrib. Comput. 2017, 110, 31–41. [Google Scholar] [CrossRef]
  33. Yang, W.; Liu, X.; Zhang, L.; Yang, L.T. Big data real-time processing based on storm. In Proceedings of the 12th IEEE International Conference on Trust, Security and Privacy in Computing and Communications (TrustCom), Melbourne, VIC, Australia, 16–18 July 2013; pp. 1784–1787. [Google Scholar]
  34. Banker, K. MongoDB in Action; Manning Publications Co.: Shelter Island, NY, USA, 2011. [Google Scholar]
  35. Sasaki, T. NoSQL Core Guide for Big Data Era; RoadBook: Seoul, Korea, 2011. [Google Scholar]
  36. Copeland, R. MongoDB Applied Design Patterns; O’Reilly Media, Inc.: Newton, MA, USA, 2013. [Google Scholar]
  37. Chodorow, K. MongoDB: The Definitive Guide; O’Reilly Media, Inc.: Newton, MA, USA, 2013. [Google Scholar]
  38. Nyati, S.S.; Pawar, S.; Ingle, R. Performance evaluation of unstructured NoSQL data over distributed framework. In Proceedings of the 2013 International Conference on Advances in Computing, Communications and Informatics (ICACCI), Mysore, India, 22–25 August 2013; pp. 1623–1627. [Google Scholar]
  39. Kanade, A.; Gopal, A.; Kanade, A. A study of normalization and embedding in MongoDB. In Proceedings of the 2014 IEEE International on Advance Computing Conference (IACC), Gurgaon, India, 21–22 February 2014; pp. 416–421. [Google Scholar]
  40. Liu, Y.; Wang, Y.; Jin, Y. Research on the improvement of MongoDB auto-sharding in cloud environment. In Proceedings of the 2012 7th International Conference on Computer Science & Education (ICCSE), Melbourne, VIC, Australia, 14–17 July 2012; pp. 851–854. [Google Scholar]
  41. Tseng, T.L.B.; Jothishankar, M.C.; Wu, T.T. Quality control problem in printed circuit board manufacturing—An extended rough set theory approach. J. Manuf. Syst. 2004, 23, 56–72. [Google Scholar] [CrossRef]
  42. Chen, W.C.; Tseng, S.S.; Wang, C.Y. A novel manufacturing defect detection method using association rule mining techniques. Expert Syst. Appl. 2005, 29, 807–815. [Google Scholar] [CrossRef]
  43. Patel, S.V.; Jokhakar, V.N. A random forest based machine learning approach for mild steel defect diagnosis. In Proceedings of the 2016 IEEE International Conference on Computational Intelligence and Computing Research (ICCIC), Chennai, India, 15–17 December 2016; pp. 1–8. [Google Scholar]
  44. Tseng, T.L.; Kwon, Y.; Ertekin, Y.M. Feature-based rule induction in machining operation using rough set theory for quality assurance. Robot. Comput. Integr. Manuf. 2005, 21, 559–567. [Google Scholar] [CrossRef]
  45. Syn, C.Z.; Mokhtar, M.; Feng, C.J.; Manurung, Y.H.P. Approach to prediction of laser cutting quality by employing fuzzy expert system. Expert Syst. Appl. 2011, 38, 7558–7568. [Google Scholar] [CrossRef]
  46. Zeaiter, M.; Knight, W.; Holland, S. Multivariate regression modeling for monitoring quality of injection moulding components using cavity sensor technology: Application to the manufacturing of pharmaceutical device components. J. Process Control 2011, 21, 137–150. [Google Scholar] [CrossRef]
  47. Zhou, X.; Zhang, Y.; Mao, T.; Zhou, H. Monitoring and dynamic control of quality stability for injection molding process. J. Mater. Process. Technol. 2017, 249, 358–366. [Google Scholar] [CrossRef]
  48. Witten, I.H.; Frank, E.; Hall, M.A.; Pal, C.J. Data Mining: Practical Machine Learning Tools and Techniques, 4th ed.; Morgan Kaufmann: New York, NY, USA, 2016. [Google Scholar]
  49. Socket.IO. Available online: http://socket.io (accessed on 1 November 2016).
  50. Höfler, T. Enabling Realtime Collaborative Data-Intensive Web Applications—A case Study Using Server-Side JavaScript. Master’s Thesis, Technical University of Munich, Munich, Germany, 15 May 2013. [Google Scholar]
  51. Abohashima, H.S.; Aly, M.F.; Mohib, A.; Attia, H.A. Minimization of Defects Percentage in Injection Molding Process using Design of Experiment and Taguchi Approach. Ind. Eng. Manag. 2015, 4. [Google Scholar] [CrossRef]
  52. Hastie, T.; Tibshirani, R.; Friedman, J. The Elements of Statistical Learning: Data Mining, Inference, and Prediction, 2nd ed.; Springer: New York, NY, USA, 2009. [Google Scholar]
  53. Breiman, L. Random forests. Mach. Learn. 2001, 45, 5–32. [Google Scholar] [CrossRef]
  54. Germain, P.; Lacasse, A.; Laviolette, F.; Marchand, M.; Roy, J.-F. Risk bounds for the majority vote: From a PAC-Bayesian analysis to a learning algorithm. J. Mach. Learn. Res. 2015, 16, 787–860. [Google Scholar]
  55. Fernández-Delgado, M.; Cernadas, E.; Barro, S.; Amorim, D. Do we need hundreds of classifiers to solve real world classification problems? J. Mach. Learn. Res. 2014, 15, 3133–3181. [Google Scholar]
  56. Wainberg, M.; Alipanahi, B.; Frey, B.J. Are random forests truly the best classifiers? J. Mach. Learn. Res. 2016, 17, 1–5. [Google Scholar]
  57. Oneto, L.; Coraddu, A.; Sanetti, P.; Karpenko, O.; Cipollini, F.; Cleophas, T.; Anguita, D. Marine Safety and Data Analytics: Vessel Crash Stop Maneuvering Performance Prediction. In Proceedings of the 26th International Conference on Artificial Neural Networks (ICANN 2017), Alghero, Italy, 11–14 September 2017; Volume 10614, pp. 385–393. [Google Scholar]
  58. Liu, B. Web Data Mining: Exploring Hyperlinks, Contents, and Usage Data; Springer-Verlag: Berlin/Heidelberg, Germany, 2011. [Google Scholar]
  59. Refaeilzadeh, P.; Tang, L.; Liu, H. Cross-validation. In Encyclopedia of Database Systems; Springer: New York, NY, USA, 2009. [Google Scholar]
  60. Pressure Sensors Injection Molding. Available online: https://www.rjginc.com/sensors/cavity-pressure (accessed on 28 October 2016).
  61. Cavity Pressure Sensor Price. Available online: https://www.aliexpress.com/price/cavity-pressure-sensor_price.html (accessed on 28 October 2016).
  62. Dell PowerEdge Servers for Small Business. Available online: http://www.dell.com/us/business/p/servers (accessed on 28 October 2016).
  63. Appuswamy, R.; Gkantsidis, C.; Narayanan, D.; Hodson, O.; Rowstron, A. Scale-up vs. scale-out for Hadoop: Time to rethink? In Proceedings of the 4th Annual Symposium on Cloud Computing, Santa Clara, CA, USA, 1–3 October 2013; ACM: New York, NY, USA, 2013. [Google Scholar] [CrossRef]
  64. Singh, D.; Reddy, C.K. A survey on platforms for big data analytics. J. Big Data 2015, 2. [Google Scholar] [CrossRef] [PubMed]
  65. Abbott, M.L.; Fisher, M.T. Scalability Rules: 50 Principles for Scaling Web Sites; Pearson Education, Inc.: Boston, MA, USA, 2011; pp. 35–48. [Google Scholar]
  66. Walli, S.; Gynn, D.; Von Rotz, B. The Growth of Open Source Software in Organizations; A report; Optaros, Inc.: New York, NY, USA, 2005. [Google Scholar]
  67. Alpaydin, E. Introduction to Machine Learning, 2nd ed.; MIT Press: Cambridge, MA, USA, 2009. [Google Scholar]
  68. Gardner, R.; Bicker, J. Using machine learning to solve tough manufacturing problems. Int. J. Ind. Eng. Theory Appl. Pract. 2000, 7, 359–364. [Google Scholar]
  69. Kwak, D.-S.; Kim, K.-J. A data mining approach considering missing values for the optimization of semiconductor-manufacturing processes. Expert Syst. Appl. 2012, 39, 2590–2596. [Google Scholar] [CrossRef]
  70. Pham, D.T.; Afify, A.A. Machine-learning techniques and their applications in manufacturing. Proc. Inst. Mech. Eng. Part B J. Eng. Manuf. 2005, 219, 395–412. [Google Scholar] [CrossRef]
  71. Susto, G.A.; Schirru, A.; Pampuri, S.; McLoone, S.; Beghi, A. Machine learning for predictive maintenance: A multiple classifier approach. IEEE Trans. Ind. Inf. 2015, 11, 812–820. [Google Scholar] [CrossRef]
  72. Monostori, L.; Prohaszka, J. A step towards intelligent manufacturing: Modelling and monitoring of manufacturing processes through artificial neural networks. CIRP Ann. Manuf. Technol. 1993, 42, 485–488. [Google Scholar] [CrossRef]
  73. Apte, C.; Weiss, S.; Grout, G. Predicting defects in disk drive manufacturing: A case study in high dimensional classification. In Proceedings of the IEEE Annual Computer Science Conference on Artificial Intelligence in Application, Orlando, FL, USA, 1–5 March 1993; pp. 212–218. [Google Scholar] [CrossRef]
Figure 1. Open source-based real-time data processing (OSRDP) architecture framework.
Sustainability 09 02139 g001
Figure 2. The web-based monitoring pages: (a) real-time quality monitoring; (b) Apache Storm topology status monitoring; (c) Server status monitoring.
Sustainability 09 02139 g002aSustainability 09 02139 g002b
Figure 3. OSRDP scenario in the manufacturing.
Sustainability 09 02139 g003
Figure 4. Configuration for simulation test.
Sustainability 09 02139 g004
Figure 5. One set of features variable from injection pressure data.
Sustainability 09 02139 g005
Figure 6. Performance comparison based on three scenarios: (a) Processing time given the average number (#) of sensors data sent to the server per second from 10 until 100 sensors data; (b) Processing time given the average number of sensors data sent to the server per second from 10 until 10,000 sensors data.
Sustainability 09 02139 g006
Figure 7. Confusion matrix of (a) Naive Bayesian; (b) Logistic Regression; (c) Multi-layer Perceptron; and (d) Random Forest. ND is stand for Non-Defect product and D is stand for Defect product.
Sustainability 09 02139 g007
Table 1. Specification of servers.
CPURAMHDDOS
2.9 GHz × 48 GB500 GBUbuntu 10.04 LTS
CPU: Central Processing Unit, RAM: Random Access Memory, HDD: Hard Disk Drive, OS: Operating System, LTS: Long Term Support.
Table 2. Eight features variable extracted from injection pressure data.
FeatureExplanation
minPressureValueMinimum pressure value
maxPressureValueMaximum pressure value
integralPressureToMaxThe pressure integral value from start of cycle to maximum pressure value
integralPressureToMinThe pressure integral value from maximum pressure value to end of cycle
totalIntegralPressureTotal pressure integral value
timeToMaxPressureTime from start of cycle to maximum pressure value
timeToMinPressureTime from the maximum pressure value to the end of the cycle
cycleTimeCycle time
Table 3. Three scenarios for evaluating the performance of OSRDP architecture framework.
ScenarioParameterMeasurement
Scenario 1# of parallelism = 1Calculate the processing time by increasing the average number of the sensor data sent to the server per second
Scenario 2# of parallelism = 5
Scenario 3# of parallelism = 10
Table 4. Confusion matrix of a classifier.
Classified TrueClassified False
Actual positiveTrue Positive (TP)False Negative (FN) (Type II Error/β-error)
Actual negativeFalse Positive (FP) (Type I Error/α-error)True Negative (TN)
Table 5. The comparison results of four data mining algorithms.
ClassifierPrecision (%)Recall (%)F-Measure (%)Accuracy (%)
NB72.867.565.567.5
LR91.791.791.791.67
MLP89.289.289.289.17
RF95.995.895.895.83
Table 6. A comparison of advantages and disadvantages of horizontal and vertical scaling [63,64].
Scaling TypeAdvantagesDisadvantages
Horizontal
-
Much lower cost than vertical scaling
-
Software has to handle all the data distribution and parallel processing complexities
-
Easier to run fault-tolerance
-
Limited number of software are available that can take advantage of horizontal scaling
-
Ability to scale out as much as possible
-
Higher utility cost (Electricity and cooling)
-
High availability
Vertical
-
Most of the software can easily take advantage of vertical scaling
-
Requires huge amount of financial investment
-
Less power consumption than running multiple servers
-
Greater risk of hardware failure causing bigger outages
-
Easy to manage and install hardware within a single machine
-
Generally vendor lock-in and limited upgradeability in the future
-
Low availability

