The Key Driving Forces for Geo-Economic Relationships between China and ASEAN Countries

1
Research Center for Energy Economics, School of Business and Administration, Henan Polytechnic University, Jiaozuo 454000, China
2
Geo-studies Center, Beijing Normal University, Beijing 100875, China
3
College of Computer Science and Technology, Henan Polytechnic University, Jiaozuo 454000, China
4
Department of Geography, University of Wisconsin-Madison, Madison, WI 53706, USA
5
Faculty of Geographical Science, Beijing Normal University, Beijing 100875, China
*
Author to whom correspondence should be addressed.
Sustainability 2017, 9(12), 2363; https://0-doi-org.brum.beds.ac.uk/10.3390/su9122363
Submission received: 18 October 2017
/
Revised: 14 December 2017
/
Accepted: 14 December 2017
/
Published: 18 December 2017
(This article belongs to the Special Issue Sustainability of Economic Growth: Combining Technology, Market and Society)
Abstract
:With the rise of China and the implementation of the “21st Century Maritime Silk Road” strategy, research on geo-economics between China and ASEAN (Association of Southeast Asian Nations) countries has become increasingly important. Current studies mainly focus on influencing factors, while there is little consideration about how these influencing factors act on geo-economic relationships. Therefore, this paper explores the key driving forces for geo-economic relationships between China and ASEAN countries by use of the structural equation modeling based on Partial Lease Squares. There are three main findings: (1) Economic factors have the greatest impact on geo-economic relationships and the total path effect is 0.778. Geo-location, geopolitics and geo-culture act on geo-economic relationships directly and indirectly. Their total path effects are 0.731, 0.645 and 0.513, respectively. (2) Indirect effects of geo-location, geopolitics and geo-culture impacting geo-economic relationships are far greater than direct effects. Geo-culture, in particular, has a vital mediating effect on geo-economic relationships. (3) Economic drivers promote geo-economic relationships through market, industrial policy, technical, network and benefit-sharing mechanisms. Political drivers improve geo-economic relationships through cooperation, negotiation, coordination and institutional mechanisms. Cultural drivers enhance geo-economic relationships through transmission mechanism. Location drivers facilitate geo-economic relationships through selection mechanism. We provide new insights on the geo-economic relationships through quantitative analysis and enrich the existing literature by revealing the key driving forces and mechanisms for geo-economic relationships.
1. Introduction
With the rise of China and the implementation of the “21st Century Maritime Silk Road” strategy, research on geo-economics between China and ASEAN countries has become increasingly important. Since the establishment of the China–ASEAN strategic partnership in 2003, economic and trade cooperation have achieved remarkable performance. The Ministry of Commerce of China reported that the bilateral trade volume between China and ASEAN countries rocketed sharply from $78.2 billion in 2003 to $452.2 billion in 2016. By the end of 2016, China had been ASEAN’s largest trading partner for seven consecutive years, and ASEAN had been China’s third largest trading partner for five consecutive years. Furthermore, the Chinese government advanced and carried out “One Belt One Road” strategy in 2013, which consists of the Silk Road Economic Belt, a land-based belt connecting China, Central Asia, Russia and Europe, and the 21st Century Maritime Silk Road, a sea-based route linking China’s eastern seaboard to Southeast Asia, South Asia, the Persian Gulf, East Africa and the Mediterranean [1]. From the historical and geographical perspective, China and Southeast Asia are closely related and widely connected in terms of economy, trade, culture and religion. Therefore, ASEAN countries are a priority for China to experiment with the Maritime Silk Road policy and develop geo-economics by way of industrial cooperation, RMB internationalization, energy resource development, and the Economic Cooperation Framework Agreement [2,3]. In this context, it is vital to sort out influencing factors and explore the key driving forces and mechanisms for geo-economic relationships between China and ASEAN countries.
Up to now, scholars have conducted some research on geo-economic relationships and influencing factors. Wigell regarded “geo-economics as the geostrategic use of economic power and constructed two typologies: strategic frame (competitive or cooperative) and economic power (as goal or means)” [4,5]. A strategic frame results in two different viewpoints of geo-economic relationships. Some scholars believe that competition with other countries can improve one country’s political and international influence, thus the competitive relationships between geo-economic actors do exist [6,7], while other scholars believe economic complementarities and cooperation are clear in some major regional economic powers, such as Brazil, Russia, India, China and South Africa [8,9]. Different from the above two points of view, some scholars hold that the competitive and cooperative geo-economic relationships are relative and entangled. They are constantly changing, and can be altered [10]. To find the reasons for the changes of geo-economic relationships, scholars have explored the factors affecting geo-economic relationships. The research on influencing factors mainly concentrates on three aspects: geographical location, geopolitics and geo-culture. Geo-economic relationships are closely related to geographical location. The geo-economic zones between countries often produce significant positive border effects, promoting economic, social and cultural development in border areas [11]. Some scholars believe that the starting point for China–ASEAN regional cooperation should be border areas, which is not only conducive to promoting the opening up and the development of border areas, but also brings about win–win results for both sides [12]. Geo-economic relationships are accompanied by geopolitics. The politicizing tendency of geo-economics brings opportunities and challenges for the geo-economic development between China and ASEAN countries. At present, many geopolitical factors influence the process of geo-economic cooperation, such as territorial sovereignty dispute in the South China Sea and ASEAN’s “great power balance” diplomacy [13]. In addition, geo-culture is one of important factors of regional identity. The common culture has the natural advantages of geo-economic development, provide a “convenient channel” for regional cooperation among countries and become a powerful “boost” for geo-economic development [14]. Cultural exchanges between China and ASEAN countries as well as the promotion of cultural identity can advance the process of economic cooperation and regional integration [15].
Reviewing the existent literature on geo-economics, we find that scholars have analyzed the influencing factors of geo-economic relationships. However, there is little consideration about how these influencing factors act on geo-economic relationships through quantitative analysis, let alone what kind of driving mechanisms play their role on geo-economic relationships. As we know, understanding driving forces and mechanisms is essential because it can reveal the principles and internal rules of geo-economic relationships and establish a complete theoretical chain between the system and policy research on China–ASEAN geo-economics.
To better understand driving forces and mechanisms, we explore the ways by which these influencing factors act on geo-economic relationships between China and ASEAN countries using structural equation modeling based on Partial Least Squares. In this section, we pose a scientific question: “How do influencing factors act on geo-economic relationships between China and ASEAN countries?” Section 2 introduces the structural equation modeling and data resources. Section 3 demonstrates research results and tests the reliability and validity of models. The results involve latent variables correlation, factors loading, path coefficients and path effects. Then, we examine the results by using reliability test and validity evaluation of measurement model and structural model. Section 4 discusses the implications of results covering influencing paths, the principle of geo-economic spatial interaction, driving forces and driving mechanisms. Lastly, we draw the main conclusions with broader implications.
2. Materials and Methods
2.1. Research Method
To explore the key driving forces for geo-economic relationships, we adopt the structural equation modeling based on Partial Least Squares (PLS). Structural equation modeling (SEM) is a comprehensive statistical modeling to effectively measure the relationships between variables. At present, there are two methods used in structural equation modeling. One is hard model represented by Analysis of Moment Structures (AMOS). It is a covariance structure analysis based on maximum likelihood estimation. The other is a soft model represented by PLS. It is based on partial least squares analysis. The AMOS method needs to be combined with factor analysis and multiple regression analysis, requiring the synchronous estimation of measurement model and structural model, along with the optimization of parameter estimation. The PLS method is forecast oriented and especially suitable for exploratory and explanatory research. Furthermore, PLS provides three internal weights of path, factor and centroid, which can be used for missing processing, setting up the number of iterations and accuracy [16]. Comparing two methods (Table 1), this paper adopts PLS-SEM method to discover the key driving forces of China–ASEAN geo economic relationships.
First, we need to know two important concepts: latent variable and manifest variable. The former refers to an index that cannot be observed directly and accurately in reality. The latter refers to the index that can be measured directly and reflect a specific latent variable. In PLS path model, it is assumed that there are measurable variables in “j” group for observation sample points. Xj = {xj1, xj2, xj3, …; xjh, …, xjk}. Assume that all of them have been transformed into standardized variables, and all observable variables are single dimensions. Furthermore, the linear combinations between manifest and latent variables, and between latent variables are clear [17].
The PLS path model is mainly composed of two parts. One part is the structural model for describing the relationships among various latent variables. The other part is the measurement model for describing the relationships between latent variable and manifest variable. In this paper, the composition index is used, and the measurement equation is as follows:
The structural model is used to describe the causal relationships between latent variables.
In the above equation, is latent variable after normalization treatment. is the load factor. is path coefficient. δj and ζj are error correction terms, and they are not associated with predictive variables.
The parameters estimation of PLS-SEM is divided into two steps: the first is to get the estimation value of latent variable through iterations, while the second is to get the parameter estimation values of measurement model and structural model through linear regression by ordinary least square method [17]. The purpose of partial least square method is to minimize the error terms of measurement equation and structural equation.
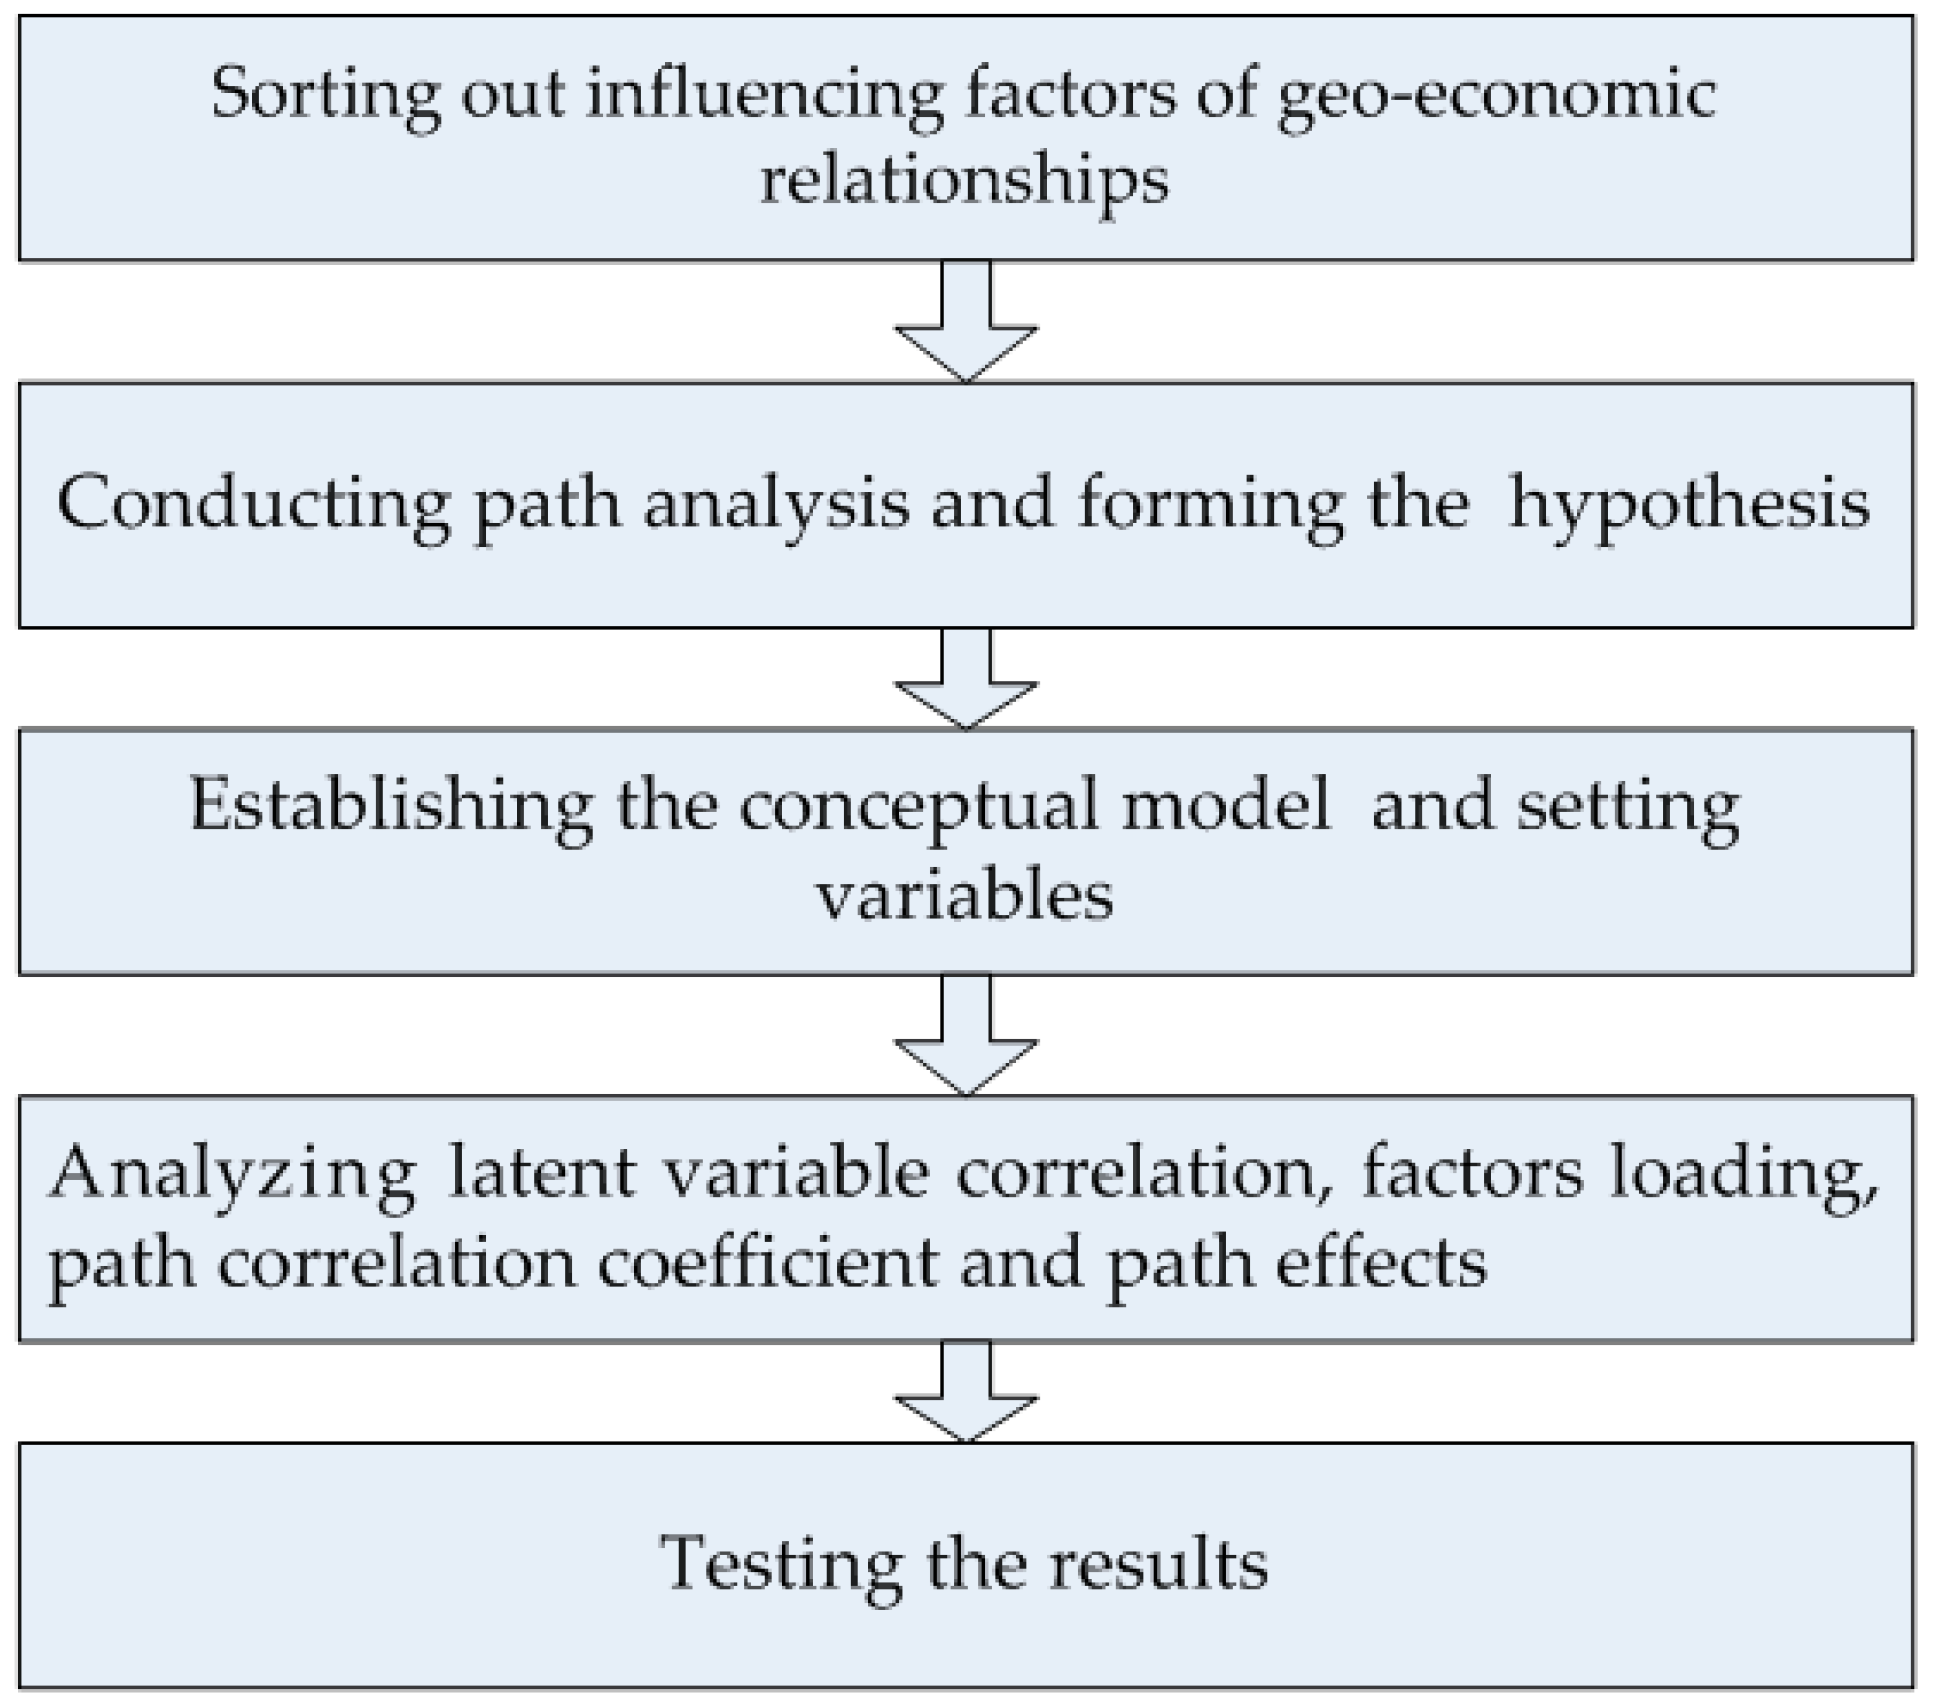
There are four steps to follow (Figure 1). First, we sort out influencing factors for geo-economic relationships. Second, we conduct path analysis and form the hypothesis. Third, we establish the conceptual model of path influence and set variables. Fourth, we analyze latent variable correlation, factors loading, path correlation coefficient and path effects by use of Smart-PLS3.0 software. Finally, we test these results.
2.2. Influencing Factors
Geo-economics is an interdisciplinary analysis covering geopolitical factors, economic intelligence, strategic analysis and foresight [18]. Similarly, the analysis of geo-economic relationships also involves many factors. There are many factors impacting geo-economic relationships between China and ASEAN countries, such as politics, diplomacy, strategy, economy, resources, society, ethnic group, culture, location, etc. To clearly outline these influencing factors, we classify them into four categories: geographical location (geo-location), economic factors, geopolitics and geo-culture from the perspective of internal and external causes. Among them, economic factors are the internal cause affecting the geo-economic relationships between China and ASEAN countries. Geo-location, geopolitics and geo-culture are the external causes.
2.2.1. Geographical Location
◆ Spatial proximity
Geographical proximity can facilitate geo-economic cooperation and generate spatial proximity effects [19] Tobler’s First Law of Geography states that “everything is related to everything else, but near things are more related than distant things”. Thus, the common development of border area can produce bilateral effect, reduce shielding effect, and strengthen intermediary effect [20]. Vietnam, Myanmar and Laos border China’s southwest. Border trade and economic exchanges have been done since ancient times.
◆ Economic channel
Geographically speaking, ASEAN countries are an essential intermediary for foreign exchange and cooperation of China’s economy. It is also an important economic channel for China’s imports and exports. China’s trades resources and products with Europe and Africa, such as natural resources, energy resources, mineral resources, agricultural products, machinery and electronic products, and nearly 80% of these trades need to pass through the Strait of Malacca. Therefore, the strategic location of ASEAN countries promotes geo-economic cooperation.
2.2.2. Economic Factors
◆ Differences in resource endowments
China and ASEAN countries have their own advantages in resource endowment. Due to differences in geographical location, topography, geological structure and climatic characteristics, China and ASEAN countries have different energy, mineral, animal, plant and agricultural resources. The difference in resources provides the basic condition for industry complementarity and bilateral geo-economic cooperation between China and ASEAN countries.
◆ Differences in economic level
Economic level is the scale, speed and degree of national economic development. It usually classifies three levels. The first level refers to developed countries with high degree of industrialization and mature market mechanism. The second level is known as emerging industrialized countries with fast industrial development. The third level refers to undeveloped countries dominated by agriculture. China maintains complementary geo-economic relationships with ASEAN countries belonging to the first level (Singapore and Brunei) and third level (Laos, Cambodia and Myanmar), while China has competitive geo-economic relationships with ASEAN countries belonging to the second level (Malaysia, Thailand, Indonesia and the Philippines) [10,21].
◆ Industrial structure
The level of economic development and industrial gradient are obvious differences between China and the new ASEAN countries (Vietnam, Laos, Myanmar and Cambodia), thus inter-industry trade plays a dominant role. Materials, capital, labor, technology and information flows between China and the new ASEAN countries are complementary. Thus, the demand for geo-economic cooperation is stronger. China, Malaysia, Indonesia, the Philippines and Thailand are industrial countries. Their main export products are mechanical and electrical, machinery and other manufacturing products. Therefore, intra-industry competition is more intense.
2.2.3. Geopolitics
Geoeconomics and geopolitics are closely linked [18]. They overlap, cogenerate and reinforce one another [22,23]. Sparke considered “the relationship between geopolitics and geoeconomics is dialectically entangled due to the geostrategic relays of the underlying tension between spatial fixity and spatial expansion at the heart of capitalist uneven development” [24,25]. Indeed, the interrelations between state power, economy and international trade has been considered throughout history [26]. Thus, some scholars regard geoeconomics as “strategic discourse” [6,27]. Likewise, the geo-economic relationships between China and ASEAN countries are intertwined with geopolitics.
◆ Intervention of great powers
As the ASEAN countries’ strategic position becomes increasingly important and economic development continues, the world’s major powers concerning the ASEAN market and regional leadership launch fierce competition, for instance, India’s strategy of “Look-East”, Japan’s strategy of “Arc of Freedom and Prosperity”, and United States’ strategy of return to Asia Pacific. In 1991, India formally put forward “Look-East Strategy” to expand India’s influence in the Asia Pacific region, which regarded ASEAN as a platform to develop relationships with mainland ASEAN countries. The implementation of this strategy achieved substantive breakthroughs. Cooperation has expanded from education, culture and tourism to trade, investment, military and non-traditional security. The economic and trade interaction between India and the mainland ASEAN countries have an invisible pressure on China. In 2006, Japan proposed to establish an arc of freedom and prosperity at the outer edge of Eurasia, supporting countries that have “the same values” with Japan. It actively implemented aid diplomacy in Cambodia, Laos and Vietnam. Japan’s multifaceted assistance behavior strengthened its diplomatic influence on mainland ASEAN countries and reduced the intimacy of China’s relationships with the ASEAN countries. In 2011, President Obama formally proposed “rebalancing strategy to the Asia-Pacific” at the informal summit meeting of APEC, aiming to enhance the political relationships with ASEAN countries. Vietnam and Philippines supported by the United States conflicted with China on the South China Sea, which negatively impacted on the normal bilateral economic and trade relations [28].
◆ ASEAN’s balance diplomacy
From the perspective of structural changes in international relations, bilateral relations between China and the United States are in a special intermediate state after the end of the Cold War, neither high trust nor worst state. There is security dilemma, but not very strong [29]. Accordingly, ASEAN countries adopt the Balance of Power strategy between China and the United States, maximizing national interest as a strategy to cope with the rise of China. It maintains the so-called “neutral” relations with China and the United States, which has a negative impact on the geo-economic relationships between China and ASEAN countries. In addition, to obtain development resources, some ASEAN countries (Thailand, Myanmar and Vietnam) sway around the big powers (the US, China, Japan and India). This increases the randomness and uncertainty of cooperation and weakens ASEAN countries’ economic dependence on China.
2.2.4. Geo-Culture
◆ Similarity of historical and cultural origins
Geo-economic development between China and ASEAN countries is closely related to their similar historical and cultural origins. They have common philosophical thoughts and ethics, cultural integration and historical homology. The southwestern provinces of China are located in the interior of mainland China and the Indo-Chinese Peninsula of ASEAN. In this area, ethnic relationships are close, and the customs are similar. Hence, similar consumption preferences are easy to form due to the similar cultural background. According to the theory of consumption preference, the greater the overlap of consumption preference, the more conducive to economic and trade development. China borders Burma, Laos and Cambodia. They have a long history of economic and trade relations with a profound historical basis.
◆ Close inter-ethnic relationship
ASEAN countries are home to the world’s largest and most concentrated overseas Chinese population. More than 73% of the world’s overseas Chinese live in ASEAN countries [30]. At the beginning of the 21st century, the number of overseas Chinese in Southeast Asia reached 25.26 million, accounting for 4.82% of the total population [31] (Table 2). Most overseas Chinese and Southwest Asian nationalities in China are from the same origin. They have a close affinity and similar customs and practices. These overseas Chinese play a vital role in geo-economic cooperation between China and ASEAN countries.
2.3. Path Analysis and Hypothesis
In this paper, we divide path effects of geo-economic relationships between China and ASEAN countries into direct effect and indirect effect (Table 3). Direct effect refers to the extent to which one variable acts on another without any intermediate variables, and indirect effect means the extent to which one variable acts on another by means of intermediate variables. We assume there are four direct paths: (1) geographical location influences geo-economic relationships; (2) economic factors influence geo-economic relationships; (3) geopolitics influences geo-economic relationships; and (4) geo-culture influences geo-economic relationships. Meanwhile, we assume there are six indirect paths: (1) geographical location influences geo-economic relationships through geo-culture; (2) geographical location influences geo-economic relationships through economic factors; (3) geographical location influences geo-economic relationships through geopolitics; (4) geopolitics influences geo-economic relationships through economic factors; (5) geo-culture influences geo-economic relationships through geopolitics; and (6) geo-culture influences geo-economic relationships through economic factors. Therefore, we propose the following hypotheses:
Hypothesis 1 (H1).
Geographic location has a significant influence on geo-economic relationships.
Hypothesis 2 (H2).
Geographic location has a significant influence on geo-culture.
Hypothesis 3 (H3).
Geographic location has a significant influence on geopolitics.
Hypothesis 4 (H4).
Geographic location has a significant influence on economic factors.
Hypothesis 5 (H5).
Economic factors have a significant influence on geo-economic relationships.
Hypothesis 6 (H6).
Geopolitics has a significant influence on geo-economic relationships.
Hypothesis 7 (H7).
Geopolitics has a significant influence on economic factors.
Hypothesis 8 (H8).
Geo-culture has a significant influence on geopolitics.
Hypothesis 9 (H9).
Geo-culture has a significant influence on economic factors.
Hypothesis 10 (H10).
Geo-culture has a significant influence on geo-economic relationships.
2.4. Conceptual Model and Variable Selection
2.4.1. Conceptual Model Construction
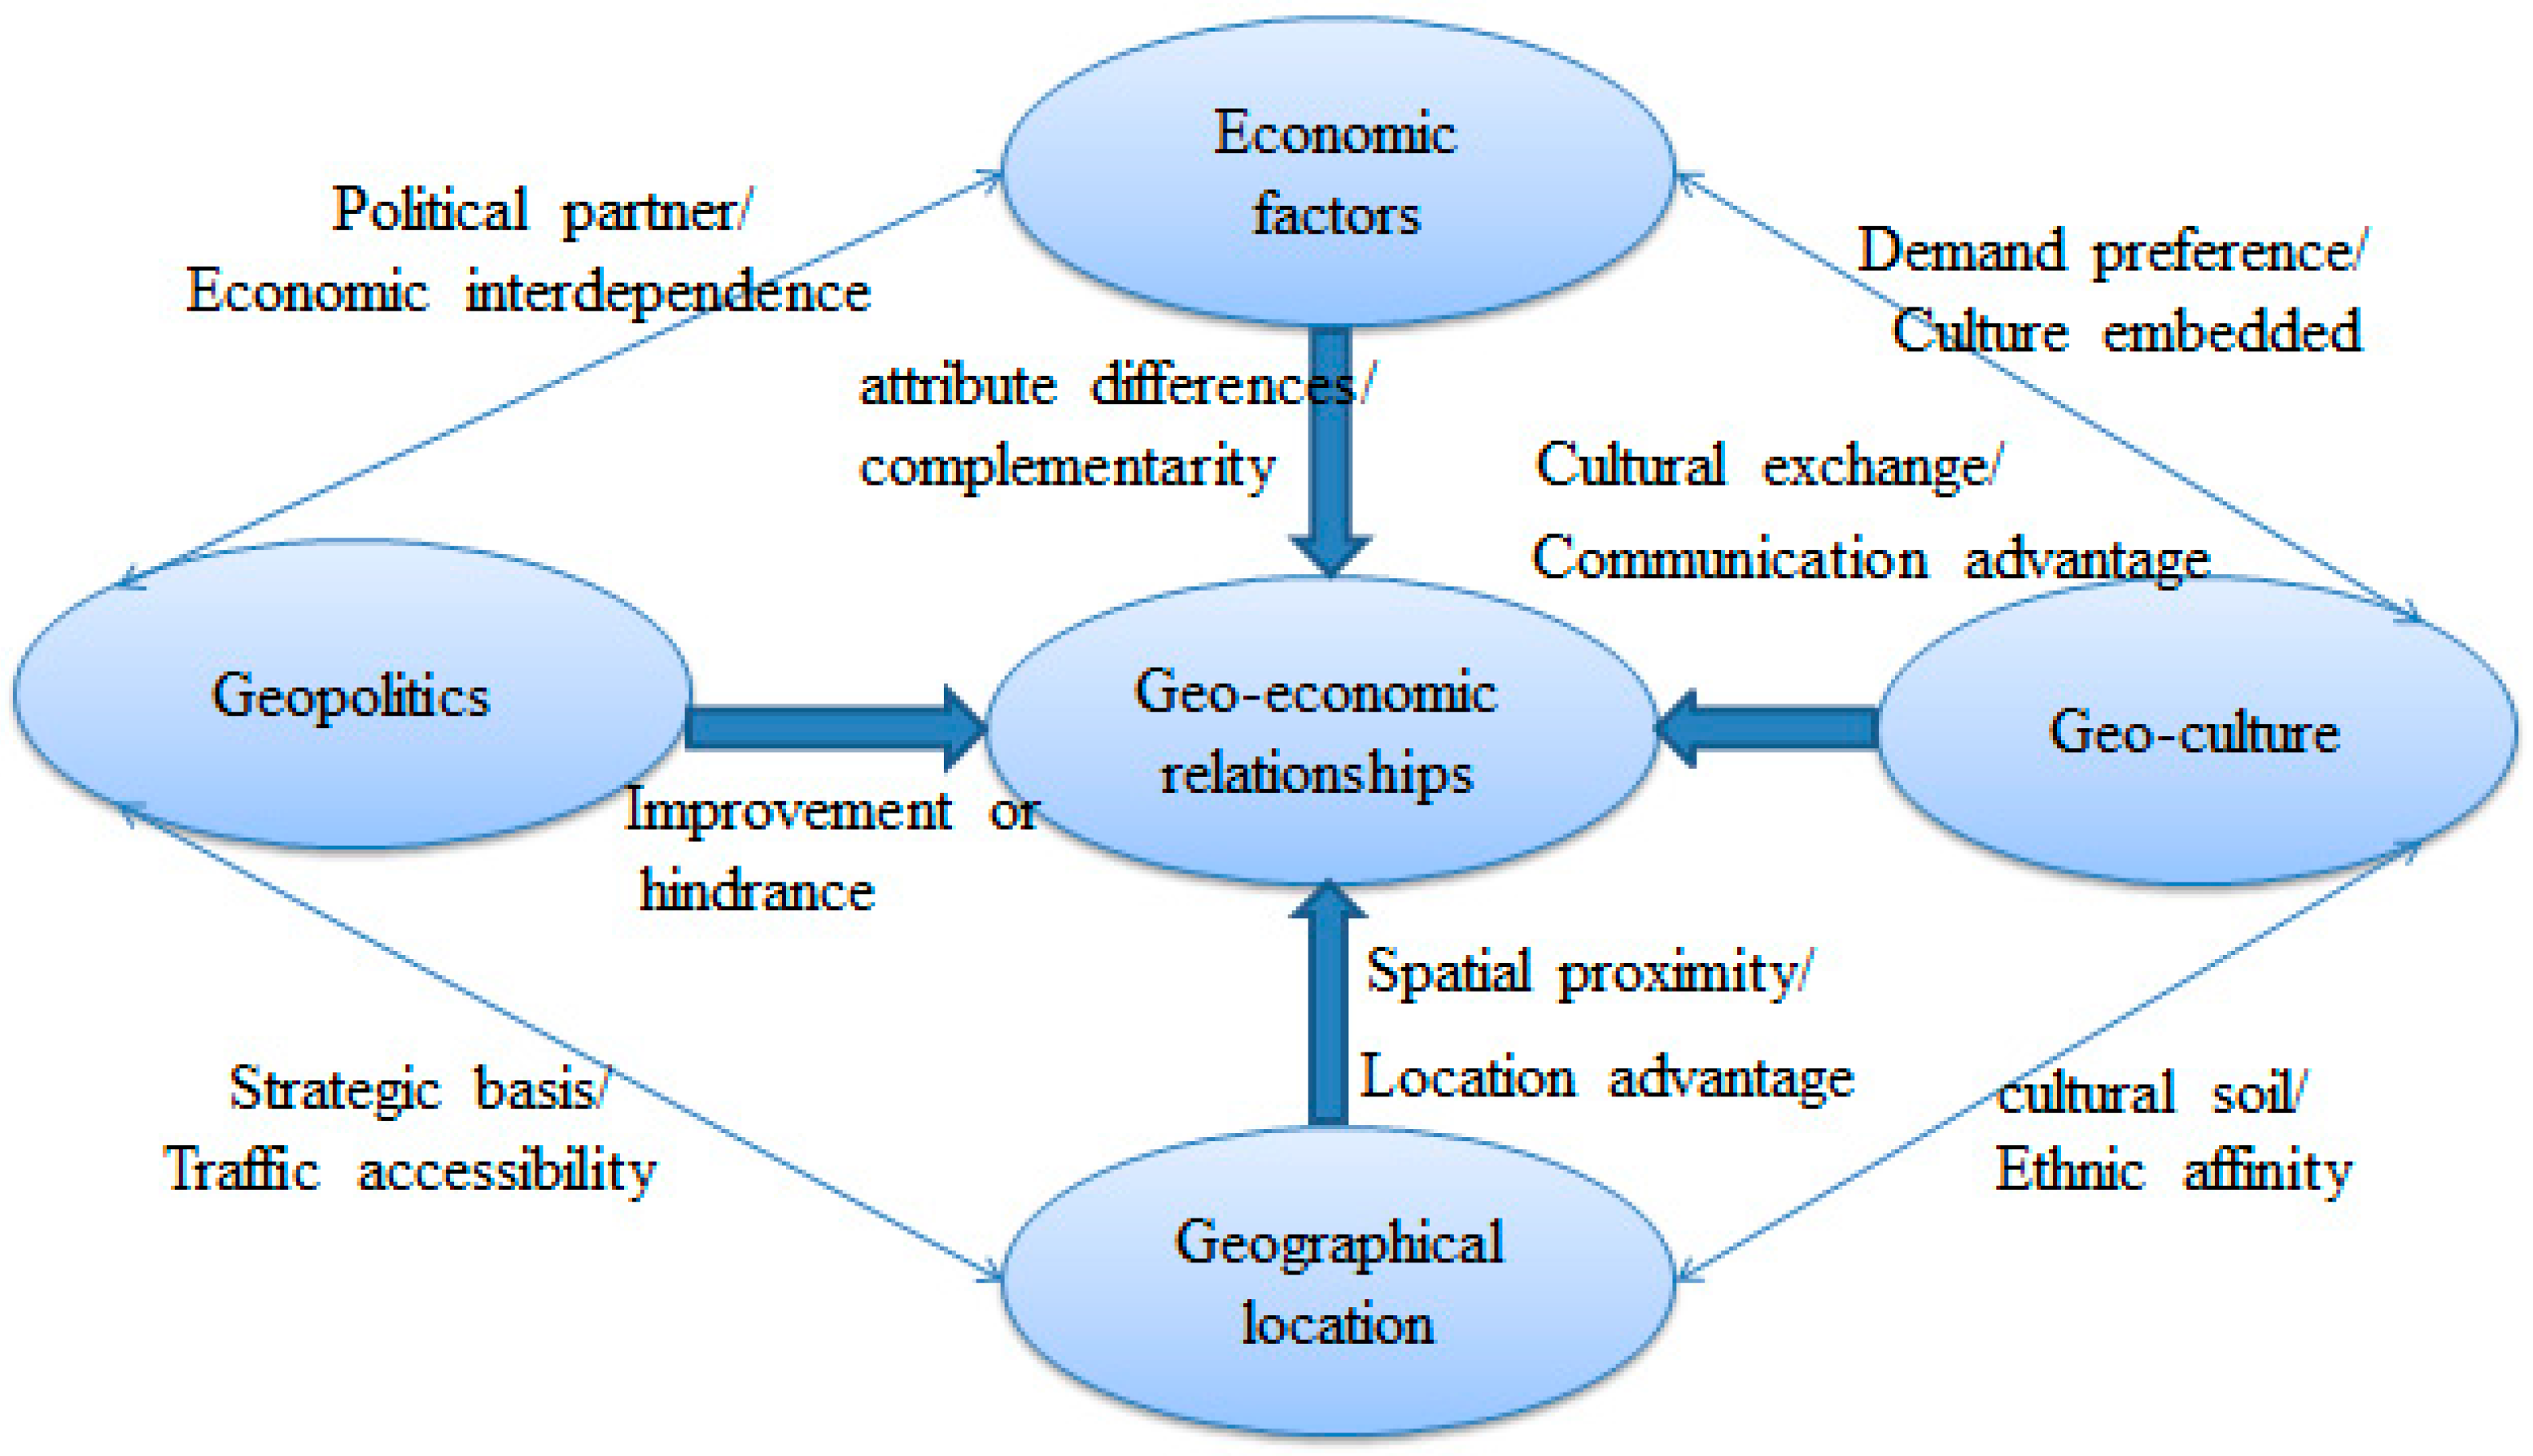
There are five latent variables in the geo-economic development system: geo-economic relationships, geographical location, economic factors, geopolitics and geo-culture. It is necessary to clarify the correlations among five variables to determine the overall analysis framework. Figure 2 clearly shows the logical relationships among five variables.
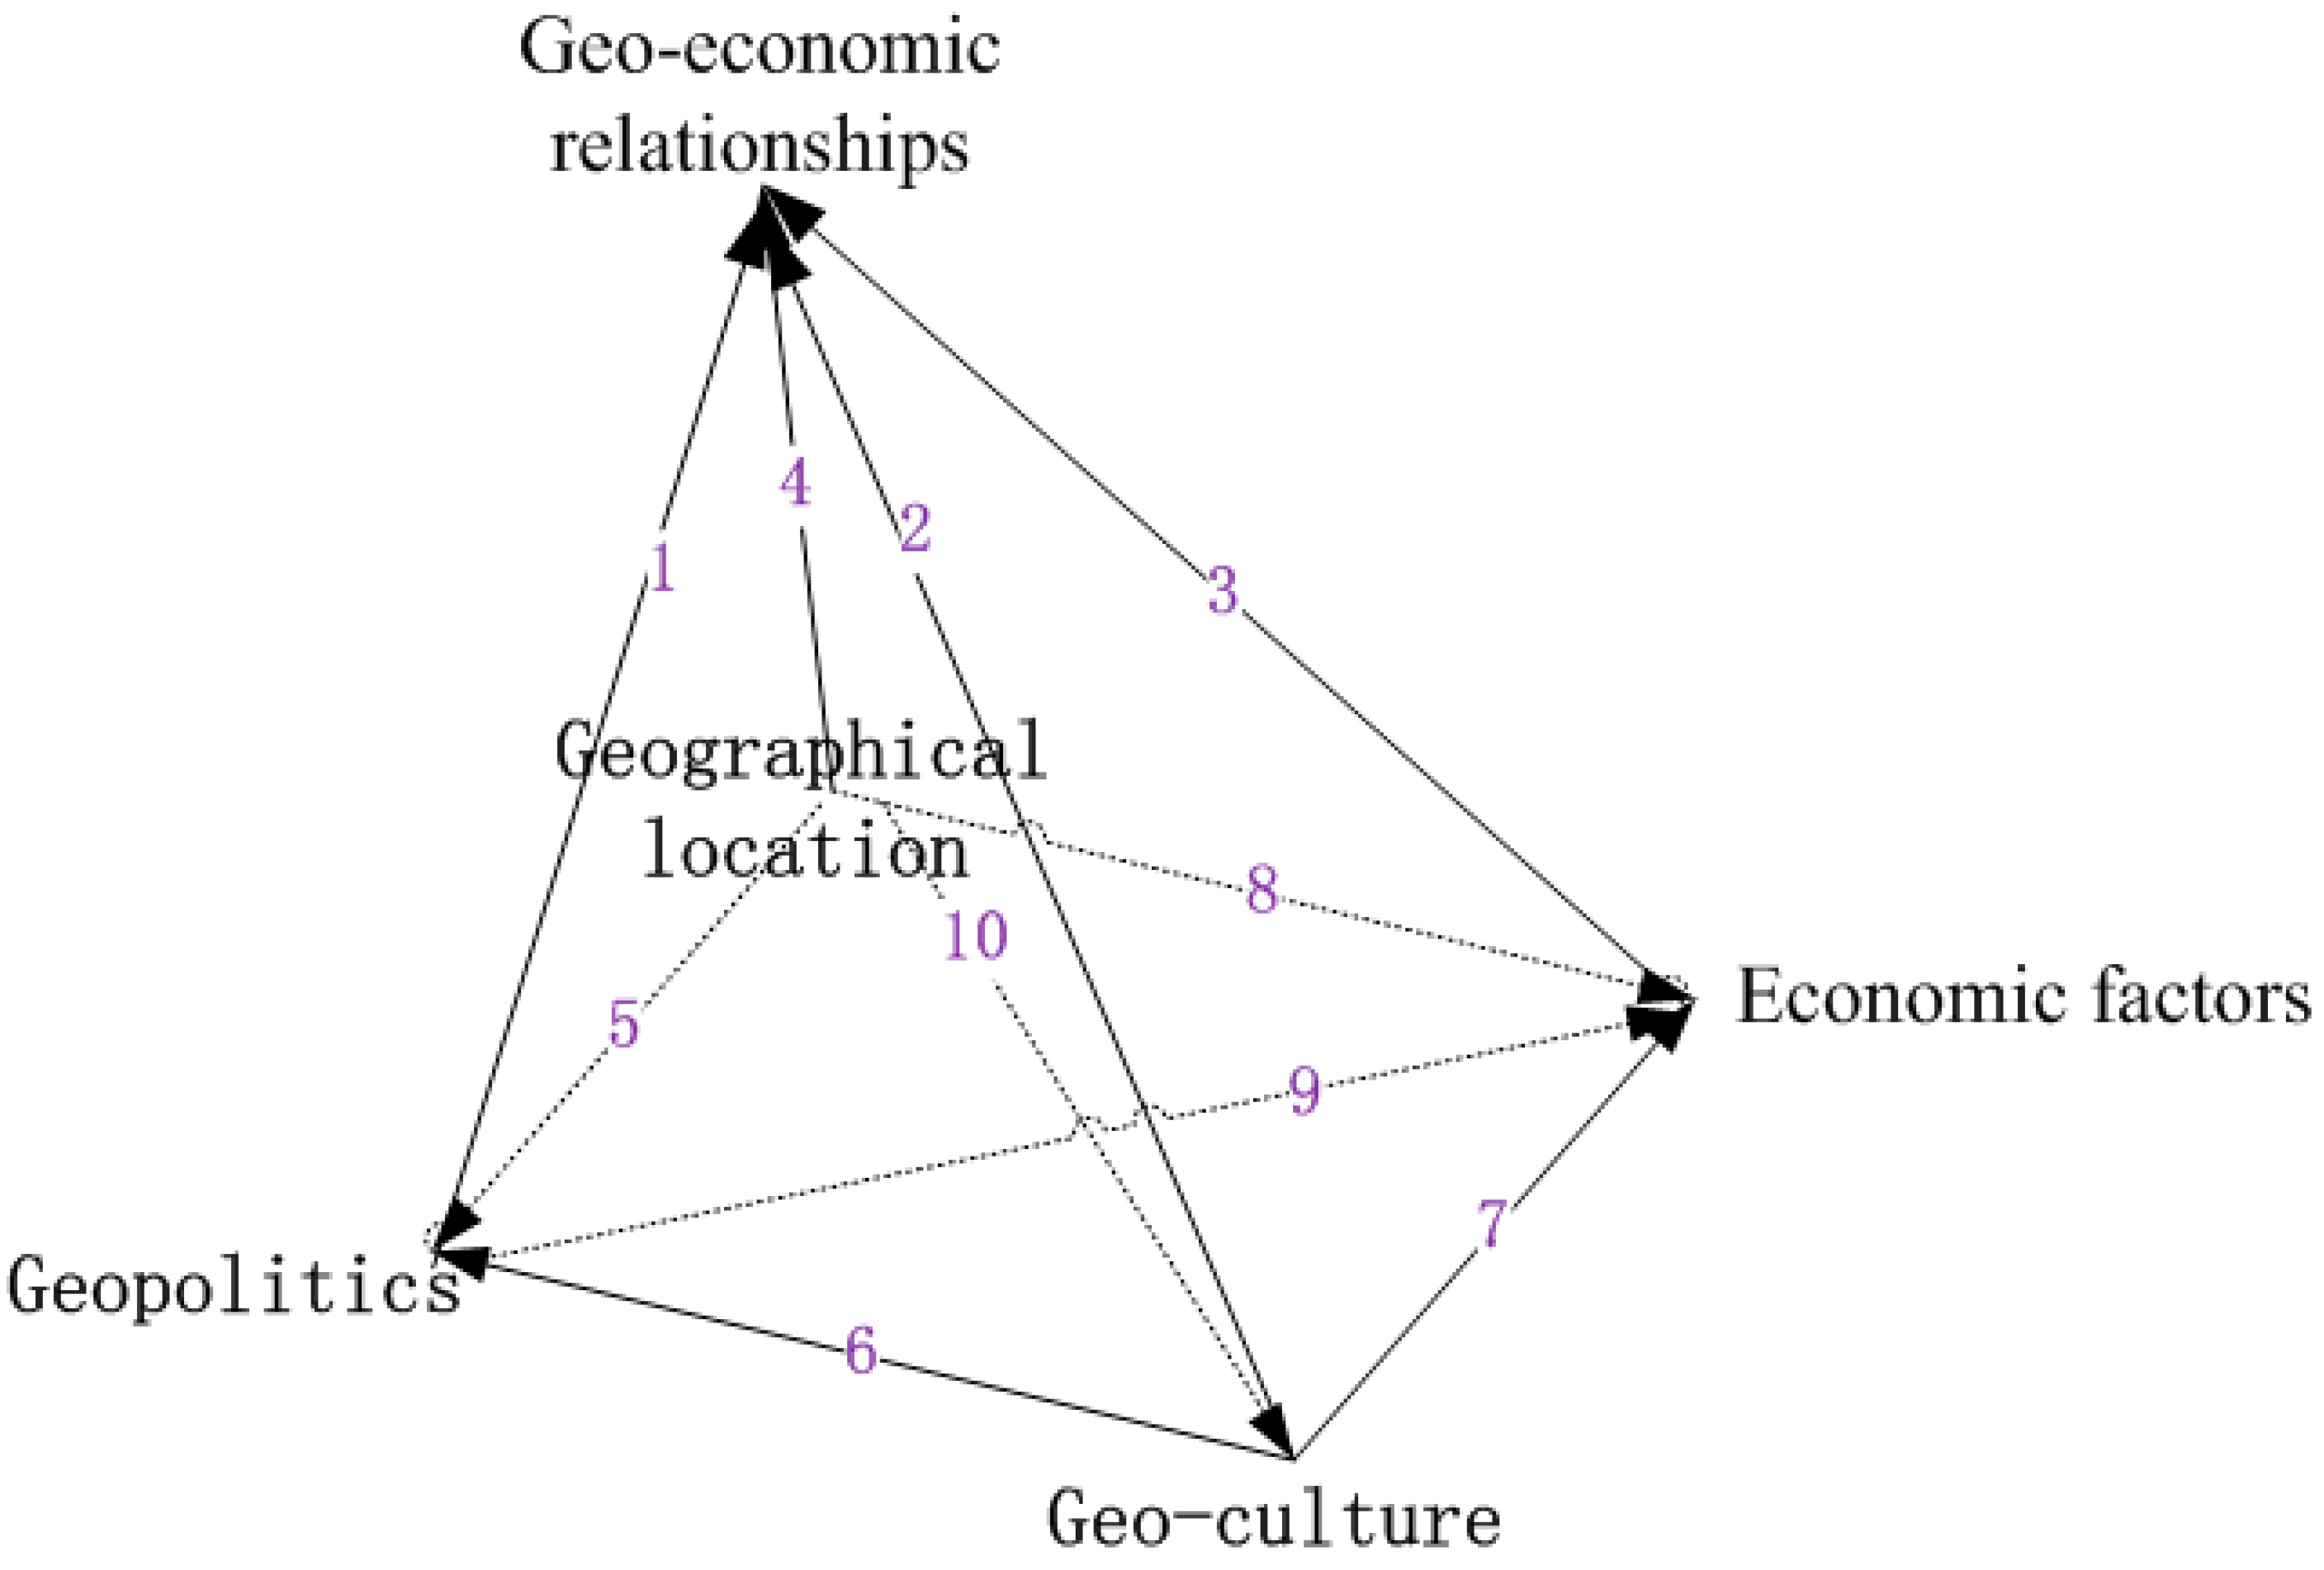
We assume the first-order influencing factors are geographic location, economic factors, geopolitics and geo-culture. The path model with the latent variable (LV) and manifest variable (MV) is designed. The whole model regards geo-economic relationships as a central latent variable, and other variables directly or indirectly act on it. We adopt the formative indicators to analyze influencing paths. In Figure 3, numbers from one to four indicate direct paths, and numbers from five to ten mean indirect paths.
2.4.2. Manifest Variable Selection
In this part, we select some representative and measurable manifest variables to reflect latent variables, because the above-mentioned qualitative influencing factors do not completely transfer into quantitative manifest variables. Therefore, in the structural equation modeling, geo-economic relationships between China and ASEAN countries is mainly expressed by import and export trade indicators, as well as FDI inflow and outflow indicators, which reflect logistics and capital flows and the degree of geo-economic cooperation between countries. Geographical location is reflected by indicators that demonstrate space proximity and traffic accessibility. We select border ports, major sea ports, international airports and port distance as the indicators. Taking into account the indicators that are measurable and reflect economic level differences, labor situation, market demand and economic interdependence, we select gross capital formation, total labor force, final consumption expenditure, per capita GDP and energy use as the manifest variables of economic factors. The selection of geopolitical manifest variables is from the perspective of promoting or impeding geo-economic relationships between China and ASEAN countries. We take high-level visits, economic or trade agreements and conflicts of sensitive incidents as indicators. The selection of geo-cultural manifest variables considers the similarity and kinship of history and culture, along with various cultural exchanges and educational activities. We select overseas Chinese, cultural activities and international students as the indicators (Table 4).
2.5. Data Resources
We collected data and events between China and ASEAN from 2005 to 2014. In the Table 4, import and export trade data are from the official website of the Ministry of Commerce of the People’s Republic of China. Inflow and outflow FDI data are from a statistical bulletin on China’s foreign direct investment and the China Statistical Yearbook. Data on border ports are from the General Administration of Customs of the People’s Republic of China. The data of major sea ports and international airports comes from the port almanac. Ports distances are calculated from the largest international airports between China and ASEAN countries, and data are from Great Circle Mapper [32]. Data concerning gross capital formation, total labor force, final consumption expenditure, per capita GDP and energy use come from The World Development Index in the World Bank database. Data about high-level visits, bilateral or regional economic and trade agreements and conflicts or sensitive incidents are from the Chinese Ministry of Foreign Affairs website and the ASEAN official website. The number of overseas Chinese comes from a database of overseas Chinese in Southeast Asia. Data about cultural exchange activities are from country reports on the People’s Republic of China Ministry of Foreign Affairs website. The number of international students is from the Foreign Student Education Administration in Chinese Society of Higher Education website.
3. Results and Test
3.1. Research Results
3.1.1. Latent Variables Correlation
The correlation coefficient is a statistical indicator used to reflect the degree of correlation between variables. The correlations among economic factors, geopolitics, geo-economic relationships, geopolitics and geographic location are higher, and values are between 0.83 and 0.95. Among them, the correlation coefficients between geo-economic relationships and economic factors, geo-culture, geopolitics and geographical location are 0.939, 0.892, 0.903 and 0.833, respectively (Table 5).
3.1.2. Factors Loading
Factors loading represent the correlation between manifest variables and latent variables, where the larger the value, the closer the relationship. As can be seen in Table 6, the correlation coefficients between manifest variables and latent variables are greater than 0.7. Most correlation coefficients are more than 0.9, indicating the selected manifest variables can effectively represent latent variables.
3.1.3. Path Coefficient
Path coefficient is the direct force of a variable acting on another variable when other variables are kept constant, indicating a causal relationship between two variables. The path coefficient of economic factors on geo-economic relationships is 0.467. The path coefficients of geo-culture on geo-economic relationships, economic factors and geopolitics are 0.235, 0.505 and 0.443, respectively. The path coefficients of geopolitics and geo-culture on economic factors are similar. The path coefficient of geographical location on geo-culture is the biggest, with a value of 0.736 (Table 7).
3.1.4. Path Effects
Path effect refers to the extent of one latent variable acting on another latent variable, including direct effect and indirect effect. The direct effects of economic factors, geopolitics, geopolitics and geographical location on geo-economic relationships were 0.778, 0.134, 0.234 and 0.137, respectively. Among them, the direct effect of economic factors on geo-economic relationships was the greatest. The direct effect of geopolitics on geo-economic relationships ranked second. Geo-culture and geographic location had similar path effects on geo-economic relationships, with values of 0.134 and 0.137. The indirect effects of geo-culture, geopolitics and geographical location on geo-economic relationships were 0.379, 0.411 and 0.594. Among them, the indirect effect of geographical location on geo-economic relationships was the largest. The indirect effects of geo-culture and geographical location on economic factors were similar, at 0.468 and 0.454. The total effects of economic factors, geopolitics, geo-culture and geographical location on geo-economic relationships were 0.778, 0.513, 0.645 and 0.731, respectively (Table 8).
3.2. Results Test
3.2.1. Reliability Test and Validity Evaluation of Measurement Model
After calculating the parameters of path model in SmartPLS software, the rationality of model needs to be evaluated. The evaluation of model mainly includes measurement model and structural model. The former includes the analysis of reliability and validity, and the latter mainly covers the analysis of path coefficient. The paper uses the Bootstrapping in SmartPLS software to examine the significance of estimated parameter.
(1) Reliability test
The measurement model is generally evaluated with reliability and validity. The reliability is expressed as a percentage of manifest variables explained by latent variables. In 1981, Fornell and Larker proposed an indicator (composite reliability of latent variable) to measure intra-model coherence [33]. When the combined reliability reaches or exceeds 0.5 (Table 9), the measurement tool is stable [34].
In model evaluation, if the ρ value of each latent variable is above 0.8, it indicates that manifest variables can explain 80% of the changes in latent variables. Meanwhile, it shows that the reliability is high, and it has a good consistency in the measurement model. Factor loading and reliability coefficients were calculated in SmartPLS3.0, and the results are shown in Table 10. The values of factor loading are all greater than 0.7, indicating that there is a sufficient linear relationship between manifest variables and latent variables, and satisfying the single-dimension condition of partial least squares method. In addition, the T values were above 1.96, and the p values were below 0.05, which indicated that the estimated parameters were significant.
(2) Validity evaluation
Validity evaluation of model needs to consider average variance extraction (AVE) and discriminant validity. The convergence validity test requires that the value of AVE is greater than 0.7. This indicates that one latent variable can explain more than 70% of the variance of manifest variables. Table 11 shows the AVE values of latent variables are beyond 0.7, and most of them exceed 0.8. This means the validity of the model is fairly good.
The validity evaluation of a model also requires that discriminant validity should be greater than 0.7. This indicates that the variance shared by this latent variable and manifest variable is greater than the one shared by other latent variables and manifest variables. As shown in Table 12, the coefficients of discriminant validity are greater than 0.8, indicating that discriminant validity is high.
3.2.2. Validity of Structural Models—R2
The validity evaluation of structural model should consider the multiple determination coefficient R2. The higher the R2 value, the stronger the explanatory power of the predictive variable to the dependent variable. R2 beyond 0.67 indicates strong explanatory power. R2 around 0.33 indicates moderate explanatory power. R2 about 0.19 suggests weak explanatory power. In this model, R2 values of economic factors, geopolitics, geographical location and geopolitics were 0.942, 0.877, 0.888 and 0.823, respectively (Table 13), indicating a strong explanatory power.
In the structural equation modeling, path coefficient and significance level are used to test whether a hypothesis holds or not. In the SmartPLS3.0 software, the significance of path coefficients was tested by use of the Bootstrapping method, and T values were used as test results. If the T value is greater than the t0.05(n − 1) value, the path coefficient is statistically significant [17]. Table 14 illustrates the result of hypothesis test. It shows all hypotheses are accepted.
4. Discussions
4.1. Influencing Paths
From the research results (Table 15), we can see that economic factors affect geo-economic relationships directly and clearly. Economic factors have a greatest influence on geo-economic relationships, with a total effect of 0.778, which means that geo-economic relationships will experience a 0.778% change when economic factors change by 1%, indicating they have a strong correlation and are closely related. As Michael Mandelbaum stated in his book, the aim of economics is wealth. Wealth is limitless, which makes economics a positive-sum game [35]. Therefore, we should give priority to economic factors in geo-economic relationships. Some measures to promote the rational allocation and optimization of economic factors should be taken, such as the free flow of elements, regional rational division of labor, economic structure optimization and industrial upgrading.
Geo-location acts on geo-economic relationships through direct and indirect ways via four paths. Indirect effects are far greater than direct effects, and the total effect is 0.731. In general, geo-location acts on geo-economic relationships through economic factors, geo-culture and geopolitics. Combined, they form a core-periphery or network geo-economic structure, generate close geo-economic relationships, play positive geo-economic functions, and facilitate geo-economic cooperation.
Geopolitics acts on geo-economic relationships directly and plays a role in geo-economic relationships through economic factors. Indirect effect is almost twice direct effect, and the total effect is 0.645. Geopolitics and geo-economics usually complement and promote each other. Geo-economics is the stabilizer for geopolitics. Economic cooperation and interdependence are the basis of political relationships. On the contrary, friendly relationships of politics also promote economic integration and improvement. The Chinese and ASEAN governments have signed a series of bilateral and regional agreements on economic development, which effectively facilitates geo-economic development.
Geo-culture acts on geo-economic relationships directly and indirectly, and the total effect is 0.513. The indirect effect (0.379) is nearly three times direct effect (0.134). This shows that geo-culture has a very significant mediating effect on geo-economic relationships. As an intermediary variable, geo-culture influences geo-economic relationships through geo-location, economic factors and geopolitics. Geo-culture follows such conductive path as “culture–idea–behavior–cooperation”, and it plays a transmissible role in geo-economic sustainable development. At the global level, geo-economic pattern based on overseas Chinese is an important feature in the global distribution of China’s geo-economics [36].
4.2. The Principle of Geo-Economic Spatial Interaction
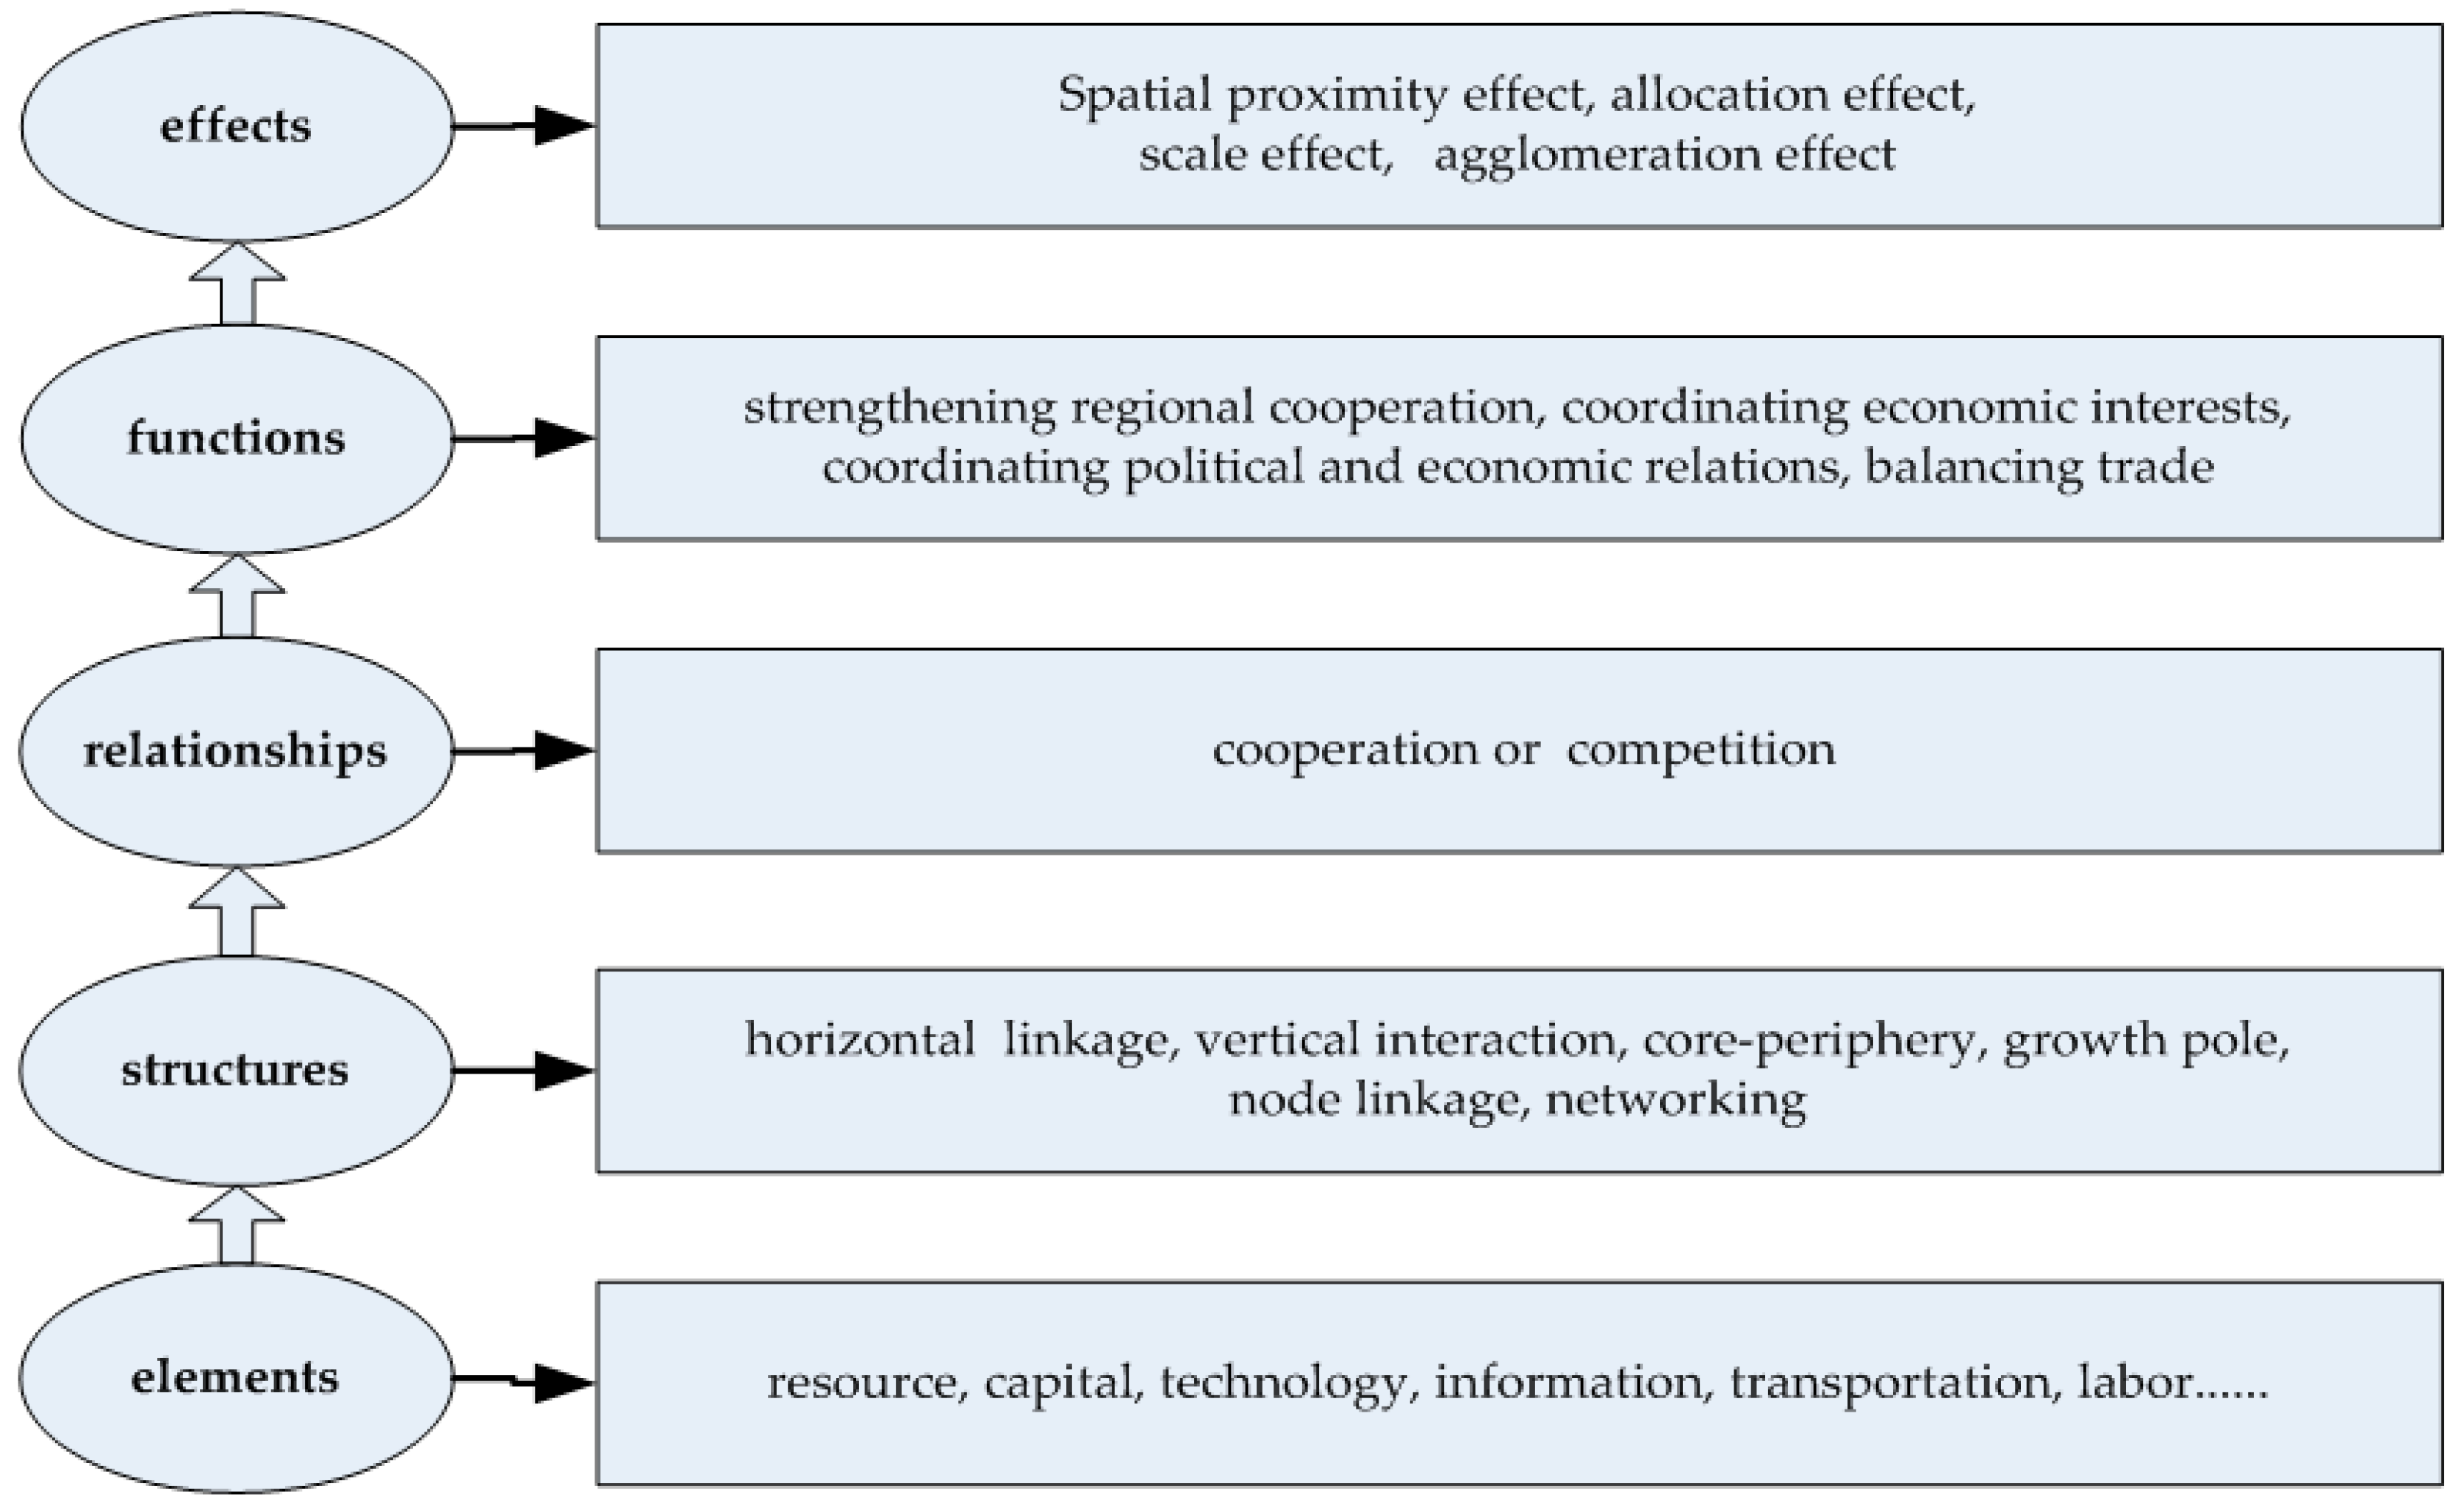
The results demonstrate that geo-location, geopolitics and geo-culture act on geo-economic relationships through direct and indirect ways, and indirect effect is far greater than direct effect. Why does this happen? We try to explain this phenomenon by the basic principle of spatial interaction in the field of geography, which is the process for “element–structure–relationship–function–effect”. It means influencing factors play their roles on geo-economic relationships more by progressive and indirect way (Figure 4).
Geo-economic elements. There are many types of geo-economic elements, which can be divided into resources, capital, labor, technology, information and services from the perspective of production input. Geo-economic elements are the prerequisites and determinants for the formation of geo-economic structure. The number and composition of elements determine the patterns of economic structure. It tends to form hub-network economic structure if there is strong complementarity between economic elements and rapid economic flow. On the contrary, it usually forms a scattered isolated economic structure.
Geo-economic structure. There are three characteristics of China–ASEAN geo-economic structure. First is the equality of economic entities. China and ASEAN countries are nodes in geo-economic structure. They are equal from a functional point of view. Second, China and ASEAN countries maintain horizontal linkage of inter-industries and vertical linkage of intra-industries. Third, the isomorphism of geo-economic factors and geographical environment has led to the evolution of China–ASEAN geo-economic structure from central type to network type [37]. It means that geo-economic cooperation will be gradually realized from node cities to the whole region.
Geo-economic relationships. Differences in geo-economic factors of countries or regions facilitate the formation of different geo-economic structures and thus reflect the geo-economic relationship: cooperation or competition. The similarity of natural resources, geographical environment and economic structure between countries produces the same demand for resources, capital, labor force, technology and market in economic development and facilitates the competition for economic development factors. Therefore, these countries usually form competitive geo-economic relationships. On the contrary, if there are differences in natural resources, geographical environment and economic structure, it tends to form complementary geo-economic relationships.
Geo-economic functions. The network development structure and the complementary relationships between China and some ASEAN countries suggests that the main geo-economic functions keep steady economic development and share economic interests, as well as coordinate political and economic relations. The detailed functions are to strengthen regional cooperation, promote sustainable and stable economic development, improve welfare level, balance foreign trade, increase employment, etc.
Geo-economic effects. There are four main geo-economic effects: spatial proximity effect, allocation effect of resources, scale effect and agglomeration effect. Proximity effect is formed because China and ASEAN countries are geographically adjacent. The allocation effect of resources is attributed to element and resource differences. The scale effect comes from the scale advantages of the China–ASEAN Free Trade Area. The agglomeration effect is due to the economies of scope formed by industrial clusters. These effects further promote geo-economic cooperation between China and ASEAN countries.
4.3. Driving Forces and Driving Mechanisms
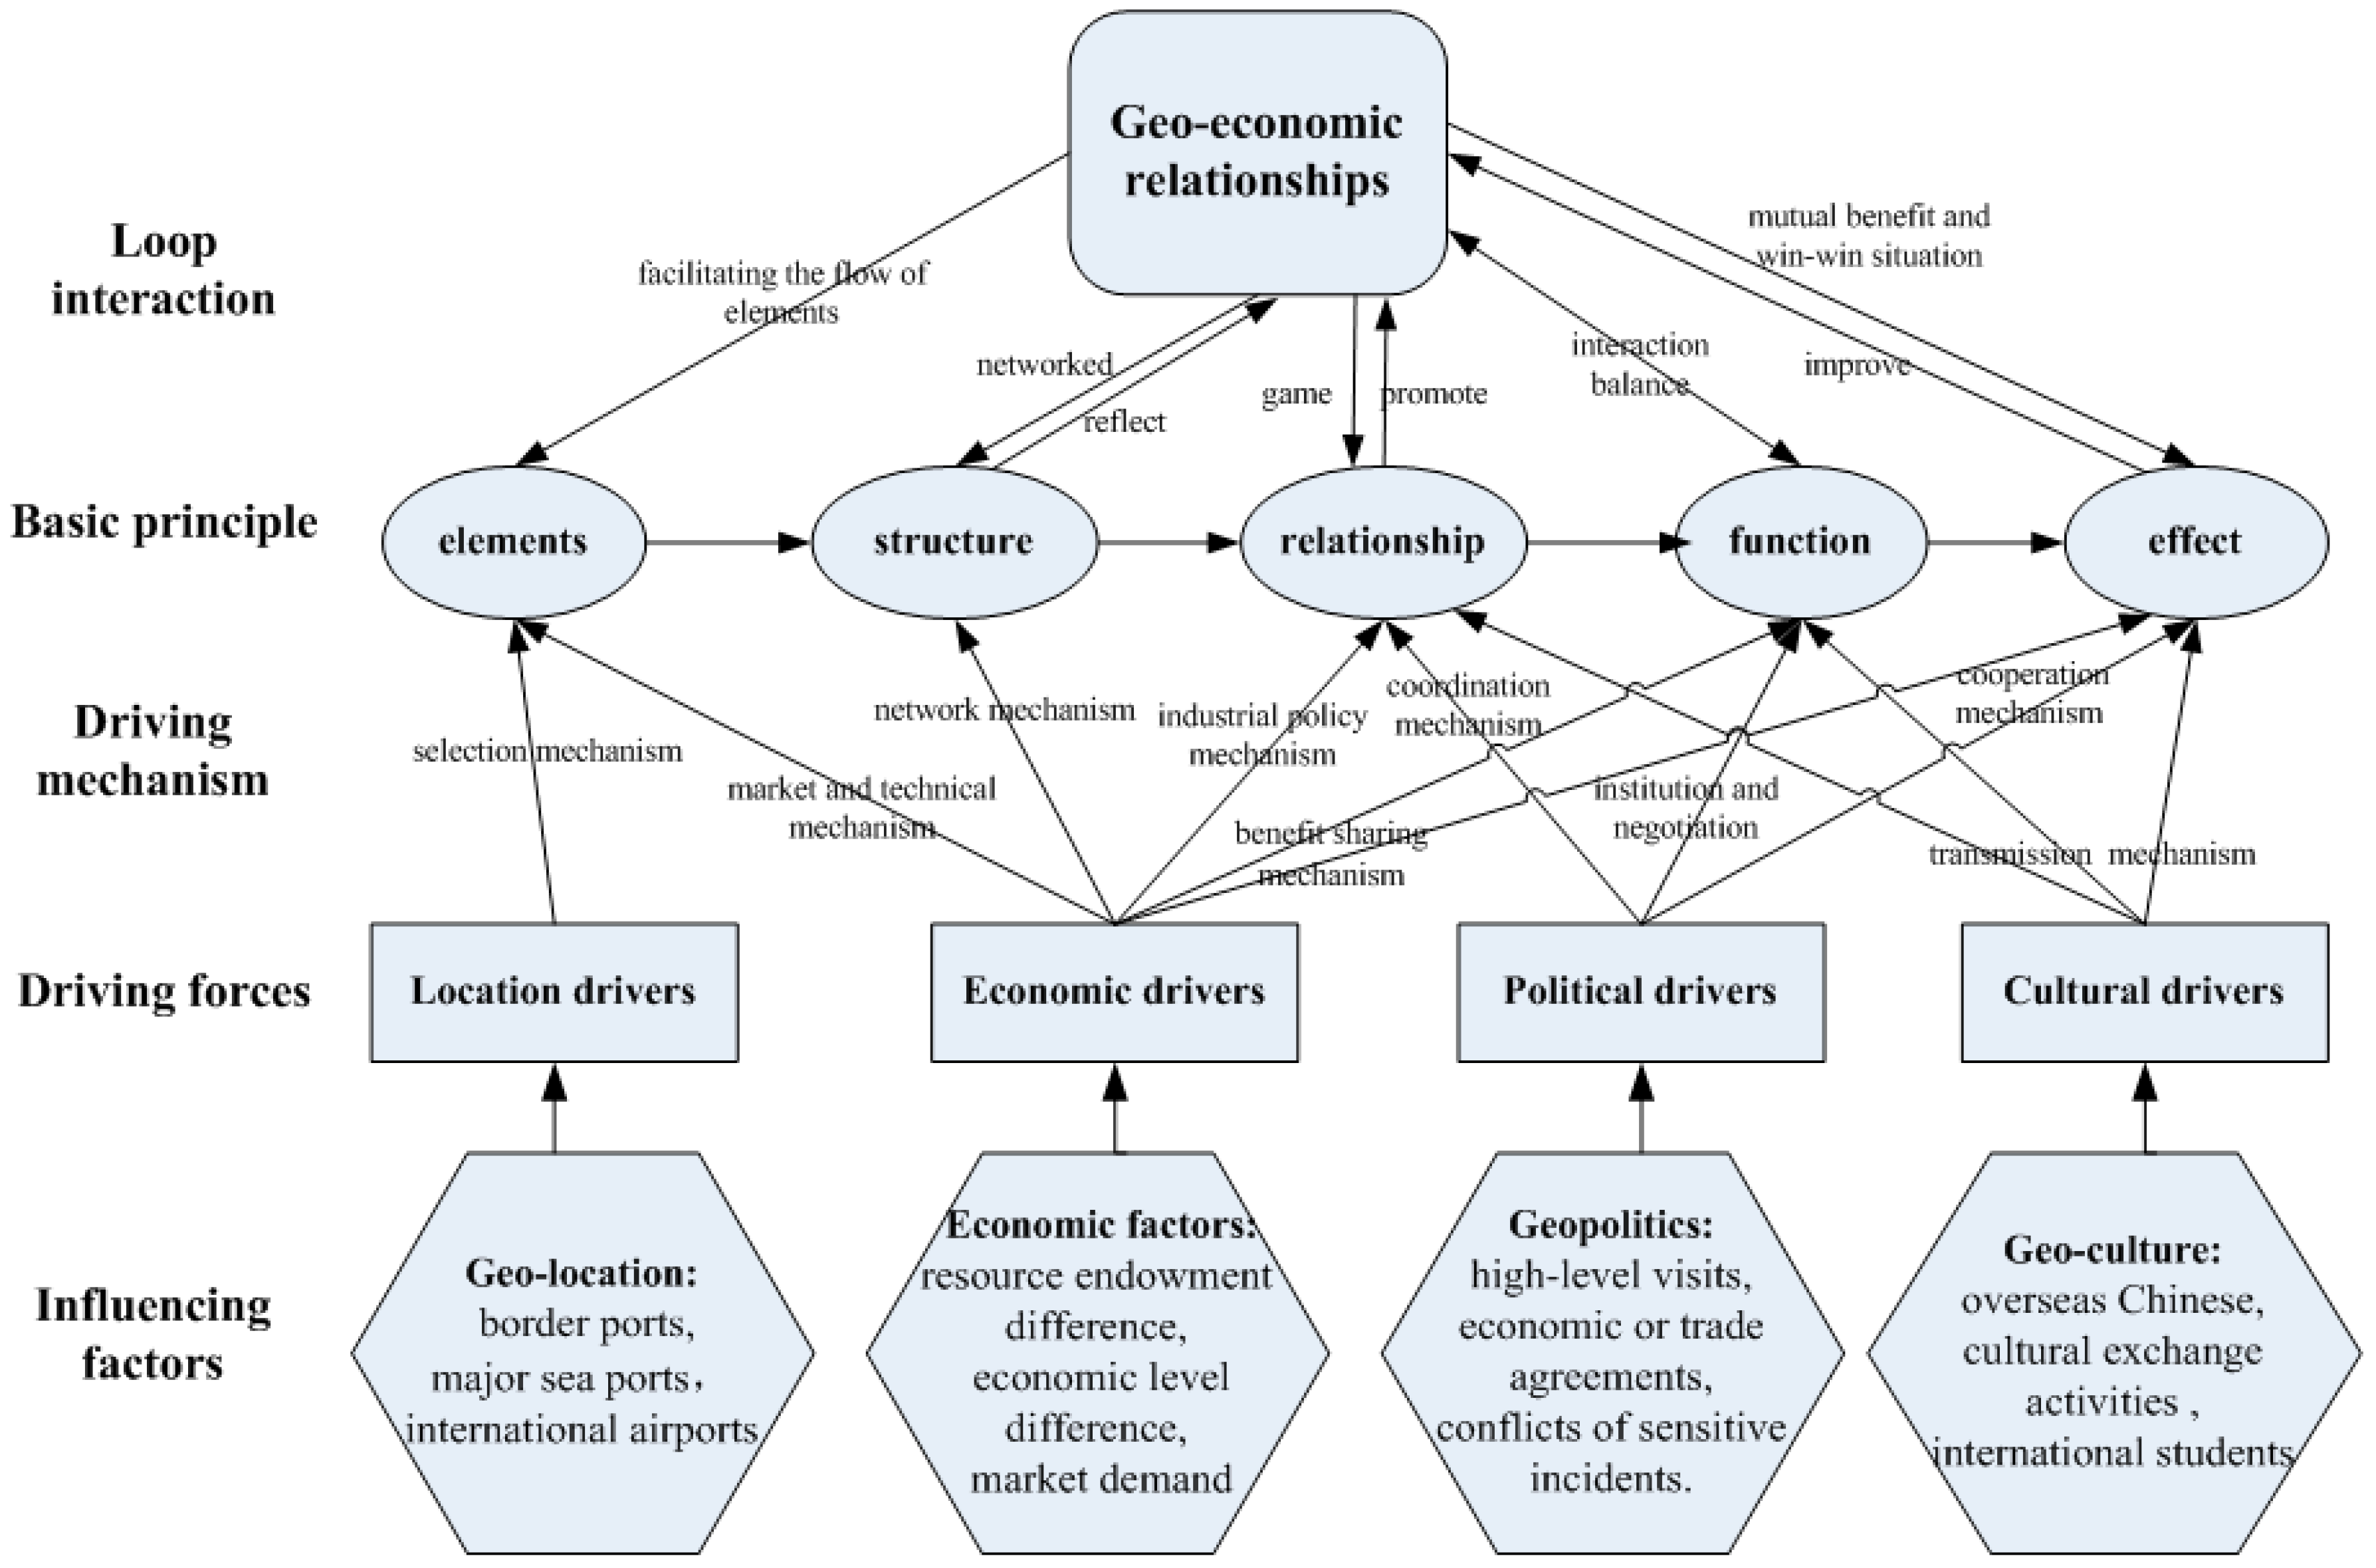
The driving forces for geo-economic relationships between China and ASEAN countries include endogenous forces and external forces. Economic driver is endogenous force, while political, cultural and location drivers are external forces. Driven by market, industrial policy, technical, network and benefit sharing mechanisms, economic drivers facilitate geo-economic relationships between China and ASEAN countries through such influencing factors as resource endowment difference, economic level difference, market demand and potential. Driven by cooperation, negotiation, coordination and institutional mechanisms, political drivers facilitate geo-economic relationships through such influencing factors as high-level visits, economic or trade agreements, and conflicts or sensitive incidents. Driven by transmission mechanism, cultural drivers facilitate geo-economic relationships through such influencing factors as overseas Chinese, cultural exchange activities and international students. Driven by selection mechanism, location drivers facilitate geo-economic relationships through such various economic channels as border ports, major sea ports and international airports. The location selections of border ports, seaports and airports not only have a direct impact on transportation costs and logistics time, but also affect economic prosperity and development in border areas (Figure 5).
In different developing stages of geo-economics, the leading driver mechanisms are not the same. In the initial stage, cooperation, negotiation, coordination, institutional and selection mechanisms play a leading role. In the medium stage, market, industrial policy and technical mechanisms have a dominant role. In the advanced stage, the coordination and network mechanisms act in a primary role.
5. Conclusions
This research was primarily motivated by the lack of attention on how influencing factors act on geo-economic relationships, which leads to blind competition of geo-economic actors and impedes the sustainable development of geo-economics between countries. Therefore, by use of structural equation modeling based on PLS, we explored the driving forces for geo-economic relationships between China and ASEAN countries. This paper draws the following two main conclusions.
Firstly, economic factors have the greatest impact on geo-economic relationships in a direct way. Geo-location, geopolitics and geo-culture act on geo-economic relationships through direct and indirect ways. The indirect effect is far greater than direct effect. Among them, geo-culture has a vital mediating effect on geo-economic relationships.
Secondly, driving forces for geo-economic relationships involve endogenous forces and external forces. Economic driver is endogenous force, while political, cultural and location drivers are external forces. Economic drivers improve geo-economic relationships through market, industrial policy, technical, network and benefit-sharing mechanisms. Political drivers facilitate geo-economic relationships through cooperation, negotiation, coordination and institutional mechanisms. Cultural drivers enhance geo-economic relationships through transmission mechanism. Location drivers advance geo-economic relationships through selection mechanism.
There are four main contributions and broader implications of this paper: First, it enriches the existing knowledge about geo-economics by revealing how influencing factors act on geo-economic relationships, including influencing path, path coefficient and path effects. It attributes to a better understanding of driving forces. Second, the approach is proved effective to explore the principal of geo-economic spatial interaction and has the potential to be used to discover the driving forces and mechanisms of geo-economic relationships in other regions. Third, culture as an important soft power and mediating variable requires more study in geo-economics, for instance, spillover effects of cultural networks on geo-economic development and the influence of geo-culture pattern based on overseas Chinese on geo-economics. Fourth, global open innovation as a new emerging driving force will play a further important role in future geo-economic development. It covers regional open innovation [38], complex innovation eco-systems [39], open sustainable innovation [40], global innovation network and territorial innovation system [41,42], globalization of collaborative R & D [43], etc. Open innovation can enhance networking innovative stakeholders and regional R&D activity [44], conquer the growth limits of capitalism [45], facilitate interconnections between countries and make progress in regional innovation policy and entrepreneurial eco-systems [46]. These benefits of open innovation have been recognized by China and ASEAN. Therefore, in August 2017, China–ASEAN (10 + 1) foreign ministers meeting identified 2018 as “China–ASEAN Innovation Year”. It will promote the mutual innovation-driven growth to improve the geo-economic relationships between China and ASEAN countries.
Acknowledgments
This work was supported by National Natural Science Foundation of China (No. 41701133, No. 61175066, No. 61379126); Henan Polytechnic University Doctoral Fund Project (No. SKB2017-01); Henan Polytechnic University Basic Research Fund (SKJYB2017-07); the Scholarship Program of China Scholarship Council (No. 201508410418); Major Project of National Social Science Fund (No. 16ZDA041); Program for Science & Technology Innovation Talents of Henan Province (No. 2017 JQ0008); National Natural Science Foundation of Henan Province (No. 162300410121); Key Scientific Research Project in Universities of Henan Province (No. 16A520012); Program for Science&Technology Innovation Talents in Universities of Henan Province (No. 2012HASTIT013).
Author Contributions
Yuejing Ge and Shufang Wang conceived and designed the experiments; Xiao Xue analyzed the data and performed the experiments; Shufang Wang drafted the manuscript; and Axing Zhu revised the whole paper.
Conflicts of Interest
The authors declare no conflict of interest.
References
- Yeh, E.T. Introduction: The geo-economics and geopolitics of Chinese development and investment in Asia. Eurasian Geogr. Econ. 2016, 57, 275–285. [Google Scholar] [CrossRef]
- Soong, J.J. The political economy of development between China and the ASEAN states: Opportunity and challenge. Chin. Econ. 2016, 49, 395–399. [Google Scholar] [CrossRef]
- Soong, J.J. The political economy of the GMS development between China and Southeast Asian countries: Geo-economy and strategy nexus. Chin. Econ. 2016, 49, 442–455. [Google Scholar] [CrossRef]
- Mattlin, M.; Wigell, M. Geoeconomics in the context of restive regional powers. Asia Eur. J. 2016, 14, 125–134. [Google Scholar] [CrossRef]
- Wigell, M. Conceptualizing regional powers’ geoeconomic strategies: Neo-imperialism, neo-mercantilism, hegemony, and liberal institutionalism. Asia Eur. J. 2016, 14, 135–151. [Google Scholar] [CrossRef]
- Blackwill, R.; Harris, J. War by Other Means: Geoeconomics and Statecraft; Harvard University Press: Cambridge, MA, USA, 2016. [Google Scholar]
- Youngs, R. Geo-Economic Futures. In Challenges for European Foreign Policy in 2012: What Kind of Geo-Economic Europe? Martiningui, A., Youngs, R., Eds.; FRIDE: Madrid, Spain, 2011. [Google Scholar]
- Scholvin, S.; Malamud, A. Is There a Geoeconomic Node in South America? Geography, Politics and Brazil’s Role in Regional Economic Integration; Working Papers; ICS: Lisbon, Portugal, 2014. [Google Scholar]
- Hurrell, A. Hegemony, liberalism and global order: What space for would-be great powers? Int. Aff. 2006, 82, 1–19. [Google Scholar] [CrossRef]
- Wang, S.F.; Zhu, A.X.; Ge, Y.j.; Liu, Y.L. The spatio-temporal evolution of geo-economic relationships between China and ASEAN Counties: Competition or cooperation? Sustainability 2017, 6, 1064. [Google Scholar] [CrossRef]
- Li, J.L.; Yao, D.M.; Xu, X.C. Regional economic integration of ASEAN-an empirical analysis based on national border effect. Econ. Theory Bus. Manag. 2012, 4, 102–112. [Google Scholar]
- Li, H. Border Economy—The Starting Point of China-ASEAN Regional Cooperation; Macau Scholar League Press: Macau, China, 2009. [Google Scholar]
- Cai, P.H. The pattern of competitive cooperation between the United States and China and China’s diplomacy. Int. Rev. 2013, 1, 9–16. [Google Scholar]
- Yang, H. The “Golden decade” of Chinese—ASEAN cultural exchange. Around Southeast Asia 2014, 4, 71–75. [Google Scholar]
- Ci, Y.B. China’s Cultural Strategy to Southeast Asia from the Perspective of Geo-Culture. Master’s Thesis, Lanzhou University, Lanzhou, China, 2009. [Google Scholar]
- Zhao, F.Q.; Zhang, L.; Chen, F. Research of measuring customer satisfaction degree based on PLS Path modeling. J. Beijing Inst. Technol. 2010, 12, 61–65. [Google Scholar]
- Shi, W.D.; Wei, X.X. The influence path from the culture industry in our country to the economic growth—Based on the PLS model validation. Econ. Manag. 2013, 35, 139–148. [Google Scholar]
- Csurgai, G. The increasing importance of geoeconomics in power rivalries in the twenty-first century. Geopolitics 2017. [Google Scholar] [CrossRef]
- Wu, D.T. Regional Economics; Science Press: Beijing, China, 2015. [Google Scholar]
- Fang, X.P.; Li, P.; Ding, S.B. Gradient structure and echelon development of border location value: A case study of borderland between China and ASEAN countries. Econ. Geogr. 2011, 31, 1409–1413. [Google Scholar]
- Ge, X.Q. Analysis on China-ASEAN Trade Effects of Investment-An Empirical Study Based on Product Data of Four Main Countries. Master’s Thesis, Ocean University of China, Qingdao, China, 2014. [Google Scholar]
- Vihma, A. Geoeconomics defined and redefined. Geopolitics 2017. [Google Scholar] [CrossRef]
- Sparke, M. On the overlaps of geopolitics, geoeconomics, and USAID. Dialogues Hum. Geogr. 2016, 6, 95–98. [Google Scholar] [CrossRef]
- Sparke, M. Globalizing capitalism and the dialectics of geopolitics and geoeconomics. Environ. Plan. 2017. [Google Scholar] [CrossRef]
- Sparke, M. Geoeconomics, globalization and the limits of economic strategy in statecraft: A response to vihma. Geopolitics 2017. [Google Scholar] [CrossRef]
- Laïdi, A. Histoire Mondidale de la Guerre Économique; Perrin: Paris, France, 2016. [Google Scholar]
- Morrissey, J. Geoeconomics in the long war. Antipode 2017, 49, 94–113. [Google Scholar] [CrossRef]
- Lu, G.S. Research on the Economic Relationships between China and Mainland Southeast Asian Countries; Social Science Academic Press: Beijing, China, 2014. [Google Scholar]
- Wang, Y.Z. Factors affecting China-ASEAN relationship and the developmental trend of bilateral relations between the two sides. Acad. Explor. 2010, 3, 37–44. [Google Scholar]
- Zhuang, G.T. The distribution and development trend of overseas Chinese. Overseas Chin. Stud. 2010, 155, 71. [Google Scholar]
- Wang, M. Spatial and Temporal Evolving Patterns of China’s Geo-Economics and Its Strategies. Master’s Thesis, Shandong Normal University, Jinan, China, 2014. [Google Scholar]
- Great Circle Mapper. Available online: http://www.gcmap.com (accessed on 25 December 2015).
- Fornell, C.; Larcker, D.F. Evaluating structural equation models with unobservable and measurement error: A comment. J. Market. Res. 1981, 18, 39–50. [Google Scholar] [CrossRef]
- Raines-Eudy, R. Using structural equation modeling to test for differential reliability and validity: An empirical demonstration. Struct. Equ. Model. 2000, 7, 124–141. [Google Scholar] [CrossRef]
- Mandelbaum, M. The Road to Global Prosperity; Simon and Schuster: New York, NY, USA, 2014. [Google Scholar]
- Yang, W.L.; Du, D.B.; Liu, C.L.; Ma, Y.H. Study on the spatial-temporal evolution and internal mechanism of geo-economic connections of China. Acta Geogr. Sin. 2016, 71, 956–969. [Google Scholar]
- Lian, J.W.; Wen, S.H.; Fang, J.Z. The spatial economic association of city agglomeration on CAFTA based on the perspective of social network analysis. Sci. Geogr. Sin. 2015, 35, 521–528. [Google Scholar]
- Schwerdtner, W.; Siebert, R.; Busse, M.; Freisinger, U. Regional open innovation roadmapping: A new framework for innovation-based regional development. Sustainability 2015, 7, 2301–2321. [Google Scholar] [CrossRef]
- Dougherty, D. Taking advantage of emergence for complex innovation eco-systems. J. Open Innov. 2017, 3, 14. [Google Scholar] [CrossRef]
- Cappa, F.; Sette, F.D.; Hayes, D.; Rosso, F. How to deliver open sustainable innovation: An integrated approach for a sustainable marketable product. Sustainability 2016, 8, 1341. [Google Scholar] [CrossRef]
- Cooke, P. Complex spaces: Global innovation networks & territorial innovation systems in information & communication technologies. J. Open Innov. 2017, 3, 9. [Google Scholar] [CrossRef]
- Yun, J.J.; Jeong, E.S.; Park, J.S. Network analysis of open innovation. Sustainability 2016, 8, 729. [Google Scholar] [CrossRef]
- Su, H. Global interdependence of collaborative R&D-typology and association of international co-patenting. Sustainability 2017, 9, 541. [Google Scholar] [CrossRef]
- Rothgang, M.; Cantner, U.; Dehio, J.; Engel, D.; Fertig, M.; Graf, H.; Hinzmann, S.; Linshalm, E.; Ploder, M.; Scholz, A.M.; et al. Cluster policy: Insights from the German leading edge cluster competition. J. Open Innov. 2017, 3, 18. [Google Scholar] [CrossRef]
- Yun, J.J. How do we conquer the growth limits of capitalism? Schumpeterian dynamics of open innovation. J. Open Innov. 2015, 1, 17. [Google Scholar] [CrossRef]
- Cooke, P. The virtues of variety in regional innovation systems and entrepreneurial ecosystems. J. Open Innov. 2016, 2, 13. [Google Scholar] [CrossRef]
Figure 1.
Process to explore how influencing factors act on geo-economic relationships.

Figure 2.
Logical relationships among the five latent variables.

Figure 3.
Path models of geo-economic relationships.

Figure 4.
The principle of spatial interaction.

Figure 5.
Driving factors and mechanism of geo-economic relationships.


Table 1.
The differences between AMOS and PLS.
| Items | AMOS | PLS |
|---|---|---|
| objective | Parameter estimation | Forecast |
| Operation method | Covariance | Variance |
| Latent variables | All manifest variables are used when latent variables are estimated | Latent variable is the linear combination of manifest variables. |
| Relationships between latent variables and manifest variables | It can only be used for reflective indicators | Both reflective and formative indicators can be used. |
| Inferences | Optimization of parameter estimation | Maximization of forecasting ability |
| Samples | 300–500 | 30–100 |
| Model identification | A latent variable requires more than three manifest variables | As long as it is an itinerant path |
| Parameter estimation | Standardization and non-standardization | Standardized estimated values |
| Saliency verification | All estimated parameters | Bootstrapping |
| Theoretical basis | Supporting verifying research with sufficient theoretical basis | Exploratory and explanatory research without sufficient theoretical basis |
Table 2.
The number of overseas Chinese in ASEAN countries in the early twenty-first Century.
| Country | Total Population (Ten Thousand People) | Number of Oversea Chinese (Ten Thousand People) | Proportion of Oversea Chinese (%) |
|---|---|---|---|
| Singapore | 326 | 251 | 76.99 |
| Malaysia | 2327 | 560 | 24.06 |
| Brunei | 34 | 5 | 14.71 |
| Thailand | 6194 | 664 | 10.72 |
| Indonesia | 21,260 | 697 | 3.28 |
| Laos | 510 | 16 | 3.14 |
| Cambodia | 1173 | 30 | 2.56 |
| Myanmar | 4900 | 100 | 2.04 |
| Philippines | 7840 | 103 | 1.30 |
| Vietnam | 7870 | 100 | 1.27 |
| Total | 52,434 | 2526 | 4.82 |
Table 3.
Influencing paths of geo-economic relationships.
| Influencing Factors | Type of Path | Influencing Paths |
|---|---|---|
| Geographical location | Direct effect | geographical location → geo-economic relationships |
| Indirect effect | geographical location → geo-culture → geo-economic relationships geographical location → geopolitics → geo-economic relationships geographical location → economic factor → geo-economic relationships | |
| Economic factors | Direct effect | economic factors → geo-economic relationships |
| Geopolitics | Direct effect | geopolitics → geo-economic relationships |
| Indirect effect | geopolitics → economic factor → geo-economic relationships | |
| Geo-culture | Direct effect | geo-culture → geo-economic relationships |
| Indirect effect | geo-culture → economic factors → geo-economic relationships geo-culture → geopolitics → geo-economic relationships |
Table 4.
Latent and manifest variables in structural equation modeling.
| Latent Variables | Variable Symbols | Manifest Variables | Indicator Codes |
|---|---|---|---|
| Geo-economic relationships | E | Export trade (million dollars) Import trade (million dollars) FDI outflow (million dollars) FDI inflow (million dollars) | E1 E2 E3 E4 |
| Geographical location | I1 | Border ports (unit) Major sea ports (unit) International airports (unit) Ports distance (km) | I1.1 I1.2 I1.3 I1.4 |
| Economic factors | I2 | Gross capital formation (dollars) Total labor force (person) Final consumption expenditure (dollars) Per capita GDP (dollars) Energy use (million tons) | I2.1 I2.2 I2.3 I2.4 I2.5 |
| Geopolitics | I3 | High-level visit (times) Economic or trade agreements (number) Conflicts of sensitive incidents (cases) | I3.1 I3.2 I3.3 |
| Geo-culture | I4 | Overseas Chinese (million people) Cultural exchange activities (times) International students (person) | I4.1 I4.2 I4.3 |
Table 5.
Correlation between latent variables.
| Latent Variables | Economic Factors | Geo-Culture | Geo-Economic Relationships | Geopolitics | Geographical Location |
|---|---|---|---|---|---|
| Economic factors | 1.000 | ||||
| Geo-culture | 0.946 | 1.000 | |||
| Geo-economic relationships | 0.939 | 0.892 | 1.000 | ||
| Geopolitics | 0.950 | 0.907 | 0.903 | 1.000 | |
| Geographical location | 0.914 | 0.936 | 0.833 | 0.910 | 1.000 |
Table 6.
Factors loading of manifest variables.
| Latent Variables | Geo-Economic Relationships | Geographical Location | Economic Factors | Geopolitics | Geo-Culture | |
|---|---|---|---|---|---|---|
| Manifest Variables | ||||||
| Export trade E1 | 0.977 | |||||
| Import trade E2 | 0.953 | |||||
| FDI outflow E3 | 0.960 | |||||
| FDI inflow E4 | 0.871 | |||||
| Border ports I1.1 | 0.956 | |||||
| Major sea ports I1.2 | 0.942 | |||||
| International airports I1.3 | 0.942 | |||||
| Ports distance I1.4 | 0.958 | |||||
| Gross capital formation I2.1 | 0.992 | |||||
| Total labor force I2.2 | 0.926 | |||||
| Final consumption expenditure I2.3 | 0.995 | |||||
| Per capita GDP I2.4 | 0.995 | |||||
| Energy use I2.5 | 0.715 | |||||
| High-level visit I3.1 | 0.918 | |||||
| Economic or trade agreements I3.2 | 0.881 | |||||
| Conflicts of sensitive incidents I3.3 | 0.732 | |||||
| Overseas Chinese I4.1 | 0.982 | |||||
| Cultural exchange activities I4.2 | 0.975 | |||||
| International students I4.3 | 0.995 | |||||
Table 7.
Path coefficient between latent variables.
| Latent Variables | Economic Factors | Geo-Culture | Geopolitics | Geo-Economic Relationships |
|---|---|---|---|---|
| Economic factors | - | - | - | 0.467 |
| Geo-culture | 0.505 | - | 0.443 | 0.235 |
| Geopolitics | 0.529 | - | - | 0.234 |
| Geographical location | 0.410 | 0.736 | 0.495 | 0.310 |
Table 8.
Path effects of latent variables.
| Latent Variables | Path Effects | Economic Factors | Geo-Culture | Geopolitics | Geographical Location | Geo-Economic Relationships |
|---|---|---|---|---|---|---|
| Economic factors | Direct effect | 1.000 | 0.272 | 0.529 | 0.159 | 0.778 |
| Indirect effect | 1.000 | 0.468 | - | 0.454 | - | |
| Total effect | 1.000 | 0.740 | 0.529 | 0.613 | 0.778 | |
| Geo-culture | Direct effect | 0.272 | 1.000 | 0.443 | 0.736 | 0.134 |
| Indirect effect | 0.468 | 1.000 | - | - | 0.379 | |
| Total effect | 0.740 | 1.000 | 0.443 | 0.736 | 0.513 | |
| Geopolitics | Direct effect | 0.529 | 0.443 | 1.000 | 0.195 | 0.234 |
| Indirect effect | - | - | 1.000 | 0.415 | 0.411 | |
| Total effect | 0.529 | 0.443 | 1.000 | 0.610 | 0.645 | |
| Geographical location | Direct effect | 0.159 | 0.736 | 0.195 | 1.000 | 0.137 |
| Indirect effect | 0.454 | - | 0.415 | 1.000 | 0.594 | |
| Total effect | 0.613 | 0.736 | 0.610 | 1.000 | 0.731 |
Table 9.
Reliability evaluation values.
| Composite Reliability Coefficient | Reliability |
|---|---|
| ρ ≥ 0.9 | Strongly reliable |
| 0.7 ≤ ρ < 0.9 | Pretty reliable |
| 0.5 ≤ ρ < 0.7 | Reliable (most common) |
| 0.4 ≤ ρ < 0.5 | Slightly reliable |
| 0.3 ≤ ρ < 0.4 | Weakly reliable |
| ρ < 0.3 | Not reliable |
Table 10.
Composite reliability coefficient and test.
| Latent Variables | Reliability Coefficient | Manifest Variables | Factor Load | T Value | p Test |
|---|---|---|---|---|---|
| Geo-economic relationships | 0.969 | Export trade E1 | 0.977 | 116.287 | 0.000 |
| Import trade E2 | 0.953 | 61.090 | 0.000 | ||
| FDI outflow E3 | 0.960 | 35.313 | 0.000 | ||
| FDI inflow E4 | 0.872 | 22.489 | 0.000 | ||
| Geographical location | 0.973 | Border ports I1.1 | 0.956 | 52.706 | 0.000 |
| Major sea ports I1.2 | 0.942 | 49.020 | 0.000 | ||
| International airports I1.3 | 0.942 | 50.581 | 0.000 | ||
| Ports distance I1.4 | 0.958 | 45.794 | 0.000 | ||
| Economic factors | 0.970 | Gross capital formation I2.1 | 0.992 | 502.147 | 0.000 |
| Total labor force I2.2 | 0.926 | 40.236 | 0.000 | ||
| Final consumption expenditure I2.3 | 0.995 | 396.598 | 0.000 | ||
| Per capita GDP I2.4 | 0.995 | 770.946 | 0.000 | ||
| Energy use I2.5 | 0.715 | 2.456 | 0.000 | ||
| Geopolitics | 0.883 | High-level visits I3.1 | 0.918 | 70.064 | 0.000 |
| Economic or trade agreements I3.2 | 0.881 | 19.887 | 0.000 | ||
| Conflicts of sensitive incidents I3.3 | 0.732 | 4.273 | 0.000 | ||
| Geo-culture | 0.989 | Overseas Chinese I4.1 | 0.982 | 170.556 | 0.000 |
| Cultural exchange activities I4.2 | 0.975 | 19.704 | 0.000 | ||
| International students I4.3 | 0.995 | 19.587 | 0.000 |
Table 11.
AVE values and test.
| Latent Variables | AVE Value | Average Value | Standard Deviation | T Value | p Test |
|---|---|---|---|---|---|
| Geo-economic relationships | 0.886 | 0.881 | 0.034 | 25.866 | 0.000 |
| Geographical location | 0.902 | 0.894 | 0.034 | 26.662 | 0.000 |
| Economic factors | 0.867 | 0.856 | 0.044 | 19.840 | 0.000 |
| Geopolitics | 0.718 | 0.705 | 0.071 | 10.052 | 0.000 |
| Geo-culture | 0.968 | 0.968 | 0.009 | 106.907 | 0.000 |
Table 12.
Discriminant validity of measure model.
| Latent Variables | Economic Factors | Geo-Culture | Geo-Economic Relationships | Geopolitics | Geographical Location |
|---|---|---|---|---|---|
| Economic factors | 0.931 | ||||
| Geo-culture | 0.946 | 0.984 | |||
| Geo-economic relationships | 0.939 | 0.892 | 0.941 | ||
| Geopolitics | 0.950 | 0.907 | 0.903 | 0.848 | |
| Geographical location | 0.914 | 0.936 | 0.833 | 0.950 | 0.941 |
Table 13.
R2 values and test.
| Latent Variables | R2 | Adjusted R2 | T Values | p Test |
|---|---|---|---|---|
| Economic factors | 0.942 | 0.941 | 54.295 | 0.000 |
| Geo-culture | 0.877 | 0.876 | 22.165 | 0.000 |
| Geographical location | 0.888 | 0.885 | 19.246 | 0.000 |
| Geopolitics | 0.823 | 0.821 | 19.405 | 0.000 |
Table 14.
Model hypothesis test.
| Hypothesis | Model Architecture | Path Coefficient | T Values | p Test | Test Result |
|---|---|---|---|---|---|
| H1 | Geo-location⇒Geo-economic relationships | 0.310 | 2.042 | 0.002 | accept |
| H2 | Geo-location⇒Geo-culture | 0.736 | 5.166 | 0.000 | accept |
| H3 | Geo-location⇒Geopolitics | 0.495 | 5.389 | 0.000 | accept |
| H4 | Geo-location⇒Economic factors | 0.410 | 4.433 | 0.005 | accept |
| H5 | Economic factors⇒Geo-economic relationships | 0.778 | 5.985 | 0.000 | accept |
| H6 | Geopolitics⇒Geo-economic relationships | 0.234 | 2.675 | 0.034 | accept |
| H7 | Geopolitics⇒Economic factors | 0.529 | 3.490 | 0.001 | accept |
| H8 | Geo-culture⇒Geopolitics | 0.443 | 4.638 | 0.000 | accept |
| H9 | Geo-culture⇒Economic factors | 0.505 | 4.965 | 0.000 | accept |
| H10 | Geo-culture⇒Geo-economic relationships | 0.235 | 2.863 | 0.000 | accept |
Table 15.
Influencing paths and effects.
| Structural Relationships between Variables | Influence | Number of Paths | Direct Effect | Indirect Effect | Total Effect |
|---|---|---|---|---|---|
| Geo-location⇒geo-economic relationships | Direct + Indirect | 1 + 3 | 0.137 | 0.594 | 0.731 |
| Economic factors⇒geo-economic relationships | Direct | 1 | 0.778 | 0 | 0.778 |
| Geopolitics⇒geo-economic relationships | Direct + Indirect | 1 + 1 | 0.234 | 0.411 | 0.645 |
| Geo-culture⇒geo-economic relationships | Direct + Indirect | 1 + 2 | 0.134 | 0.379 | 0.513 |
© 2017 by the authors. Licensee MDPI, Basel, Switzerland. This article is an open access article distributed under the terms and conditions of the Creative Commons Attribution (CC BY) license (http://creativecommons.org/licenses/by/4.0/).
Share and Cite
MDPI and ACS Style
Wang, S.; Xue, X.; Zhu, A.; Ge, Y. The Key Driving Forces for Geo-Economic Relationships between China and ASEAN Countries. Sustainability 2017, 9, 2363. https://0-doi-org.brum.beds.ac.uk/10.3390/su9122363
AMA Style
Wang S, Xue X, Zhu A, Ge Y. The Key Driving Forces for Geo-Economic Relationships between China and ASEAN Countries. Sustainability. 2017; 9(12):2363. https://0-doi-org.brum.beds.ac.uk/10.3390/su9122363
Chicago/Turabian StyleWang, Shufang, Xiao Xue, Axing Zhu, and Yuejing Ge. 2017. "The Key Driving Forces for Geo-Economic Relationships between China and ASEAN Countries" Sustainability 9, no. 12: 2363. https://0-doi-org.brum.beds.ac.uk/10.3390/su9122363
Note that from the first issue of 2016, this journal uses article numbers instead of page numbers. See further details here.